Article

Highly Graphitized Fe-N-C Electrocatalysts Prepared from Chitosan Hydrogel Frameworks

1
Department of Chemical Sciences, University of Padova, Via Marzolo 1, 35131 Padova, Italy
2
Department of Geoscience, University of Padova, Via Gradenigo 6, 35131 Padova, Italy
*
Author to whom correspondence should be addressed.
Submission received: 24 February 2021 / Revised: 14 March 2021 / Accepted: 16 March 2021 / Published: 19 March 2021
(This article belongs to the Special Issue Catalytic Properties of Nanostructured Electrodic Materials)

Abstract

:
The development of platinum group metal-free (PGM-free) electrocatalysts derived from cheap and environmentally friendly biomasses for oxygen reduction reaction (ORR) is a topic of relevant interest, particularly from the point of view of sustainability. Fe-nitrogen-doped carbon materials (Fe-N-C) have attracted particular interest as alternative to Pt-based materials, due to the high activity and selectivity of Fe-Nx active sites, the high availability and good tolerance to poisoning. Recently, many studies focused on developing synthetic strategies, which could transform N-containing biomasses into N-doped carbons. In this paper, chitosan was employed as a suitable N-containing biomass for preparing Fe-N-C catalyst in virtue of its high N content (7.1%) and unique chemical structure. Moreover, the major application of chitosan is based on its ability to strongly coordinate metal ions, a precondition for the formation of Fe-Nx active sites. The synthesis of Fe-N-C consists in a double step thermochemical conversion of a dried chitosan hydrogel. In acidic aqueous solution, the preparation of physical cross-linked hydrogel allows to obtain sophisticated organization, which assure an optimal mesoporosity before and after the pyrolysis. After the second thermal treatment at 900 °C, a highly graphitized material was obtained, which has been fully characterized in terms of textural, morphological and chemical properties. RRDE technique was used for understanding the activity and the selectivity of the material versus the ORR in 0.5 M H2SO4 electrolyte. Special attention was put in the determination of the active site density according to nitrite electrochemical reduction measurements. It was clearly established that the catalytic activity expressed as half wave potential linearly scales with the number of Fe-Nx sites. It was also established that the addition of the iron precursor after the first pyrolysis step leads to an increased activity due to both an increased number of active sites and of a hierarchical structure, which improves the access to active sites. At the same time, the increased graphitization degree, and a reduced density of pyrrolic nitrogen groups are helpful to increase the selectivity toward the 4e- ORR pathway.

Graphical Abstract

1. Introduction

The two main classes of materials that are currently explored for reaching the goal of expanding the market of fuel cells by addressing the goal of having an efficient and sustainable oxygen reduction reaction (ORR) at the cathodic electrode are low-content Pt or Platinum Group Metals (PGM)-free electrocatalysts [1]. The former group aims at producing highly active and durable (particle stability and poisoning resistance) electrocatalysts by reducing the Pt amount while maintaining its working life. Different approaches have been adopted, e.g., creation of Pt alloys with transition [2,3] or late earth metals [4,5,6,7] and/or by engineering of nanoparticles (NPs) size and shape [8,9], focusing also on the interaction with the support, usually undoped or heteroatom doped carbons [10,11,12]. The latter PGM-free route aims at finding materials with good activity and durability based on cheap and earth-abundant metals. Within the PGM-free group, the single site metal-nitrogen-doped carbon (M-N-C) materials have emerged as the most promising candidate due to the low cost and their performances, which are slowly approaching those of Pt-based materials [13,14,15,16,17], in particular in alkaline environment. Among all M-N-C materials, Fe-N-C has become the most studied and promising system due to the good activity and stability if compared with other metals like Co, Mn, or Zn [18]. However, the nature of the active sites in these catalysts is still under debate; in addition, the role of the support, of the doping precursors and of the synthesis condition in term of activity and type of sites formed still has to be fully rationalized [13,19]. In this context, the development of PGM-free electrocatalysts for ORR derived from cheap and highly available precursors is a topic of relevant interest, which could have a relevant impact on the future market of fuel cells [15,16], metal air batteries [20,21] and electrochemical sensors for O2 detection [22,23]. For these reasons, great effort has been and continues to be made exploring the use of cheap and abundant biomasses [24,25] as a feedstock to obtain new materials with improved activity [26], selectivity [27,28] and stability [29,30].
Hierarchical mesoporous carbons (MC) are the most interesting materials for application in electrocatalysis; in fact, while micropores favor the hosting of M-Nx active sites [31,32], mesopores play a pivotal role in conveying the reagents to the active sites. Without mesopores, a large part of physical surface area cannot be reached by reactants because the diffusion is hindered [33]. The size distribution and shape of pores are fundamental to tune and improve catalytic performance. Furthermore, the presence of different heteroatom functional groups embedded on a 3D hierarchical porous structure and the graphitization degree can induce higher catalytic performance and stability, respectively [34]. To control textural and porous structure of MCs, the use of inorganic templates (hard template approach) [10,35,36,37,38,39], or self-assembled nanostructure of organic molecules (soft template approach) [40,41] can be exploited. In the latter method, the chemical interactions between the template and the carbon precursor determine the success of the templating. These two methods have demonstrated to be the most successful for the synthesis of a well-ordered and uniform pore structure. A third way is the self-templating approach where specific etching molecules, e.g., CO2, CO, SO2, NH3, or particles, e.g., metal, metal oxides or carbides, are generated in situ and are able to induce the formation of micropores [10] or mesopores [42].
In the last years, the conversion of biomasses [25,43,44,45,46,47,48,49,50] or waste polymers [42] into activated carbon has become a promising approach for the synthesis of self-templating M-N-C catalysts. In this paper, we present the synthesis and characterization of Fe-Nx doped MCs by thermochemical conversion of a preconditioned hydrogel, prepared from a refined biomass, i.e., chitosan, without the use of any additional template or carbon black support. Chitosan is a polysaccharide obtained from the deacetylation of chitin which is easily extracted from shrimp’s shell [51]. Chitosan is biocompatible and was proved to be a useful material in a wide range of fields, such as food industry, water treatment [52], tissue engineering, medical area [53], supercapacitor [54], CO2 hydrogenation [55], reduction of nitro compounds [56], batteries [57,58] and fuel cell devices [30,59,60]. Furthermore, chitosan is a suitable N-containing biopolymeric material with a high N content (7.1%) and jellifies by producing a self-template hydrogel precursor. The hydrogel reduces the aggregation ensuring an effectively homogenous heteroatom doping, while its 3D porous architecture can be preserved or even improved in the final catalyst. The chitosan-derived MC was employed as platform for the pinning of Fe-Nx sites and the final electrocatalysts’ performance for ORR was rationalized according to the textural and physico-chemical properties of the Fe-N-C materials.

2. Results and Discussion

The synthesis of chitosan-derived Fe-N-C catalysts is based on the preliminary gelation of chitosan followed by the synthetic protocol explained in detail in the paragraph 3.1 and sketched in Scheme 1. Chitosan is the main source of carbon and nitrogen, 1,10 phenanthroline is used as an auxiliary nitrogen source, whereas FeCl2, FeCl3 or tris(1,10-phenanthroline)iron(II)-chloride (Fe(Phen)3Cl2) were employed as alternative iron precursors for the Fe-Nx formation. The different precursors were mixed with chitosan or chitosan-derived carbon at different stage during the preparation. Different final materials were obtained which are labeled as Fe-N-Cn (n = 1–5). For the sake of clarity all the conditions employed for the preparation of the different Fe-N-Cn materials are resumed in Table 1.

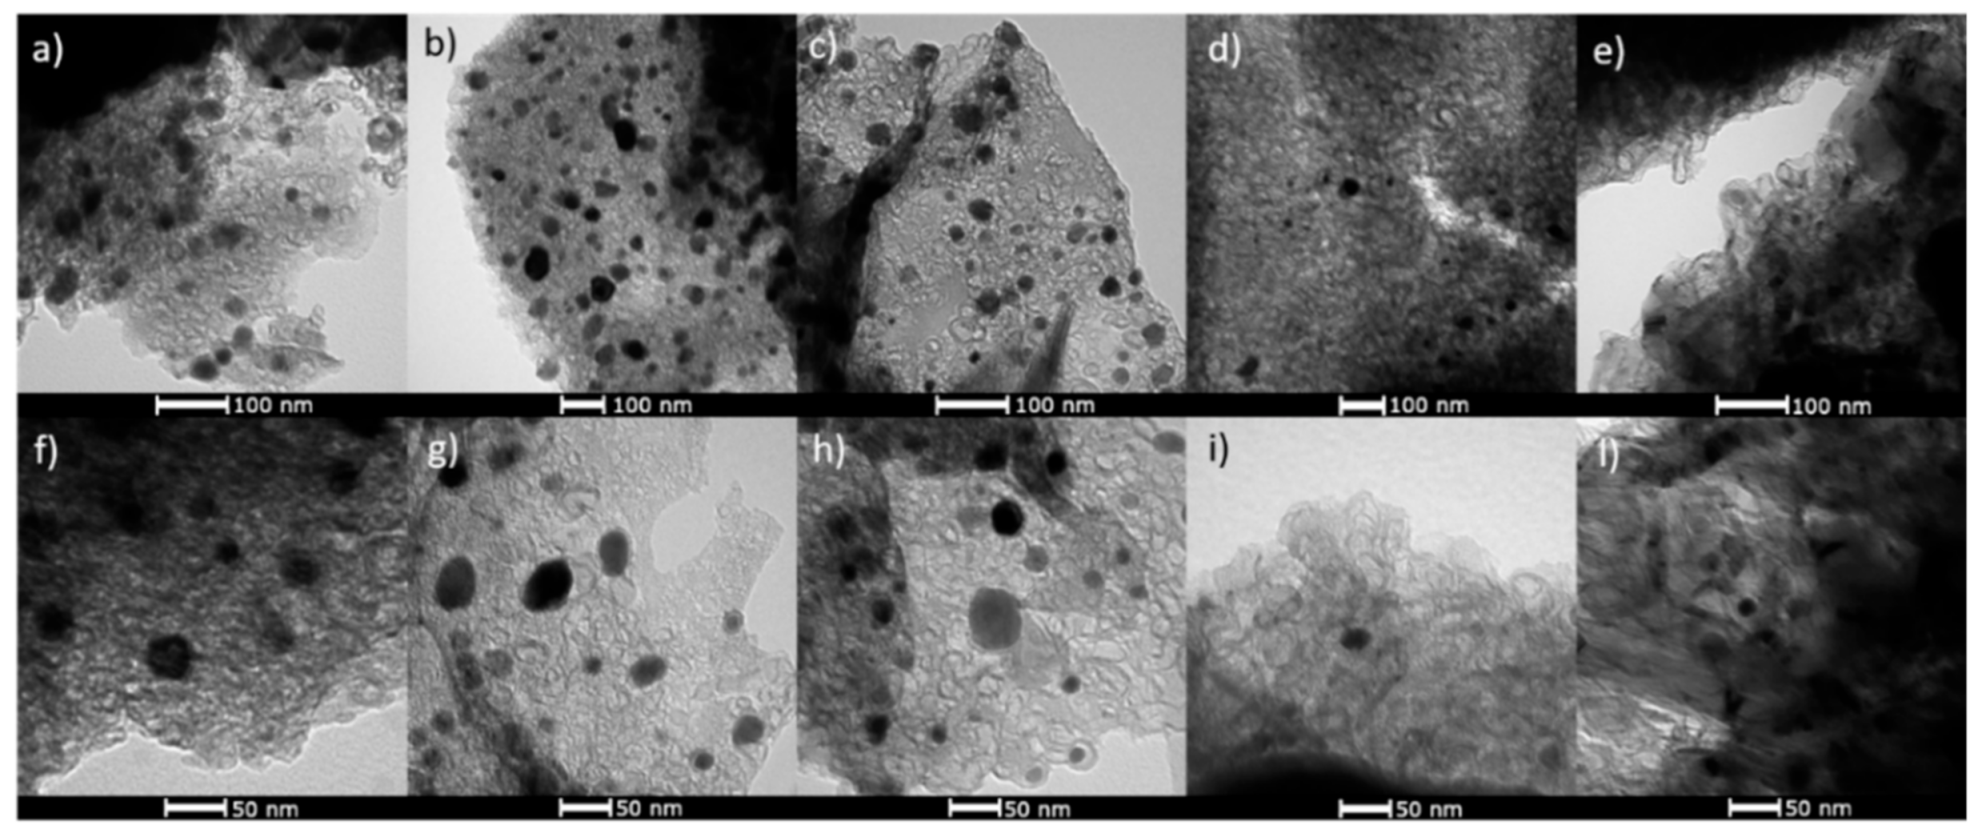
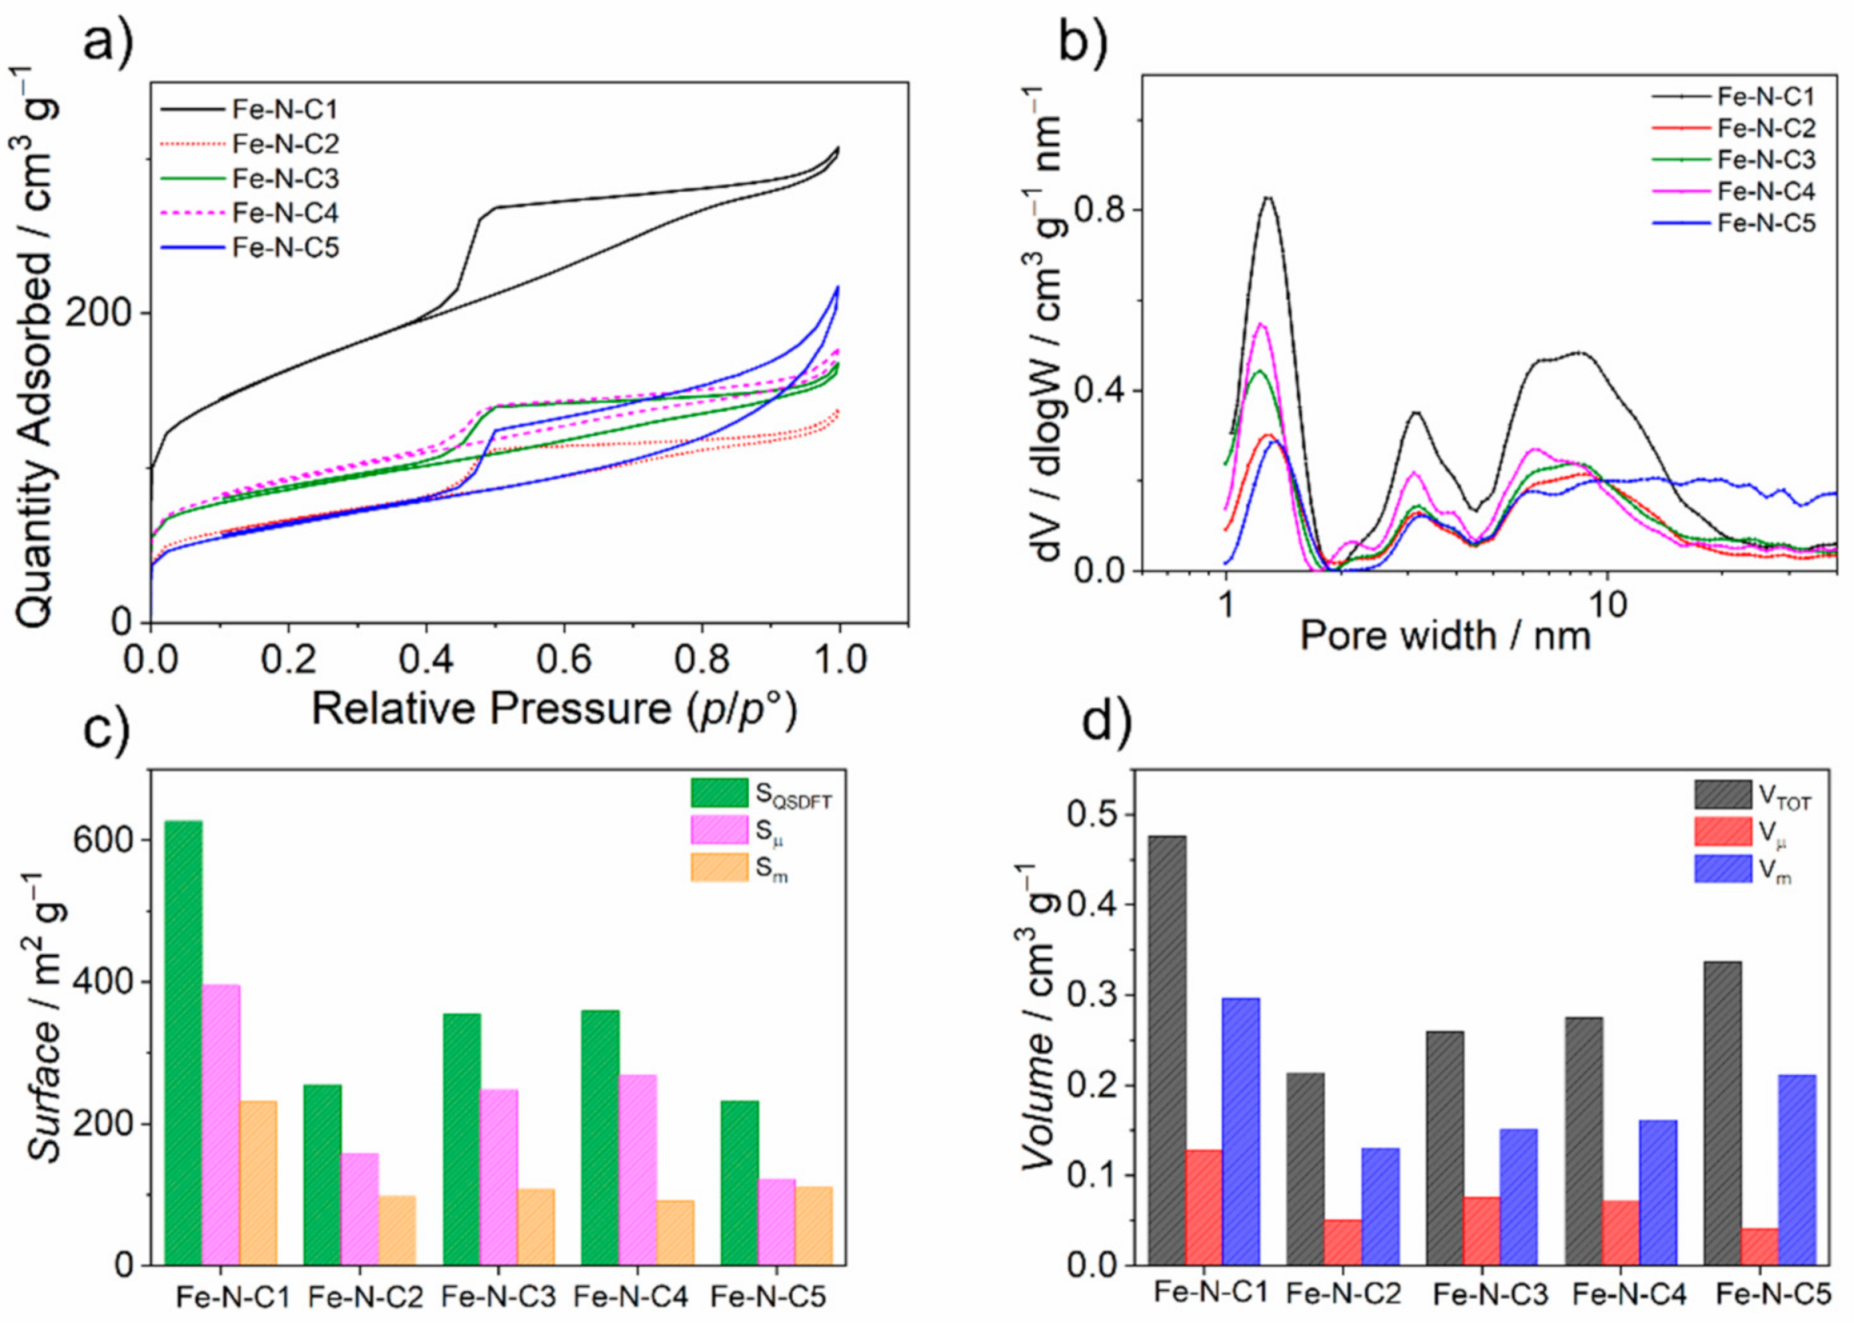
2.1. Morphological and Textural Properties

The morphology of the Fe-N-Cn catalysts was investigated by TEM (Figure 1). All of them show a mixed structure of compact lamellae and sponge-like structures. Several Fe-based NPs are trapped within the structure as clearly visible by the different image contrast due to the higher electron density of Fe with respect to C. Some alveoli-like pores can be recognized, whose size are equal to those of Fe-based NPs. This matching allows to suggest that the formed NPs act as a templating agent, which decompose or migrate to agglomerate in larger NPs during the pyrolysis, leaving voids in the carbonaceous network. The high density of Fe-based NPs and the alveoli-like pores could be explained by the mechanism proposed by Wang et al. for magnetite production [61], where the complex between chitosan and iron becomes a magnetite Fe3O4 NP after alkaline treatment. There are no remarkable differences on the final structure when phenanthroline or different iron precursors are used. It is important to stress that the Fe-based NPs are enveloped in a carbon shell (Fe@C), so that they are partially protected against the acid treatment. In fact, comparing the images before and after acid wash (Figure S1), the NPs are not totally removed: as an example, the iron content in Fe-N-C3 is reduced from 15.2 wt.% to 4.9 wt.% (Table 2).
A completely different structure can be observed in Fe-N-C4 and Fe-N-C5 where FeCl2 and Fe(Phen)3Cl2 were respectively added only after the first pyrolysis at 400 °C. In fact, compact carbon sheets are no longer present, whereas the sole sponge-like structure remains. Additionally, in this case, the porous structure is due to the self-templating effect of Fe-based NPs. In this case, a much lower number of Fe@C NPs can be recognized contrary to Fe-N-Cn (n = 1–3). This can be justified by the fact that iron is added after the pre-formation of the carbon scaffold, which is no longer able to reorganize. Without being protected by a carbon shell, Fe-based NPs are more effectively removed by the acid leaching as demonstrated by ICP-MS results in Table 2, where the Fe content in Fe-N-Cn (n = 4,5) decreases below 1 wt. % after the acid wash.
The porous structure was further characterized by N2 ads/desorption and the results are reported in Figure 2 and Table 2. Fe-N-C1 has a very high surface area (627 m2 g−1) thanks to the high density of micropores and mesopores, whose formation seems to be encouraged by 1,10-phenanthroline [39]. The hysteresis of Fe-N-C1 is a H5-like type, which is typical of certain pore structures with both open and blocked mesopores [62]. The desorption branch presents a rapid step-down at 0.45 p/p0, i.e., the cavitation pressure, which is due to ink-bottle shape pores. For this reason, these isotherms are analyzed applying cylindrical/spherical QSDFT adsorption model [63]. Fe-N-C2 and Fe-N-C3 present both an IV(a) type isotherm and the same H4 hysteresis, typical of micro/mesoporous materials. In fact, their mesoporosity is similar, and the main difference lies in the uptake at low p/p0 due to microporosity, clearly visible in Figure 2a: Fe-N-C2 and Fe-N-C3 have a different microporous surface of 157 m2 g−1 and 248 m2 g−1, respectively, while they have the same pore size distribution as reported in Figure 2b. The textural properties appear to be not affected by the addition of iron after the first pyrolysis. In fact, Fe-N-C3 and Fe-N-C4 have the same isotherms and similar textural properties (see Table 2). The isotherm for Fe-N-C5 is a mixture of II and IV(a) types, due to the presence of both macropores and mesopores, and the hysteresis is a mixed H2(a)/H3 type. This type of isotherm is given by a heterogeneous pore network with macropores (H3 type), and mesopores (H2 type). The steeper desorption branch at 0.45 p/p0, which identifies H2(a) hysteresis, is due to pore-blocking in a narrow range of pore necks.
The pore size is similar in all the samples, except for the higher density of pores with size > 10 nm in Fe-N-C5 (Figure 2b). Figure 2c,d report the comparison of surface area and volume of micropores and mesopores: all the samples have important components of both micropores and mesopores, even though to a different extent. Accessibility and connectivity among pores are fundamental parameters for the heterogeneous catalysis. For this reason, a hierarchical factor (HF) can be calculated according to Equation (1):
H F = V μ V T O T × S m S Q S D F T
where Vμ and VTOT are the volume of micropore and the total volume pore respectively, whereas Sm and SQSDFT are the surface area of mesopore and the total surface area determined by the quenched-solid density-functional-theory model, which considers the adsorbant as a hardcore sphere interacting with fluid molecules. The HF is generally used to evaluate the catalytic activity of zeolite, but the general applicability has been recently challenged [64]. In the best catalysts, one should maximize the HF factor by comprising the enhancement of the mesopore surface area without a severe penalization of the micropore volume aiming at improving the reagent and product transport efficiency to the active site. If we take zeolites as reference materials, mostly microporous standard samples have moderate HF < 0.1, whereas those mostly mesoporous have HF < 0.05. Materials displaying high relative microporosity and low relative mesoporosity have HF > 0.10, whereas system with spread hierarchical pores have HF > 0.15. Our Fe-N-Cn catalysts show HF values close to 0.1 or below, attesting to be highly microporous with a moderate content of mesopores, which is promising for electrocatalytic applications since Fe-Nx sites are expected to form inside the micropores, whereas mesopores are useful to increase the accessibility to the active sites. Based on their HF values, the samples are rather similar from the structural point of view: the microporosity and mesoporosity are balanced in the same way for all catalysts. In Fe-N-Cn (n = 4, 5), the HF value is slightly lower than in Fe-N-Cn (n = 1–3) but this is principally due to a decrease of mesoporosity rather than an increase of microporosity (Table 2).

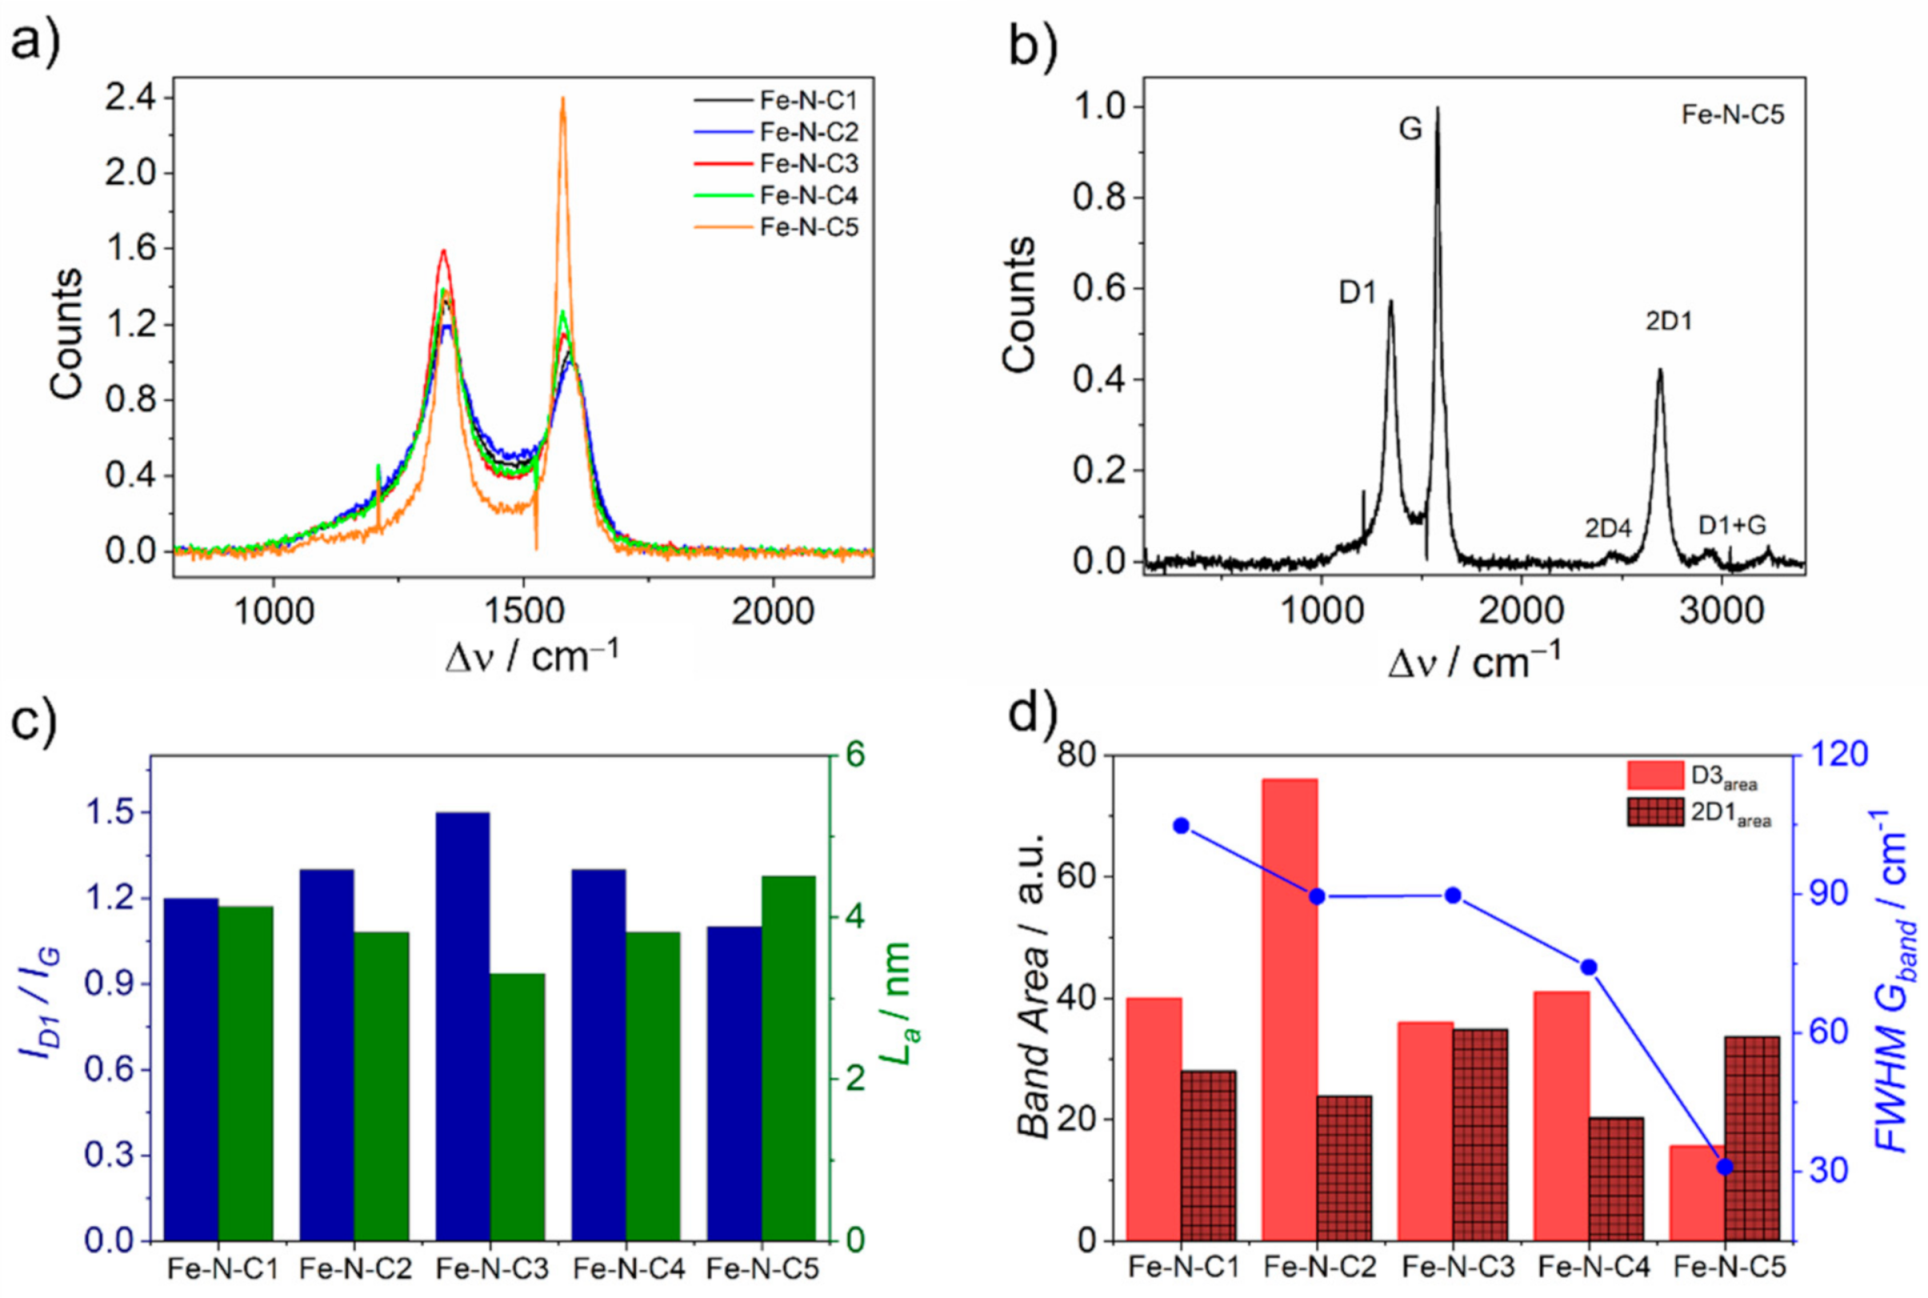
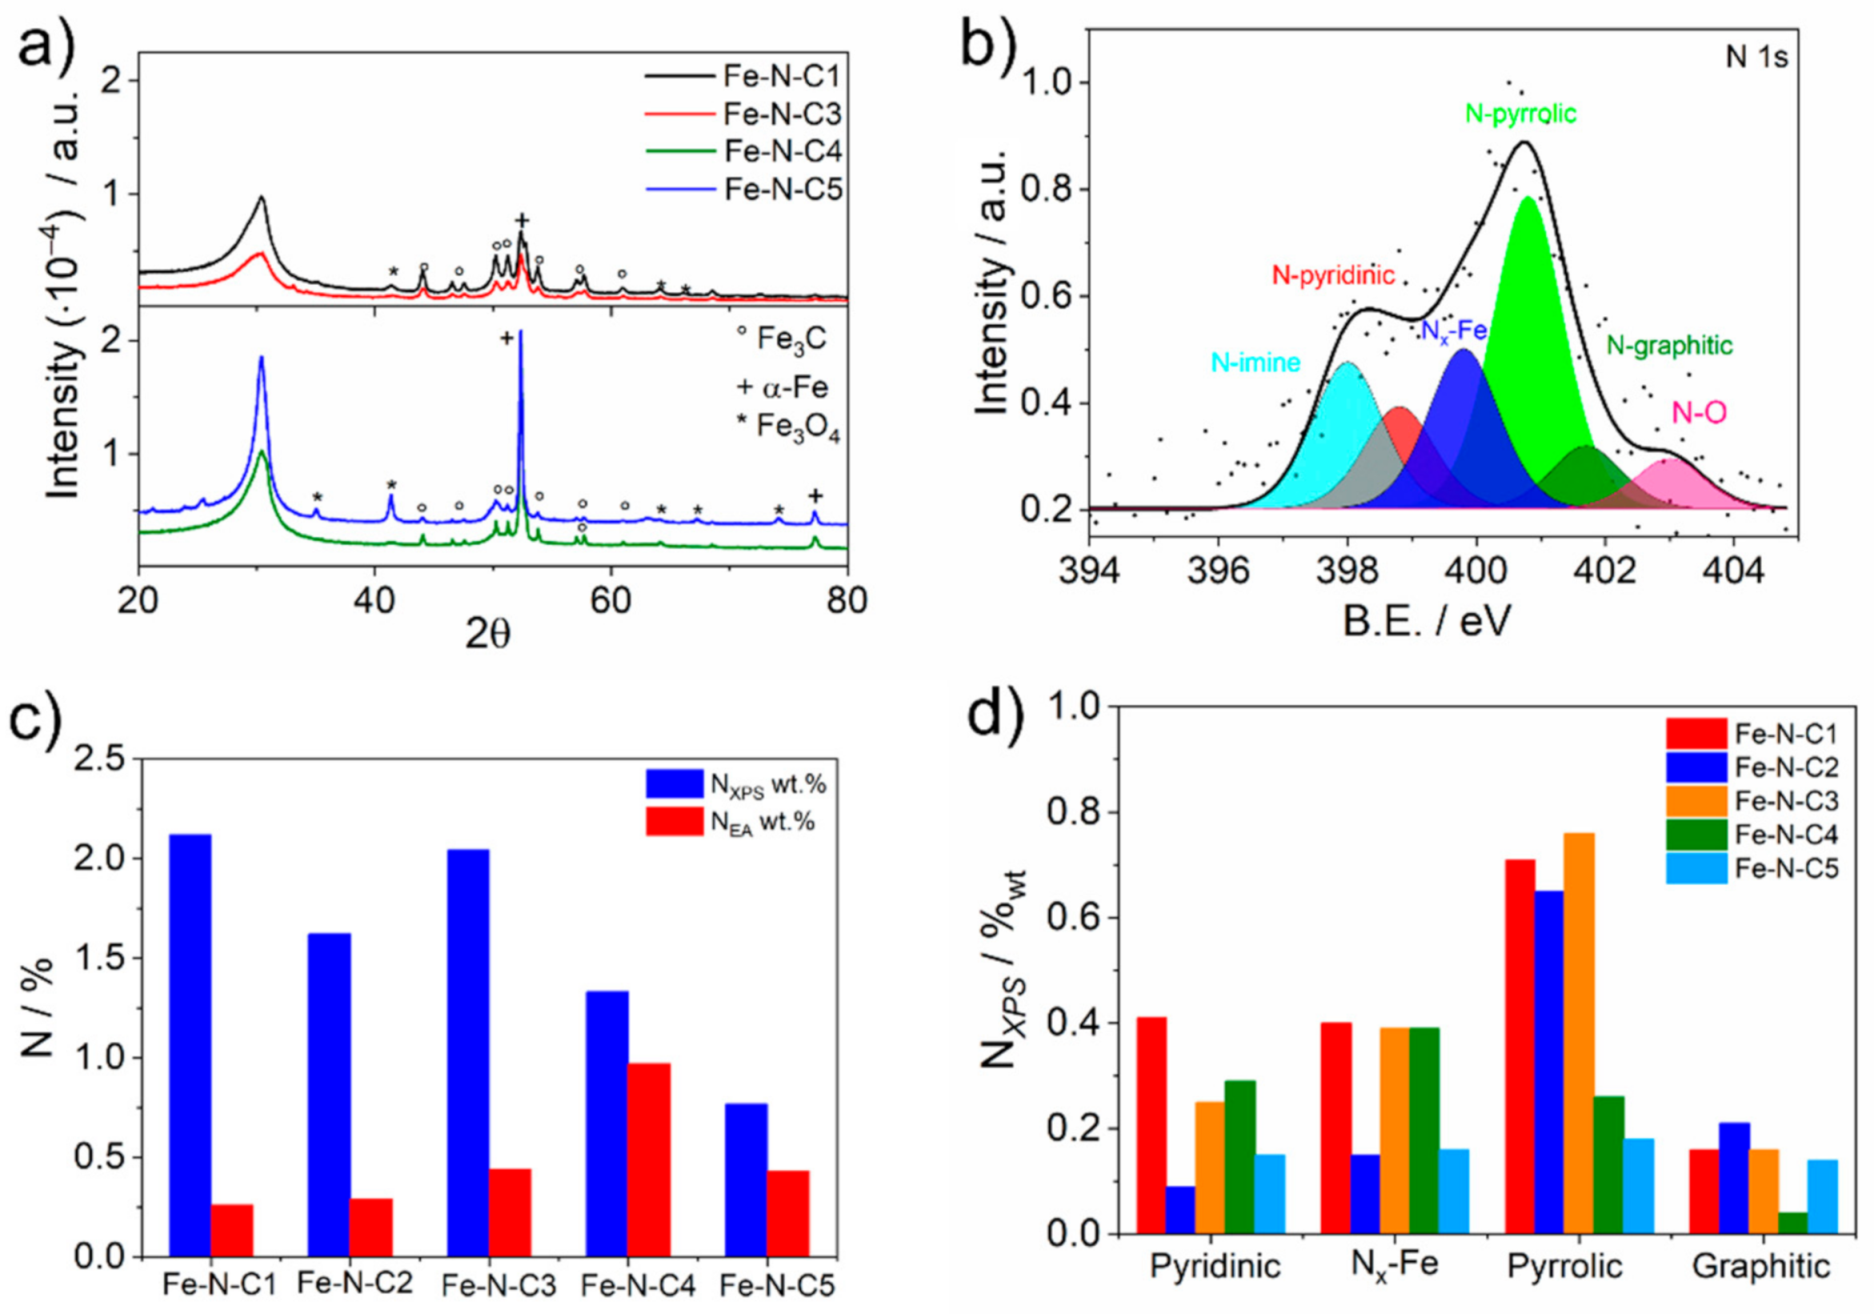
2.2. Chemical and Spectroscopic Characterization

Raman characterization was also performed on all samples, since it can give interesting insights on the degree of graphitization, size of graphite crystallites (La) and content of amorphous carbon (Figure 3). The spectra were deconvoluted with 4 (D4, D1, D3 and G) or 5 (D2) bands (Figure S3) in the region between 1100 and 1700 cm−1 [65,66] after a normalization relative to the G band peak (namely to the Raman shift around 1600 cm−1). In the region between 2200 and 3200 cm−1, 2 or 3 bands (2D4, 2D1and D1+G) were used to deconvolute the spectrum according to Sadezky et al. [66]. This spectral region is generally called the graphene/graphene oxide region because at least two distinct bands similar to those of graphene oxide are observed in materials such as Fe-N-C5 (Figure 3b).
All the catalysts have similar ID1/IG value ranging between 1.1 and 1.3 (Table S1), which classify these materials as nanocrystalline graphite according to Ferrari et al. [65] (Figure 3c). The size of carbon crystallites (La) can be calculated using the Tunista and Koenig equation (Equation (2)):
I D 1 I G =   C λ L a    
where   C λ   =   126     +   λ L 0.033 .   La ranges between 3–5 nm (Figure 3c) and finds its maximum value in Fe-N-C5, which shows an increased graphitization degree with respect to the other catalysts. Fe-N-C5 presents four main changing features: (i) the G band is more intense than D1 band, (ii) G band is split into two bands (G and D2), (iii) D3 area, which accounts for amorphous carbon is much lower than D3 in the other sample, and (iv) the second order bands are well defined. In particular, the 2D1 band, which is indicative of the ordered stacking of the graphene layers along the hexagonal axis in short or medium ranges, is very intense and sharp (Figure 3d) [67]. It is well evident that the employment of the Fe(Phen)3Cl2 complex after the first pyrolysis leads to a more graphitized carbon catalyst as confirmed also by the ID1/IG value, the lowest one, and also by the small D3 band area associated to amorphous carbon (Table S1 and Figure 3d). The higher graphitization of Fe-N-C5 is confirmed also by adopting the parameter R2 introduced by Beyssac et al. [68] and that can be calculated according to Equation (3):
R 2   =   I D 1 I G + I D 1 + I D 2
R2 value reflects the number of structural defects and assumes value higher than 0.5 for poorly organized structure and lower than 0.5 for a well-organized one. R2 is equal to 0.45 for Fe-N-C5, whereas it is >0.5 in all the other synthetized catalysts.
The XRD analysis was performed on samples before acid washing, since otherwise, the concentration of iron phases was too low to yield a clearly detectable diffraction signal (Figure 4a). The Fe-N-CX samples are composed of the following crystalline phases: graphite (C), metallic iron (α-Fe) and iron carbide (Fe3C), but the content is different among different samples. Magnetite (Fe3O4) was detected only in Fe-N-C5. From a qualitatively evaluation of the diffraction patterns, the Bragg reflection at 30.4°2θ from C (002) lattice planes is sharper for Fe-N-C5, which means a higher degree of crystallinity. The same conclusion was previously found from Raman spectroscopy analysis. A quantitative description of the peak broadening of graphite 002 reflection was achieved by profile fitting with an asymmetric (split width) Pseudo Voigt function. When iron is added after the first pyrolysis, the total width is reduced from 6.6°2θ in Fe-N-C3 to 5.0 in Fe-N-C4 and the integrated intensity increases, becoming two times higher than in Fe-N-C3. The same consideration stands for Fe-N-C5. The 002 reflection intensity increment means that the stacking of graphite layers is not interrupted by amorphous carbon. For the other phases, which exhibited more defined reflections, a Williamson-Hall (W-H) plot analysis was tentatively applied. In Figure S4, the W-H plots of Fe3O4 and α-Fe are reported. The α-Fe showed two Bragg reflections in the measured 2θ range, thus the line profile analysis was limited to two diffraction peaks, namely the 011 and 002 reflections. The integral breadth values, subtracted by the instrumental contribution, are reported in Table S2. The estimated mean crystallite size was derived by applying the Scherrer equation on each reflection, setting a shape factor Kβ = 1. For sample Fe-N-C5, the sizes of α-Fe resulted equal to 49 nm for Bragg peak at 52.3°2θ and 48 nm for Bragg peak at 77.2°2θ (Table S2). The size of these particles is in general agreement with those obtained from TEM images, so that it is reasonable to assert that the most visible particles are principally made of metallic iron. The Fe3O4 phase displayed a more pronounced peak broadening (Figure S4) related to smaller crystallite sizes. As previously introduced, the acid washing removes the Fe3O4 and metallic particles, and the remaining ones are Fe3C and a low percentage of α-Fe (Figure S5).
The composition of the exposed surface of Fe-N-Cn samples was investigated by a comprehensive XPS analysis, which evidenced the presence of iron, oxygen, carbon and nitrogen. The presence of the same elements was confirmed by ICP-MC (Fe) and elemental analysis (N and C) as reported in Table 2. It is interesting to underline that according to bulk elemental analysis, the use of 1,10-phenanthroline as an auxiliary nitrogen source does not bring any further increase of the nitrogen functional groups (Table 2 and Figure 4c). Actually, the nitrogen content decreases from 0.68 wt.% (Fe-N-C3) to 0.44 wt.% (Fe-N-C1) when 1,10-phenanthroline is used. If iron is used as Fe3+ precursor, the nitrogen content increases up, and this was associated to the strong chelating effect exerted by the trivalent cation. In fact, it seems that Fe3+ is more easily incorporated in the sample than Fe2+. It seems then that the hydrogel acts as a carbon exchange resin, where the adsorption depends on pH and on chemical interaction. The maximum nitrogen surface content determined by XPS is limited to ca. 2 wt.% (in Fe-N-C1 and Fe-N-C3, see Table S3). The N 1s peak was fitted with 6 components (Figure 4b) i.e., imine N (397.8 eV), pyridinic N (398.8 eV), Fe-Nx (399.9 eV), pyrrolic N (400.7 eV), graphitic N (401.7 eV) and N-O group (402.7 eV) [13,42]. Actually, the data show an apparent decrement of pyrrolic nitrogen and Fe-Nx, going from Fe-N-C1 to Fe-N-C5 (see Figure 4d and Table S3). The distribution of the N-functional groups appears to be influenced by the oxidation state of the iron precursor, as it can be observed from Figure 4d. In fact, the principal nitrogen groups which form when using Fe3+ are: Nx, pyrrolic and graphitic nitrogen, while using Fe2+, the imine and pyridinic groups may be singled out.

2.3. ORR Electrochemical Performace

The catalytic performance for oxygen reduction reaction was evaluated by using CV and LSV with RRDE. In Figure 5a, we report a representative example of the voltammetric behavior of Fe-N-C5 in both Ar-purged and O2-saturated 0.5 M H2SO4. In oxygen-saturated electrolyte, a very intense and narrow peak appears at around 0.75 V/RHE (scan rate at 2 mV s−1) which is not present in the background and that can be convincedly assigned to the ORR process. All the other catalysts show very similar behavior, but with different Ep and Ip. Figure 5b reports the LSV curves for all the Fe-N-C catalysts. E1/2 and jk, representing the half wave potential and the kinetic current, respectively, are two objective descriptors of the catalytic process and it clearly appears that both shift to more positive value passing from Fe-N-C1 to Fe-N-C5, attesting a superior catalytic activity for Fe-N-C5 (Figure 5c). Therefore, the best performing catalyst resulted Fe-N-C5, which was obtained by introducing Fe(Phen)3Cl2 after the first pyrolysis. The number of transferred electrons were calculated from the K-L plot and compared to the value determined by RRDE (Figure 5d). The two values are in fair agreement attesting an almost 4 electron process at all the catalysts with a higher selectivity in those catalysts obtained with the post addition of iron precursors. The H2O2 yield ranges between 6% to 10%, reaching the lowest value in Fe-N-C5 (Figure 5d).
It is interesting to observe that H2O2 yield scale linearly with both: the percentage of pyrrolic functional groups determined by XPS analysis and the R2 parameter, attesting the graphitization degree of the carbon material, i.e., the higher the Npyrrolic density or the amorphous carbon fraction, the higher the χH2O2 (Figure 5e,f).
The number of Fe-Nx sites was determined by the electrochemical nitrite stripping developed by Malko et al. [69,70]. This method is based on the selective interaction of Fe-Nx sites with probe molecule NO2, which reversibly binds to the Fe center as nitrosyl at a buffered pH value of 5.2. The nitrosyl stripping charge, Qstrip, can be related to the gravimetric site density according to the formula:
M S D   m o l   s i t e s   g 1   =   Q s t r i p C   g 1 n s t r i p F C   m o l 1
where nstrip is the number of electrons associated with the reduction of one adsorbed nitrosyl per site to NH3. What we expect is to observe a variation of sites’ density depending on the synthetic procedure and therefore on the textural, morphological, and chemical properties of the Fe-N-C catalysts. An example of the obtained electrochemical curves is reported in Figure S6a,b. The turnover frequency (TOF) of Fe-Nx sites is then given by the expression:
T O F e l e c t r o n   s i t e s 1   s 1 = j K   A   g 1 M S D m o l   s i t e s   g 1 × F C   m o l 1
where F is the Faraday constant, j K is the kinetic current determined by the Tafel plot (Figure S6c) and MSD is the gravimetric active sites’ density. It becomes clear that the catalytic activity expressed as jk is influenced either from a high turnover frequency or a high number of active sites (Figure S6d). It is interesting to observe that according to NO-stripping results (Table S4), the site density scale almost linearly (excluding the Fe-N-C1 point) with the half wave potentials of LSV, recorded at different catalysts for the ORR process. This is a clear indication of how the catalytic activity depends on the number of Fe-Nx sites. Furthermore, the SD shows a good correlation also with the hierarchical factor HF, which is a descriptor of how much interconnected are micropores, where active sites should be located, and mesopores which favor the access to the active sites. The addition of iron precursor after the first pyrolysis step leads to an increased activity because of both: an increased number of active sites and to a hierarchical structure, which improves the access to those active sites. At the same time, the increased graphitization degree is helpful in increasing the selectivity because of a reduced density of pyrrolic nitrogen.

3. Materials and Methods

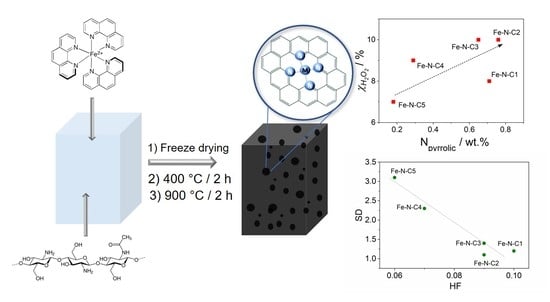
3.1. Synthesis of the Catalysts

The synthesis of chitosan-based Fe-Nx catalysts is based on the gelation of chitosan where chitosan is the main source of carbon and nitrogen, and 1,10-phenanthroline is used as an auxiliary nitrogen source. The iron doping is obtained using an inorganic salt such as FeCl2, FeCl3 or tris(1,10-phenanthroline)iron(II)-chloride (Fe(Phen)3Cl2). The synthesis consists in the formation of a chitosan hydrogel, followed by the removal of the solvent by freeze drying and the pyrolysis of the resulting material (Scheme 1). The hydrogel synthesis involved the dispersion of the chitosan powder (1.8 g) in an acetic acid solution (100 mL, 2 vol%), and the resulting mixture was vigorously stirred to ensure the complete solubilization. At acidic pH, the amine groups in the N-acetyl-β-(D)-glucosamine moiety are protonated to ammonium (pKa (-NH3+) = 6.3), favoring the solubilization of the polymer in water, thus obtaining a transparent, homogeneous and viscous solution. At this stage, 1,10-phenanthroline (Phen), FeCl2 or FeCl3 were used as secondary sources of nitrogen and as iron precursor, to induce the formation of Fe-Nx sites. The addition at this stage of Phen + FeCl2, Phen + FeCl3 or FeCl2 leads to form Fe-N-Cn (X = 1–3) after the second pyrolysis (Table 1). The hydrogel formation occurred after pouring a 1 M NaOH solution to the chitosan solution. The gelation is not instantaneous but depends on the diffusion of OH through the chitosan solution. The obtained hydrogel was than rinsed with water until a neutral pH was reached and then cut into small pieces and afterward freeze-dried to remove all water. The dried gel was then thermally treated in a two-step pyrolysis procedure. The gel was heated in a Carbolite tubular furnace with a 75 sccm (standard cm3/min) N2 flux at 100 °C for 1 h, after which the temperature was raised up to 400 °C at a rate of 5 °C/min and kept at that temperature for 2 h. The resulting powder was ground by vibro-milling (Retsch MM 400, four steps of 4 min/10–25 Hz). As alternative to the addition of nitrogen and iron precursor before the gelation process, FeCl2 or tris(1,10-phenanthroline)iron(II)-chloride (Fe(Phen)3Cl2) were mixed after the first pyrolysis at 400 °C to form Fe-N-C4 and Fe-N-C5, respectively, after the second pyrolysis (Table 1). Notwithstanding the timing in which chitosan, iron precursors and nitrogen auxiliary source are added, the mixture was re-pyrolyzed at 900 °C for 2 h under nitrogen atmosphere. The obtained catalysts were acid-washed in a 2 M H2SO4 solution, under reflux for 2 h at 100 °C. After that, the solution was filtered, and the carbon was washed with milli-Q water several times and dried at 80 °C in oven for a night. Eventually, the Fe-N-C catalysts were activated at 900 °C for 2 h under a reducing atmosphere of (8% H2 in nitrogen), which is fluxed when 900 °C is reached. The final powder catalyst is grinded for 40 min at 22 Hz before the characterizations.

3.2. Electrochemical Test

Cyclic voltammetry (CV) and linear sweep voltammetry (LSV) were carried out on a rotating ring-disc electrode (RRDE, Metrohm; d = 5 mm GC disk and a Pt ring), in both Ar-purged and O2-saturated 0.5 M H2SO4 solution using an Autolab model 101N potentiostat. All measurements were done in a three-electrode cell, thermostated at 25 °C. The RRDE tip was used as working electrode, a graphite rod was used as counter-electrode and a homemade RHE as reference electrode. RHE consists in a spiral Pt wire settled to the closed end of a capillary glass tube filled with the electrolyte solution in which H2 was directly electrogenerated at the Pt wire via chronoamperometric technique until half of the spiral was filled with gas.
The materials activity was investigated on a relatively thin catalyst layer loaded on GC surface via drop-casting after the preparation of an ink made approximately of an 8:2 mixture of water, an organic solvent (ethanol, isopropanol and THF) and Nafion (mnafion/mcat solution ≈ 0.8). To obtain a good dispersion, the ink was sonicated both in a bath and probe sonicator. The loading was chosen to be 0.6 mg cm−2 as used in previous works [19,40].
All the materials were initially activated in Ar-purged electrolyte with extensive CV cycling at 200 mV s−1 until a stable current was observed. In ORR tests, O2 was bubbled inside the electrolyte solution for at least 30 min. The number of transferred electron (n) was determined by RRDE linear sweep voltammetry according to the following equation:
n = 4 | i D | i D + i R / N
where iD is the current recorded at disk, iR is the current recorded at ring and N the collection efficiency, which is equal to 0.25 (determined by performing RRDE measurement in the presence of K4Fe(CN)6 in 0.5 M K2SO4 electrolyte). With the last analysis, it is also possible to evaluate the percentage of hydrogen peroxide produced at the working electrode:
χ H 2 O 2 % = 100 × 4 n 2 = 100 × 2 | i R | N × i D + i R
Other parameters of interest are the half wave potential (E1/2), and the limiting current density (jlim) determined from LSV analysis at 2 mV s−1 and 1600 rpm. The mass-transport corrected kinetic current density at a selected potential was calculated according to Equation (8).
j k = j E × j l i m j E j l i m
where jE is the current density at the selected potential E = 0.65 V vs. RHE.
To evaluate the catalyst’s site density, nitrite (NO2) poisoning and electrochemical stripping were performed following the procedure described by Malko et al. [69]. This procedure allows the selective poisoning of Fe-Nx site and the site density is determined by measuring the charge of NO reductive stripping during a CV measurement. The side density measurements were performed on a thin layer of catalyst deposited on a GC (RDE, Metrohm Ø = 5 mm) in a 0.5 M acetate buffer at pH 5.2. A loading of 0.2 mg cm−2 was chosen according to published procedure, the ink was let dry with the electrode in rotation at 130 rpm for about 20 min.

3.3. Physico-Chemical Characterization

X-ray photoemission spectroscopy (XPS) measurements were performed at room temperature in a UHV chamber (base pressure < 5 × 10⁻⁹ mbar), equipped with a double anode X-ray source (Omicron DAR-400) and a hemispherical electron analyzer (Omicron EIS-125). A non-monochromatized Mg-Kα radiation (hν = 1253.6 eV) and pass energies of 50 eV and 20 eV for the survey and the single spectral windows, respectively, were used. The calibration of the Binding Energy (BE) scale was carried out using Au 4f7/2 as a reference (BE Au 4f7/2 = 84.0 eV). The XPS peak of nitrogen was deconvoluted into single components by using symmetrical Voigt functions.
XRD measurements were acquired by using a Panalytical X’Pert Pro diffractometer equipped with a Co anode X-ray tube (40 kV, 40 mA), Bragg–BrentanoHD optical module, and X’Celerator detector. Diffraction patterns were collected in the 5–90° 2θ range with 2θ = 0.0338° virtual step size, counting an equivalent time of 300 s per step. The experimental patterns after some corrections are compared with the reference ones (Powder Diffraction File–PDF database) to individuate the possible phases. The main corrections concern the background and the instrumental broadening. In fact, in these samples, the background is bumped up by amorphous carbon matrix. The instrumental broadening was evaluated from the Bragg reflections of the reference standard LaB6 (SRM 660c). The fitting profile was performed using a Pseudo-Voigt function, which allows to consider both Lorentzian and Gaussian broadening of the diffraction peaks, as demonstrated by the fitting of the graphite reflection of sample Fe-N-C3 in Figure S4.
Raman spectra were recorded using a micro-Raman set-up with a 1 mW laser at 532 nm with 50xLWD objective (pinhole 25µm). N2 adsorption/desorption isotherm were recorded at 77.3 K using an ASAP 2020 Plus instrument. Specific surface area of the samples was determined by BET analysis and with Quenched Solid Density Functional Theory (QSDFT) model, which showed to be more accurate compared to NLDFT, even if limited to pore dimension of 40 nm. In fact, it takes into account the roughness of the surface and chemical heterogeneity leading to a better fit of experimental data, in particular for disordered carbons. The total volume of pore was obtained applying Gurvitsch law at p/p0 ≈ 0.98. Elemental analysis (EA) was carried out using a Thermo Scientific Flash 2000 analyzer. Transmission electron microscopy (TEM) images were obtained with a FEI TECNAI G2 instrument operating at 100kV.
Inductively-coupled plasma mass spectrometric analysis was performed with an Agilent Technologies 7700x ICP-MS. The samples (5 mg) were digested with 5 mL of 68% HNO3 in a microwave system CEM EXPLORER SPD PLUS at a heating rate of 40 °C/min from room temperature to 220 °C (power of 300 W). The vial pressure was 400 psi and the digestion procedure took 15 min. Samples, after the digestion step, were suitably diluted and filtered before the ICP-MS measurement.

4. Conclusions

In this paper, we consider the synthesis of Fe-N-C type catalysts by employing chitosan as sustainable carbon and nitrogen precursor. The synthetic procedure of Fe-N-C was refined, and the optimal conditions for obtaining highly active and selective catalysts for oxygen reduction reaction consists in a double-step thermochemical conversion of chitosan where an iron complex such as Fe(Phen)3Cl2 is added only after the first pyrolysis step. This procedure coincides with the formation of the best performing catalyst Fe-N-C5, which is, however, less performing than other iron-chitosan-based catalysts proposed in literature [71]. This leads to the formation of catalysts with enhanced Fe-Nx catalytic sites and a reduced amount of pyrrolic functional groups. The combined effects allow to increase the activity and the selectivity versus the 4e ORR. Furthermore, the Fe-N-C catalysts prepared according to this protocol show a high graphitization degree, which help the selectivity versus the reduction of O2 to H2O and an optimal hierarchical pore structure, which enhances the accessibility to the Fe-Nx active sites.

Supplementary Materials

The following are available online at https://0-www-mdpi-com.brum.beds.ac.uk/2073-4344/11/3/390/s1, Figure S1: TEM images of Fe-N-C3 before and after acid treatment, Figure S2: TEM images of Fe-N-C5 before and after acid treatment, Figure S3: Example of Raman spectrum deconvolution, Figure S4: Pseudo-Voigt fitting on graphite peak obtained from XRD technique and Williamson-Hall plot of magnetite and α-Fe, Figure S5: XRD spectra of Fe-N-C3 and Fe-N-C5 before and after acid washing, Figure S6: nitrite stripping Tafel plot and activity map of all catalysts, Table S1: Raman parameters obtained from deconvolution spectra, Table S2: Line profile analysis results for α-Fe in sample Fe-N-C5, Table S3: Surface chemistry determined from XPS spectra fitting, Table S4: Electrochemical data from RRDE characterization.

Author Contributions

Conceptualization and methodology, C.D., G.D., M.M. and F.B.; formal analysis, investigation and data curation, G.D., F.B., T.K., D.B., P.P. and M.C.D.; writing—original draft preparation, C.D., A.F. and G.D.; writing—review and editing, C.D., A.F., M.M. and G.G.; supervision, C.D. All authors have read and agreed to the published version of the manuscript.

Funding

The research leading to these results has received funding from the Fuel Cells and Hydrogen 2 Joint Undertaking under grant agreement number 779366. This Joint Undertaking receives support from the European Union’s Horizon 2020 research and innovation program, Hydrogen Europe and Hydrogen Europe Research.

Data Availability Statement

Data are available within the article.

Conflicts of Interest

The authors declare no conflict of interest.

References

  1. Zhang, C.; Shen, X.; Pan, Y.; Peng, Z. A review of Pt-based electrocatalysts for oxygen reduction reaction. Front. Energy 2017, 11, 268–285. [Google Scholar] [CrossRef]
  2. Stephens, I.E.L.; Bondarenko, A.S.; Grønbjerg, U.; Rossmeisl, J.; Chorkendorff, I. Understanding the electrocatalysis of oxygen reduction on platinum and its alloys. Energy Environ. Sci. 2012, 5, 6744–6762. [Google Scholar] [CrossRef] [Green Version]
  3. Wu, D.; Shen, X.; Pan, Y.; Yao, L.; Peng, Z. Platinum Alloy Catalysts for Oxygen Reduction Reaction: Advances, Challenges and Perspectives. ChemNanoMat 2020, 6, 32–41. [Google Scholar] [CrossRef] [Green Version]
  4. Zamburlini, E.; Jensen, K.D.; Stephens, I.E.L.; Chorkendorff, I.; Escudero-Escribano, M. Benchmarking Pt and Pt-lanthanide sputtered thin films for oxygen electroreduction: Fabrication and rotating disk electrode measurements. Electrochim. Acta 2017, 247, 708–721. [Google Scholar] [CrossRef] [Green Version]
  5. Brown, R.; Vorokhta, M.; Khalakhan, I.; Dopita, M.; Vonderach, T.; Skála, T.; Lindahl, N.; Matolínová, I.; Grönbeck, H.; Neyman, K.M.; et al. Unraveling the Surface Chemistry and Structure in Highly Active Sputtered Pt3Y Catalyst Films for the Oxygen Reduction Reaction. ACS Appl. Mater. Interfaces 2020, 12, 4454–4462. [Google Scholar] [CrossRef] [PubMed]
  6. Brandiele, R.; Guadagnini, A.; Girardi, L.; Dražić, G.; Dalconi, M.C.; Rizzi, G.A.; Amendola, V.; Durante, C. Climbing the oxygen reduction reaction volcano plot with laser ablation synthesis of PtxY nanoalloys. Catal. Sci. Technol. 2020, 10, 4503–4508. [Google Scholar] [CrossRef]
  7. Brandiele, R.; Durante, C.; Grądzka, E.; Rizzi, G.A.; Zheng, J.; Badocco, D.; Centomo, P.; Pastore, P.; Granozzi, G.; Gennaro, A. One step forward to a scalable synthesis of platinum–yttrium alloy nanoparticles on mesoporous carbon for the oxygen reduction reaction. J. Mater. Chem. A 2016, 4, 12232–12240. [Google Scholar] [CrossRef]
  8. Meier, J.C.; Galeano, C.; Katsounaros, I.; Witte, J.; Bongard, H.J.; Topalov, A.A.; Baldizzone, C.; Mezzavilla, S.; Schüth, F.; Mayrhofer, K.J.J. Design criteria for stable Pt/C fuel cell catalysts. Beilstein J. Nanotechnol. 2014, 5, 44–67. [Google Scholar] [CrossRef] [Green Version]
  9. Vidal-Iglesias, F.J.; Arán-Ais, R.M.; Solla-Gullón, J.; Herrero, E.; Feliu, J.M. Electrochemical Characterization of Shape-Controlled Pt Nanoparticles in Different Supporting Electrolytes. ACS Catal. 2012, 2, 901–910. [Google Scholar] [CrossRef] [Green Version]
  10. Brandiele, R.; Zerbetto, M.; Dalconi, M.C.; Rizzi, G.A.; Isse, A.A.; Durante, C.; Gennaro, A. Mesoporous Carbon with Different Density of Thiophenic-Like Functional Groups and Their Effect on Oxygen Reduction. ChemSusChem 2019, 12, 4229–4239. [Google Scholar] [CrossRef]
  11. Brandiele, R.; Durante, C.; Zerbetto, M.; Vicentini, N.; Kosmala, T.; Badocco, D.; Pastore, P.; Rizzi, G.A.; Isse, A.A.; Gennaro, A. Probing the correlation between Pt-support interaction and oxygen reduction reaction activity in mesoporous carbon materials modified with Pt-N active sites. Electrochim. Acta 2018, 277, 287–300. [Google Scholar] [CrossRef]
  12. Perazzolo, V.; Brandiele, R.; Durante, C.; Zerbetto, M.; Causin, V.; Rizzi, G.A.; Cerri, I.; Granozzi, G.; Gennaro, A. Density Functional Theory (DFT) and Experimental Evidences of Metal–Support Interaction in Platinum Nanoparticles Supported on Nitrogen- and Sulfur-Doped Mesoporous Carbons: Synthesis, Activity, and Stability. ACS Catal. 2018, 8, 1122–1137. [Google Scholar] [CrossRef]
  13. Primbs, M.; Sun, Y.; Roy, A.; Malko, D.; Mehmood, A.; Sougrati, M.-T.; Blanchard, P.-Y.; Granozzi, G.; Kosmala, T.; Daniel, G.; et al. Establishing Reactivity Descriptors for Platinum Group Metal (PGM)-free Fe-N-C Catalysts for PEM Fuel Cells. Energy Environ. Sci. 2020, 10, 147–154. [Google Scholar] [CrossRef]
  14. Jaouen, F.; Herranz, J.; Lefèvre, M.; Dodelet, J.-P.; Kramm, U.I.; Herrmann, I.; Bogdanoff, P.; Maruyama, J.; Nagaoka, T.; Garsuch, A.; et al. Cross-Laboratory Experimental Study of Non-Noble-Metal Electrocatalysts for the Oxygen Reduction Reaction. ACS Appl. Mater. Interfaces 2009, 1, 1623–1639. [Google Scholar] [CrossRef]
  15. Mineva, T.; Matanovic, I.; Atanassov, P.; Sougrati, M.-T.; Stievano, L.; Clémancey, M.; Kochem, A.; Latour, J.-M.; Jaouen, F. Understanding Active Sites in Pyrolyzed Fe–N–C Catalysts for Fuel Cell Cathodes by Bridging Density Functional Theory Calculations and 57 Fe Mössbauer Spectroscopy. ACS Catal. 2019, 9, 9359–9371. [Google Scholar] [CrossRef]
  16. Shao, Y.; Dodelet, J.; Wu, G.; Zelenay, P. PGM-Free Cathode Catalysts for PEM Fuel Cells: A Mini-Review on Stability Challenges. Adv. Mater. 2019, 31, 1807615. [Google Scholar] [CrossRef] [PubMed]
  17. Martinez, U.; Komini Babu, S.; Holby, E.F.; Zelenay, P. Durability challenges and perspective in the development of PGM-free electrocatalysts for the oxygen reduction reaction. Curr. Opin. Electrochem. 2018, 9, 224–232. [Google Scholar] [CrossRef]
  18. Martinaiou, I.; Shahraei, A.; Grimm, F.; Zhang, H.; Wittich, C.; Klemenz, S.; Dolique, S.J.; Kleebe, H.-J.; Stark, R.W.; Kramm, U.I. Effect of metal species on the stability of Me-N-C catalysts during accelerated stress tests mimicking the start-up and shut-down conditions. Electrochim. Acta 2017, 243, 183–196. [Google Scholar] [CrossRef]
  19. Mazzucato, M.; Giorgia, D.; Tomasz, K.; Mahmood, A.; Gaetano, G.; Anthony, K.; Durante, C. Effects of the induced Micro- and Meso-porosity on the single site density and turn over frequency of Fe-N-C carbon electrodes for the Oxygen Reduction Reaction. Appl. Catal. B Environ. 2021, 291, 120068. [Google Scholar] [CrossRef]
  20. Lai, Y.; Wang, Q.; Wang, M.; Li, J.; Fang, J.; Zhang, Z. Facile synthesis of mesoporous Fe-N-C electrocatalyst for high performance alkaline aluminum-air battery. J. Electroanal. Chem. 2017, 801, 72–76. [Google Scholar] [CrossRef]
  21. Zhang, X.; Han, X.; Jiang, Z.; Xu, J.; Chen, L.; Xue, Y.; Nie, A.; Xie, Z.; Kuang, Q.; Zheng, L. Atomically dispersed hierarchically ordered porous Fe–N–C electrocatalyst for high performance electrocatalytic oxygen reduction in Zn-Air battery. Nano Energy 2020, 71, 104547–104556. [Google Scholar] [CrossRef]
  22. Meng, Z.; Stolz, R.M.; Mendecki, L.; Mirica, K.A. Electrically-Transduced Chemical Sensors Based on Two-Dimensional Nanomaterials. Chem. Rev. 2019, 119, 478–598. [Google Scholar] [CrossRef]
  23. Paolesse, R.; Nardis, S.; Monti, D.; Stefanelli, M.; Di Natale, C. Porphyrinoids for Chemical Sensor Applications. Chem. Rev. 2017, 117, 2517–2583. [Google Scholar] [CrossRef] [PubMed] [Green Version]
  24. Wang, D.; Hu, J.; Yang, J.; Xiao, K.; Liang, S.; Xu, J.; Liu, B.; Hou, H. Fe and N co-doped carbon derived from melamine resin capsuled biomass as efficient oxygen reduction catalyst for air-cathode microbial fuel cells. Int. J. Hydrog. Energy 2020, 45, 3163–3175. [Google Scholar] [CrossRef]
  25. Daniel, G.; Foltran, E.; Brandiele, R.; Nodari, L.; Pilot, R.; Menna, E.; Rizzi, G.A.; Isse, A.A.; Durante, C.; Gennaro, A. Platinum-free electrocatalysts for oxygen reduction reaction: Fe-Nx modified mesoporous carbon prepared from biosources. J. Power Sources 2018, 402, 434–446. [Google Scholar] [CrossRef]
  26. Artyushkova, K.; Serov, A.; Rojas-Carbonell, S.; Atanassov, P. Chemistry of Multitudinous Active Sites for Oxygen Reduction Reaction in Transition Metal–Nitrogen–Carbon Electrocatalysts. J. Phys. Chem. C 2015, 119, 25917–25928. [Google Scholar] [CrossRef]
  27. Matanovic, I.; Artyushkova, K.; Atanassov, P. Understanding PGM-free catalysts by linking density functional theory calculations and structural analysis: Perspectives and challenges. Curr. Opin. Electrochem. 2018, 9, 137–144. [Google Scholar] [CrossRef]
  28. Matanovic, I.; Artyushkova, K.; Strand, M.B.; Dzara, M.J.; Pylypenko, S.; Atanassov, P. Core Level Shifts of Hydrogenated Pyridinic and Pyrrolic Nitrogen in the Nitrogen-Containing Graphene-Based Electrocatalysts: In-Plane vs Edge Defects. J. Phys. Chem. C 2016, 120, 29225–29232. [Google Scholar] [CrossRef]
  29. Li, J.; Sougrati, M.T.; Zitolo, A.; Ablett, J.M.; Oğuz, I.C.; Mineva, T.; Matanovic, I.; Atanassov, P.; Huang, Y.; Zenyuk, I.; et al. Identification of durable and non-durable FeNx sites in Fe–N–C materials for proton exchange membrane fuel cells. Nat. Catal. 2021, 4, 10–19. [Google Scholar] [CrossRef]
  30. Yang, W.; Wang, X.; Rossi, R.; Logan, B.E. Low-cost Fe–N–C catalyst derived from Fe (III)-chitosan hydrogel to enhance power production in microbial fuel cells. Chem. Eng. J. 2020, 380, 122522. [Google Scholar] [CrossRef]
  31. Chenitz, R.; Kramm, U.I.; Lefèvre, M.; Glibin, V.; Zhang, G.; Sun, S.; Dodelet, J.-P. A specific demetalation of Fe–N4 catalytic sites in the micropores of NC_Ar + NH3 is at the origin of the initial activity loss of the highly active Fe/N/C catalyst used for the reduction of oxygen in PEM fuel cells. Energy Environ. Sci. 2018, 11, 365–382. [Google Scholar] [CrossRef]
  32. Jaouen, F.; Lefèvre, M.; Dodelet, J.-P.; Cai, M. Heat-Treated Fe/N/C Catalysts for O2 Electroreduction: Are Active Sites Hosted in Micropores? J. Phys. Chem. B 2006, 110, 5553–5558. [Google Scholar] [CrossRef] [PubMed]
  33. Liang, C.; Li, Z.; Dai, S. Mesoporous Carbon Materials: Synthesis and Modification. Angew. Chem. Int. Ed. 2008, 47, 3696–3717. [Google Scholar] [CrossRef] [PubMed]
  34. Asset, T.; Atanassov, P. Iron-Nitrogen-Carbon Catalysts for Proton Exchange Membrane Fuel Cells. Joule 2020, 4, 33–44. [Google Scholar] [CrossRef]
  35. Perazzolo, V.; Durante, C.; Pilot, R.; Paduano, A.; Zheng, J.; Rizzi, G.A.; Martucci, A.; Granozzi, G.; Gennaro, A. Nitrogen and sulfur doped mesoporous carbon as metal-free electrocatalysts for the in situ production of hydrogen peroxide. Carbon 2015, 95, 949–963. [Google Scholar] [CrossRef]
  36. Perazzolo, V.; Durante, C.; Gennaro, A. Nitrogen and sulfur doped mesoporous carbon cathodes for water treatment. J. Electroanal. Chem. 2016, 782, 264–269. [Google Scholar] [CrossRef]
  37. Perazzolo, V.; Grądzka, E.; Durante, C.; Pilot, R.; Vicentini, N.; Rizzi, G.A.; Granozzi, G.; Gennaro, A. Chemical and electrochemical stability of nitrogen and sulphur doped mesoporous carbons. Electrochim. Acta 2016, 197, 251–262. [Google Scholar] [CrossRef]
  38. Brandiele, R.; Picelli, L.; Pilot, R.; Causin, V.; Martucci, A.; Rizzi, G.A.; Isse, A.A.; Durante, C.; Gennaro, A. Nitrogen and Sulfur Doped Mesoporous Carbons, Prepared from Templating Silica, as Interesting Material for Supercapacitors. ChemistrySelect 2017, 2, 7082–7090. [Google Scholar] [CrossRef]
  39. Brandiele, R.; Poli, F.; Picelli, L.; Pilot, R.; Rizzi, G.A.; Soavi, F.; Durante, C. Nitrogen doped mesoporous carbon electrodes prepared from templating propylamine functionalized silica. ChemElectroChem 2020, 92, 455–459. [Google Scholar] [CrossRef]
  40. Perazzolo, V.; Daniel, G.; Brandiele, R.; Picelli, L.; Rizzi, G.A.; Isse, A.A.; Durante, C. PEO-b-PS Block Copolymer Templated Mesoporous Carbons: A Comparative Study of Nitrogen and Sulfur Doping in the Oxygen Reduction Reaction to Hydrogen Peroxide. Chem. A Eur. J. 2021, 27, 1002–1014. [Google Scholar] [CrossRef]
  41. Trevisanello, E.; De Bon, F.; Daniel, G.; Lorandi, F.; Durante, C.; Isse, A.A.; Gennaro, A. Electrochemically mediated atom transfer radical polymerization of acrylonitrile and poly(acrylonitrile-b-butyl acrylate) copolymer as a precursor for N-doped mesoporous carbons. Electrochim. Acta 2018, 285, 344–354. [Google Scholar] [CrossRef]
  42. Daniel, G.; Kosmala, T.; Dalconi, M.C.; Nodari, L.; Badocco, D.; Pastore, P.; Lorenzetti, A.; Granozzi, G.; Durante, C. Upcycling of polyurethane into iron-nitrogen-carbon electrocatalysts active for oxygen reduction reaction. Electrochim. Acta 2020, 362, 137200. [Google Scholar] [CrossRef]
  43. Huang, R.; Lei, Y.; Zhang, D.; Xie, H.; Liu, X.; Wang, H. Solvent-Free Assembled Fe-Chitosan Chelates Derived N-Doped Carbon Layer-Encapsulated Fe/Fe 3 C for ORR and OER. Nano 2020, 15, 2050070. [Google Scholar] [CrossRef]
  44. Wang, W.; Liu, S.; Liu, Y.; Jing, W.; Zhao, R.; Lei, Z. Phenolic resin/chitosan composite derived nitrogen-doped carbon as highly durable and anti-poisoning electrocatalyst for oxygen reduction reaction. Int. J. Hydrog. Energy 2017, 42, 26704–26712. [Google Scholar] [CrossRef]
  45. Aghabarari, B.; Martínez-Huerta, M.V.; Capel-Sánchez, M.C.; Lázaro, M.J. Non-precious Melamine/Chitosan Composites for the Oxygen Reduction Reaction: Effect of the Transition Metal. Front. Mater. 2020, 7, 1–9. [Google Scholar] [CrossRef]
  46. Khan, A.; Goepel, M.; Colmenares, J.C.; Gläser, R. Chitosan-Based N-Doped Carbon Materials for Electrocatalytic and Photocatalytic Applications. ACS Sustain. Chem. Eng. 2020, 8, 4708–4727. [Google Scholar] [CrossRef] [Green Version]
  47. Borghei, M.; Lehtonen, J.; Liu, L.; Rojas, O.J. Advanced Biomass-Derived Electrocatalysts for the Oxygen Reduction Reaction. Adv. Mater. 2018, 30, 1703691. [Google Scholar] [CrossRef]
  48. Zhang, B.; Wang, C.; Liu, D.; Liu, Y.; Yu, X.; Wang, L. Boosting ORR Electrocatalytic Performance of Metal-Free Mesoporous Biomass Carbon by Synergism of Huge Specific Surface Area and Ultrahigh Pyridinic Nitrogen Doping. ACS Sustain. Chem. Eng. 2018, 6, 13807–13812. [Google Scholar] [CrossRef]
  49. Daniel, G.; Zhang, Y.; Lanzalaco, S.; Brombin, F.; Kosmala, T.; Granozzi, G.; Wang, A.; Brillas, E.; Sirés, I.; Durante, C. Chitosan-Derived Nitrogen-Doped Carbon Electrocatalyst for a Sustainable Upgrade of Oxygen Reduction to Hydrogen Peroxide in UV-Assisted Electro-Fenton Water Treatment. ACS Sustain. Chem. Eng. 2020, 8, 14425–14440. [Google Scholar] [CrossRef]
  50. Zhang, G.; Li, L.; Chen, M.; Yang, F. Chitosan cross-linked poly(aminoanthraquinone)/Prussian blue ternary nitrogen precursor-derived Fe–N–C oxygen reduction catalysts for microbial fuel cells and zinc–air batteries. J. Mater. Chem. A 2020, 8, 9256–9267. [Google Scholar] [CrossRef]
  51. Schmitz, C.; Auza, L.G.; Koberidze, D.; Rasche, S.; Fischer, R.; Bortesi, L. Conversion of chitin to defined chitosan oligomers: Current status and future prospects. Mar. Drugs 2019, 17, 452. [Google Scholar] [CrossRef] [Green Version]
  52. Zhong, H.; Duan, L.; Ye, P.; Li, X.; Xu, A.; Peng, Q. Synthesis of cobalt–nitrogen-doped mesoporous carbon from chitosan and its performance for pollutant degradation as Fenton-like catalysts. Res. Chem. Intermediat. 2019, 45, 907–918. [Google Scholar] [CrossRef]
  53. Nie, J.; Wang, Z.; Hu, Q. Difference between Chitosan Hydrogels via Alkaline and Acidic Solvent Systems. Sci. Rep. 2016, 6, 36053. [Google Scholar] [CrossRef] [Green Version]
  54. Tong, X.; Chen, Z.; Zhuo, H.; Hu, Y.; Jing, S.; Liu, J.; Zhong, L. Tailoring the physicochemical properties of chitosan-derived N-doped carbon by controlling hydrothermal carbonization time for high-performance supercapacitor application. Carbohydr. Polym. 2019, 207, 764–774. [Google Scholar] [CrossRef] [PubMed]
  55. Jurca, B.; Bucur, C.; Primo, A.; Concepción, P.; Parvulescu, V.I.; García, H. N-Doped Defective Graphene from Biomass as Catalyst for CO2 Hydrogenation to Methane. ChemCatChem 2019, 11, 985–990. [Google Scholar] [CrossRef]
  56. Liao, C.; Liu, B.; Chi, Q.; Zhang, Z. Nitrogen-Doped Carbon Materials for the Metal-Free Reduction of Nitro Compounds. ACS Appl. Mater. Interfaces 2018, 10, 44421–44429. [Google Scholar] [CrossRef]
  57. Conder, J.; Vaulot, C.; Marino, C.; Villevieille, C.; Ghimbeu, C. Chitin and chitosan—Structurally-related precursors of dissimilar hard carbons for Na-ion battery. ACS Appl. Energy Mater. 2019, 2, 4841–4852. [Google Scholar] [CrossRef]
  58. Qiao, Y.; Kong, F.; Zhang, C.; Li, R.; Kong, A.; Shan, Y. Highly efficient oxygen electrode catalyst derived from chitosan biomass by molten salt pyrolysis for zinc-air battery. Electrochim. Acta 2020, 339. [Google Scholar] [CrossRef]
  59. Li, Y.; Liu, T.; Yang, W.; Zhu, Z.; Zhai, Y.; Gu, W.; Zhu, C. Multiscale porous Fe-N-C networks as highly efficient catalysts for the oxygen reduction reaction. Nanoscale 2019, 11, 19506–19511. [Google Scholar] [CrossRef] [PubMed]
  60. Zhang, Y.; Lu, L.; Zhang, S.; Lv, Z.; Yang, D.; Liu, J.; Chen, Y.; Tian, X.; Jin, H.; Song, W. Biomass chitosan derived cobalt/nitrogen doped carbon nanotubes for the electrocatalytic oxygen reduction reaction. J. Mater. Chem. A 2018, 6, 5740–5745. [Google Scholar] [CrossRef]
  61. Wang, Y.; Li, B.; Zhou, Y.; Jia, D.; Song, Y. CS-Fe(II,III) complex as precursor for magnetite nanocrystal. Polym. Adv. Technol. 2011, 22, 1681–1684. [Google Scholar] [CrossRef]
  62. Thommes, M.; Kaneko, K.; Neimark, A.V.; Olivier, J.P.; Rodriguez-Reinoso, F.; Rouquerol, J.; Sing, K.S.W. Physisorption of gases, with special reference to the evaluation of surface area and pore size distribution (IUPAC Technical Report). Pure Appl. Chem. 2015, 87, 1051–1069. [Google Scholar] [CrossRef] [Green Version]
  63. Poddubnaya, A.M.P.O.I.; Sobiesiak, B.G.M. Comparison of heterogeneous pore models QSDFT and 2D-NLDFT and computer programs ASiQwin and SAIEUS for calculation of pore size distribution. Adsorption 2016, 459–464. [Google Scholar] [CrossRef]
  64. Pérez-Ramírez, J.; Verboekend, D.; Bonilla, A.; Abelló, S. Zeolite Catalysts with Tunable Hierarchy Factor by Pore-Growth Moderators. Adv. Funct. Mater. 2009, 19, 3972–3979. [Google Scholar] [CrossRef]
  65. Ferrari, A.C.; Robertson, J. Interpretation of Raman spectra of disordered and amorphous carbon. Phys. Rev. B 2000, 61, 14095–14107. [Google Scholar] [CrossRef] [Green Version]
  66. Sadezky, A.; Muckenhuber, H.; Grothe, H.; Niessner, R.; Pöschl, U. Raman microspectroscopy of soot and related carbonaceous materials: Spectral analysis and structural information. Carbon 2005, 43, 1731–1742. [Google Scholar] [CrossRef]
  67. Pawlyta, M.; Rouzaud, J.-N.; Duber, S. Raman microspectroscopy characterization of carbon blacks: Spectral analysis and structural information. Carbon 2015, 84, 479–490. [Google Scholar] [CrossRef]
  68. Beyssac, O.; Goffé, B.; Petitet, J.-P.; Froigneux, E.; Moreau, M.; Rouzaud, J.-N. On the characterization of disordered and heterogeneous carbonaceous materials by Raman spectroscopy. Spectrochim. Acta Part A Mol. Biomol. Spectrosc. 2003, 59, 2267–2276. [Google Scholar] [CrossRef]
  69. Malko, D.; Kucernak, A.; Lopes, T. Performance of Fe–N/C Oxygen Reduction Electrocatalysts toward NO2, NO, and NH2OH Electroreduction: From Fundamental Insights into the Active Center to a New Method for Environmental Nitrite Destruction. J. Am. Chem. Soc. 2016, 138, 16056–16068. [Google Scholar] [CrossRef] [Green Version]
  70. Malko, D.; Kucernak, A.; Lopes, T. In situ electrochemical quantification of active sites in Fe–N/C non-precious metal catalysts. Nat. Commun. 2016, 7, 13285–13292. [Google Scholar] [CrossRef] [Green Version]
  71. Ma, Z.; Xu, L.; Liu, L.; Wang, L.; Zhang, X.; Kong, A. Bio-inspired chitosan-heme-vitamin B 12 -derived Fe–Co bimetallic-doped mesoporous carbons for efficiently electro-activating oxygen. Dalt. Trans. 2019, 48, 2338–2344. [Google Scholar] [CrossRef] [PubMed]
Scheme 1. Schematic representation of different steps for the synthesis of chitosan-derived Fe-N-C electrocatalysts.
Catalysts 11 00390 sch001
Figure 1. TEM images of (a,f) Fe-N-C1; (b,g) Fe-N-C2; (c,h) Fe-N-C3; (d,i) Fe-N-C4 and (e,l) Fe-N-C5.
Catalysts 11 00390 g001
Figure 2. (a) N2 adsorption/desorption isotherms and (b) pore size distribution of the investigated catalysts. Micro-, meso- and total (c) surface area and (d) pore volume.
Catalysts 11 00390 g002
Figure 3. (a) Overlay of spectra acquired in different synthetic condition; (b) Full range Raman spectrum for Fe-N-C5; (c) ID1/IG ratio and La variation within the set of Fe-N-C catalysts; (d) D3 and 2D1 band area and G band FWHM within the set of Fe-N-C catalysts.
Catalysts 11 00390 g003
Figure 4. (a) XRD spectra acquired before acid wash in H2SO4; (b) Example of high-resolution core-level XPS spectra of N 1s and deconvolution for Fe-N-C5; (c) Superficial and bulk (NEA) nitrogen content as determined by XPS and elemental analysis, respectively and (d) Surface nitrogen speciation in each Fe-N-Cn catalyst.
Catalysts 11 00390 g004
Figure 5. (a) Cyclic voltammetry of Fe-N-C5 recorded in Ar-purged and O2-saturated 0.5 M H2SO4, v = 2 mV s−1; (b) LSV at RRDE recorded in O2-saturated 0.5 M H2SO4, v = 2 mV s−1 and was ω = 1600 rpm; (c) Kinetic current and half wave potential for Fe-N-Cn; (d) Number of transferred electron for ORR and H2O2 yield determined at 0.7 VRHE for all the investigated catalysts; (e) Correlation between the pyrrolic nitrogen species and H2O2 percentage; (f) Correlation between the graphitization parameter R2 calculated according to Equation (3) and H2O2 percentage; (g) Correlation between the site density determined by nitrosyl stripping and the half wave potential; (h) Correlation between the site density and the hierarchical factor HF determined by Equation(1). In picture e–h, dotted lines are only intended for guiding the eye.
Catalysts 11 00390 g005
Table 1. Different synthetic conditions for chitosan-derived Fe-N-Cn (n = 1–5) electrocatalysts.
SamplesPrecursorsDetails
ChitosanPhenFe(II)Cl2Fe(III)Cl3Fe(Phen)3Cl2Added after First Pyrolysis at 400 °C
Fe-N-C1
Fe-N-C2
Fe-N-C3
Fe-N-C4
Fe-N-C5
Table 2. Physical and chemical properties of some chitosan-based Fe-N-Cn electrocatalysts.
Supports N2 Ads/Desorption Isotherm
C aN aFe bSQSDFTVTOTVQSDFTSμSmHF
%%%m2 g−1cm3 g−1cm3 g−1m2 g−1m2 g−1
Fe-N-C186.780.44n.a.n.a.6270.4770.4253962320.10
Fe-N-C285.570.56n.a.n.a.2550.2140.182157980.09
Fe-N-C381.710.6815.2 c4.9 d3560.2600.2242481080.09
Fe-N-C485.710.9010.0 c0.6 d3600.2750.233268910.07
Fe-N-C589.250.459.6 c0.4 d2330.3370.2531221110.06
a From elemental analysis; b ICP-MS, c Before acid washing; d After acid washing.
Publisher’s Note: MDPI stays neutral with regard to jurisdictional claims in published maps and institutional affiliations.

