
Impact of the Cathode Layer Printing Process on the Performance of MEA Integrating PGM Free Catalyst


Abstract
:1. Introduction
2. Results and Discussion
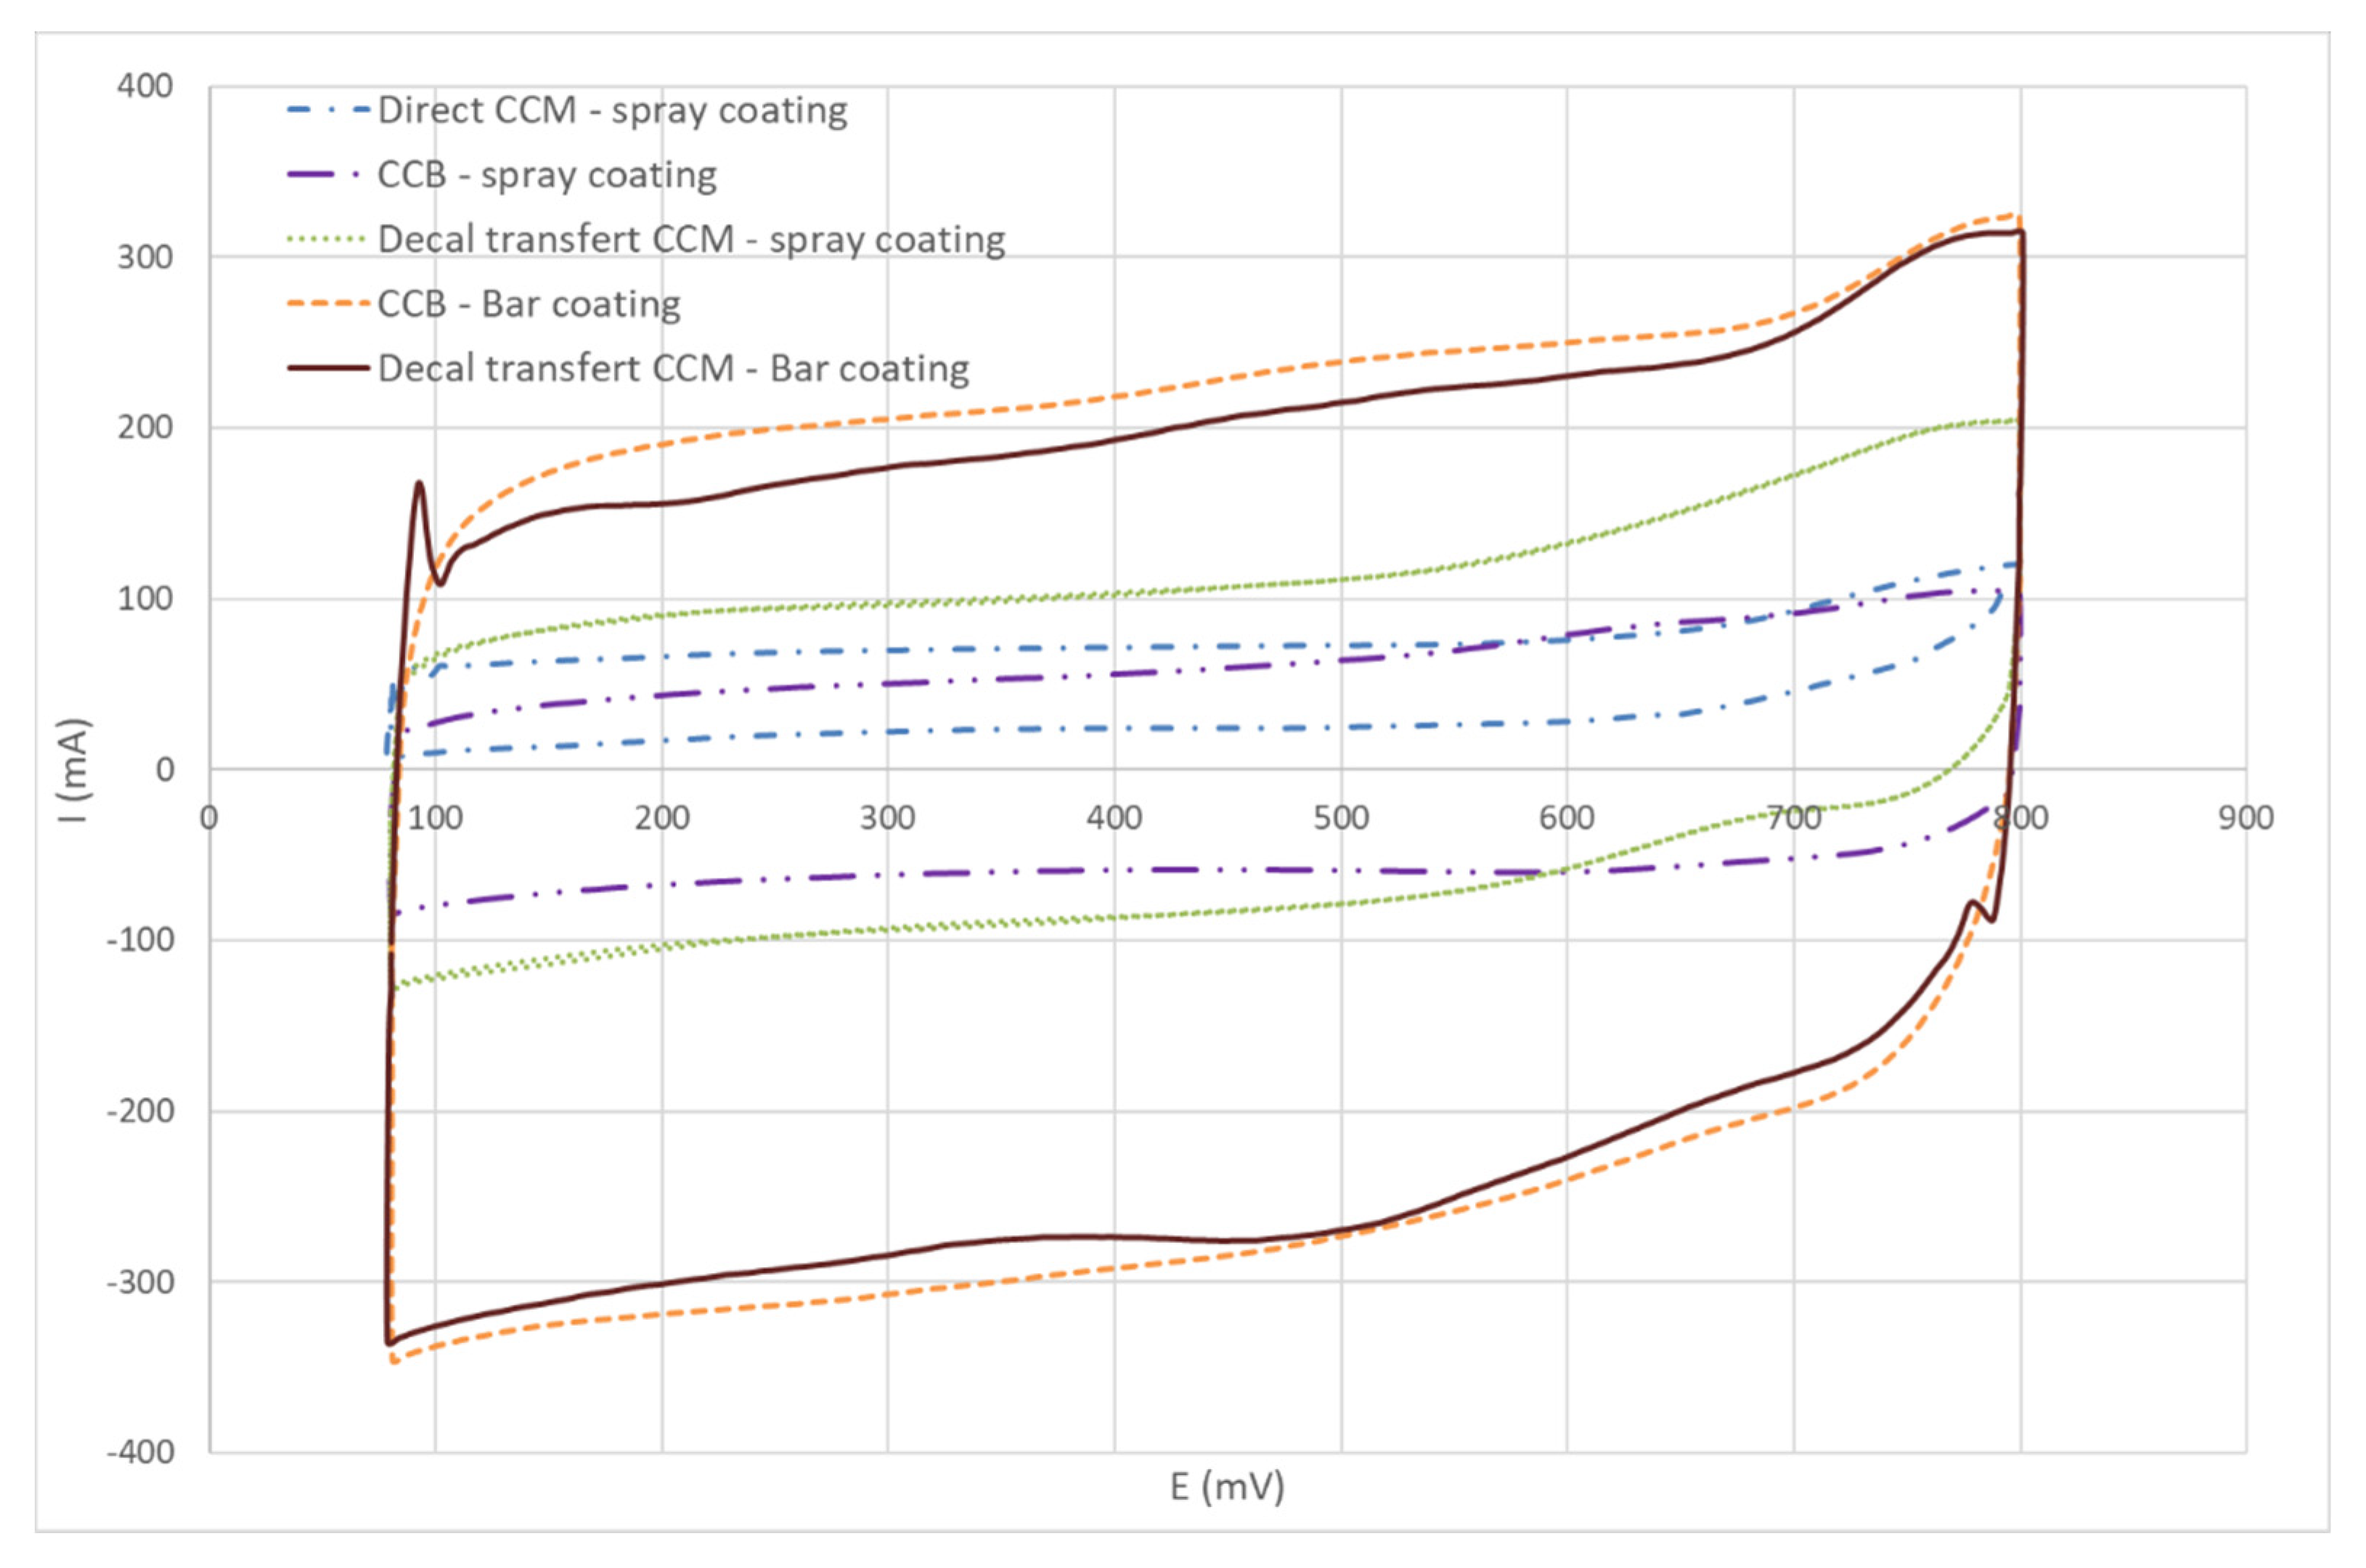
- C in F, I current in mA corresponding to (I+ + I−/2) and (dV/dt) in mV/s.
- EAS in m2/g;
- c double layer capacity in F·m−2 (we assume c = 0.2 F·m−2);
- Sgeo: geometrical surface of the MEA in cm2;
- Loading: total catalyst loading of the cathode in mgcat/cm2;
- Uf in %.
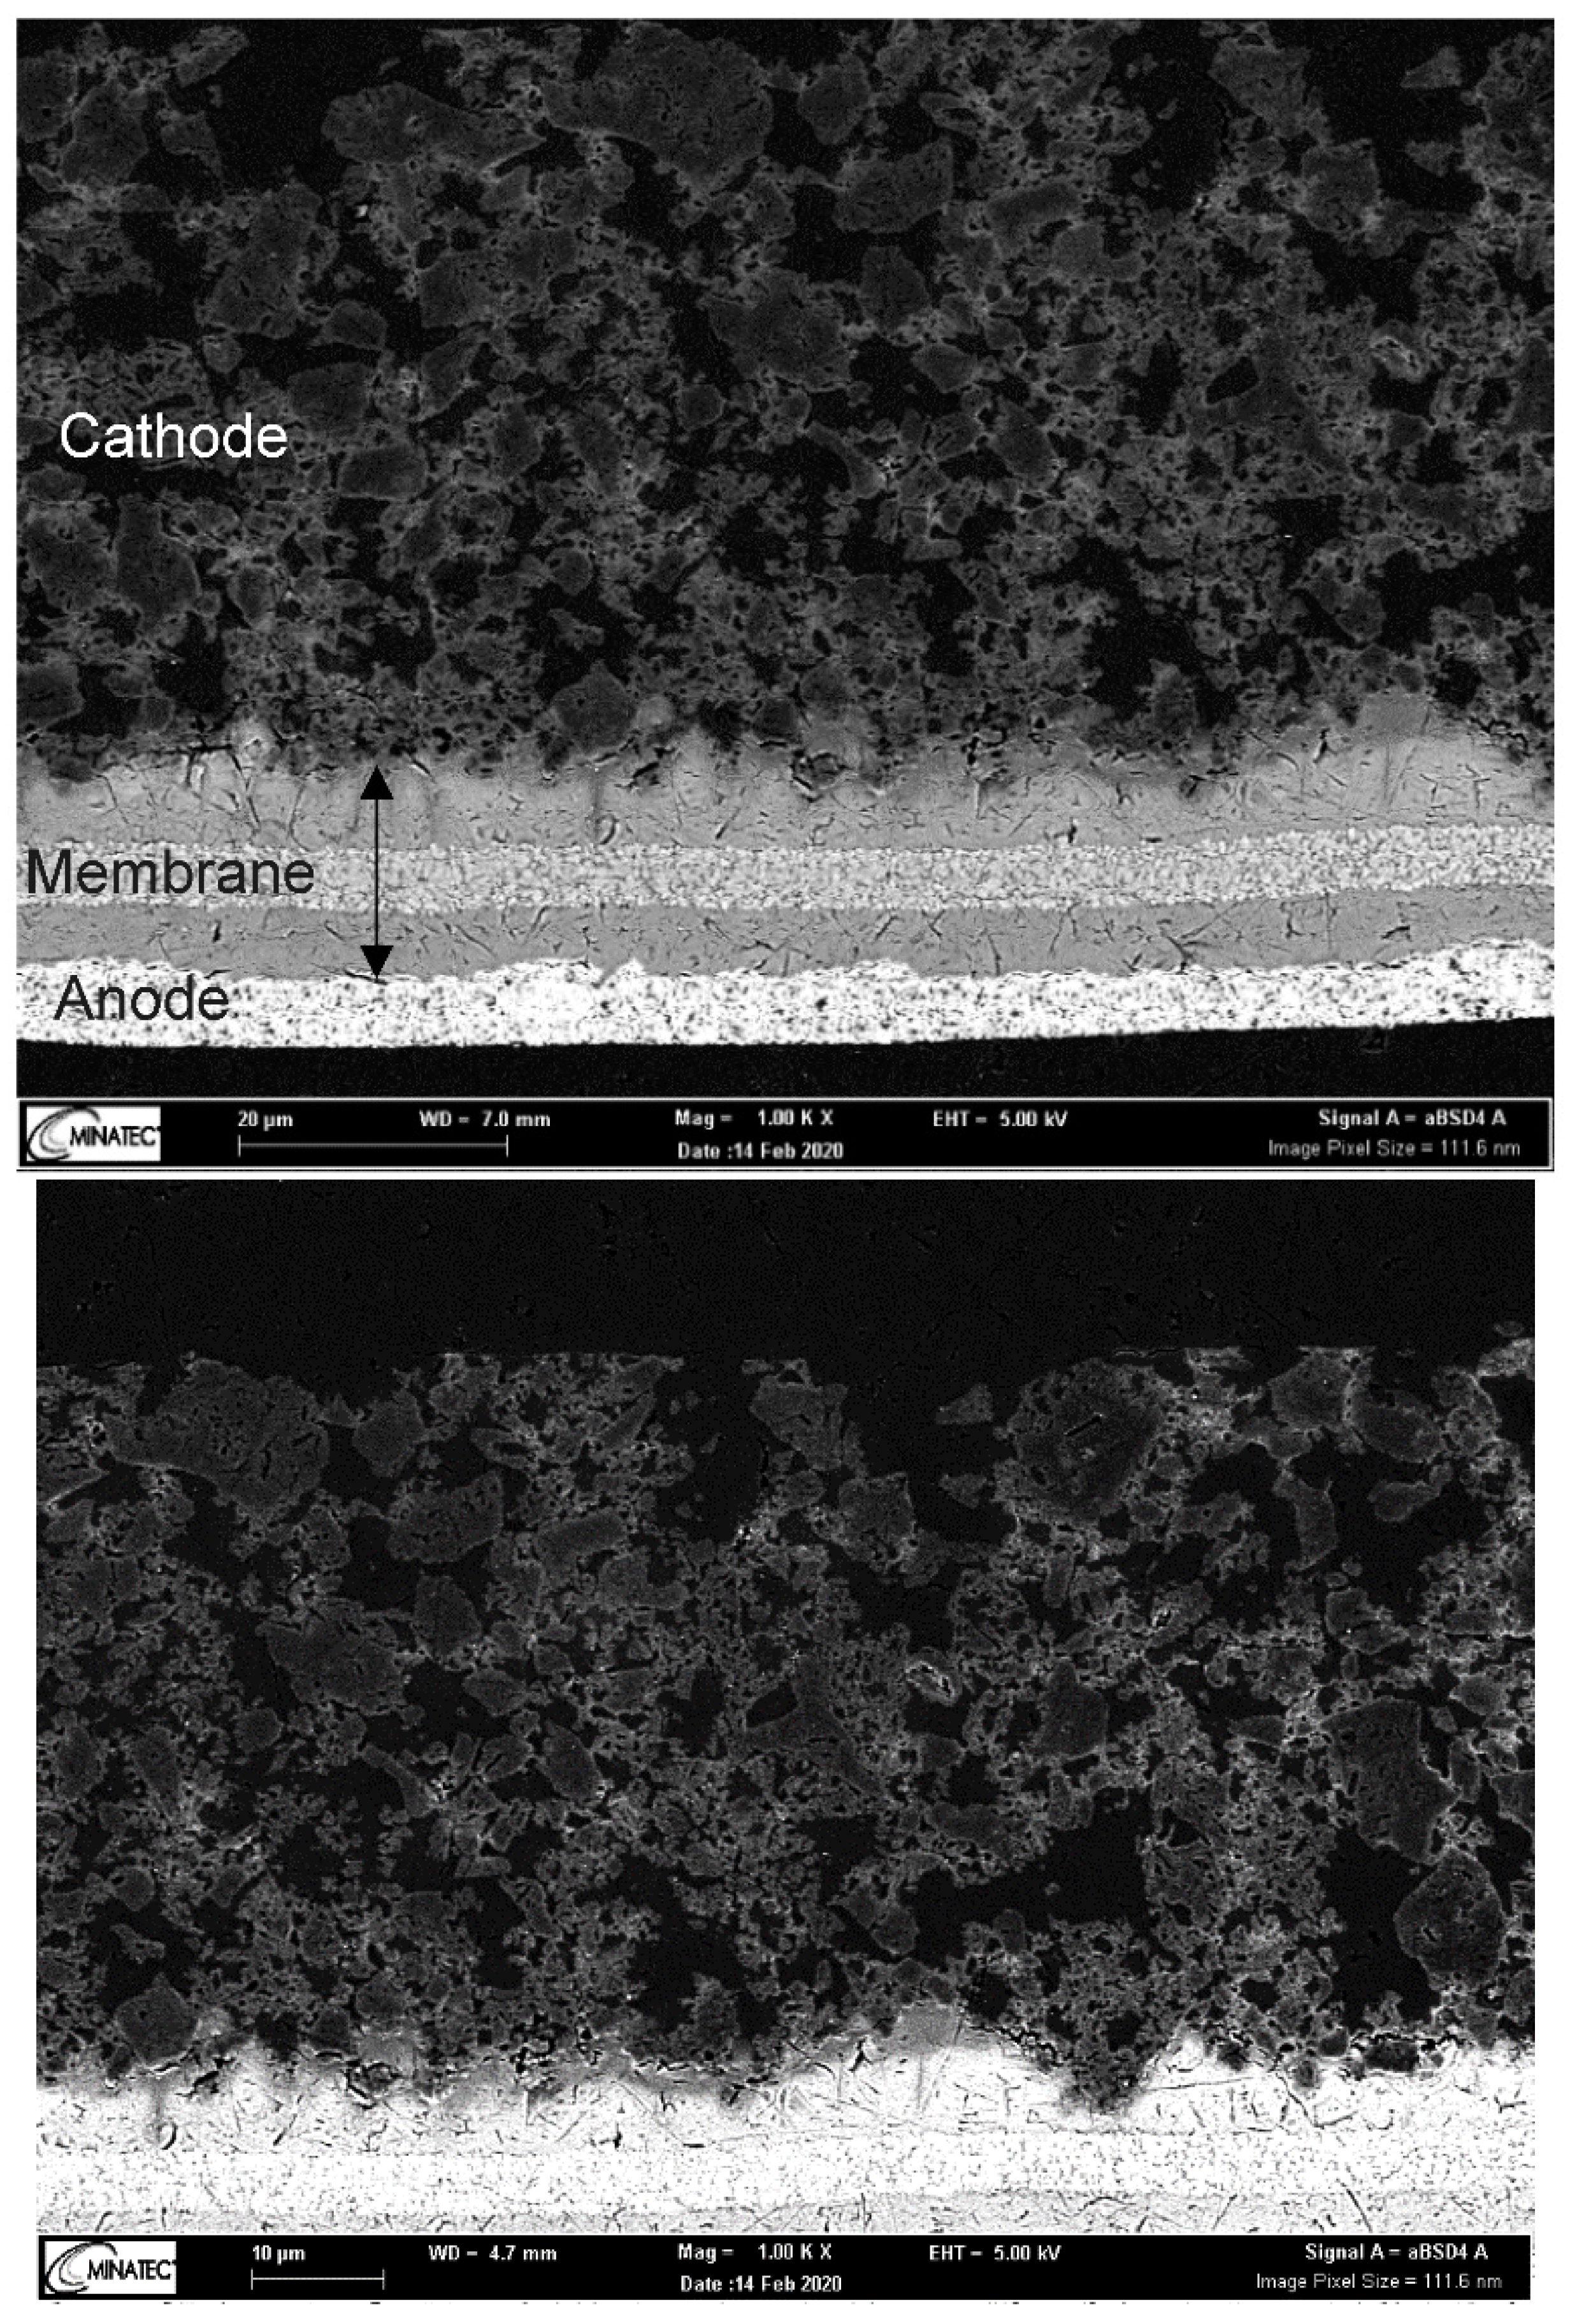
3. Structural Characterization
4. Experimental Methpd
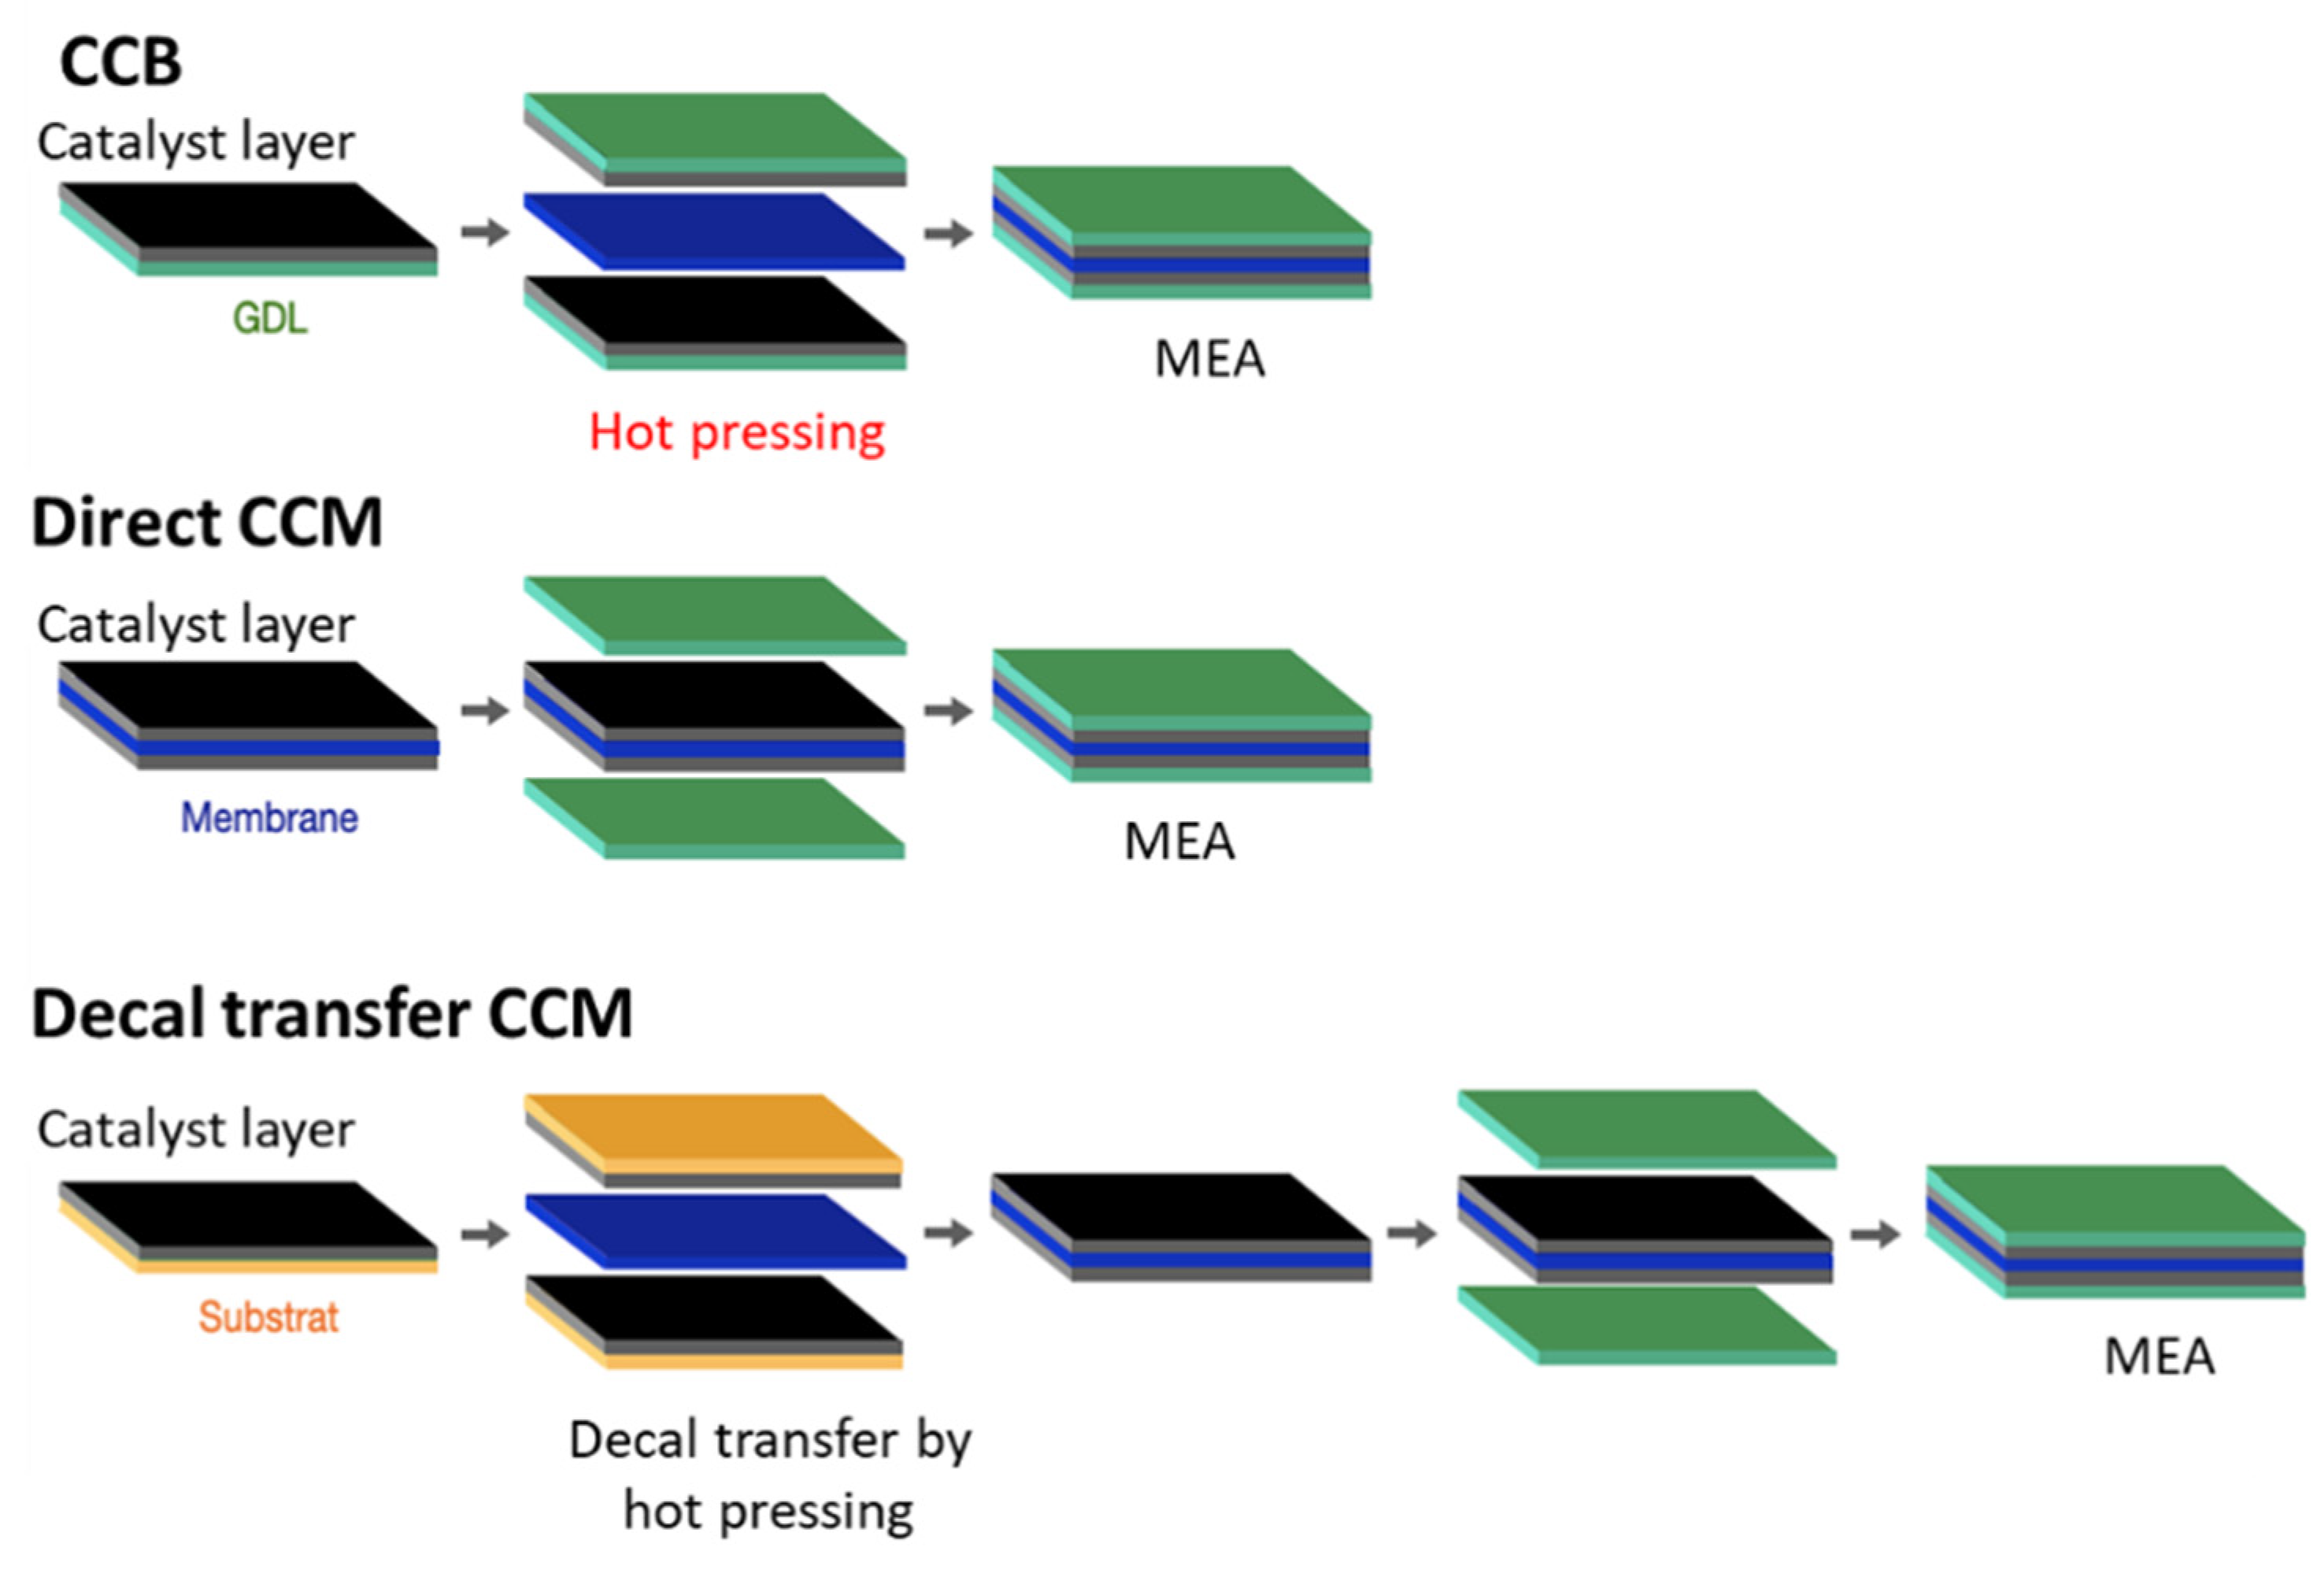
4.1. MEA Preparation
4.1.1. Direct CCM Method
4.1.2. Decal Transfer CCM Method
4.1.3. CCB Method
4.2. Fuel Cell Tests
4.3. Scanning Electron Microscopy (SEM)
5. Conclusions
Author Contributions
Funding
Acknowledgments
Conflicts of Interest
References
- Rabis, A.; Rodriguez, P.; Schmidt, T.J. Electrocatalysis for Polymer Electrolyte Fuel Cells: Recent Achievements and Future Challenges. ACS Catal. 2012, 2, 864–890. [Google Scholar] [CrossRef]
- Costamagna, P.; Srinivasan, S. Quantum Jumps in the PEMFC Science and Technology from the 1960s to the Year 2000: Part I. Fundamental Scientific Aspects. J. Power Sources 2001, 102, 242–252. [Google Scholar] [CrossRef]
- FCH2 JU 2017 AWP and Budget_FINAL-20122016-Clean (ID 2892681).Pdf. Available online: https://www.fch.europa.eu/sites/default/files/FCH2%20JU%202017%20AWP%20and%20Budget_FINAL-20122016-Clean%20%28ID%202892681%29_0.pdf (accessed on 18 May 2020).
- Lèbre, É.; Stringer, M.; Svobodova, K.; Owen, J.R.; Kemp, D.; Côte, C.; Arratia-Solar, A.; Valenta, R.K. The Social and Environmental Complexities of Extracting Energy Transition Metals. Nat. Commun. 2020, 11, 4823. [Google Scholar] [CrossRef]
- Publications Office of the European Union. EU Harmonised Test Protocols for PEMFC MEA Testing in Single Cell Configuration for Automotive Applications. Available online: http://op.europa.eu/en/publication-detail/-/publication/82c28cc6-cef7-11e5-a4b5-01aa75ed71a1 (accessed on 18 May 2020).
- Feng, Y.; Gago, A.; Timperman, L.; Alonso-Vante, N. Chalcogenide Metal Centers for Oxygen Reduction Reaction: Activity and Tolerance. Electrochim. Acta 2011, 56, 1009–1022. [Google Scholar] [CrossRef]
- Higgins, D.C.; Hassan, F.M.; Seo, M.H.; Choi, J.Y.; Hoque, M.A.; Lee, D.U.; Chen, Z. Shape-Controlled Octahedral Cobalt Disulfide Nanoparticles Supported on Nitrogen and Sulfur-Doped Graphene/Carbon Nanotube Composites for Oxygen Reduction in Acidic Electrolyte. J. Mater. Chem. A 2015, 3, 6340–6350. [Google Scholar] [CrossRef]
- Li, L.; Dai, P.; Gu, X.; Wang, Y.; Yan, L.; Zhao, X. High Oxygen Reduction Activity on a Metal–Organic Framework Derived Carbon Combined with High Degree of Graphitization and Pyridinic-N Dopants. J. Mater. Chem. A 2017, 5, 789–795. [Google Scholar] [CrossRef]
- Zhang, L.; Wilkinson, D.P.; Liu, Y.; Zhang, J. Progress in Nanostructured (Fe or Co)/N/C Non-Noble Metal Electrocatalysts for Fuel Cell Oxygen Reduction Reaction. Electrochim. Acta 2018, 262, 326–336. [Google Scholar] [CrossRef]
- Bashyam, R.; Zelenay, P. A Class of Non-Precious Metal Composite Catalysts for Fuel Cells. Nature 2006, 443, 63–66. [Google Scholar] [CrossRef]
- Jaouen, F.; Proietti, E.; Lefèvre, M.; Chenitz, R.; Dodelet, J.-P.; Wu, G.; Chung, H.T.; Johnston, C.M.; Zelenay, P. Recent Advances in Non-Precious Metal Catalysis for Oxygen-Reduction Reaction in Polymer Electrolyte Fuel Cells. Energy Environ. Sci. 2010, 4, 114–130. [Google Scholar] [CrossRef]
- Villers, D.; Jacques-Bédard, X.; Dodelet, J.-P. Fe-Based Catalysts for Oxygen Reduction in PEM Fuel Cells Pretreatment of the Carbon Support. J. Electrochem. Soc. 2004, 151, A1507–A1515. [Google Scholar] [CrossRef]
- Strickland, K.; Miner, E.; Jia, Q.; Tylus, U.; Ramaswamy, N.; Liang, W.; Sougrati, M.-T.; Jaouen, F.; Mukerjee, S. Highly Active Oxygen Reduction Non-Platinum Group Metal Electrocatalyst without Direct Metal–Nitrogen Coordination. Nat. Commun. 2015, 6, 7343. [Google Scholar] [CrossRef] [PubMed] [Green Version]
- Weber, A.Z.; Borup, R.L.; Darling, R.M.; Das, P.K.; Dursch, T.J.; Gu, W.; Harvey, D.; Kusoglu, A.; Litster, S.; Mench, M.M.; et al. A Critical Review of Modeling Transport Phenomena in Polymer-Electrolyte Fuel Cells. J. Electrochem. Soc. 2014, 161, F1254–F1299. [Google Scholar] [CrossRef] [Green Version]
- Asset, T.; Atanassov, P. Iron-Nitrogen-Carbon Catalysts for Proton Exchange Membrane Fuel Cells. Joule 2020, 4, 33–44. [Google Scholar] [CrossRef]
- Beltrán, D.E.; Litster, S. Half-Wave Potential or Mass Activity? Characterizing Platinum Group Metal-Free Fuel Cell Catalysts by Rotating Disk Electrodes. ACS Energy Lett. 2019, 4, 1158–1161. [Google Scholar] [CrossRef] [Green Version]
- Yin, X.; Lin, L.; Chung, H.T.; Babu, S.K.; Martinez, U.; Purdy, G.M.; Zelenay, P. Effects of MEA Fabrication and Ionomer Composition on Fuel Cell Performance of PGM-Free ORR Catalyst. ECS Trans. 2017, 77, 1273–1281. [Google Scholar] [CrossRef]
- Malko, D.; Lopes, T.; Ticianelli, E.A.; Kucernak, A. A Catalyst Layer Optimisation Approach Using Electrochemical Impedance Spectroscopy for PEM Fuel Cells Operated with Pyrolysed Transition Metal-N-C Catalysts. J. Power Sources 2016, 323, 189–200. [Google Scholar] [CrossRef] [Green Version]
- Stariha, S.; Artyushkova, K.; Workman, M.J.; Serov, A.; Mckinney, S.; Halevi, B.; Atanassov, P. PGM-Free Fe-N-C Catalysts for Oxygen Reduction Reaction: Catalyst Layer Design. J. Power Sources 2016, 326, 43–49. [Google Scholar] [CrossRef]
- Babu, S.K.; Chung, H.T.; Zelenay, P.; Litster, S. Modeling Electrochemical Performance of the Hierarchical Morphology of Precious Group Metal-Free Cathode for Polymer Electrolyte Fuel Cell. J. Electrochem. Soc. 2017, 164, F1037–F1049. [Google Scholar] [CrossRef]
- Banham, D.; Choi, J.-Y.; Kishimoto, T.; Ye, S. Integrating PGM-Free Catalysts into Catalyst Layers and Proton Exchange Membrane Fuel Cell Devices. Adv. Mater. 2019, 31, 1804846. [Google Scholar] [CrossRef]
- Kongkanand, A.; Subramanian, N.P.; Yu, Y.; Liu, Z.; Igarashi, H.; Muller, D.A. Achieving High-Power PEM Fuel Cell Performance with an Ultralow-Pt-Content Core–Shell Catalyst. ACS Catal. 2016, 6, 1578–1583. [Google Scholar] [CrossRef]
- Banham, D.; Kishimoto, T.; Zhou, Y.; Sato, T.; Bai, K.; Ozaki, J.; Imashiro, Y.; Ye, S. Critical Advancements in Achieving High Power and Stable Nonprecious Metal Catalyst–Based MEAs for Real-World Proton Exchange Membrane Fuel Cell Applications. Sci. Adv. 2018, 4, eaar7180. [Google Scholar] [CrossRef] [PubMed] [Green Version]
- Chen, L.; Wu, G.; Holby, E.F.; Zelenay, P.; Tao, W.-Q.; Kang, Q. Lattice Boltzmann Pore-Scale Investigation of Coupled Physical-Electrochemical Processes in C/Pt and Non-Precious Metal Cathode Catalyst Layers in Proton Exchange Membrane Fuel Cells. Electrochim. Acta 2015, 158, 175–186. [Google Scholar] [CrossRef]
- Liu, J.; Talarposhti, M.R.; Asset, T.; Sabarirajan, D.C.; Parkinson, D.Y.; Atanassov, P.; Zenyuk, I.V. Understanding the Role of Interfaces for Water Management in Platinum Group Metal-Free Electrodes in Polymer Electrolyte Fuel Cells. ACS Appl. Energy Mater. 2019, 2, 3542–3553. [Google Scholar] [CrossRef]
- Lopez-Haro, M.; Guétaz, L.; Printemps, T.; Morin, A.; Escribano, S.; Jouneau, P.-H.; Bayle-Guillemaud, P.; Chandezon, F.; Gebel, G. Three-Dimensional Analysis of Nafion Layers in Fuel Cell Electrodes. Nat. Commun. 2014, 5, 5229. [Google Scholar] [CrossRef] [PubMed]
- Serov, A.; Artyushkova, K.; Niangar, E.; Wang, C.; Dale, N.; Jaouen, F.; Sougrati, M.-T.; Jia, Q.; Mukerjee, S.; Atanassov, P. Nano-Structured Non-Platinum Catalysts for Automotive Fuel Cell Application. Nano Energy 2015, 16, 293–300. [Google Scholar] [CrossRef] [Green Version]


| Coating Technique | Loading (mgcat/cm2) | I+ + I− (mA) | EAS (m2/g) | Average EAS (m2/g) | Uf (%) |
|---|---|---|---|---|---|
| Direct CCM—spray coating-1 | 2 | 47 | 47 | 63 ± 16 | 12 ± 3 |
| Direct CCM—spray coating-2 | 2 | 78 | 78 | ||
| CCB—Spray coating-1 | 2 | 112 | 112 | 116 ±14 | 22 ± 3 |
| CCB—Spray coating-2 | 2 | 119 | 119 | ||
| Decal transfer CCM—Spray coating-1 | 2 | 189 | 189 | 237 ± 48 | 46 ± 9 |
| Decal transfer CCM—Spray coating-2 | 1.17 | 167 | 285 | ||
| CCB—Bar coating-1 | 2 | 510 | 510 | 489 ± 21 | 94 ± 4 |
| CCB—Bar coating-2 | 2.8 | 654 | 467 | ||
| Decal transfer CCM—Bar coating-1 | 2.3 | 460 | 400 | 411 ± 11 | 79 ± 4 |
| Decal transfer CCM—Bar coating-2 | 2.3 | 485 | 422 |
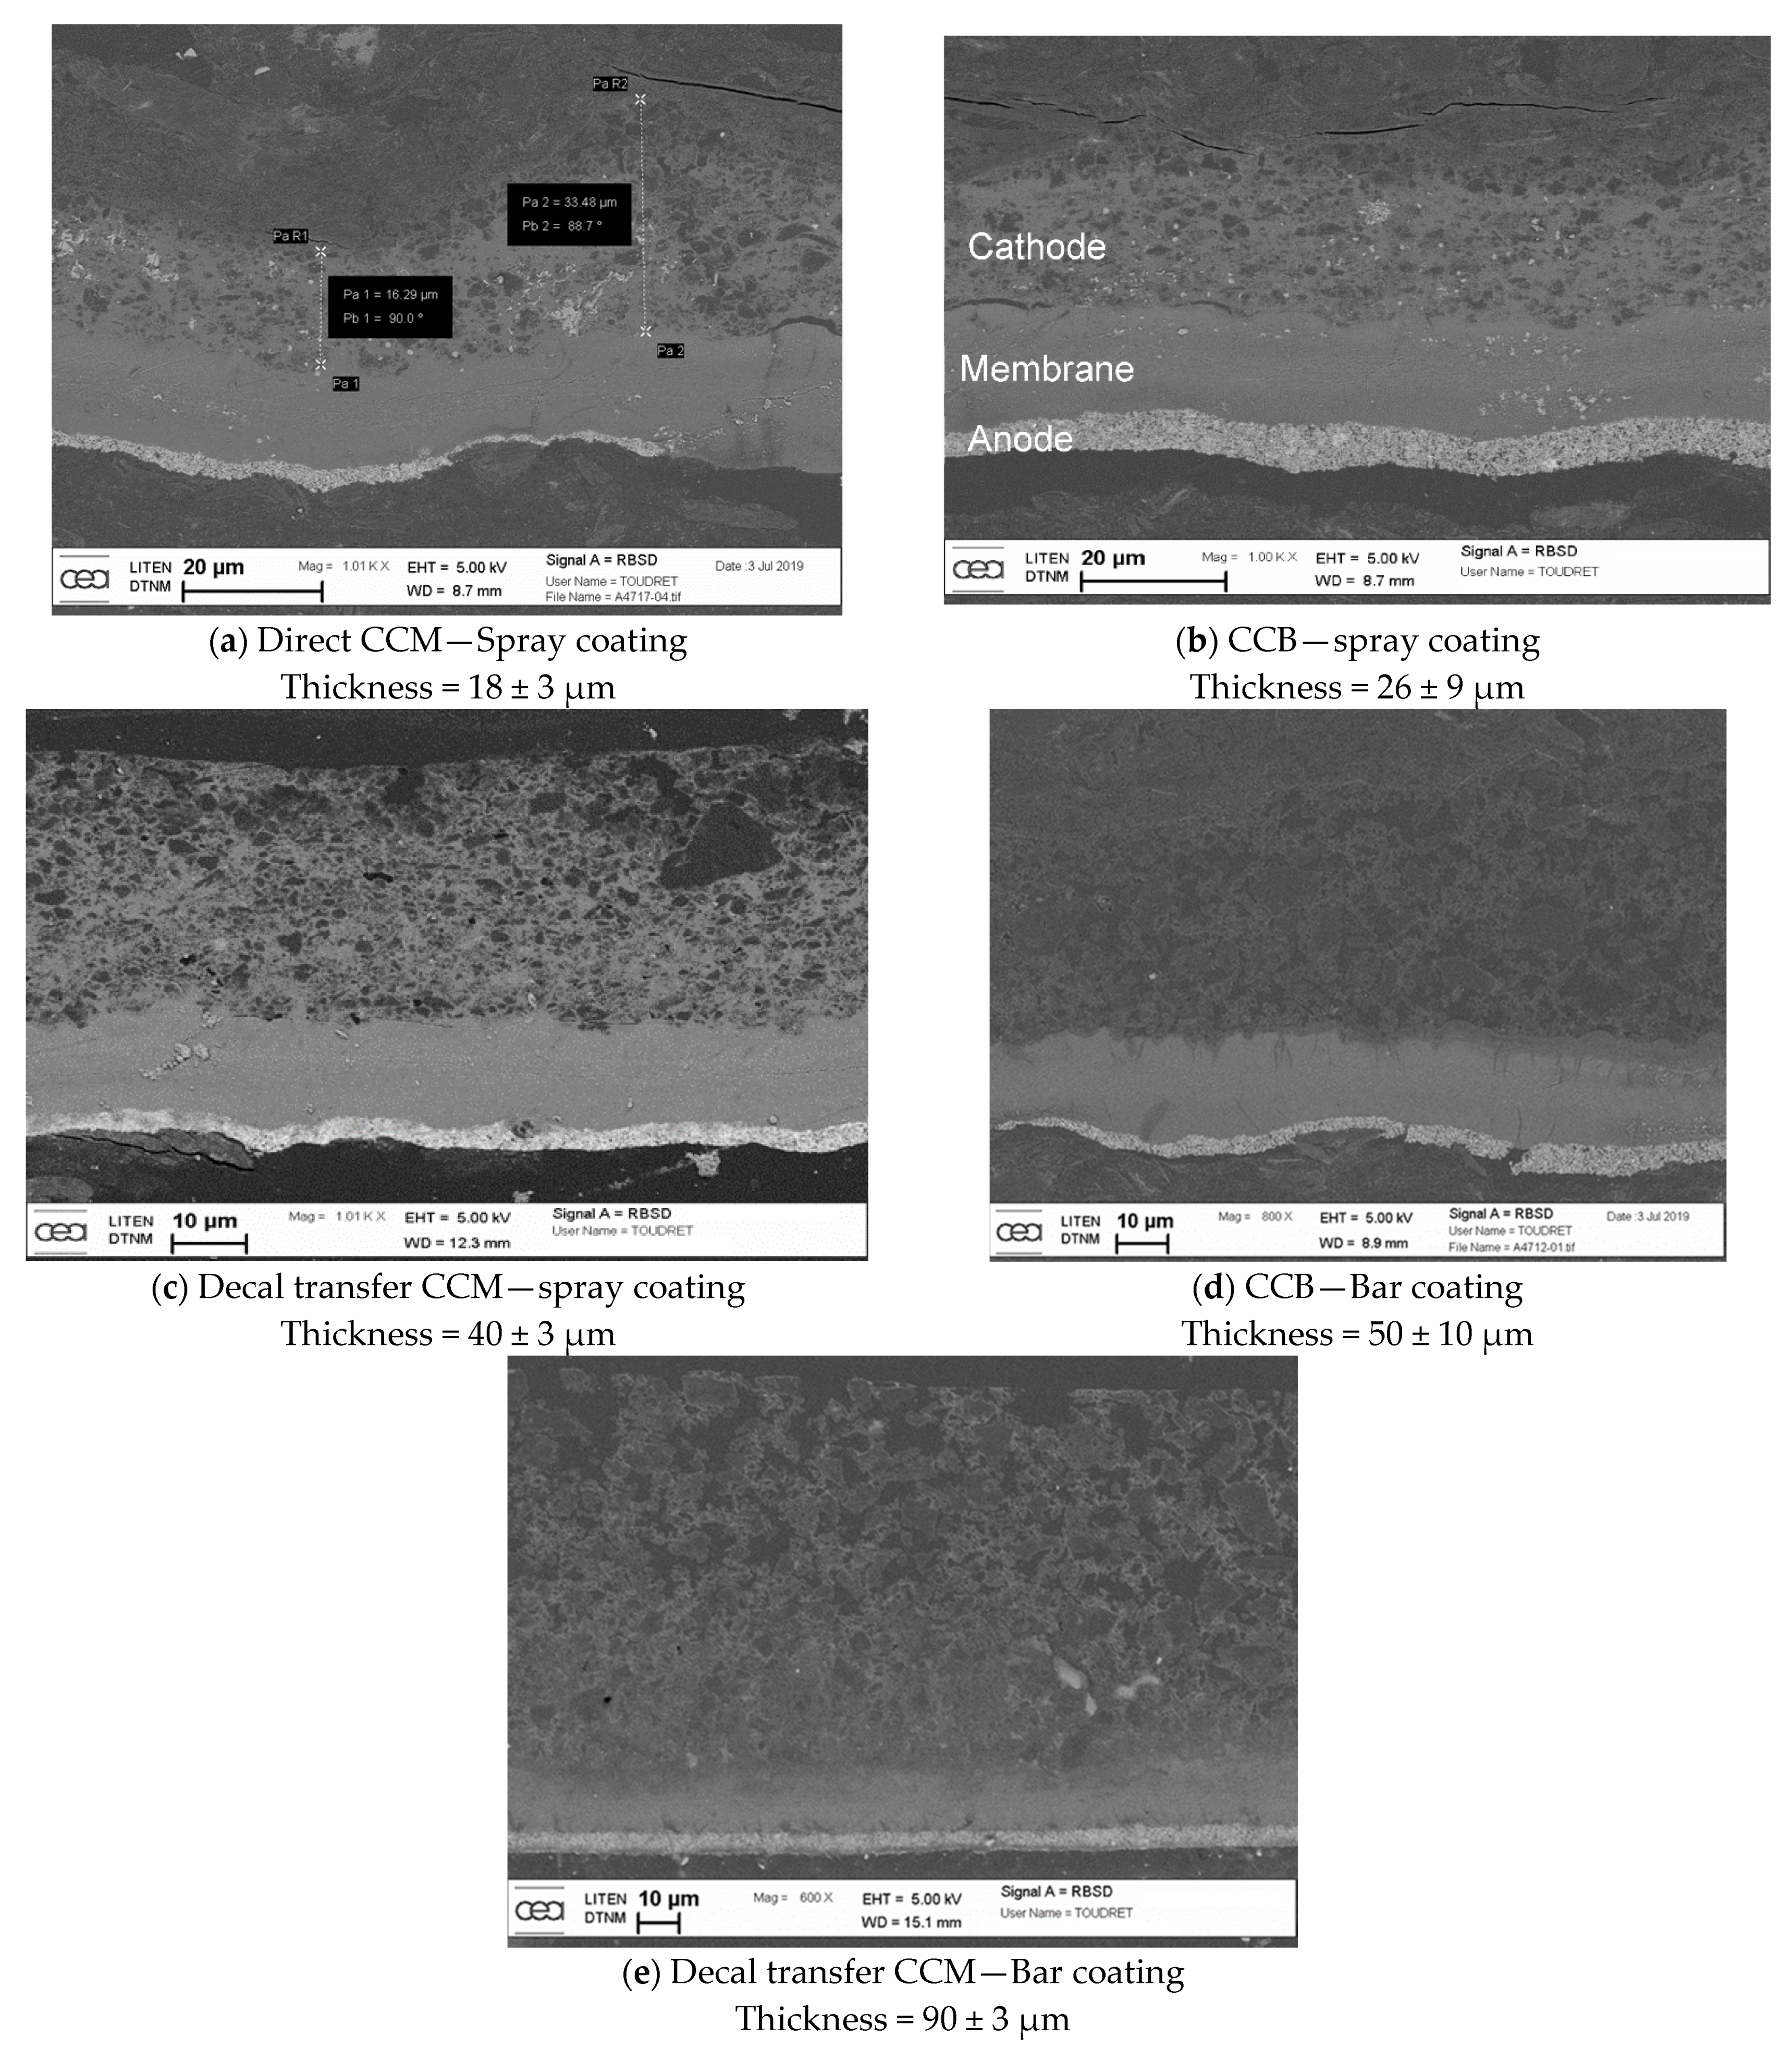
| MEA | Cathode Average Thickness (µm) | Cathode Thickness Variation (µm) |
|---|---|---|
| Direct CCM—spray coating | 18 | 3 |
| CCB—Spray coating | 26 | 9 |
| Decal transfer CCM—Spray coating | 40 | 3 |
| CCB—Bar coating | 50 | 10 |
| Decal transfer CCM—Bar coating | 90 | 3 |
| Condition | Cell Temperature (°C) | Anode | Cathode | ||||||||
|---|---|---|---|---|---|---|---|---|---|---|---|
| Gas | RH (%) | Pressure (Bara) | Flow (mL/min) | Stoichiometry | Gas | RH (%) | Pressure (Bara) | Flow (mL/min) | Stoichiometry | ||
| 1 | 80 | H2 | 80 | 1.5 | 522 | - | Air | 80 | 1.5 | 1243 | - |
| 2 | 80 | H2 | 50 | 1.5 | - | 1.2 | Air | 50 | 1.5 | - | 2 |
| 3 | 80 | H2 | 50 | 2.5 | - | 1.3 | Air | 30 | 2.3 | - | 1.5 |
| 4 | 80 | H2 | 50 | 1.5 | - | 1.2 | Air | 50 | 1.5 | - | 2 |
| 5 | 80 | H2 | 50 | 1.5 | - | 1.2 | 02 | 50 | 1.5 | - | 5 |
| 6 | 80 | H2 | 100 | 1.5 | 150 | - | N2 | 100 | 1.5 | 400 | - |
Publisher’s Note: MDPI stays neutral with regard to jurisdictional claims in published maps and institutional affiliations. |
© 2021 by the authors. Licensee MDPI, Basel, Switzerland. This article is an open access article distributed under the terms and conditions of the Creative Commons Attribution (CC BY) license (https://creativecommons.org/licenses/by/4.0/).
Share and Cite
Toudret, P.; Blachot, J.-F.; Heitzmann, M.; Jacques, P.-A. Impact of the Cathode Layer Printing Process on the Performance of MEA Integrating PGM Free Catalyst. Catalysts 2021, 11, 669. https://0-doi-org.brum.beds.ac.uk/10.3390/catal11060669
Toudret P, Blachot J-F, Heitzmann M, Jacques P-A. Impact of the Cathode Layer Printing Process on the Performance of MEA Integrating PGM Free Catalyst. Catalysts. 2021; 11(6):669. https://0-doi-org.brum.beds.ac.uk/10.3390/catal11060669
Chicago/Turabian StyleToudret, Pierre, Jean-François Blachot, Marie Heitzmann, and Pierre-André Jacques. 2021. "Impact of the Cathode Layer Printing Process on the Performance of MEA Integrating PGM Free Catalyst" Catalysts 11, no. 6: 669. https://0-doi-org.brum.beds.ac.uk/10.3390/catal11060669