Article

Economic and Ultrafast Photocatalytic Degradation of Orange II Using Ceramic Powders

1
Laboratory of Active Components and Materials, University of Oum El Bouaghi, Oum El Bouaghi 04000, Algeria
2
Ceramics Lab, Mentouri University of Constantine, Constantine 25000, Algeria
3
MOLTECH-Anjou, Université d’Angers/UMR CNRS 6200, 2 bd Lavoisier, 49045 Angers, France
4
Laboratory of Materials and Structure of Electromechanical Systems and Their Reliability, Faculty of Sciences and Technology, University of Larbi Ben M’Hidi, Oum El Bouaghi 04000, Algeria
*
Author to whom correspondence should be addressed.
Submission received: 13 May 2021 / Revised: 7 June 2021 / Accepted: 10 June 2021 / Published: 14 June 2021
(This article belongs to the Special Issue Recent Advances in Photocatalysis Technology in Europe and Asia)

Abstract

:
Different percentages of CuO and ZnO were added into a local kaolin ceramic-based powder (DD3) with and without ZrO2. The modified powders were first characterized, then, a test for the photocatalytic degradation of dyes with orange II (OII) was carried out. The DD3 powders that were obtained with the addition of ZrO2, ZnO, and CuO, were prepared by two different methods and have shown a large and very fast photocatalytic activity. Discoloration ratios of about 93.6% and 100% were reached after 15 min and 45 min, for CuO and ZnO respectively. Finally, an alternative photocatalysis mechanism, based purely on chemical reaction processes, is proposed. The photocatalysis results with modified powders are compared with the results obtained with thin films, made with the same materials.

Graphical Abstract

1. Introduction

In recent years, the world has seen a large population growth and an increase in huge modern industries. These factors significantly enlarge the percentage of everyday disposed wastes. Most of this waste, one way or another, begins or ends in rivers, leading to terrible pollution. In order to face this problem, ceramics have been used as a raw material for the purification of water [1,2]. The choice of this raw material was motivated by the large availability of ceramics in nature at a low cost, particularly in Algeria. Many countries in the world have abundantly these raw materials such as calcium carbonates (CaCO3), dolomite (CaCO3.MgCO3), bones (natural derived hydroxyapatite (HA): Ca10(PO4)6(OH)2), kaolin, feldspar, and quartz. Many works have already been published for valorizing these native raw materials for the production of ceramic membranes [3,4,5]. Besides these studies, other interesting works were also published on both advanced ceramics [6,7] and bio-ceramics [8]. All of these publications are closely related to the goal of this present work and clearly draw attention to possible multifunctional applications.
Since ceramic filters are generally constituted of a thick support (2000 μm) with mono or multi thin membranes (from 10 to 40 μm for each one), the replacement of the more expensive base materials, mentioned above, by other cheaper raw materials used in supports (which constitute about 99% of the filter mass), is significantly important. Consequently, considering this goal, ceramic based supports [9], and/or other supports [10,11], were applied for the elaboration of low-cost ceramic microfiltration membranes applied to the sterilization of plant tissue culture media [12]. Concerning bio-ceramic publications [13], a lot of low-cost materials were also employed, based on the abundantly available raw materials previously mentioned above. More recently, HA (Hydroxyapatite) based ceramics were fabricated from natural HA using an original milling system, carried out by A. Harabi and E. Harabi [14]. In this study, a particular desktop wet milling setup has been proposed to obtain sub-micron sized HA powders. In addition, a simple and instant visual approach of the animal bone age classification is proposed.
Generally speaking, there are two main filtration methods of polluting (or contaminating) waste materials. The first one consists of physical filtration of polluting particles (ceramic membrane filtration) using economic and abundantly raw materials [15,16]. By contrast, the second method allows (based on the photocatalytic activity) the discoloration or degradation with powders by chemical reactions. Opportunely, the zone of Jebel Debbagh, located in Guelma in the east of Algeria, is among the richest areas for kaolinitic clays of different types. Therefore, kaolinitic clays, named DD3, have been selected in the present study.
However, this raw material is not sufficient alone for a fine filtration. Numerous studies have shown that by adding several elements, an increase in the degree of its efficiency can be observed [17,18]. Water purification using zinc oxide (ZnO) is one of the most popular materials. In this work, an optimal material for filtration was fabricated. The ceramic is the main material and other contents were mixed. A content of 38 wt% ZrO2 is the best value for an optimal pore diameter and is added to the DD3 kaolinitic clay. These two materials were mixed and treated at 1300 °C for 2 h. This step is performed for a composite of mullite and zircon with a rate of suitable porosity of 33% [19]. The resulting ceramic is used as a photo-reactor in the goal to absorb impurities from a polluting solution. The obtained absorption rate was adequate but not satisfactory. In order to improve this rate, additive materials that are also available at a low cost were used. These additives are acetates, copper, and zinc oxides (depending on the method of preparation). These two oxides are known for their stimulation of interactions in the aqueous solution [20]. In addition to this feature, ZnO is known for its high photosensitivity, stability at high bandwidth [21] and its ability for degradation of many environmental contaminants (a good photocatalyst) [22]. The copper oxide and zinc oxide are non-toxic p-type and n semiconductors, respectively. Their energy band gap is Eg = 1.2 eV for CuO and Eg = 3.4 eV for ZnO [23,24]. In addition, these two oxides may improve the properties of the catalyst. These results have shown their efficiencies in several applications [25,26]. Indeed, once the oxides are prepared, their ions, whose role is to absorb existent impurities in dyes (for example orange II solution), allow the development of photocatalyst materials and lead to optimize the efficiency for depollution.
In this work, different methods are applied to the powder fabrication, namely co-precipitation and traditional mixture. The material is a kaolin-based material, functionalized with different oxides. The effects of these two different methods for the material preparation are tested for the photocatalysis of a dye. The efficiency of the photodegradation is studied and a mechanism is proposed. The results obtained showe that the degradation of a dye (orange II (OII)) reached 94.4% for the use of powders prepared by the co-precipitation method, after about 45 min. For powders prepared by the mixing method, a degradation rate of 93.63% was obtained after 15 min. The addition of ZnO, which is mainly for the ceramics modified with ZrO2, increases the efficiency. The experimental results of the prepared ceramic-based materials for the degradation of a dye are compared with the thin film results made with the same materials and applied on different dyes for degradation.

2. Experimental Studies

2.1. Xray Diffraction

The powders produced by different methods of preparation were treated at 500 °C and characterized by X-ray diffraction (XRD). The obtained results are shown in Figure 1a–f. Figure 1a,b present DD3 ceramic powders prepared by a traditional mix, while Figure 1c,d are related to the same ceramic prepared by a co-precipitation method. In addition to the peaks of the ceramic phases (mullite (JCPDS 15-0776), zircon (JCPDS 06-0266), zirconia (JCPDS 37-1484), and cristobalite (JCPDS 39-1425)), it is noted that on all the spectra there are suitable intensity peaks of ZnO, in particular for a content of 50 wt%. The diffraction angles of these peaks are as follows: 36.42° for DD3 (Figure 1e) and 36.24°, 36.35° for DD3Z (Figure 1f) are compared with JCPDS No.36-1451 file and a ZnO hexagonal phase of Wurtzite type was found. By contrast, it can be noted that for the spectra of the ceramic containing ZnO and CuO, the peaks characterizing copper oxide appear only for samples with 12.5 wt% and 5.35 wt%. For other samples (2.8 wt% CuO), there is no peak of CuO and this may be due to the weakness of the added oxide content that cannot be detected by the XRD [27]. It is also possible that this absence of peaks is due to the superposition of CuO peaks on other phases. The peaks of the XRD spectra slightly shift to lower angles (Figure 1a,c) and to the higher angles in the same Figure 1b,d. The addition of CuO contributes to a variation of the lattice parameters which results in a slight shift of the peaks. This can be also explained by a substitution of the atoms of the ceramic structure by the Cu2 + ions [28]. The results are presented in the Table A1 (Appendix E).
The comparison between the results obtained by the different methods of preparation shows that the peaks in the XRD spectra of samples prepared by co-precipitation are thinner than those of the samples prepared by the traditional mixing. Consequently, it is found that by using the co-precipitation method, finer grains are obtained.
The grain sizes of the powders can be extracted from the XRD data (see Appendix E. Table A1 in Appendix E gives the results for DD3 before and after addition of Zn and Cu and for DD3 + 38% ZrO2 (DD3Z) after addition of Zn and Cu.

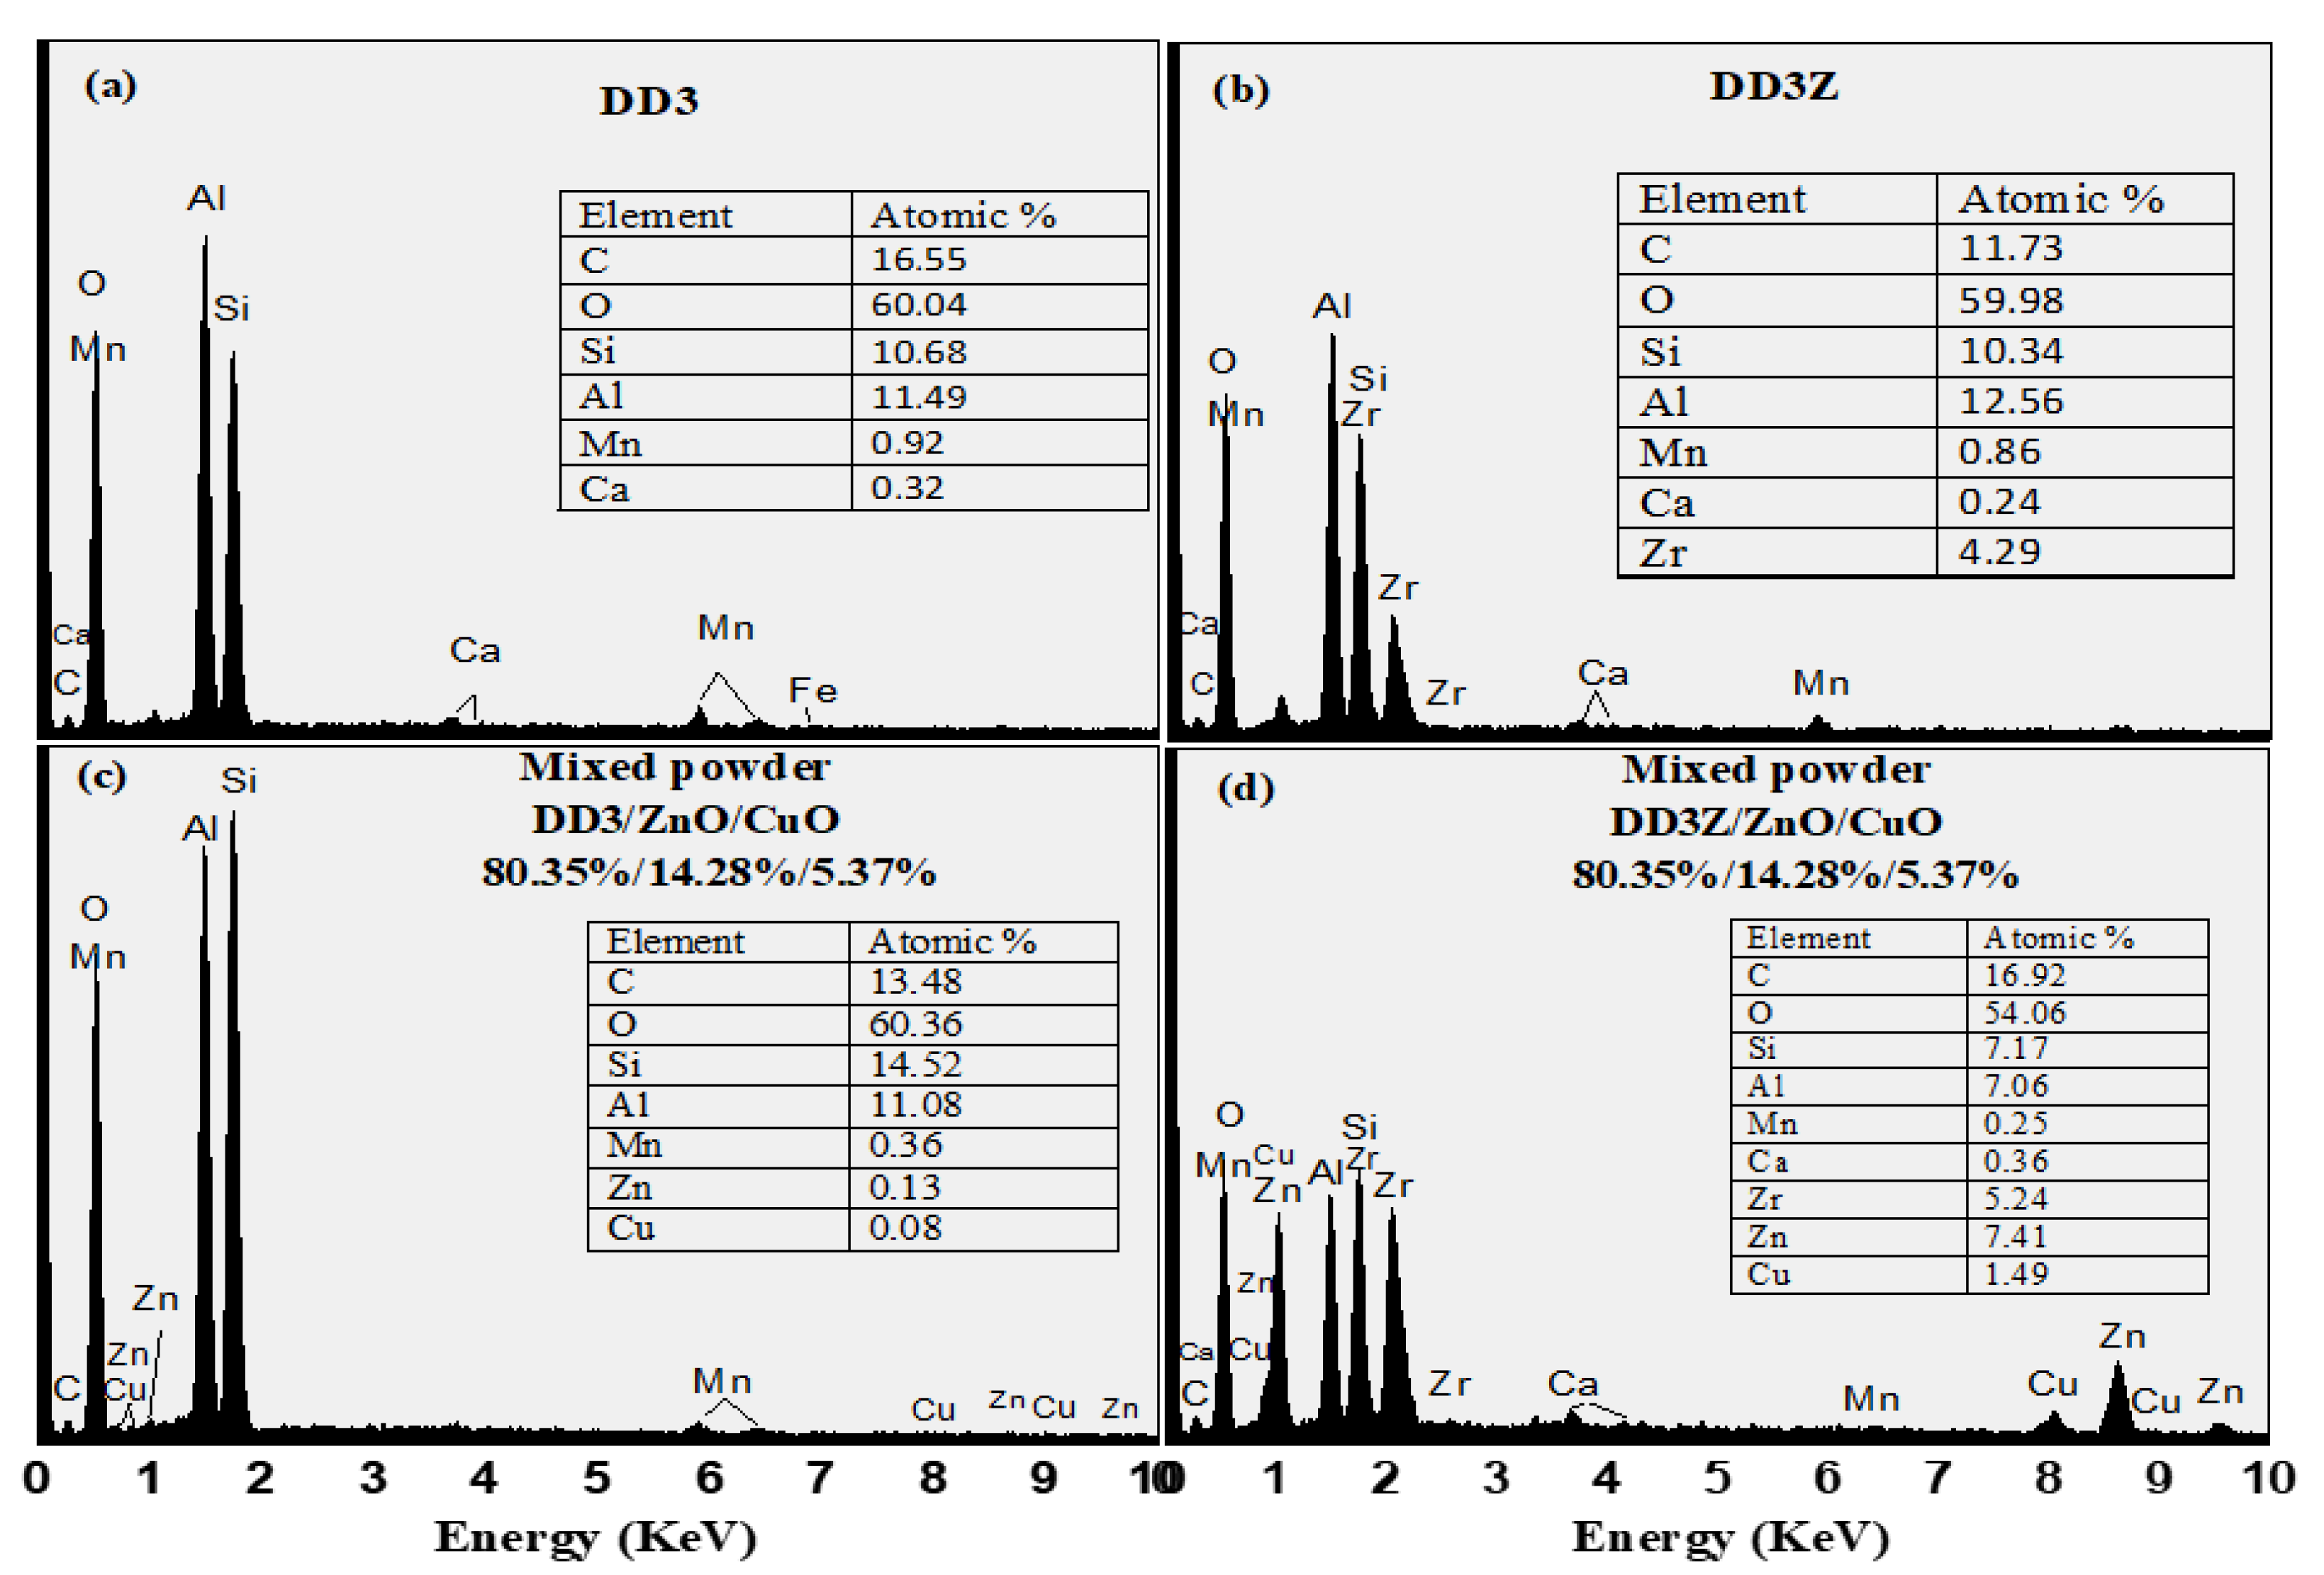
2.2. Scanning Electron Microscopy (SEM)/Energy Dispersive X-ray Spectroscopy (EDX)

The morphology of the catalyst material prepared by the traditional mixing method was studied by SEM (Figure 2). The size of the granules was not homogeneous because of the differences between the ceramic materials and the additive oxides. In the SEM images shown in Figure 2a,c, there is a clear change in the shape of granules after the addition of ZrO2 into the DD3 clay material. Moreover, it was observed that there was an increase in the number and in the average size of pores. The value of the pore sizes changed from 50 nm (without ZrO2 addition) to 292 nm (with ZrO2 addition). The addition of both zinc and copper oxides into the two types of ceramics has contributed significantly to the increase in the percentage of pores within the granules and induced the capture of a larger number of impurities in the dye. These two oxides also changed the morphology of the DD3Z material and led them to become similar to flake-like structures with more pores, compared to raw DD3. The raw material maintained its characteristics with only a small increase in the number of pores. The compositional elements of these powders by the EDAX analysis confirmed the presence of Zn and Cu metals or oxides in the DD3 and DD3Z clays (Figure 3).

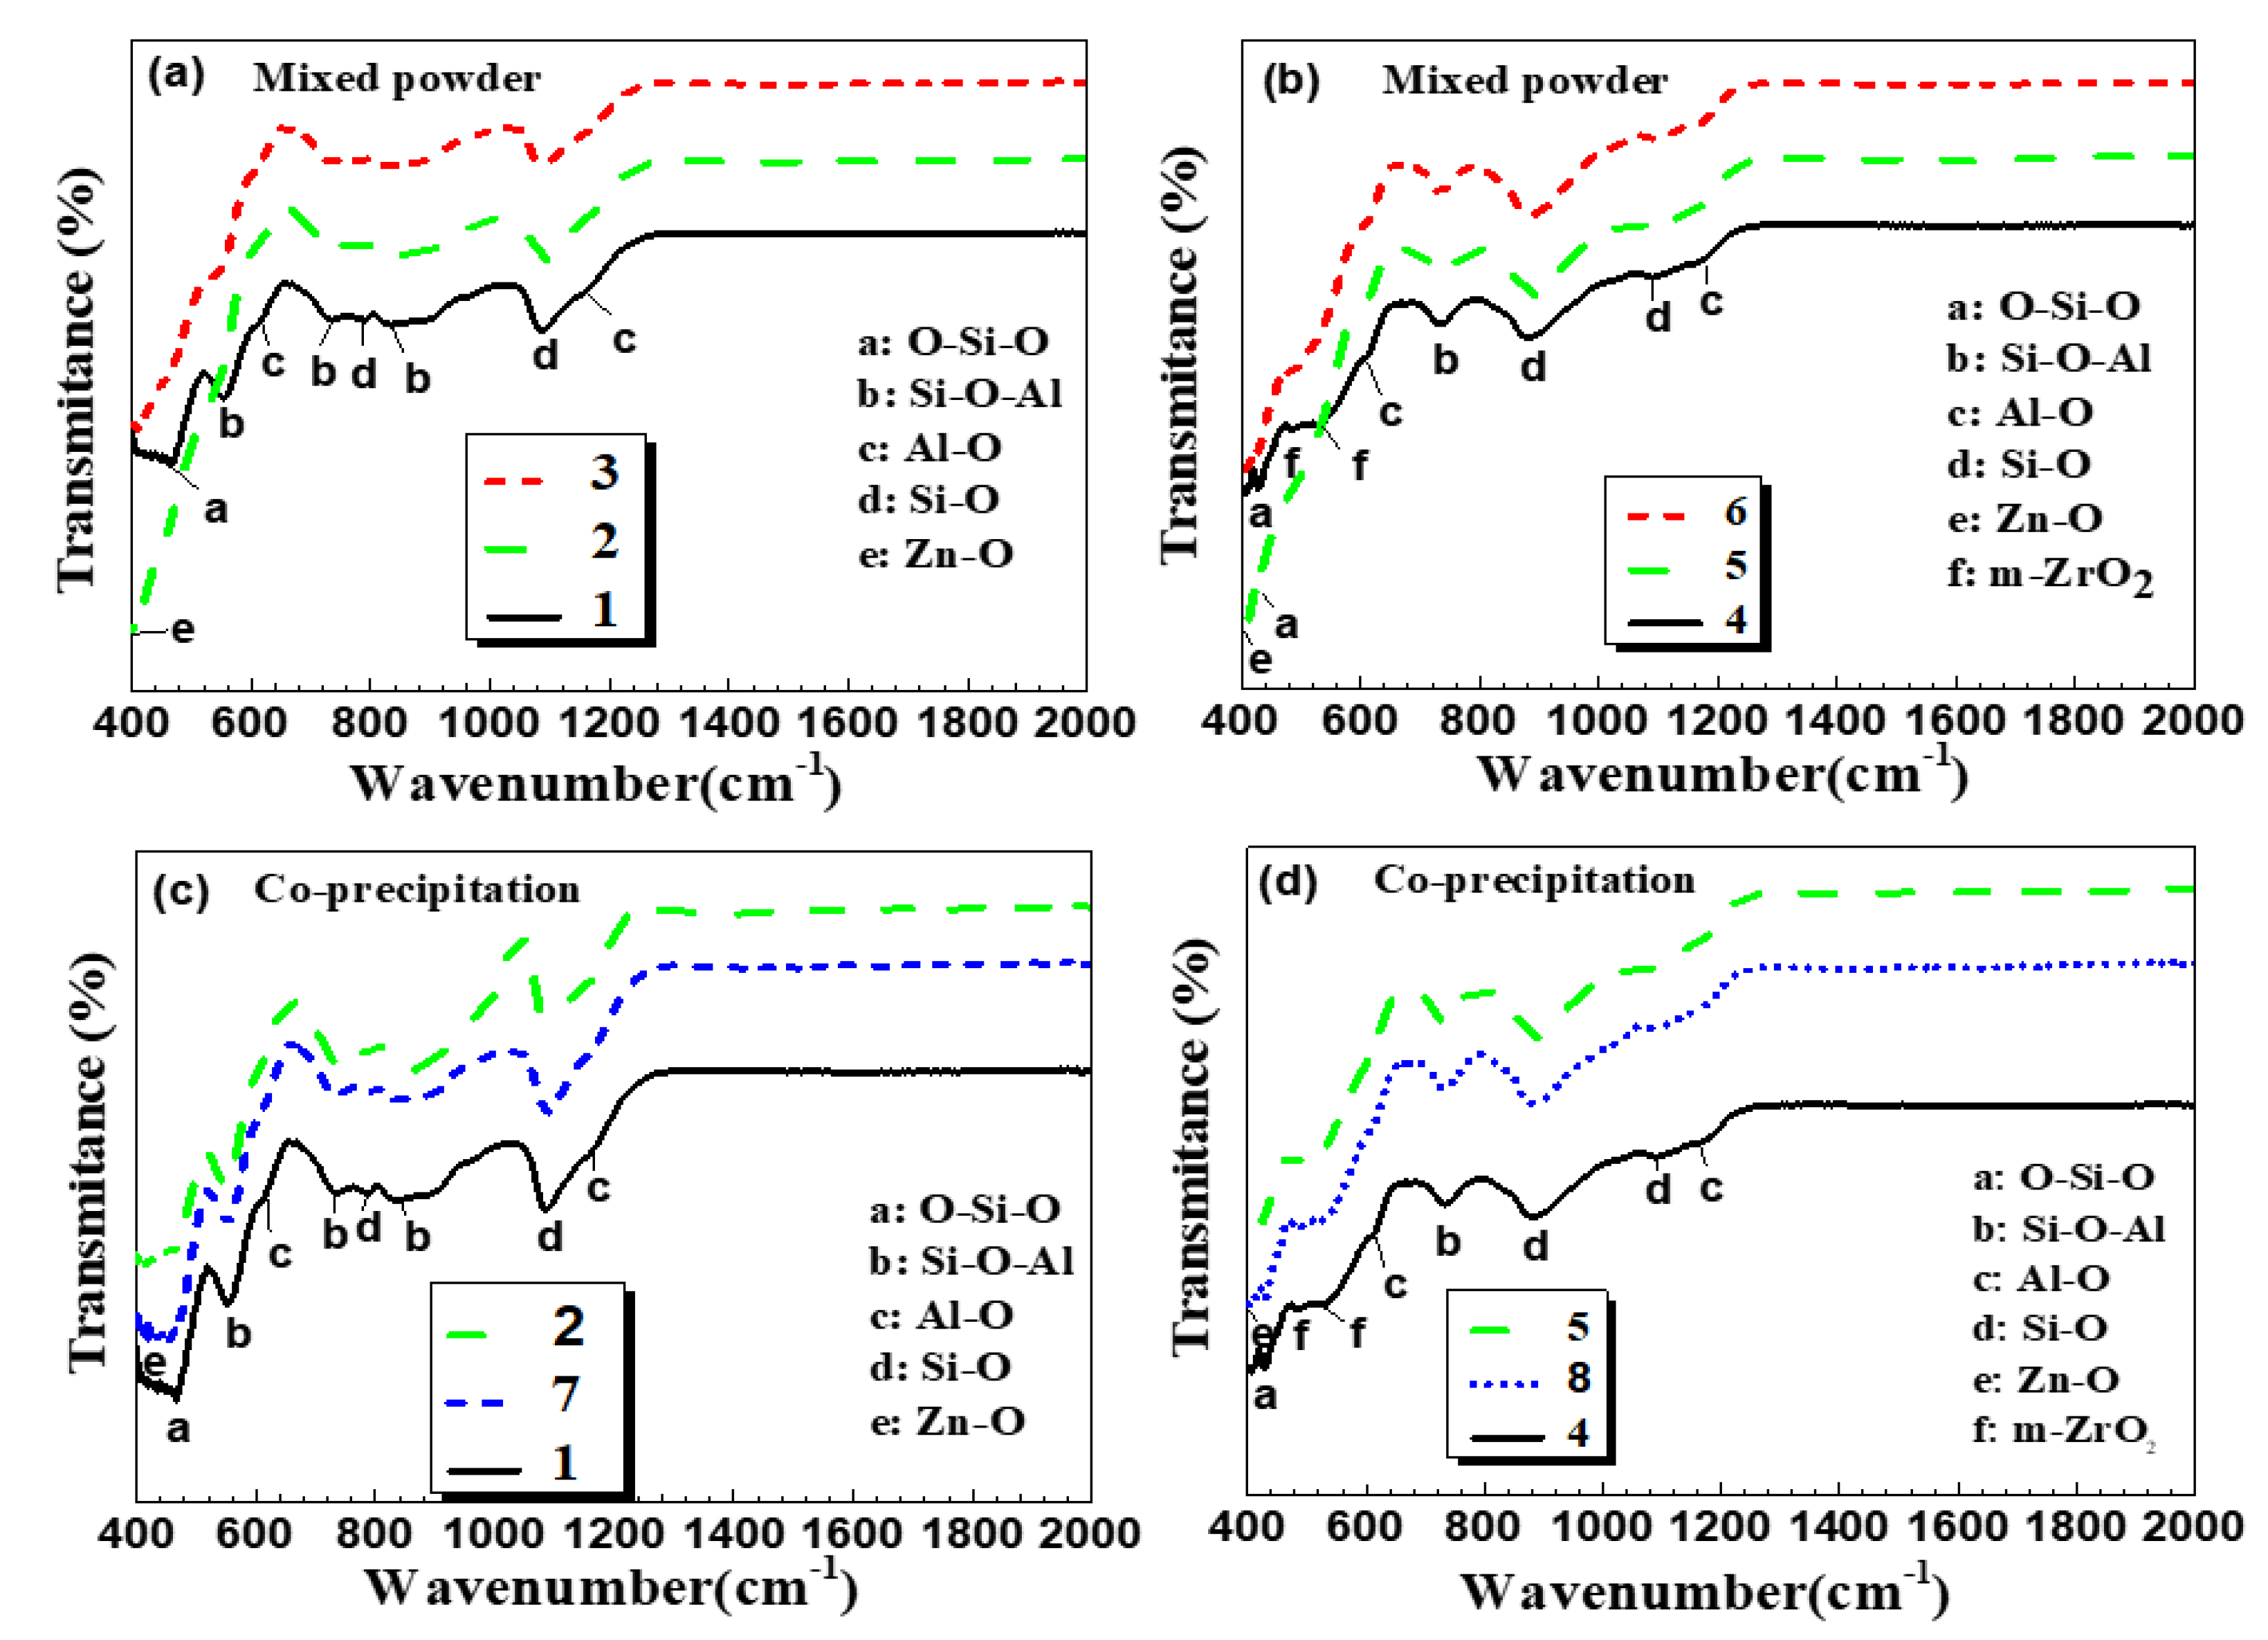
2.3. Vibrational Spectroscopy

In order to obtain a better characterization of the chemical sample compositions and interactions affecting the sample properties, the IR technique was used for the characterization of the obtained powders. This technique is frequently used to study structures, compositions, and chemical properties of materials. The obtained results by IR spectroscopy are presented in Figure 4. Several absorption bands in the wavelength range, from 400 to 2000 cm−1, are clearly identified.
By comparing the IR spectra with no-addition and with different percentages of additions in the powders, sintered at 500 °C for 2 h, using two different methods of preparation, it can be seen that each of the spectra present an obvious phase. All spectra of powders without additional compounds correspond to the Mullite-Cristobalite (DD3) or the Mullite-Zircon (DD3Z) composite. The results of the analysis are complementary to the XRD results. Seven absorption peaks in both compounds are observed at 615, 735, 1086, and 1159 cm−1. They are related to the process of forming the mullite present among them [29]. By comparing these results with the results obtained in the literature, the absorption bands at 615 and 1159 cm−1 are assigned to vibrations of the Al–O bond, while the 1086 cm−1 represents the Si–O bond. One can additionally notice that the appearance of the absorption band at 466 cm−1 characterizes O–Si–O bending vibrations (v2) [30]. Three absorption lines at 553, 735, and 834 cm−1 have a special association with Si–O–Al [31]. The cristobalite was assigned to a S–O stretching, appearing at 788 cm−1 value [32]. The reduction in the spectrum value was observed with the addition of zirconium oxide and is increased at 885 cm−1. However, in this special case of the SiO4 group (ν3), the presence of the ZrSiO4 phase is observed [33].
The results of XRD measurements have also previously revealed the surplus or residual quantity of the added monoclinic ZrO2 oxide (Figure 1b,d,f). The absorption band for the latter is localized at 484 cm−1 in the IR spectrum of Figure 4b. For powders made by the traditional mixing method (Figure 4a,b), the absorption curve changed in the 400–590 cm−1 range. A decrease in the intensity of the ZnO absorption line of the spectrum is very clear at 408 cm−1 and corresponds to the Zn-O vibration. In the same spectral range, the transmission spectra decreased when oxides were added (ZnO and CuO) into the ceramics powder [34]. A change in the peaks of the transmission spectra was observed between DD3 + 14.28 wt% ZnO + 5.37 wt% CuO and DD3 or DD3Z + 14.28 wt% ZnO + 5.37 wt% CuO and DD3Z. This result has not been experienced with the co-precipitation method (Figure 4c,d), where the same absorption curve is maintained even after the addition of each compound with the emergence of a band at 424 cm−1 characteristics of ZnO.
By comparing the two methods, the spectrum of zinc oxide with the appearance of the absorption bands by the mixing method can be clearly distinguished. This will be confirmed later by a photocatalytic application, where the mixing method was more effective than the co-precipitation method.

2.4. Optical Analysis

The optical analysis was performed for the DD3, DD3Z and DD3/ DD3Z + (ZnO (14.28%), or CuO (5.37%)) samples. The measurements were performed in the wavelength range of 200–900 nm. The results are shown in the Figure 5. It can be noted that the absorbance is maximal for the sample DD3 + ZrO2 (DD3Z). The presence of CuO and ZnO in the DD3 and DD3Z clay improved the absorbance in a remarkable way. The absorbance decreased with the addition of ZrO2 in the clay, which can be explained by the formation of the ZrSiO4 component, which is characterized by a great optical reflection. The increase in the photocatalytic effect is mainly attributed to the increase in the reaction surface (grain porosity). With this goal in mind, the addition of ZnO (14.28 wt%) and CuO (5.37 wt%) appears to give a good absorbance with the two added chemical compounds (ZnO and CuO) that match their gaps [35]. It is noted that zinc oxide absorbs below 375 nm, and copper oxide has a low gap and absorbs almost the entire visible leading to a black powder.

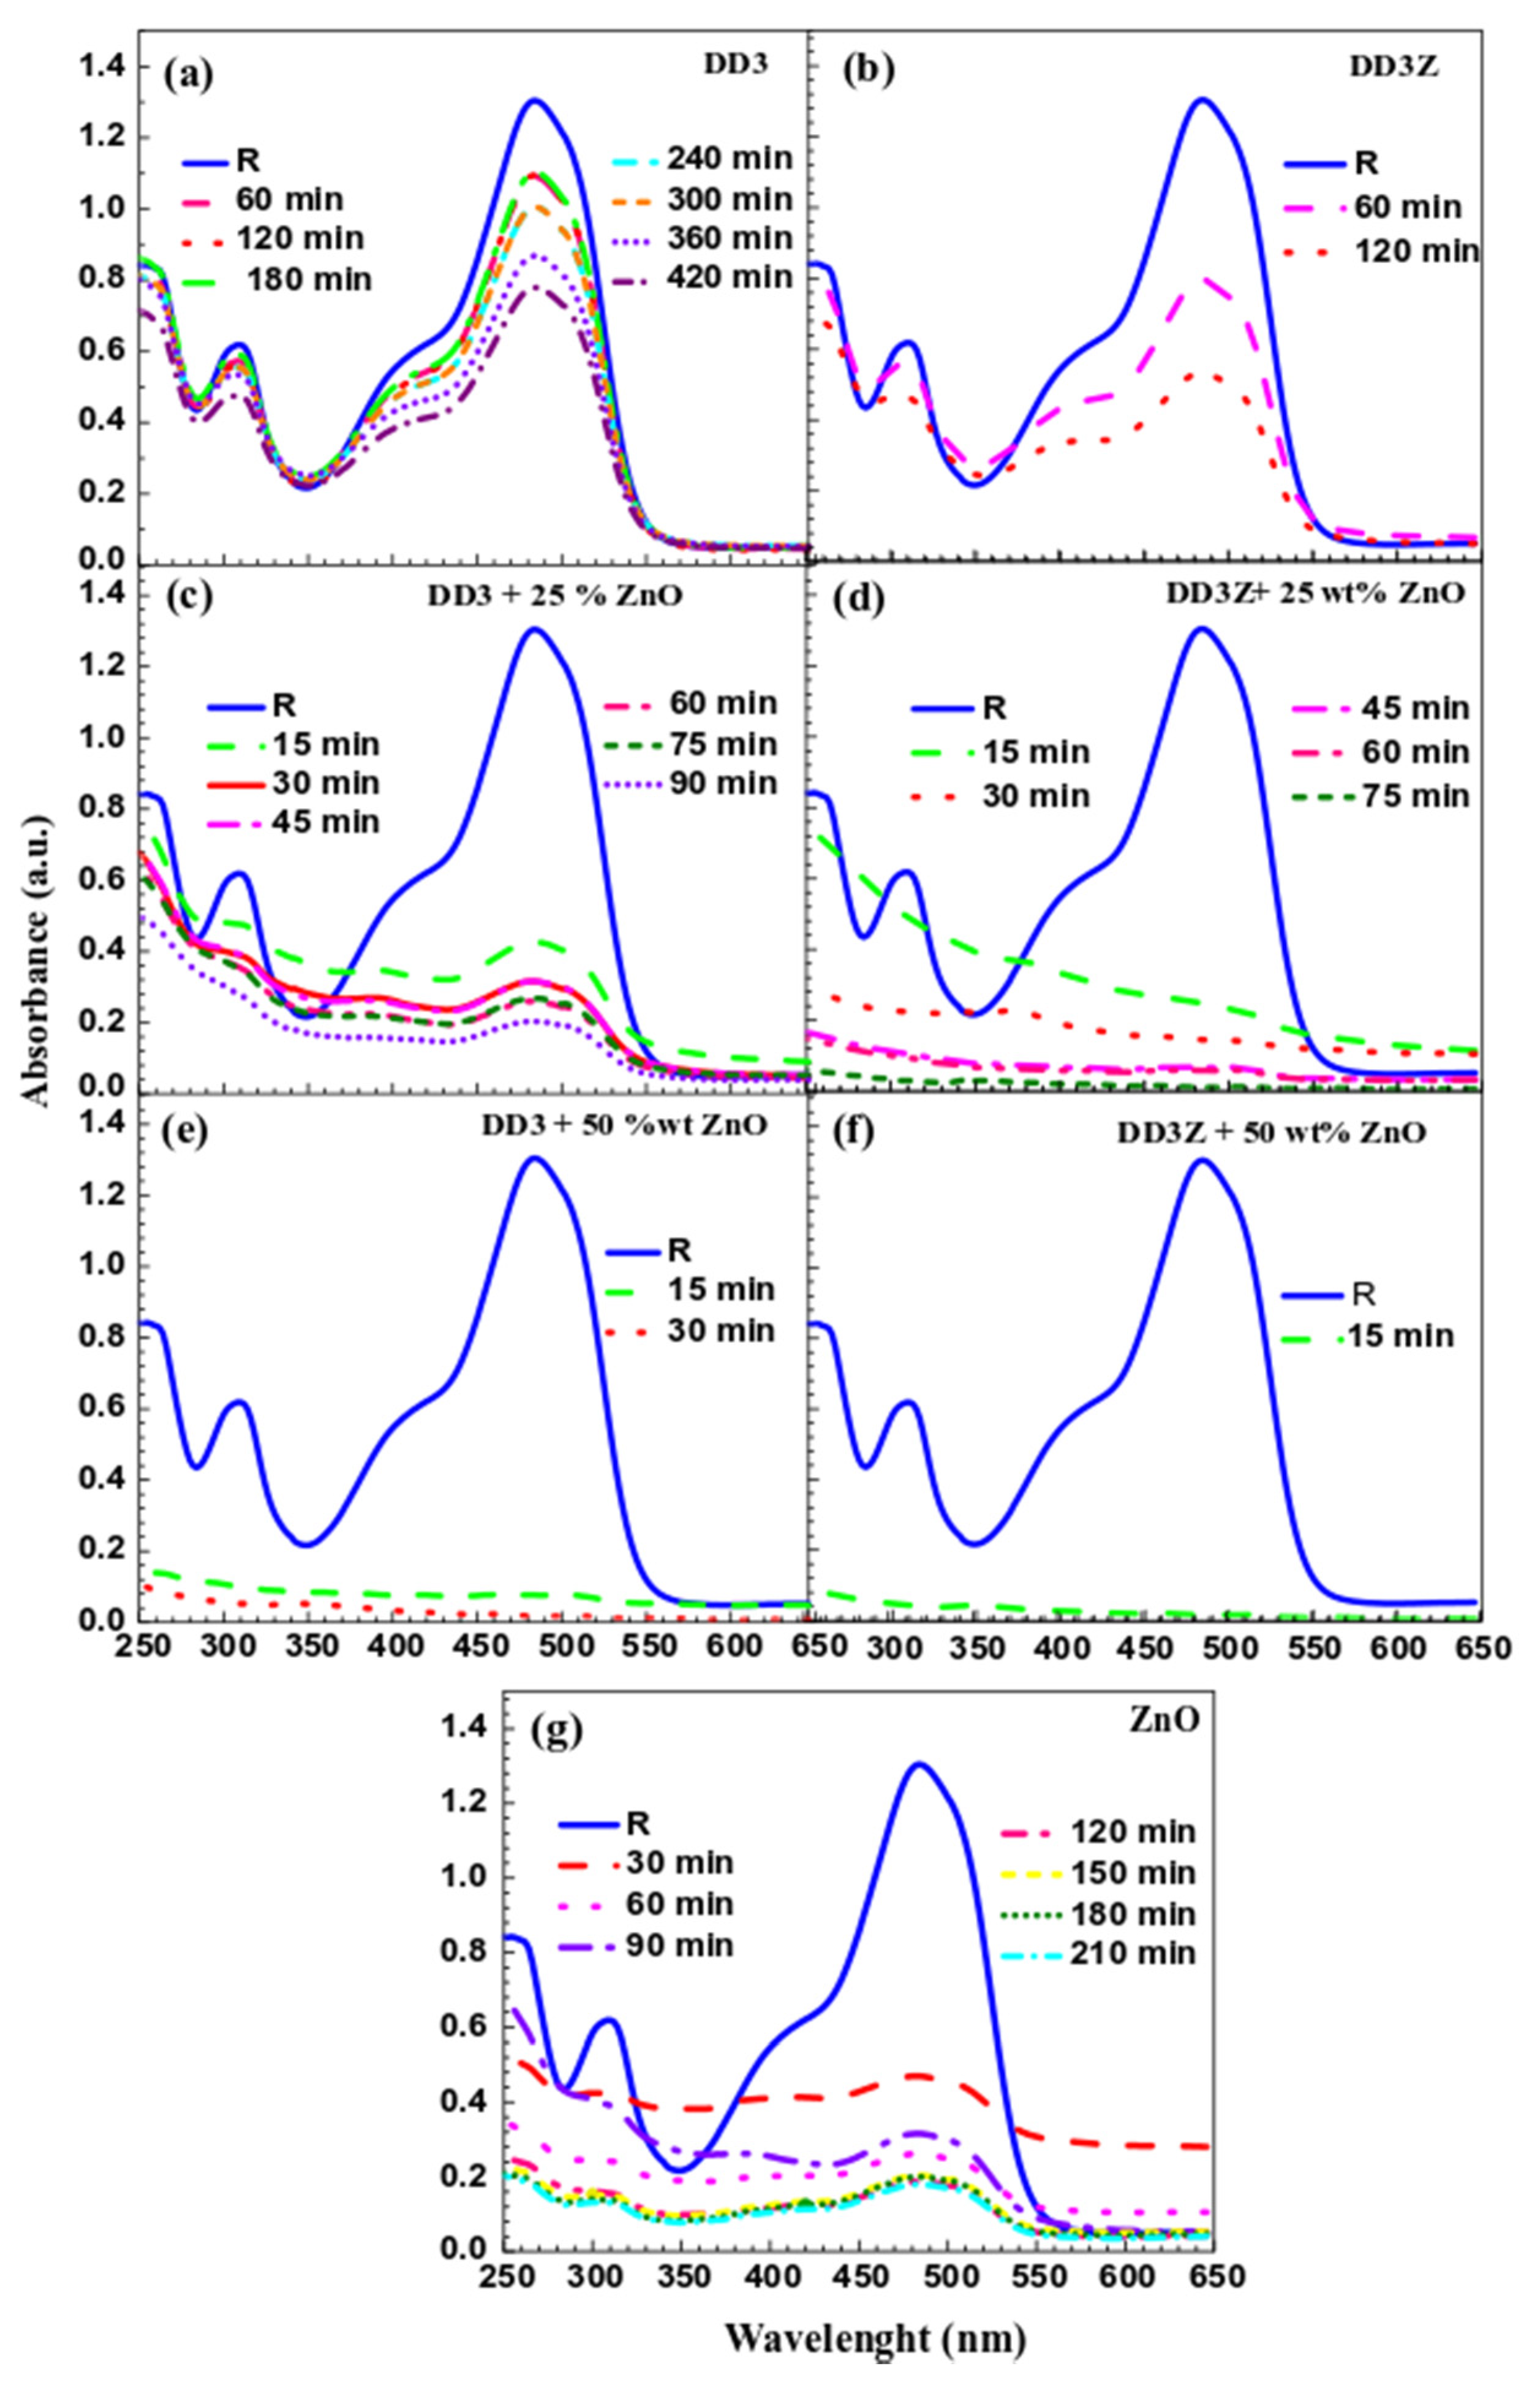
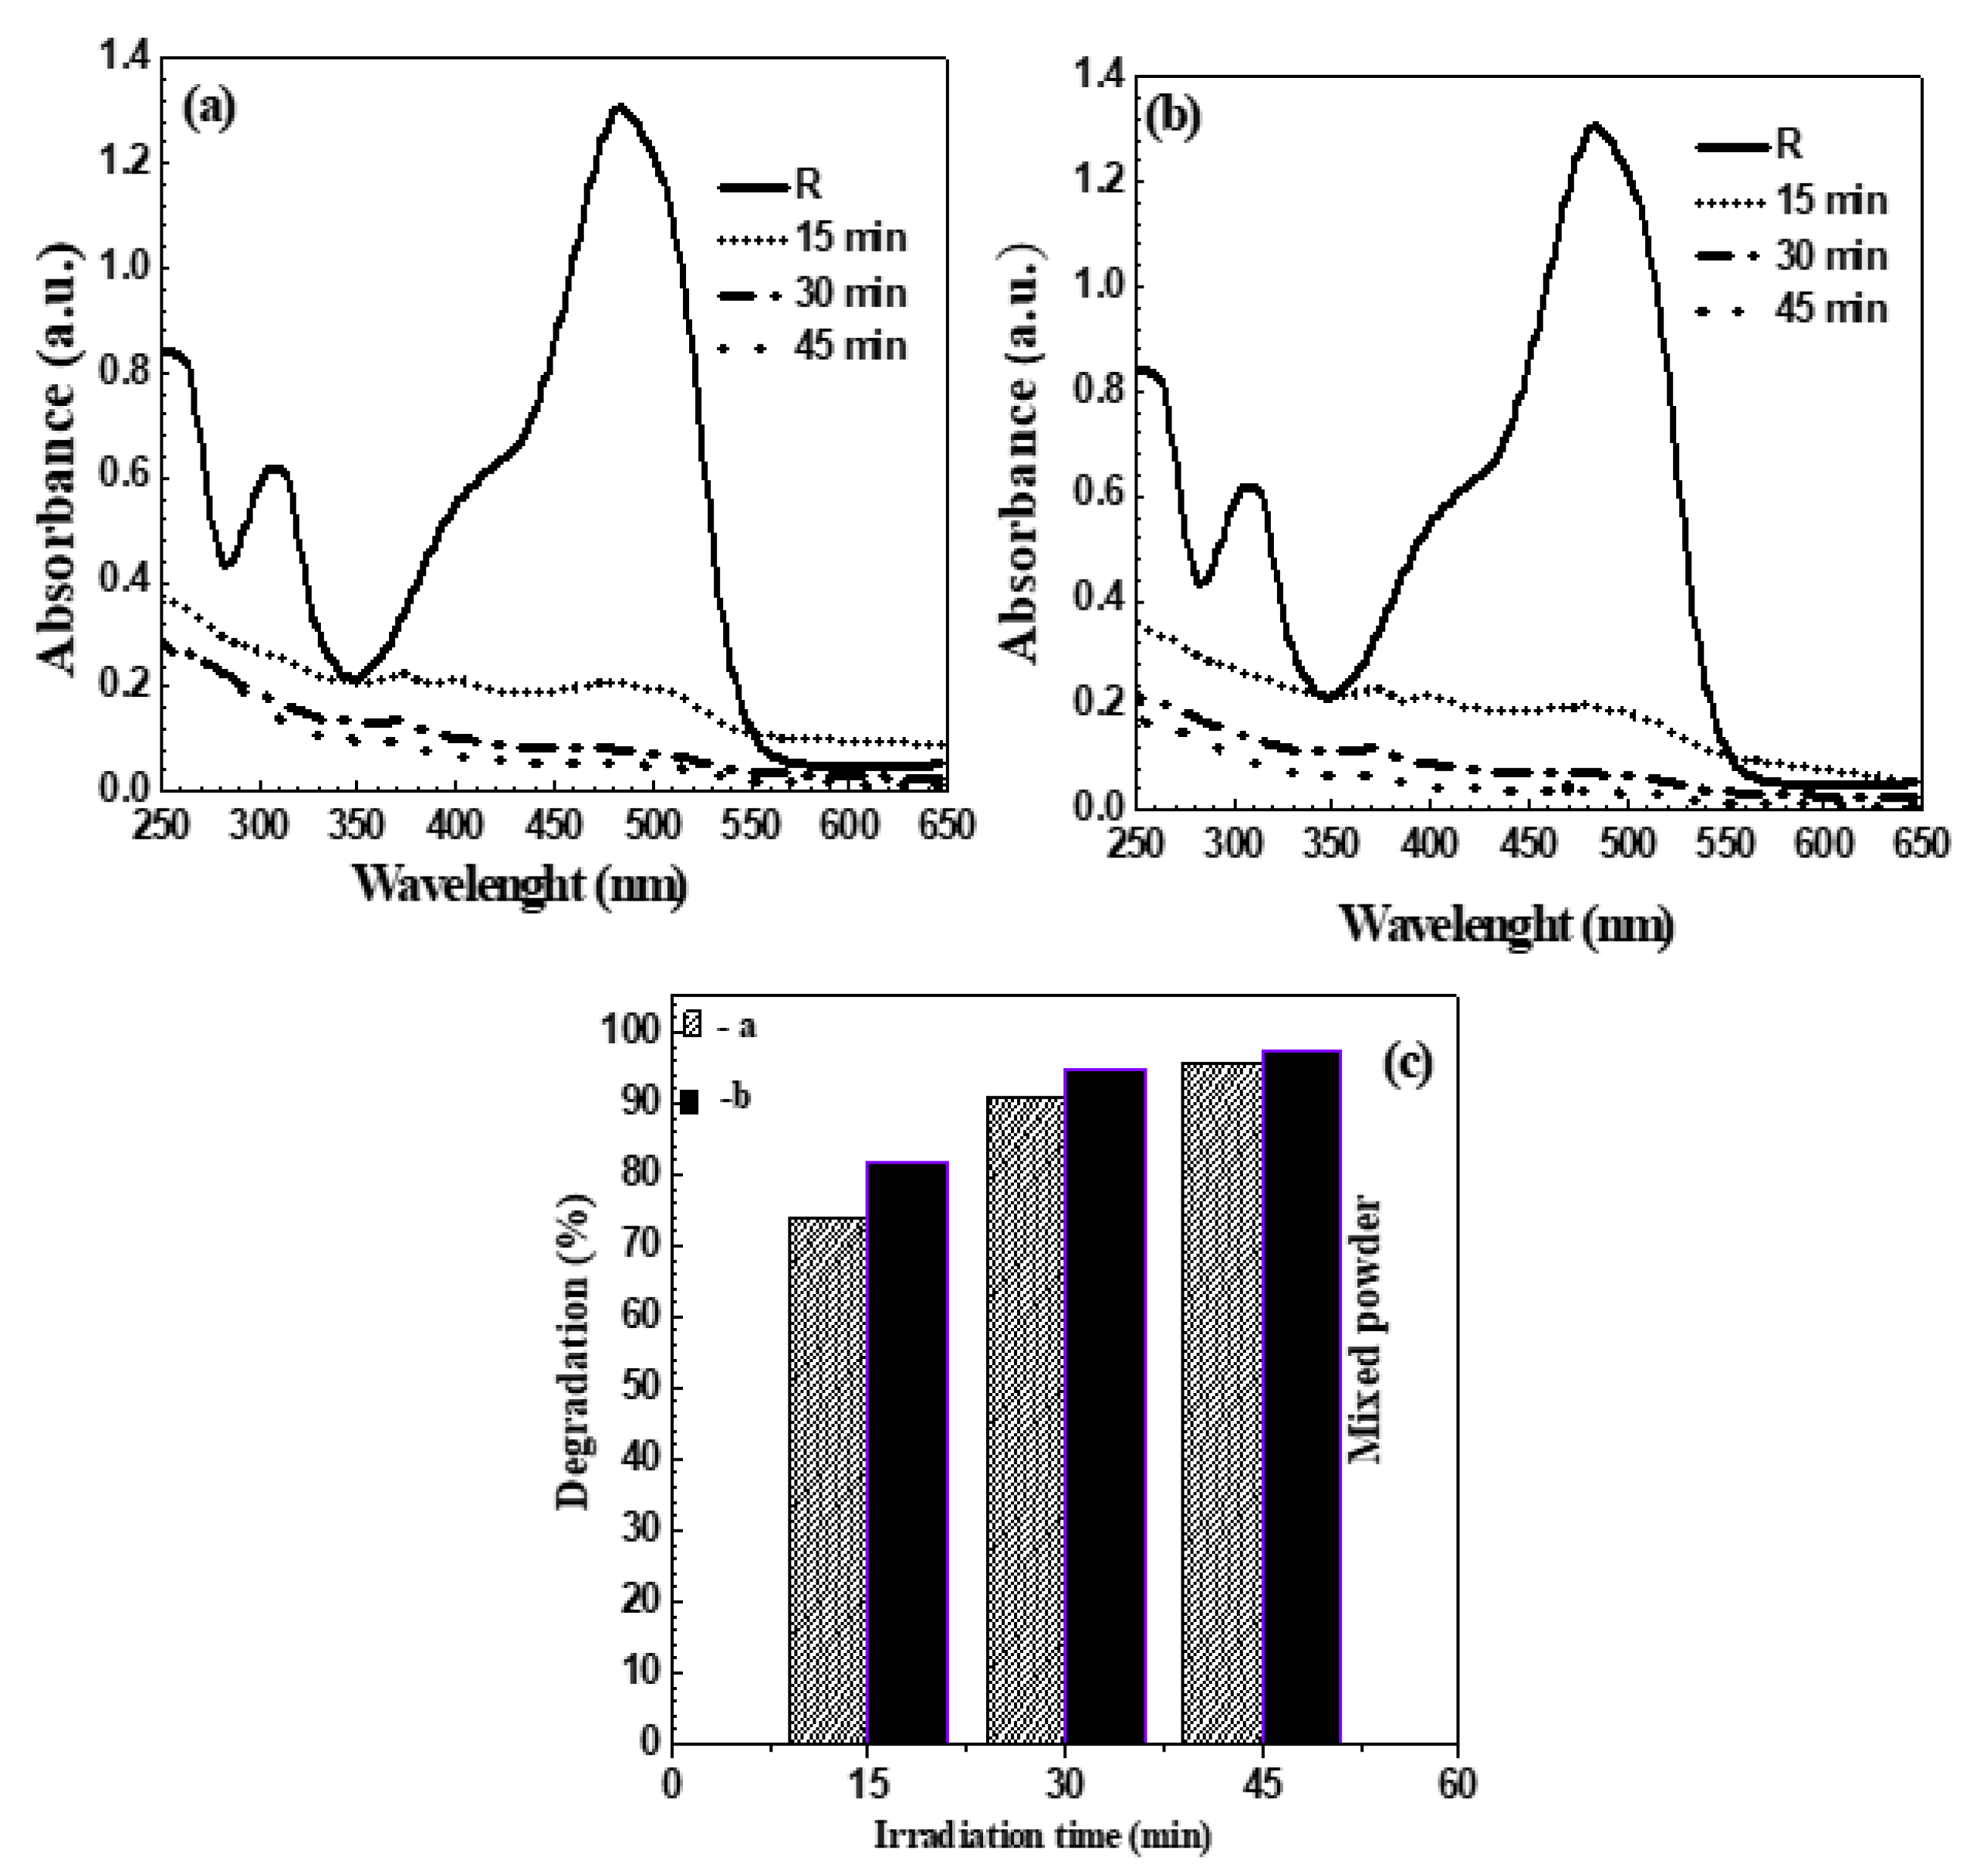
2.5. Photocatalytic Performance

With the goal of developing practical applications, the prepared samples were tested for purification of contaminated solutions. This study was carried out by measuring the degradation of orange II as a function of time. The dye was chosen because it represents more than 50% of the world production of coloring matter [36]. It is initially non-biodegradable and resistant to bacterial attacks in aqueous media [37].
By contrast, this application was previously carried out on powders prepared by both conventional mixing and co-precipitation methods. These powders are DD3 and DD3Z without and with different contents of ZnO and CuO. Figure 6 represents the visible UV spectra obtained for samples prepared by a traditional mixing. It is noted that for DD3 and DD3Z powders (Figure 6a,b), the degradation of orange II reaches 42% and 60.3% for 7 h and 2 h, respectively. These values are remarkably improved by the addition of ZnO mainly for DD3Z (Figure 6c–f), for which the purification percentage reached very high rates during short periods. For example, a complete purification (98.9%) of an OII solution was almost achieved during 15 min with the addition of 50 wt% ZnO to DD3Z. The same result was obtained with DD3 + 50 wt% ZnO with a degradation time of 30 min.
The high rate of purification obtained with the samples was experienced with a ZnO content of 50 wt%. In order to reduce this content and to have samples where the ceramic material was dominant, another sample with addition of ZnO was used. These samples have the same efficiency for purification applications and were prepared following the same protocol (traditional mixing method).
The added material for this purpose was copper oxide (CuO) because of its positive properties in this domain of applications. The study was carried out with 5.37 wt% CuO and 14.28 wt% ZnO. Using UV-visible spectra, the obtained photocatalysis for these samples is represented in Figure 7. There is a remarkable improvement in the degradation rate for DD3 -based samples (Figure 7a,c,e,g) when it is compared to the degradation time of DD3Z -based samples (Figure 7b,d,f,h). The degradation rate reached 82.4% for 30 min (Figure 7g) and 93.6% for 15 min (Figure 7h) for DD3 and DD3Z samples, respectively. It was also found that by removing the UV lamp, the orange II degradation rate reached 89.52% for DD3 powders (Figure 8a) and 96.35% for powder DD3 + 38 wt% ZrO2 powder in 45 min (Figure 8b).
For samples prepared by the co-precipitation technique, the obtained visible UV spectra are revealed in the Figure 7. DD3 or DD3Z clay samples were prepared with zinc acetate and copper acetate solutions. Significant results were obtained with the addition of 28 wt% ZnO and 2.8 wt% CuO. The purification percentage of orange II impurities reached 99.59% for a degradation time of 45 min with the DD3Z based samples (Figure 7b). Comparing with DD3 -based samples, the degradation rate reached 84.13% for a time of 150 min (Figure 7a). The DD3Z based samples prepared with different methods had a suitable effect on the purification of orange II (Figure 8 and Appendix D).
Finally, all of the results concerning the degradation of OII with the prepared materials following two different methods are summed up in Figure 8. We observe that a very fast degradation of OII can be reached (less than 20 min.) even without lamp (see Appendix C). It is noted that there was no degradation of the orange II dye under UV light irradiation.

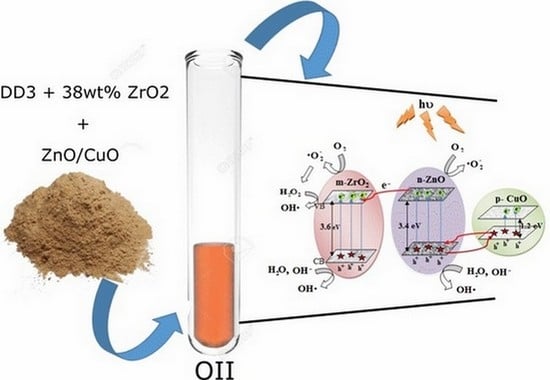
2.6. Mechanism of Photo-Catalysis

The photocatalysis mechanism is based purely on chemical reaction processes [38,39]. The samples tested for the photocatalysis were based on alumina-silicate ceramics with and without addition of ZrO2. During the chemical reaction, SiO2 and Al2O3 particles adsorb an amount of pollutants in the solution through the electrostatic attraction [40,41] Each doping material (ZrO2, ZnO, CuO) under the light led to the creation of electron/hole. In the case of ceramics containing ZrO2, the •OH radicals are generated by the creation of e/h + pairs and separated by the Al2O3 particles [42]. The radicals simultaneously act on the surface areas of the contaminant adsorbed on SiO2 and Al2O3. Therefore, there is a possibility of degrading a large quantity of dye. However, this degradation is not fully satisfied as shown by Equations (A4), (A6), (A8) and (A13) in Appendix B [43].
In order to obtain good efficiency, we compared ZnO with and without CuO additions into the ceramics. It is noted that the number of holes increases in ceramics with the addition of ZnO and the addition of ZnO and CuO. This increase is due to the absorption of photons (υh ≥ Eg); the mechanism for this phenomenon is explained by the scheme illustrated in Appendix B. The two semiconductors, CuO and ZnO, both added to the ceramics led to an accelerated degradation of OII. Consequently, this degradation is carried out by the p-n junction. After the absorption of the photon, a transfer of electrons can occur from the valence band of CuO (p-type) to the valence band of ZnO (n-type).
This is possible thanks to the work function of CuO, which is similar to the one of ZnO (5.3 eV) [44]. For a small amount of the two oxides (ZnO and CuO), the separation of electrons can be accelerated leading to an increase in holes. This electron separation plays a large role in the production of •OH radicals [45]. Moreover, the position of the ZnO edge of the conduction band is higher than that of ZrO2. As a result, there is a rapid transfer of electrons from the conduction band (CB) of ZnO to the conduction band of ZrO2, and this fast transfer prevents recombination. On the other hand, the transfer of holes may occur from the ZnO with the most anodic valence band to the cathode valence band of CuO (Equation (A3)). Potential edges CB of ZnO (−0.41 eV) and ZrO2 (−0.38 eV) are negative with respect to the standard redox potential EΘ (O2 /•O 2 ) (−0.33 eV vs. NHE). In this case, electrons of ZnO and ZrO2 can reduce O2 to O 2 (Equation (A4) and (A5)). However, this reaction is impossible for CuO, because of its positive CB edge potential (+0.71 eV) [46]. Thus, the process begins when the holes interact with water to produce hydroxide, and the electrons react with oxygen to induce a transparent color of the contaminated solution. The •O 2 may then react with H2O to form HO2 and H2O2. Moreover, because of the position of the valence band edge of both ZrO2 and ZnO oxides (+2.99 eV for ZnO and +3.22 eV for ZrO2), there is potential to oxidize the dye to carbon dioxide and water with ZnO and ZrO2 by the aforementioned holes [47,48]. The position values of the two semiconductors in zero charge point are calculated using the following relationships:
EVB = X− Ee + 0.5Eg
ECB = EVB − Eg
where EVB is the potential of the valence band edge, and ECB is the potential of the conduction band edge, X is the electro-negativity value (XCuO = 5.81 eV, XZnO = 5.79 eV, XZrO2 = 5.92 eV), Ee is the energy of free electrons at the level of hydrogen (~ 4.5 eV) and Eg is the band width of the semiconductor. The coexistence of the three oxides, ZrO2, CuO, and ZnO, increase the rate of •OH in a very remarkable manner, compared to the case of only ZnO in ceramics. The formation of the holes is based on the chemical nature of ZrO2, ZnO, and CuO. This may explain the high rate of orange II degradation in samples based on ceramics with three oxides compared to other cases.

2.7. Comparaison with Thin Films

The photocatalysis results obtained with DD3 powder doped with different materials can be compared to thin films with the same materials (CuO, ZnO, ZrO2). A. Katal et al. [49] reported the fabrication of a thin CuO film by a sputtering method and a thermal treatment for visible-light photocatalytic degradation of Methylene Blue (MB). The different surface structures and crystallinity of the different samples show the MB degradation with a minimum of 2 ppm after 200 min. The fabrication of CuO thin films through DC/RF magnetron sputtering technique [50] gives a similar result. Other studies with CuO including CuO/zeoliteX [51], CuO/SiO2 [52], heterojunction CuO–Cu2O thin film [53] showed a ma-ximum degradation after a similar period. CuO thin films contained 3D nanocubes [54] demonstrated a photodegradation activity by decomposing a 5 μM MB dye solution in 90 min under sun exposure. The ability of CuO thin films to degrade MB is attributed to the high density of exposed CuO nanocube surfaces, compared to other CuO thin film samples.
CuO/ZnO composite oxide thin films were prepared for the photocatalytic degradation of different dyes [55]. In all of the studies, the maximum degradation efficiency of nearly 90% was obtained after 120 min or 90 min in the best case. For example, D. S. Paz et al. [56] prepared CuO/ZnO coupled oxide films onto aluminum substrates by the electrodeposition method. The photocatalytic activities of the pure ZnO and coupled CuO/ZnO thin films with different CuO contents were compared. They showed that a pure ZnO film had a lower photocatalytic activity than the coupled CuO/ZnO films and that the photocatalytic activity of the CuO/ZnO films changed with the copper content. A maximum of degradation efficiency of 70% is reached after 300 min for CuO/ZnO. Another study showed that by coating ZnO with CuO to form CuO@ZnO core−shell catalysts [57], nitrophenols were degraded after 180 min.
ZrO2 nano-thin films deposited at different substrate temperatures by the spray pyrolysis method [58] reached a maximum degradation of MB dye of 72.13% after 180 min of irradiation with sunlight only 30.82% degradation was observed after 30 min. The synthesis of ZrO2 by the solution combustion technique or ZrO2/TiO2 mixed oxides [59]. Moreover, 80% degradation of a dye was observed in 2 h with a 25 ppm initial concentration. The best result was obtained with ZrO2 calcined at 500 °C with about 85% degradation of methyl orange after 60 min. All the results are summed up in the Table 1 for comparison.

3. Methods

3.1. Materials

The raw materials based on DD3 with ZrO2 (DD3 + 38 wt% ZrO2) will be referred to in the study by DD3Z. In addition to the local clay used in this work, the following chemical compounds were added: zinc acetate [((CH3COO)2 Zn.2H2O); 99.5% purity], copper acetate [(Cu(CH3COO)2); 99.0% purity], copper oxide [CuO; 99.0% purity], zinc oxide [ZnO; 99.5% purity], sodium hydroxide [NaOH; 96.0% purity], and orange II (C16 H11N2NaO4S) for the application. The chemical compositions of both DD3 kaolin and ZrO2 have already been presented elsewhere [60], with the influence of ZrO2 content (wt%) on the open porosity ratio of compact clay materials sintered at 14001C for 2 h. The value of 38% gives the best open porosity.

3.2. Characterization Techniques

The crystal structure of the powder particles was identified by X-ray diffraction (XRD; Bruker AXS-8D, Karlsruhe, Germany) using a Cu Kα (λ = 1.5406 Å) radiation. To examine the microstructure composition, the scanning electron microscopy (SEM; JSM-6301F, Tokyo, Japan) and energy-dispersive X-ray spectrometer (EDX; X-Max 20 mm2, Oxford, UK) were used. The photocatalysis absorbance spectra were measured by a UV-visible spectrophotometer (V-630, JASCO, Lisses, France) with a wavelength range of 250–650 nm. The chemical compositions of the prepared powders were characterized by infrared (IR) spectroscopy (Bruker II-RAM, Karlsruhe, Germany). UV lamp (VL-4LC, 4W-254 nm) was used to activate the photodegradation.

3.3. Sample Preparation

3.3.1. Preparation of Powders

Two methods were used for the preparation of powders: the traditional mixture and the co-precipitation (see Appendix A). In the first method, the DD3 and DD3 + 38 wt% ZrO2 kaolinitic clay powders were mixed using a mill with different contents of ZnO (0, 10, 25, and 50 wt%), and 5.37 wt% CuO. The addition of ZrO2 to DD3 was used to obtain a ceramic composed of mullite and zircon, after sintering for 2 h at 1300 °C. The average particle size of the added ZnO powder was about 1 µm, as indicated by the supplier.
The second performed method was co-precipitation. It is noted that in this method, various amounts of zinc acetate and copper (28, 2.8/ 25 and 12.5 wt%) were added into the same clay. Copper and zinc acetates were dissolved in a sodium hydroxide solution previously diluted in distilled water (0.5 M).

3.3.2. The Photocatalytic Activity Measurement

The photocatalytic activity of all the materials was measured by monitoring the absorbance evolution of a dye-containing solution. After preparation of the aqueous solution with orange II (25 mg/l; pH = 8.9), 1 g of the studied powder was dispersed in 25 mL of this dye solution. In order to activate the reaction between the powder and the solution, the obtained mixture was deposited on a shaker (stirring 500 R/min) in a dark room. Then, a lamp (VL-4LC. 4 W-254 nm) was used as a light source to activate the reaction). After each 15 min, 2.2 mL of the solution was placed in a sealed tube and centrifuged at 3500 U/min during 7 min in order to remove the catalyst. The solution was analyzed by measuring the UV-Vis absorbance spectra in the wavelength range of 250–650 nm. Distilled water was used as a reference and measurements of the catalyst solution were carried out every 15 min. The absorption rate of degradation is calculated using the following equation [61]:
Degradation   ratio = C 0 C C 0 × 100 %
where C0 and C are the initial concentration before and after illumination, respectively.

4. Conclusions

The photocatalytic degradation of a dye solution by different ceramic powders prepared by two different methods including the co-precipitation and traditional mixing showed a great effect on the photocatalytic activity. The material is based on a DD3 material with or without ZrO2 and different oxides (ZnO and CuO). This dye degradation was done with and without a UV-lamp on powders where the ceramic material was dominant. The powders were used as catalysts. A very high rate of orange II degradation reached 93.63% after a short period of 15 min with DD3 +14.28 wt% ZnO + 5.37wt% CuO, and DD3Z + 14.28 wt% ZnO + 5.37wt% CuO. For these additions, the morphology of the grains became more porous with flake like structures. In this study, the chemical reactions of the added oxides coupled with the method of preparation have shown that the degradation of the dye was considerably improved. The results of the photocatalytic degradation of the OII dye solution by different ceramic powders are compared with thin films of the same materials. Ceramic powders induce a photodegradation that can be 5 to 10 times faster than thin films.

Author Contributions

Conceptualization, M.Z. and A.M.; methodology, A.h.M.; writing—original draft preparation, D.B. and R.B.; writing—review and editing, R.B.; visualization, A.H.; project administration, funding acquisition, M.Z. All authors have read and agreed to the published version of the manuscript.

Funding

This research received no external funding.

Acknowledgments

This work has been supported by the Laboratory of active components and materials University Larbi Ben M’hidi Oum El Bouaghi, Algeria, and laboratory of MOLTECH-Anjou, University of Angers, France. All thanks and gratitude to the Belkacem Bouricha Karima teacher of English at the same university for her assistance.

Conflicts of Interest

The authors declare no conflict of interest.

Appendix A

Figure A1. The two methods followed for the preparation of powders.
Catalysts 11 00733 g0a1

Appendix B

The following reactions are also present:
ZnO (e) + ZrO2 → ZrO2 (e)
CuO (e) + ZnO → ZnO (e)
ZnO (h+) + CuO → CuO (h+)
ZrO 2   ( e )   +   O 2     O 2
ZrO   ( e )   +   O 2     O 2
ZrO2 (h+) + OH → OH•
ZnO (h+) + OH → OH•
ZrO2 (h+) + H2O → OH• + H+
ZnO (h+) + H2O → OH• + H+
O 2 + H 2 O     HO 2 . + OH
2 HO 2 .     H 2 O 2 + O 2
H2O2 + e → OH• + OH
OH• + Dye → The degraded dye
OH + O 2 + h V B + + the   degraded   dye     CO 2 + H 2 O
Figure A2. The photocatalytic composite mechanism ZrO2/CuO/ ZnO under UV light.
Catalysts 11 00733 g0a2

Appendix C

Figure A3. Percentage change of orange II degradation versus time without lamp for ceramic powders prepared by traditional mix method, (a) DD3 + 14.28 wt% ZnO + 5.37 wt% CuO and (b) DD3Z + 14.28 wt% ZnO + 5.37 wt% CuO, (c) bar graph of the results for the two materials. R = reference value for OII.
Catalysts 11 00733 g0a3

Appendix D

Figure A4. Image showing the discoloration of OII for different durations of exposure under UV light.
Catalysts 11 00733 g0a4

Appendix E

Table A1. Results of structural analyses of type DD3 before and after addition (Zn: Cu).
PhasesPlan (hkl)2θ (°)θ (°)FHWM β(°)β(rad)D (nm)
Mullite(210)26.27813.1390.3560.006222
Mullite+
+25% Zn+12.5%Cu
(210)26.31113.1550.5930.010313
Mullite +28% Zn+2.8%Cu(210)26.11813.0590.6050.010513
SiO2(101)21.68010.840.2610.004531
SiO2 +25% Zn+12.5%Cu(101)21.70710.8530.3530.0061622
SiO2 +28% Zn+2.8%Cu(101)21.5410.770.3730.006521
Table A2. Results of structural analyses of type DD3 + 38% ZrO2 before and after addition (Zn: Cu).
PhasesPlan (hkl)2θ (°)θ (°)FHWM β(°)β(rad)D (nm)
Mullite(121)40.82120.410.3820.006722
Mullite + 25% Zn + 12.5%Cu(121)40.88920.4440.5320.009315
Mullite + 28% Zn + 2.8%Cu(121)41.07120.5350.6750.011812
ZrSiO4(200)27.01713.5080.1880.003343
ZrSiO4 + 25% Zn + 12.5%Cu(200)27.06813.5340.4680.008217
ZrSiO4 + 28% Zn + 2.8%Cu(200)27.21713.6080.6560.011412
SiO2(101)21.66710.8330.2460.004332
SiO2 + 25% Zn + 12.5%Cu(101)21.73710.8680.470.008217
SiO2 + 28% Zn + 2.8%Cu(101)21.9210.960.6230.010912
ZrO2(−111)28.19614.0980.2090.003639
ZrO2 + 25% Zn + 12.5%Cu(−111)28.28914.1440.4680.008217
ZrO2 + 28% Zn + 2.8%Cu(−111)28.44114.2200.6060.010613.489

References

  1. Seabra, M.P.; Pires, R.R.; Labrincha, J.A. Ceramic tiles for photodegradation of Orange II solutions. Chem. Eng. J. 2011, 171, 692–702. [Google Scholar] [CrossRef]
  2. Yang, H.; Xu, S.; Chitwood, D.E.; Wang, Y. Ceramic water filter for point-of-use water treatment in developing countries: Principles, challenges and opportunities. Front. Environ. Sci. Eng. 2020, 14, 79. [Google Scholar] [CrossRef]
  3. Harabi, A.; Zenikheri, F.; Boudaira, B.; Bouzerara, F.; Guechi, A.; Foughali, L. A new and economic approach to fabricate resistant porous membrane supports using kaolin and CaCO3. J. Eur. Ceram. Soc. 2014, 34, 1329–1340. [Google Scholar] [CrossRef]
  4. Kouras, N.; Harabi, A.; Bouzerara, F.; Foughali, L.; Policicchio, A.; Stelitano, S.; Galiano, F.; Figoli, A. Macro-porous ceramic supports for membranes prepared from quartz sand and calcite mixtures. J. Eur. Ceram. Soc. 2017, 37, 3159–3165. [Google Scholar] [CrossRef]
  5. Bouzerara, F.; Boulanacer, S.; Harabi, A. Shaping of microfiltration (MF) ZrO2 membranes using a centrifugal casting method. Ceram. Inter. 2015, 41, 5159–5163. [Google Scholar] [CrossRef]
  6. Otitojua, T.A.; Okoyeb, P.U.; Chend, G.; Lia, Y.; Okoyec, M.O.; Li, S. Advanced ceramic components: Materials, fabrication, and applications. J. Ind. Eng. Chem. 2020, 85, 34–65. [Google Scholar] [CrossRef]
  7. Harabi, A.; Karboua, N.; Achour, S. Effect of thickness and orientation of alumina fibrous thermal insulation on microwave heating in a modified domestic 2.45 GHz multi-mode cavity. Int. J. Appl. Ceram. Technol. 2012, 9, 124–132. [Google Scholar] [CrossRef]
  8. Harabi, E.; Harabi, A.; Mezahi, F.Z.; Zouai, S.; Karboua, N.; Chehalatt, S. Effect of P2O5 on mechanical properties of porous natural hydroxyapatite derived from cortical bovine bones sintered at 1050 °C. Des. Wat. Treat. 2016, 57, 5297–5302. [Google Scholar] [CrossRef]
  9. Ghouil, B.; Harabi, A.; Bouzerara, F. Elaboration and characterization of ceramic membrane supports from raw materials used in microfiltration. Des. Wat. Treat. 2016, 57, 5241–5245. [Google Scholar] [CrossRef]
  10. Foughali, L.; Harabi, A.; Barama, S.E.; Bouzerara, F.; Guechi, A.; Boudaira, B. Effect of sodium phosphate additions on mechanical properties of porous Sigue quartz sand. Des. Wat. Treat. 2016, 57, 5286–5291. [Google Scholar] [CrossRef]
  11. Ghouil, B.; Harabi, A.; Bouzerara, F.; Boudaira, B.; Guechi, A.; Demir, M.M.; Figoli, A. Development and characterization of tubular composite ceramic membranes using natural alumino-silicates for microfiltration applications. Mat. Charact. 2015, 103, 18–27. [Google Scholar] [CrossRef] [Green Version]
  12. Mdjemem, N.; Harabi, A.; Bouzerara, F.; Foughali, L.; Boudaira, B.; Guechi, A.; Brihi, N. Elaboration and characterization of low cost ceramics microfiltration membranes applied to the sterilization of plant tissue culture media. J. Taiwan Inst. Chem. Eng. 2016, 59, 79–85. [Google Scholar] [CrossRef]
  13. Harabi, A.; Kasrani, S.; Foughali, L.; Benhassine, M.T.; Kitouni, S. Effect of TiO2 additions on densification and mechanical properties of new mulltifunction resistant porcelains using economic raw materials. Ceram. Inter. 2017, 43, 5547–5556. [Google Scholar] [CrossRef]
  14. Harabi, E.; Harabi, A.; Foughali, L.; Chehlatt, S.; Zouai, S.; Mezahi, F.Z. Grain growth in sintered natural hydroxyapatite. Acta Phys. Pol. A 2015, 127, 1161–1163. [Google Scholar] [CrossRef]
  15. Boudaira, B.; Harabi, A.; Bouzerara, F.; Zenikheri, F.; Guechi, A. Preparation and characterization of membrance supports for microfiltration and ultrafiltration using kaolin (DD2) and CaCO3. Des. Wat. Treat. 2016, 57, 5258–5265. [Google Scholar] [CrossRef]
  16. Chehlatt, S.; Harabi, A.; Oudadesse, H.; Harabi, E. In Vitro Bioactivity Study of Pure Wollastonite Prepared from Local Raw Materials. Acta Phys. Pol. A 2015, 127, 925–927. [Google Scholar] [CrossRef]
  17. Ma, J.; Wang, K.; Li, L.; Zhang, T.; Kong, Y.; Komarneni, S. Visible-light photocatalytic decolorization of Orange II on Cu2O/ZnO nanocomposites. Ceram. Int. 2015, 41, 2050–2056. [Google Scholar] [CrossRef]
  18. Siuleiman, S.; Kaneva, N.; Bojinova, A.; Papazova, K.; Apostolov, A.; Dimitrov, D. Photodegradation of Orange II by ZnO and TiO2powders and nanowire ZnO and ZnO/TiO2 thin films. Colloids Surf. A Physicochem. Eng. Aspects 2014, 460, 408–413. [Google Scholar] [CrossRef]
  19. Mecif, A.; Soro, J.; Harabi, A.; Bonnet, J.P. Preparation of Mullite- and Zircon-Based Ceramics Using Kaolinite and Zirconium Oxide: A. Sintering Study. J. Am. Ceram. Soc. 2010, 93, 1306–1312. [Google Scholar] [CrossRef]
  20. Witoon, T.; Permsirivanich, T.; Chareonpanich, M. Chitosan-assisted combustion synthesis of CuO–ZnO nanocomposites: Effect of pH and chitosan concentration. Ceram. Int. J. 2013, 39, 3371–3375. [Google Scholar] [CrossRef]
  21. Ezeigwe, E.R.; Tan, M.T.T.; Khiew, P.S.; Siong, C.W. One-step green synthesis of graphene/ZnO nanocomposites for electrochemical capacitors. Ceram. Int. J. 2015, 41, 715–724. [Google Scholar] [CrossRef]
  22. Marto, J.; São Marcos, P.; Trindade, T.; Labrincha, J.A. Photocatalytic decolouration of Orange II by ZnO active layers screen-printed on ceramic tiles. J. Hazard. Mater. 2009, 163, 36–42. [Google Scholar] [CrossRef]
  23. Huang, J.; Dai, Y.; Gu, C.; Sun, Y.; Liu, J. Preparation of porous flower-like CuO/ZnO nanostructures and analysis of their gas-sensing property. J. Alloys Comp. 2013, 575, 115–122. [Google Scholar] [CrossRef]
  24. Zaman, S. Synthesis of ZnO, CuO and Their Composite Nanostructures for Optoelectronics, Sensing and Catalytic Applications; Linköping University, in Science and Technology: Linköping, Sweden, 2012. [Google Scholar] [CrossRef]
  25. Kanade, K.G.; Kale, B.B.; Baeg, J.O.; Lee, S.M.; Lee, C.W.; Moon, S.J.; Chang, H. Self-assembled aligned Cu doped ZnO nanoparticles for photocatalytic hydrogen production under visible light irradiation. Mater. Chem. Phys. 2007, 102, 98–104. [Google Scholar] [CrossRef]
  26. Sathishkumar, P.; Sweena, R.; Wu, J.J.; Anandan, S. Synthesis of CuO-ZnO nanophotocatalys for visible light assisted degradation of a textile dye in aqueous solution. Chem. Eng. J. 2011, 171, 136–140. [Google Scholar] [CrossRef]
  27. Thaweesaeng, N.; Supankit, S.; Techidheera, W.; Pecharapa, W. Structure properties of as-synthesized Cu-doped ZnO nanopowder synthesized by co-precipitation method. Eng. Procedia 2013, 34, 682–688. [Google Scholar] [CrossRef] [Green Version]
  28. Shao, B.; Qiu, J.H.; Zhu, K.J.; Cao, Y.; Ji, H.L. Effect of CuO on dielectric and piezoelectric properties of (K0.4425Na0.52Li0.0375) (Nb0.87Ta0.06Sb0.07) O3 ceramics. J. Alloys Compd. 2012, 515, 128–133. [Google Scholar] [CrossRef]
  29. Jurado, L.T.; Hernández RM, A.; Rangel, E. Sol-Gel synthesis of mullite starting from different inorganic precursors. J. Powder Technol. 2013, 7. [Google Scholar] [CrossRef] [Green Version]
  30. Vempati, R.K.; Rao, A.; Hess, T.R.; Cocke, D.L.; Lauer, H.V., Jr. Fractionation and characterization of texas lignite class ‘F’ fly ash by XRD, TGA, FTIR and SFM. Cement Concr. Res. 1994, 24, 1153–1164. [Google Scholar] [CrossRef]
  31. Gougazeha, M.; Buhl, J.-C. Synthesis and characterization of zeolite A bihydrothermal transformation of natural Jordanian kaolin. JAAU Basic Appl. Sci. 2014, 15, 35–42. [Google Scholar] [CrossRef] [Green Version]
  32. Zhang, M.; Salje, E.K.H. Infrared spectroscopic analysis of zircon: Radiation damage and the metamict state. J. Phys. Condens. Matter. 2001, 13, 3057–3071. [Google Scholar] [CrossRef]
  33. Agorku, E.S.; Kuvarega, A.T.; Mamba, B.B.; Pandey, A.C.; Mishra, A.K. Enhanced visible-light photocatalytic activity of multi-elements-doped ZrO2 for degradation of indigo carmine. J. Rare Earths 2015, 33, 498. [Google Scholar] [CrossRef]
  34. Habibi, M.H.; Karimi, B. Application of impregnation combustion method for fabrication of nanostructure CuO/ZnO composite oxide: XRD, FESEM, DRS and FTIR study. J. Ind. Eng. Chem. 2014, 20, 1566–1570. [Google Scholar] [CrossRef]
  35. Lellis, B.; Fávaro-Polonio, C.Z.; Pamphile, J.A.; Polonio, J.C. Effects of textile dyes on health and the environment and bioremediation potential of living organisms. Biotechnol. Res. Innov. 2019, 3, 275–290. [Google Scholar] [CrossRef]
  36. Bandara, J.; Herrera, F.G.; Kiwi, J.T.; Pulgarin, C.O. Degradation of concentrated-solutions of non-biodegradable orange-ii by photocatalytic and electrochemical methods. J. Chem. Res. 1998, 234. [Google Scholar] [CrossRef]
  37. Qiu, R.; Zhang, D.; Mo, Y.; Song, L.; Brewer, E.; Huang, X.; Xiong, Y. Photocatalytic activity of polymer-modified ZnO under visible light irradiation. J. Hazard. Mater. 2008, 156, 80–85. [Google Scholar] [CrossRef]
  38. Poulios, I.; Micropoulou, E.; Panou, R.; Kostopoulou, E. Photooxidation of eosin Y in the presence of semiconducting oxides. Appl. Catal. B 2003, 41, 345–355. [Google Scholar] [CrossRef]
  39. Novikov, S.; Timoshcnkov, S. Long-range electrostatic forces on the surfaces ofaluminum oxide and silica oxide’. Adv. Colloid Interface Sci. 2003, 105, 341–353. [Google Scholar] [CrossRef]
  40. Zhang, C.; Chen, H.; Ma, M.; Yang, Z. Facile synthesis of magnetically recoverable Fe3O4/Al2O3/molecularly imprinted TiO2 nanocomposites and its molecular recognitive photocatalytic degradation of target contaminant. Mol. Catal. A Chem. 2015, 402, 10–16. [Google Scholar] [CrossRef]
  41. Fu, X.; Tang, W.; Ji, L.; Chen, S. V2O5/Al2O3 composite photocatalyst: Preparation, characterization, and the role of Al2O3. Chem. Eng. J. 2012, 180, 170–177. [Google Scholar] [CrossRef]
  42. Bansal, P.; Chaudhary, G.R.; Mehta, S.K. Comparative study of catalytic activity of ZrO2 nanoparticles for sonocatalytic and photocatalytic degradation of cationic and anionic dyes. Chem. Eng. J. 2015, 280, 475–485. [Google Scholar] [CrossRef]
  43. Sheini, F.J.; Singh, J.; Srivasatva, O.N.; Joag, D.S.; More, M.A. Electrochemical synthesis of Cu /ZnO nanocomposite films and their efficient field emission behaviour. Appl. Surf. Sci. 2010, 256, 2110–2114. [Google Scholar] [CrossRef]
  44. Tan, G.; Huang, J.; Zhang, L.; Ren, H.; Xia, A. An enhanced visible-light-driven photocatalyst: Conduction band control of Bi2WO6 crystallites by Cu ion modification. Ceram. Int. 2014, 40, 11671–11679. [Google Scholar] [CrossRef]
  45. Saravanana, R.; Karthikeyan, S.; Gupta, V.K.; Sekaran, G.; Narayanane, V.; Stephen, A. Enhanced photocatalytic activity of ZnO/CuO nanocomposite for the degradation of textile dye on visible light illumination. Mat. Sci. Eng. C 2013, 33, 91–98. [Google Scholar] [CrossRef] [PubMed]
  46. Sakib, A.A.M.; Masum, S.M.; Hoinkis, J.; Islam, R.; Molla, M.A.I. Synthesis of CuO/ZnO Nanocomposites and Their Application in Photodegradation of Toxic Textile Dye. J. Compos. Sci. 2019, 3, 91. [Google Scholar] [CrossRef] [Green Version]
  47. Basahel, S.N.; Ali, T.T.; Mokhtar, M.; Narasimharao, K. Influence of crystal structure of nanosized ZrO2 on photocatalytic degradation of methyl orange. Nanoscale Res. Lett. 2015, 10, 73. [Google Scholar] [CrossRef] [Green Version]
  48. Katal, R.; Masudy-Panahb, S.; Kongb, E.Y.-J.; Dasineh Khiavic, N.; Davood, M.H.; Farahanid, A.; Gong, X. Nanocrystal-engineered thin CuO film photocatalyst for visible-light-driven photocatalytic degradation of organic pollutant in aqueous solution. Catal. Today 2020, 340, 236–244. [Google Scholar] [CrossRef]
  49. Al-Ghamdi, A.A.; Khedr, M.H.; Ansari, M.S.; Hasan PM, Z.; Abdel-Wahab, M.S.; Farghali, A.A. RF sputtered CuO thin films: Structural, optical and photo-catalytic behavior. Phys. E 2016, 81, 83–90. [Google Scholar] [CrossRef]
  50. Nezamzadeh-Ejhieh, A.; Karimi-Shamsabadi, M. Comparison of photocatalytic efficiency of supported CuO onto micro and nano particles of zeolite X in photodecolorization of Methylene blue and Methyl orange aqueous mixture. Appl. Catal. A Gen. 2014, 477, 83–92. [Google Scholar] [CrossRef]
  51. Fraile, J.M.; Le Jeune, K.; Mayoral, J.A.; Ravasio, N.; Zaccheri, F. CuO/SiO2as a simple, effective and recoverable catalyst for alkylation of indole derivatives with diazocompounds. Org. Biomol. Chem. 2013, 11, 4327. [Google Scholar] [CrossRef] [Green Version]
  52. Khiavi, N.D.; Katal, R.; Eshkalak, S.K.; Masudy-Panah, S.; Ramakrishna, S.; Jiangyong, H. Visible Light Driven Heterojunction Photocatalyst of CuO–Cu2O Thin Films for Photocatalytic Degradation of Organic Pollutants. Nanomaterials 2019, 9, 1011. [Google Scholar] [CrossRef] [PubMed] [Green Version]
  53. Singha, J.; Mannab, A.K.; Sonia, R.K. Sunlight driven photocatalysis and non-enzymatic glucose sensing performance of cubic structured CuO thin films. Appl. Surf. Sci. 2020, 530, 147258. [Google Scholar] [CrossRef]
  54. Das, S.; Srivastava, V.C. An overview of the synthesis of CuO-ZnO nanocomposite for environmental and other applications. Nanotechnol. Rev. 2018, 7, 267–282. [Google Scholar] [CrossRef]
  55. Paz, D.S.; Foletto, E.L.; Bertuol, D.A.; Jahn, S.L.; Collazzo, G.C.; da Silva, S.S.; Chiavone-Filho, O.; do Nascimento, C.A.O. CuO/ZnO coupled oxide films obtained by the electrodeposition technique and their photocatalytic activity in phenol degradation under solar irradiation. Water Sci. Tech. 2013, 68, 5. [Google Scholar] [CrossRef] [PubMed]
  56. Qamar, M.T.; Aslam, M.; Ismail, I.M.I.; Salah, N.; Hameed, A. Synthesis, Characterization, and Sunlight Mediated Photocatalytic Activity of CuO Coated ZnO for the Removal of Nitrophenols. ACS Appl. Mater. Interfaces 2015, 7, 8757–8769. [Google Scholar] [CrossRef] [PubMed]
  57. Jothibas, M.; Manoharan, C.; Jeyakumar, S.J.; Praveen, P.; Panneerdoss, I.J. Photocatalytic activity of spray deposited ZrO2 nano-thin films on methylene blue decolouration. J. Mater. Sci. Mater. Electron. 2016, 27, 5851–5859. [Google Scholar] [CrossRef]
  58. Polisetti, S.; Deshpande, P.A.; Madras, G. Photocatalytic Activity of Combustion Synthesized ZrO2 and ZrO2/TiO2 Mixed Oxides. Ind. Eng. Chem. Res. 2011, 50, 12915–12924. [Google Scholar] [CrossRef]
  59. Majedi, A.; Davar, F.; Abbasi, A.; Ashrafi, A. Modified Sol–Gel Based Nanostructured Zirconia Thin Film: Preparation, Characterization, Photocatalyst and Corrosion Behavior. J. Inorg. Organomet. Polym. 2016, 26, 932–942. [Google Scholar] [CrossRef]
  60. Bouras, D.; Mecif, A.; Barillé, R.; Harabi, A.; Rasheed, M.; Mahdjoub, A.; Zaabat, M. Cu:ZnO deposited on porous ceramic substrates by a simple thermal method for photocatalytic application. Ceram. Int. 2018, 44, 21546–21555. [Google Scholar] [CrossRef] [Green Version]
  61. Ajmal, A.; Riffat, I.M.; Malik, N.; Idrissc, H.; Nadeem, M.A. Principles and mechanisms of photocatalytic dye degradation on TiO2 based photocatalysts: A comparative overview. RSC Adv. 2014, 4, 37003–37026. [Google Scholar] [CrossRef]
Figure 1. XRD spectra of powders treated at 500 °C prepared by the traditional mixing method (a,b) and co-precipitation method (c,d). χ: Zircon (ZrSiO4), δ: Zirconia (ZrO2), ◊: Cristobalite (SiO2) *: Mullite (3Al2O3.2SiO2), ο: ZnO and φ: CuO. (All of the additional ratios are given in weight percentage). The spectra of the initial clay DD3 (e) and modified DD3 with ZrO2 is shown for comparison (f).
Catalysts 11 00733 g001
Figure 2. SEM images of DD3 (a), DD3+ 14.28 wt% ZnO + 5.37 wt% CuO (b), DD3 + 38 wt% ZrO2 (c), and DD3 + 38 wt% ZrO2+ 14.28 wt% ZnO + 5.37 wt% CuO (d).
Catalysts 11 00733 g002
Figure 3. EDX analysis of catalysts showing composition of elements in table inset (all of the additional ratios are given in weight percentage). (a) DD3, (b) DD3Z, (c) DD3 + (14.28% ZnO—5.37% CuO), (d) DD3Z + (14.28% ZnO—5.37% CuO).
Catalysts 11 00733 g003
Figure 4. Infrared spectra of the catalysts (a,b) mixed power method, (c,d) co-precipitation method with (1) DD3, (2) DD3+ 28 wt% CuO + 2.8 wt% ZnO, (3) DD3 + 14.28 wt% ZnO + 5.37 wt% CuO, (4) DD3Z, (5) DD3Z+ 28 wt% CuO + 2.8 wt% ZnO, (6) DD3Z +14.28 wt% ZnO + 5.37 wt% CuO, (7) DD3+ 25 wt% ZnO + 12.5 wt% CuO, and (8) DD3Z + 25 wt% ZnO + 12.5 wt% CuO.
Catalysts 11 00733 g004
Figure 5. UV-Vis Absorption Spectra of the catalysts. (1) DD3 + 14.28 wt% ZnO + 5.37wt% CuO, (2) DD3, (3) DD3Z + 14.28 wt% ZnO + 5.37wt% CuO, (4) DD3Z (DD3 + 38%ZrO2).
Catalysts 11 00733 g005
Figure 6. UV spectra showing the ZnO doping effect in the ceramic powder prepared by the traditional mix method and treated at 500 °C (degradation of OII (λmax = 484 nm) versus time) (all of the additional ratios are given in weight percentage). (a) DD3, (b) DD3Z, (c) DD3 + 25% ZnO, (d) DD3Z + 25% ZnO, (e) DD3 + 50% ZnO, (f) DD3Z + 50% ZnO, (g) ZnO. R = reference for OII.
Catalysts 11 00733 g006
Figure 7. UV spectra showing the effect of the method for preparing ceramic powders doped and treated at 500 °C for degradation of OII (λmax = 484 nm), Co_precipitation method: (a) DD3 + 25 wt% Zn + 12.5 wt% Cu, (b) DD3Z + 25 wt% Zn + 12.5 wt% Cu, (c) DD3 + 28 wt% Zn + 2.8 wt% Cu, (d) DD3Z + 28 wt% Zn + 2.8 wt% Cu. Mixed powder method: (e) DD3 + 28 wt% ZnO + 2.8 wt% CuO, (f) DD3Z + 28 wt% ZnO + 2.8 wt% CuO, (g) DD3 + 14.28 wt% ZnO + 5.37wt% CuO, (h) DD3Z + 14.28 wt% ZnO + 5.37wt% CuO. R = reference for OII.
Catalysts 11 00733 g007
Figure 8. Percentage change of orange II photodegradation versus time for ceramic powders prepared by two methods: Traditional mix and co-precipitation for (a) DD3 and (b) DD3Z = DD3 + 38 wt% ZrO2 (All the additional ratios are given in weight percentage).
Catalysts 11 00733 g008
Table 1. Comparison between powder and thin film of dye degradation.
MaterialPowderThin Film
DD3Z + 50 wt% ZnO98.9% of a OII (15 min)
DD3 + 50 wt% ZnO98.9% of a OII (30 min)
DD3 + 5.37 wt% CuO + 14.28 wt% ZnO82.4% (30 min)
DD3Z + 14.28 wt% ZnO + 14.28 wt% ZnO93.6% (15 min)
co-precipitation technique
28 wt% ZnO and 2.8 wt% CuO
DD3 + 28 wt% ZnO and 2.8 wt% CuO84% (150 min)
DD3Z + 28 wt% ZnO and 2.8 wt% CuO99.6% (45 min)
CuOMethylene Blue (MB) minimum 2 ppm after 200 min
CuO/zeoliteX [52], CuO/SiO2 [53], heterojunction CuO–Cu2O thin film Methylene Blue (MB) minimum 2 ppm after 200 min
CuO/ZnO composite oxide thin films 90% (120 min)
ZnO with CuO to form CuO@ZnO core−shell nitrophenols (180 min)
ZrO2/TiO2 mixed oxides [58] 80% degradation of a dye was observed in 2 h
ZrO2 nano-thin films [59] MB dye 72.13% (180 min)
ZrO2 calcined at 500 °C 85% methyl orange (60 min)
Publisher’s Note: MDPI stays neutral with regard to jurisdictional claims in published maps and institutional affiliations.

