Article

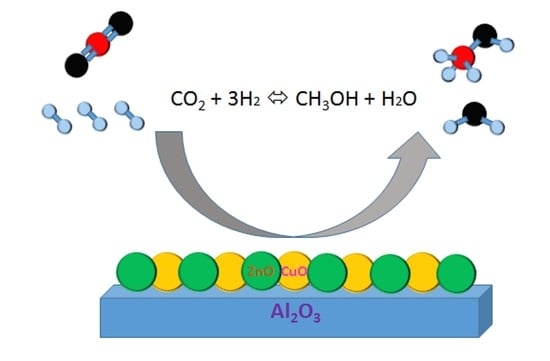
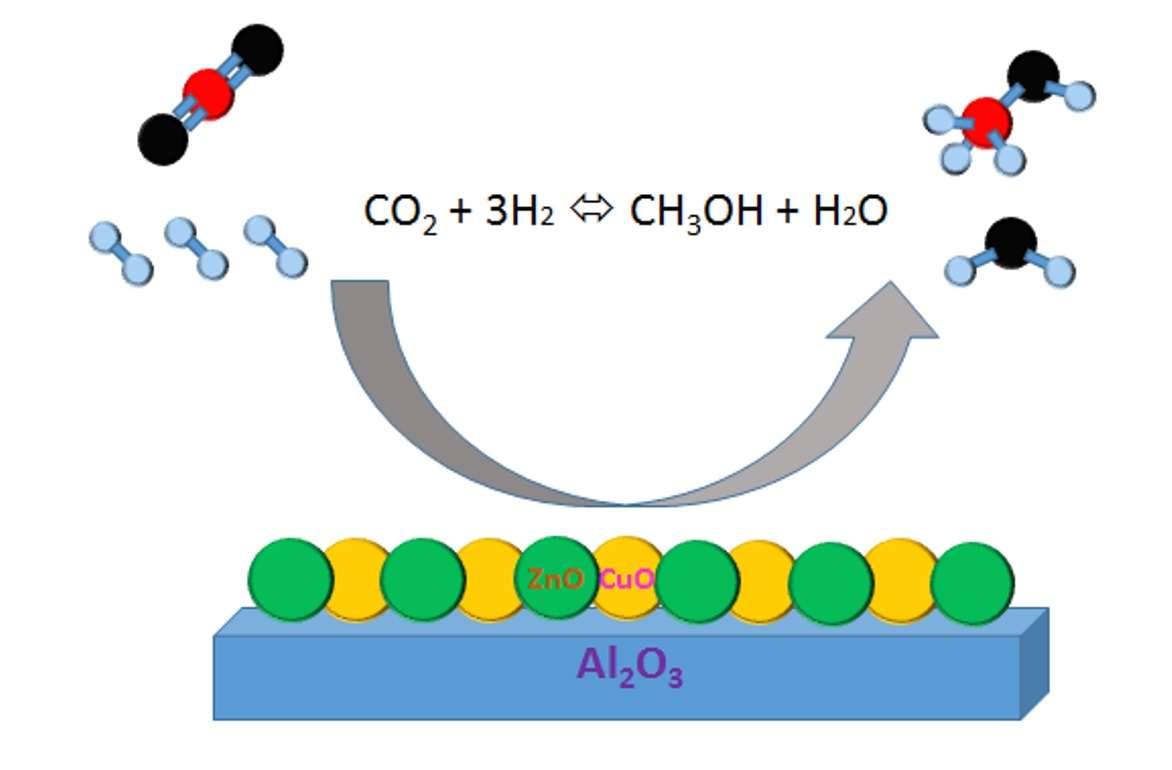
Modifications in the Composition of CuO/ZnO/Al2O3 Catalyst for the Synthesis of Methanol by CO2 Hydrogenation

1
School of Chemistry, Cardiff University, Main Building, Park Place, Cardiff CF10 3AT, UK
2
Catalysis, Molecular Separations and Reactor Engineering Group (CREG), Aragon Institute of Engineering Research (I3A), University of Zaragoza, 50009 Zaragoza, Spain
*
Author to whom correspondence should be addressed.
Submission received: 9 June 2021 / Revised: 23 June 2021 / Accepted: 23 June 2021 / Published: 25 June 2021

Abstract

:
Renewable methanol, obtained from CO2 and hydrogen provided from renewable energy, was proposed to close the CO2 loop. In industry, methanol synthesis using the catalyst CuO/ZnO/Al2O3 occurs at a high pressure. We intend to make certain modification on the traditional catalyst to work at lower pressure, maintaining high selectivity. Therefore, three heterogeneous catalysts were synthesized by coprecipitation to improve the activity and the selectivity to methanol under mild conditions of temperature and pressure. Certain modifications on the traditional catalyst Cu/Zn/Al2O3 were employed such as the modification of the synthesis time and the addition of Pd as a dopant agent. The most efficient catalyst among those tested was a palladium-doped catalyst, 5% Pd/Cu/Zn/Al2O3. This had a selectivity of 64% at 210 °C and 5 bar.

Graphical Abstract

1. Introduction

The scientific community widely considers global warming as a major challenge to our society. The main cause of this critical issue is the increase in the CO2 concentration in the atmosphere due to the massive use of fossil fuels [1], which grew in recent years [2]. One of the ways to address this problem is to use the CO2 as resource in the synthesis of valuable products [3]. Renewable methanol, i.e., methanol obtained from CO2 and hydrogen provided from renewable energy (solar or wind power), was proposed by the Nobel Price G. Olah to close the CO2 loop [4,5].
Methanol is already one of the key basic chemicals, being the second most manufactured compound from synthesis gas, after ammonia [6]. It is very soluble in water and easily biodegradable, making it a viable alternative for large scale efficient energy storage [7]. It stores both carbon and hydrogen in liquid form and may be converted into light olefins, gasoline, and hydrocarbons [8]. In industry, methanol is produced using synthesis gas and the traditional catalyst CuO/ZnO/Al2O3 [9,10,11]. To optimize the process of methanol synthesis and obtain high selectivity values, it is essential to be aware of the reactions that take place in this synthesis.
CO2 + 3 H2 ⇄ CH3OH + H2O  ∆H298K = −49.5 kJ/mol CO2
CO2 + H2 ⇄ CO + H2O      ∆H298K = −41.2 kJ/mol CO2
CO + 2 H2 ⇄ CH3OH      ∆H298K = −90.7 kJ/mol CO
Methanol formation is exothermic and therefore the thermodynamic equilibrium is favoured at low temperatures, while kinetics is favoured by high temperature. Although reaction (1) as well as reaction (3) both give methanol as a major product, it was confirmed through reagents with isotopes that, under industrial conditions, the first reaction is more favourable, and when reactions are enabled without carbon monoxide as a staring material, methanol is entirely formed through reaction (1) without passing through the third one [12]. In addition, the difference between the number of moles of starting materials and products requires operation at high pressure to obtain a high yield to methanol. Methyl alcohol is exclusively achieved through the direct hydrogenation of carbon dioxide (reaction 1) [13]. CO2 hydrogenation competes with reverse water-gas-shift (reaction 2) which drops the selectivity to methanol. Reverse water-gas shift is endothermic, and thus, its equilibrium is favoured at high temperatures [14].
Hence, a compromise between the thermodynamics and kinetics should be pursued to favour the desired product. Although industrial practice favours high pressure (50–100 bar) to increase the yield, the small scale of operation using renewable hydrogen would require lower pressure to decrease the capital cost. It is possible to increase methanol yield, according to Le Châtelier principle, by removing water or/and methanol to shift the equilibrium to the formation of desired product and obtaining a higher conversion. This can be achieved by a membrane reactor, where the membrane removes selectively water or methanol. Struis et al. [15] proposed the use of a membrane reactor using Nafion membranes. However, the maximum temperature achievable with such material was 200 °C, which is too low. Menéndez et al. [16] proved through a simulation that a membrane reactor with a zeolite membrane could provide higher methanol yield than a conventional one. Gallucci et al. [17] experimentally proved that the CO2 conversion in a zeolite membrane reactor was higher than in a traditional one. Preliminary experiments in a zeolite membrane reactor showed that at low pressure the effect of reverse water-gas-shift dominates in such a way that the removal of water increases the formation of CO2 more than the methanol synthesis [18]. This implies that there is a need for more selective catalysts at low pressure to achieve the full advantages of a membrane reactor.
The purpose of this work is to prepare, characterize, and test a series of different catalysts by modification of the traditional catalyst CuO/ZnO/Al2O3 and to determine which one exhibits higher selectivity to methanol at low pressure (maximum 5 bar). Moreover, this work explores whether the proposed changes improve the activity of the catalyst at these experimental conditions, which could give even better result with the use of a membrane reactor.

2. Results and Discussion

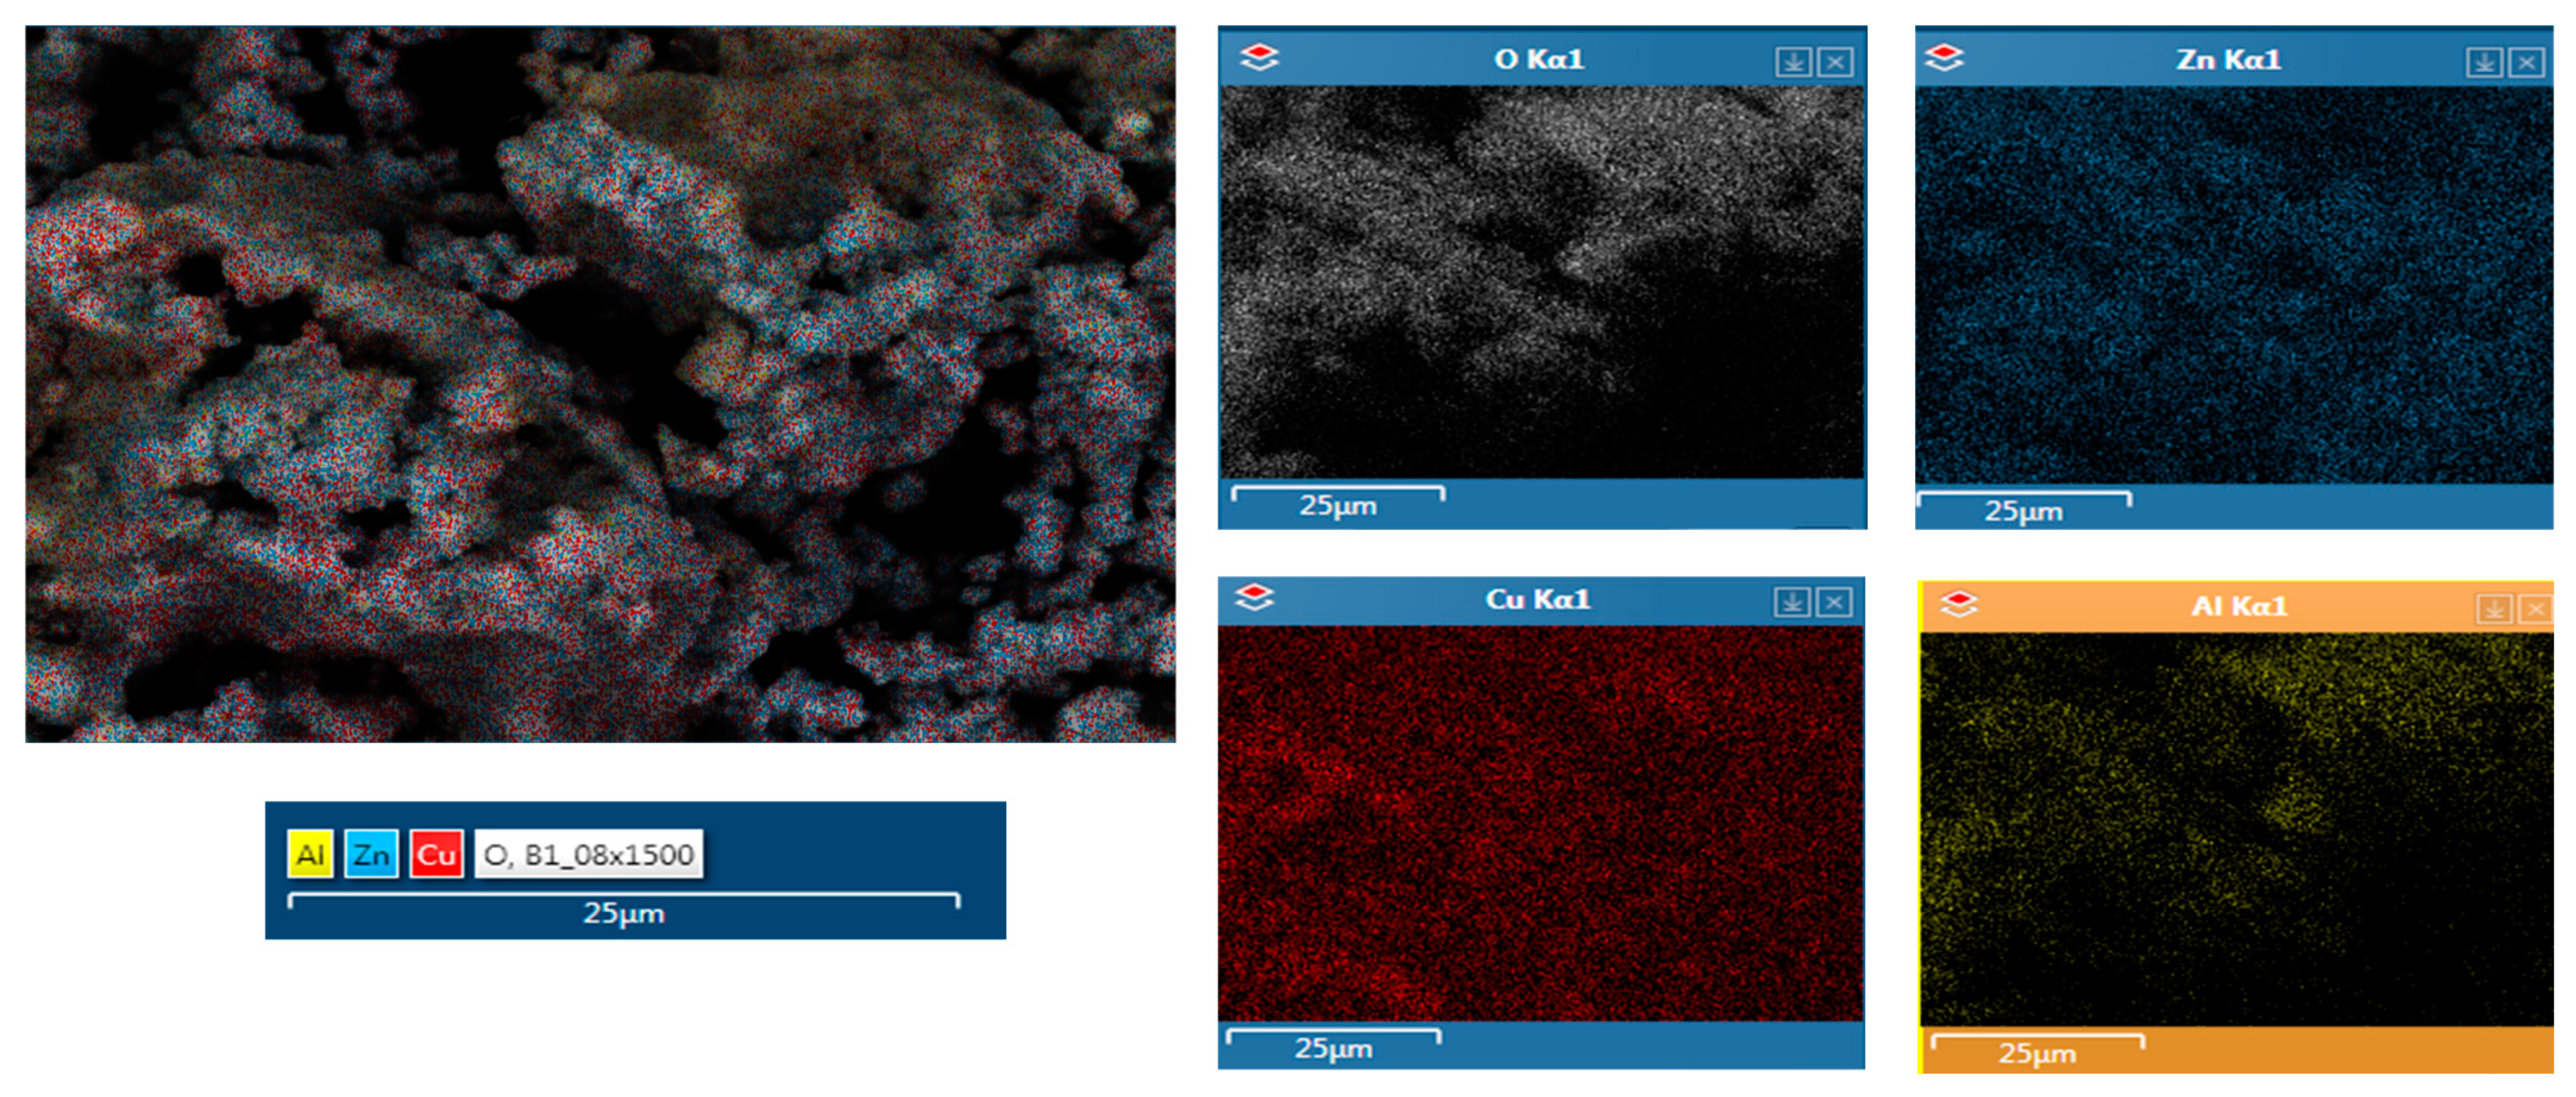
2.1. Catalyst Characterization
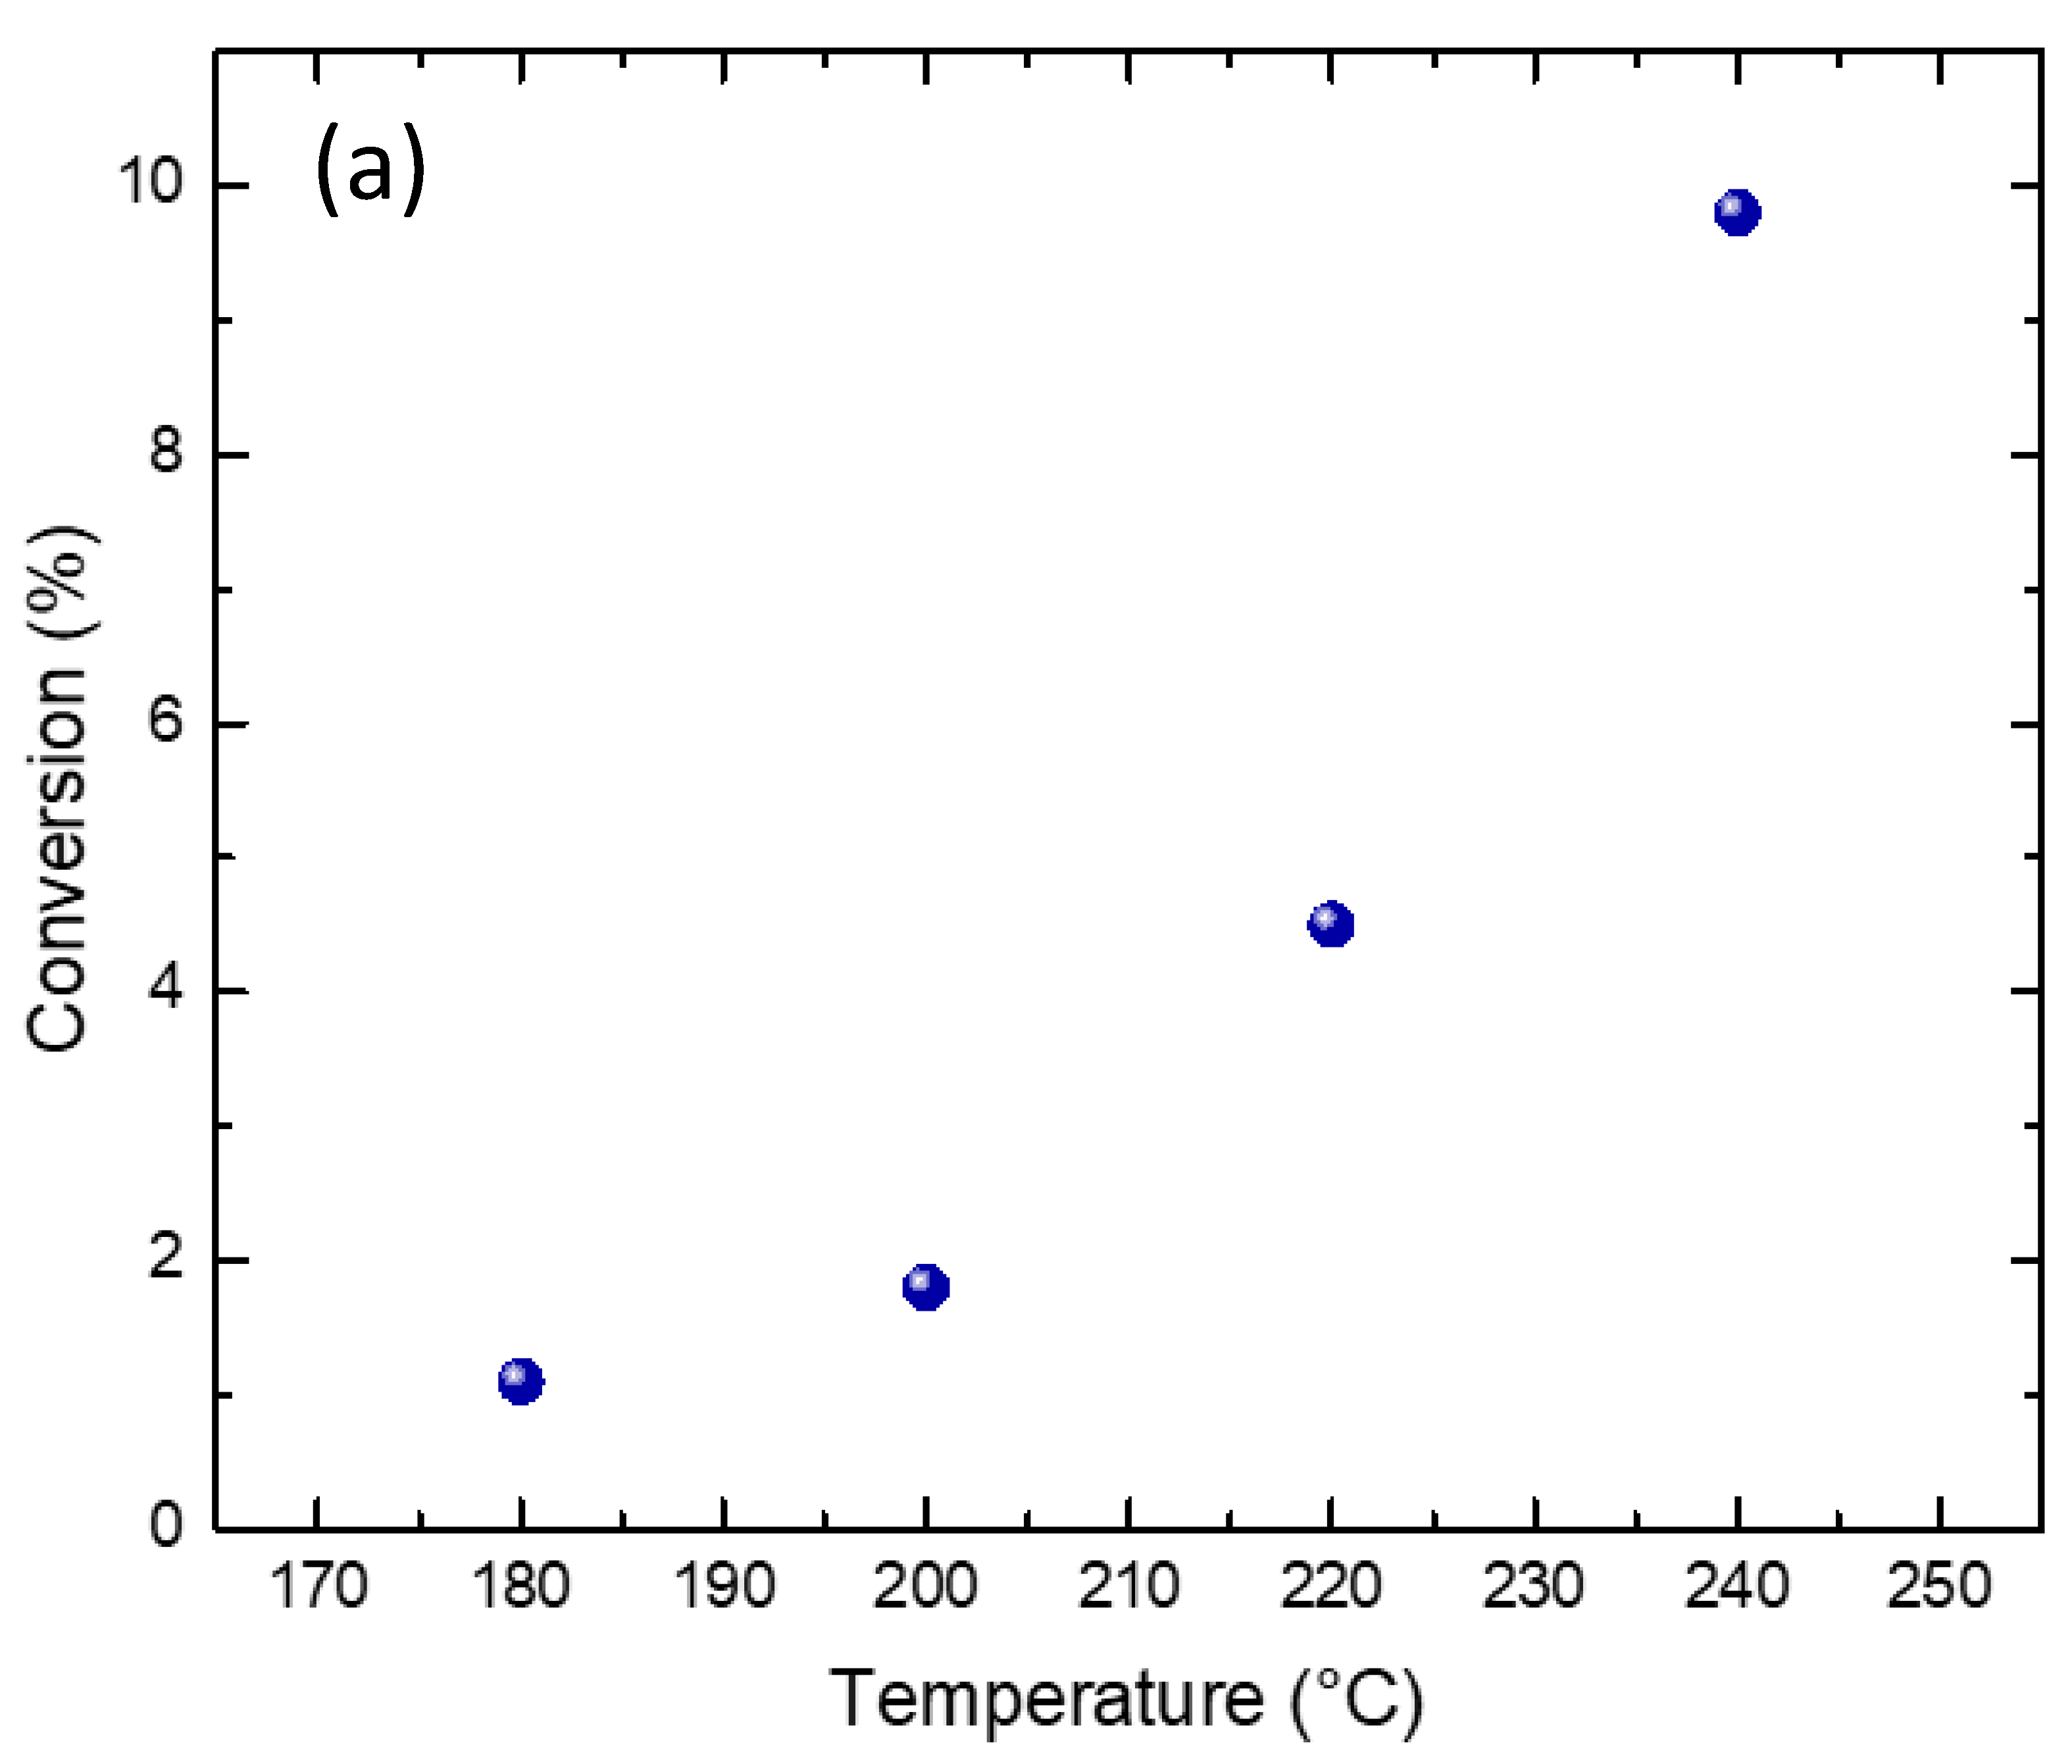
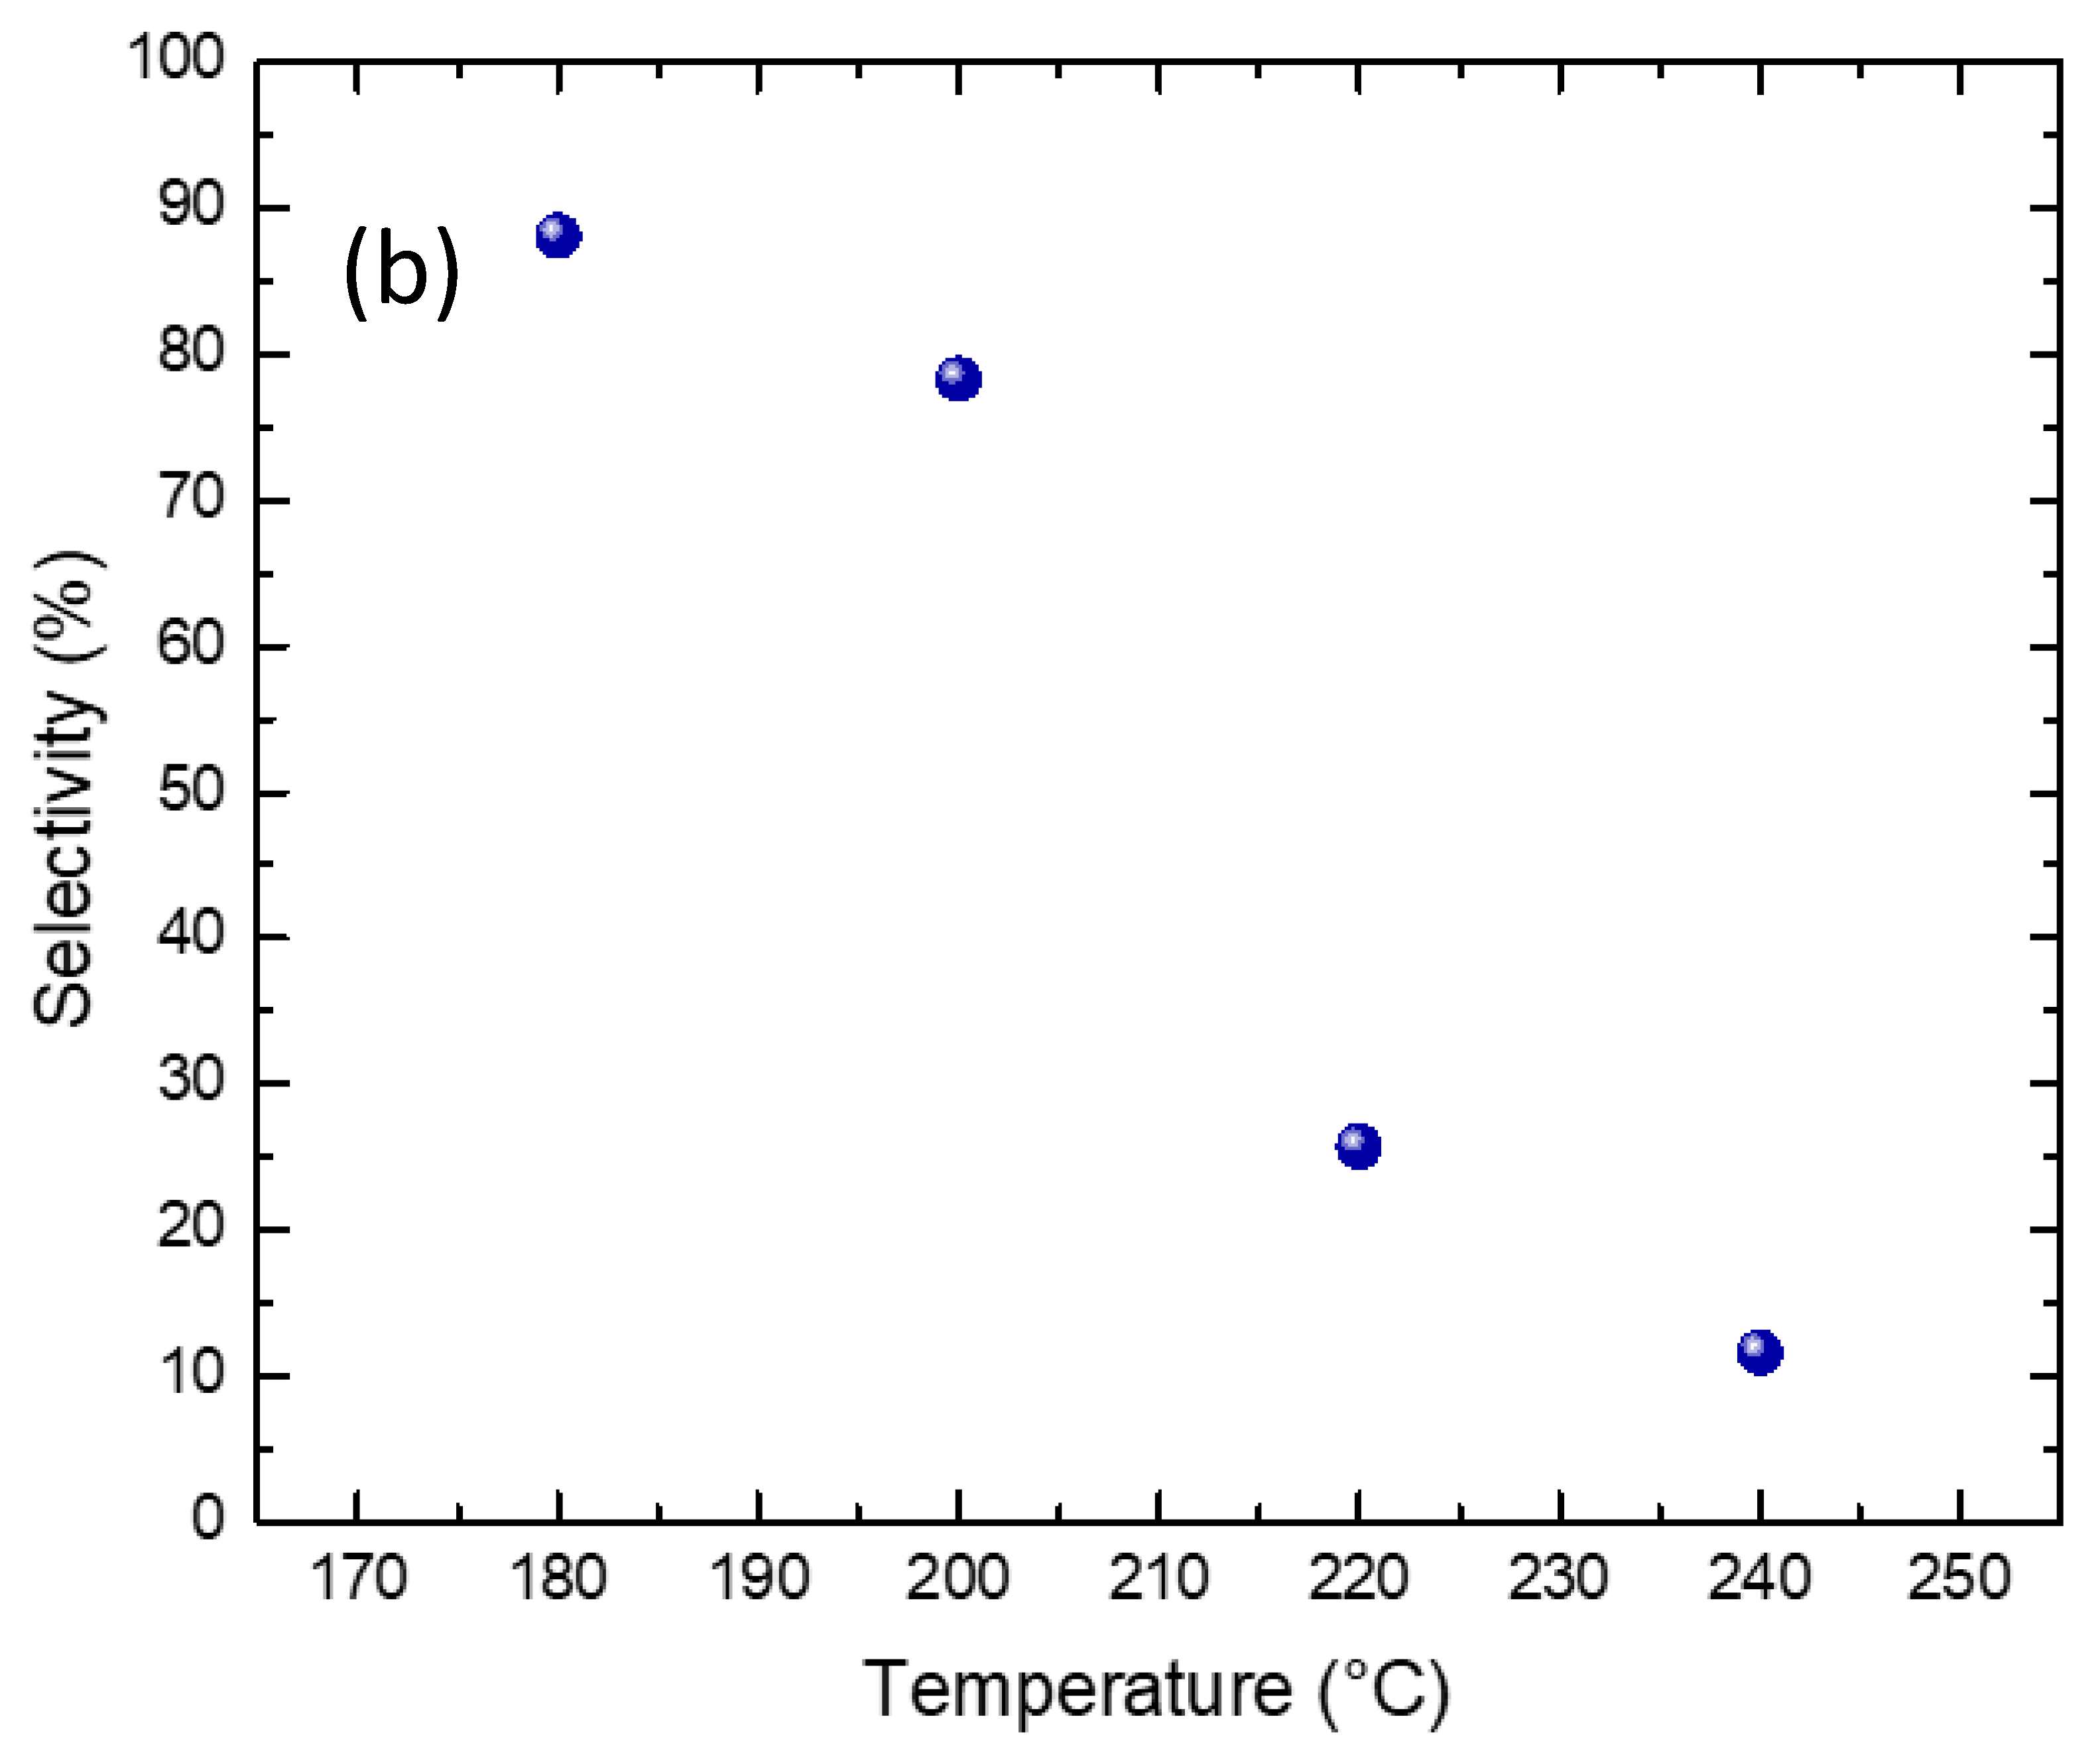
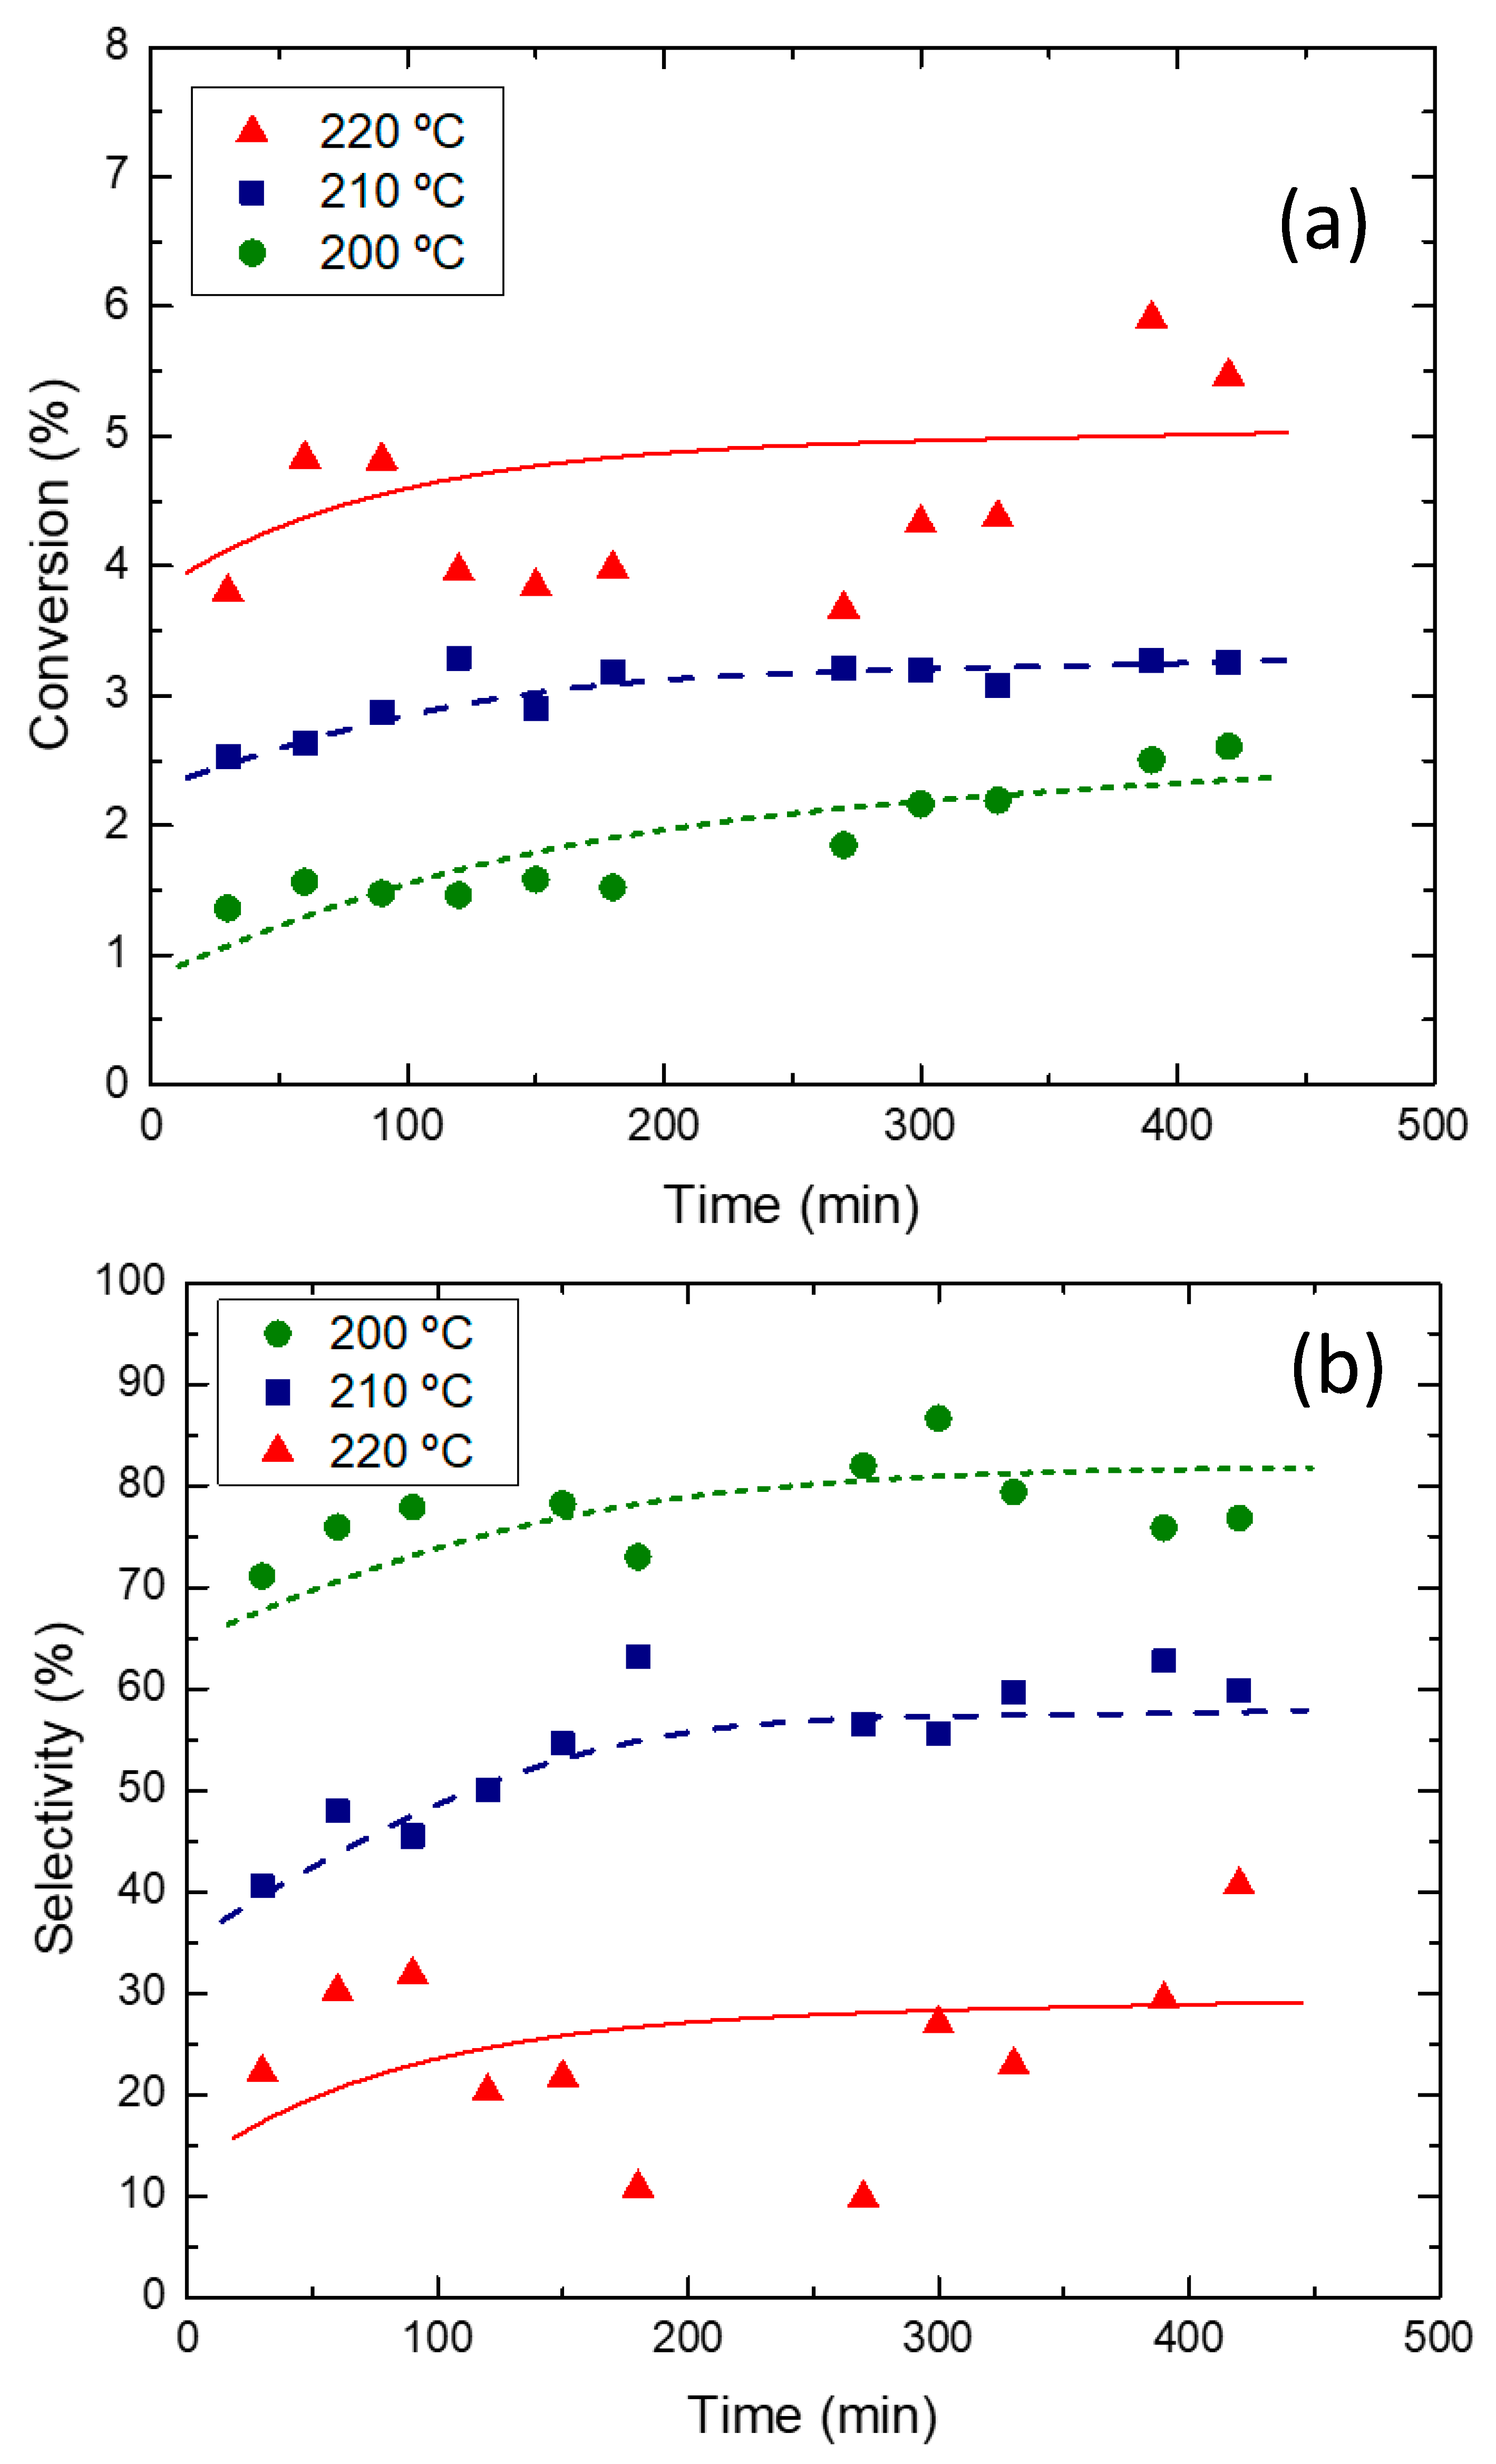
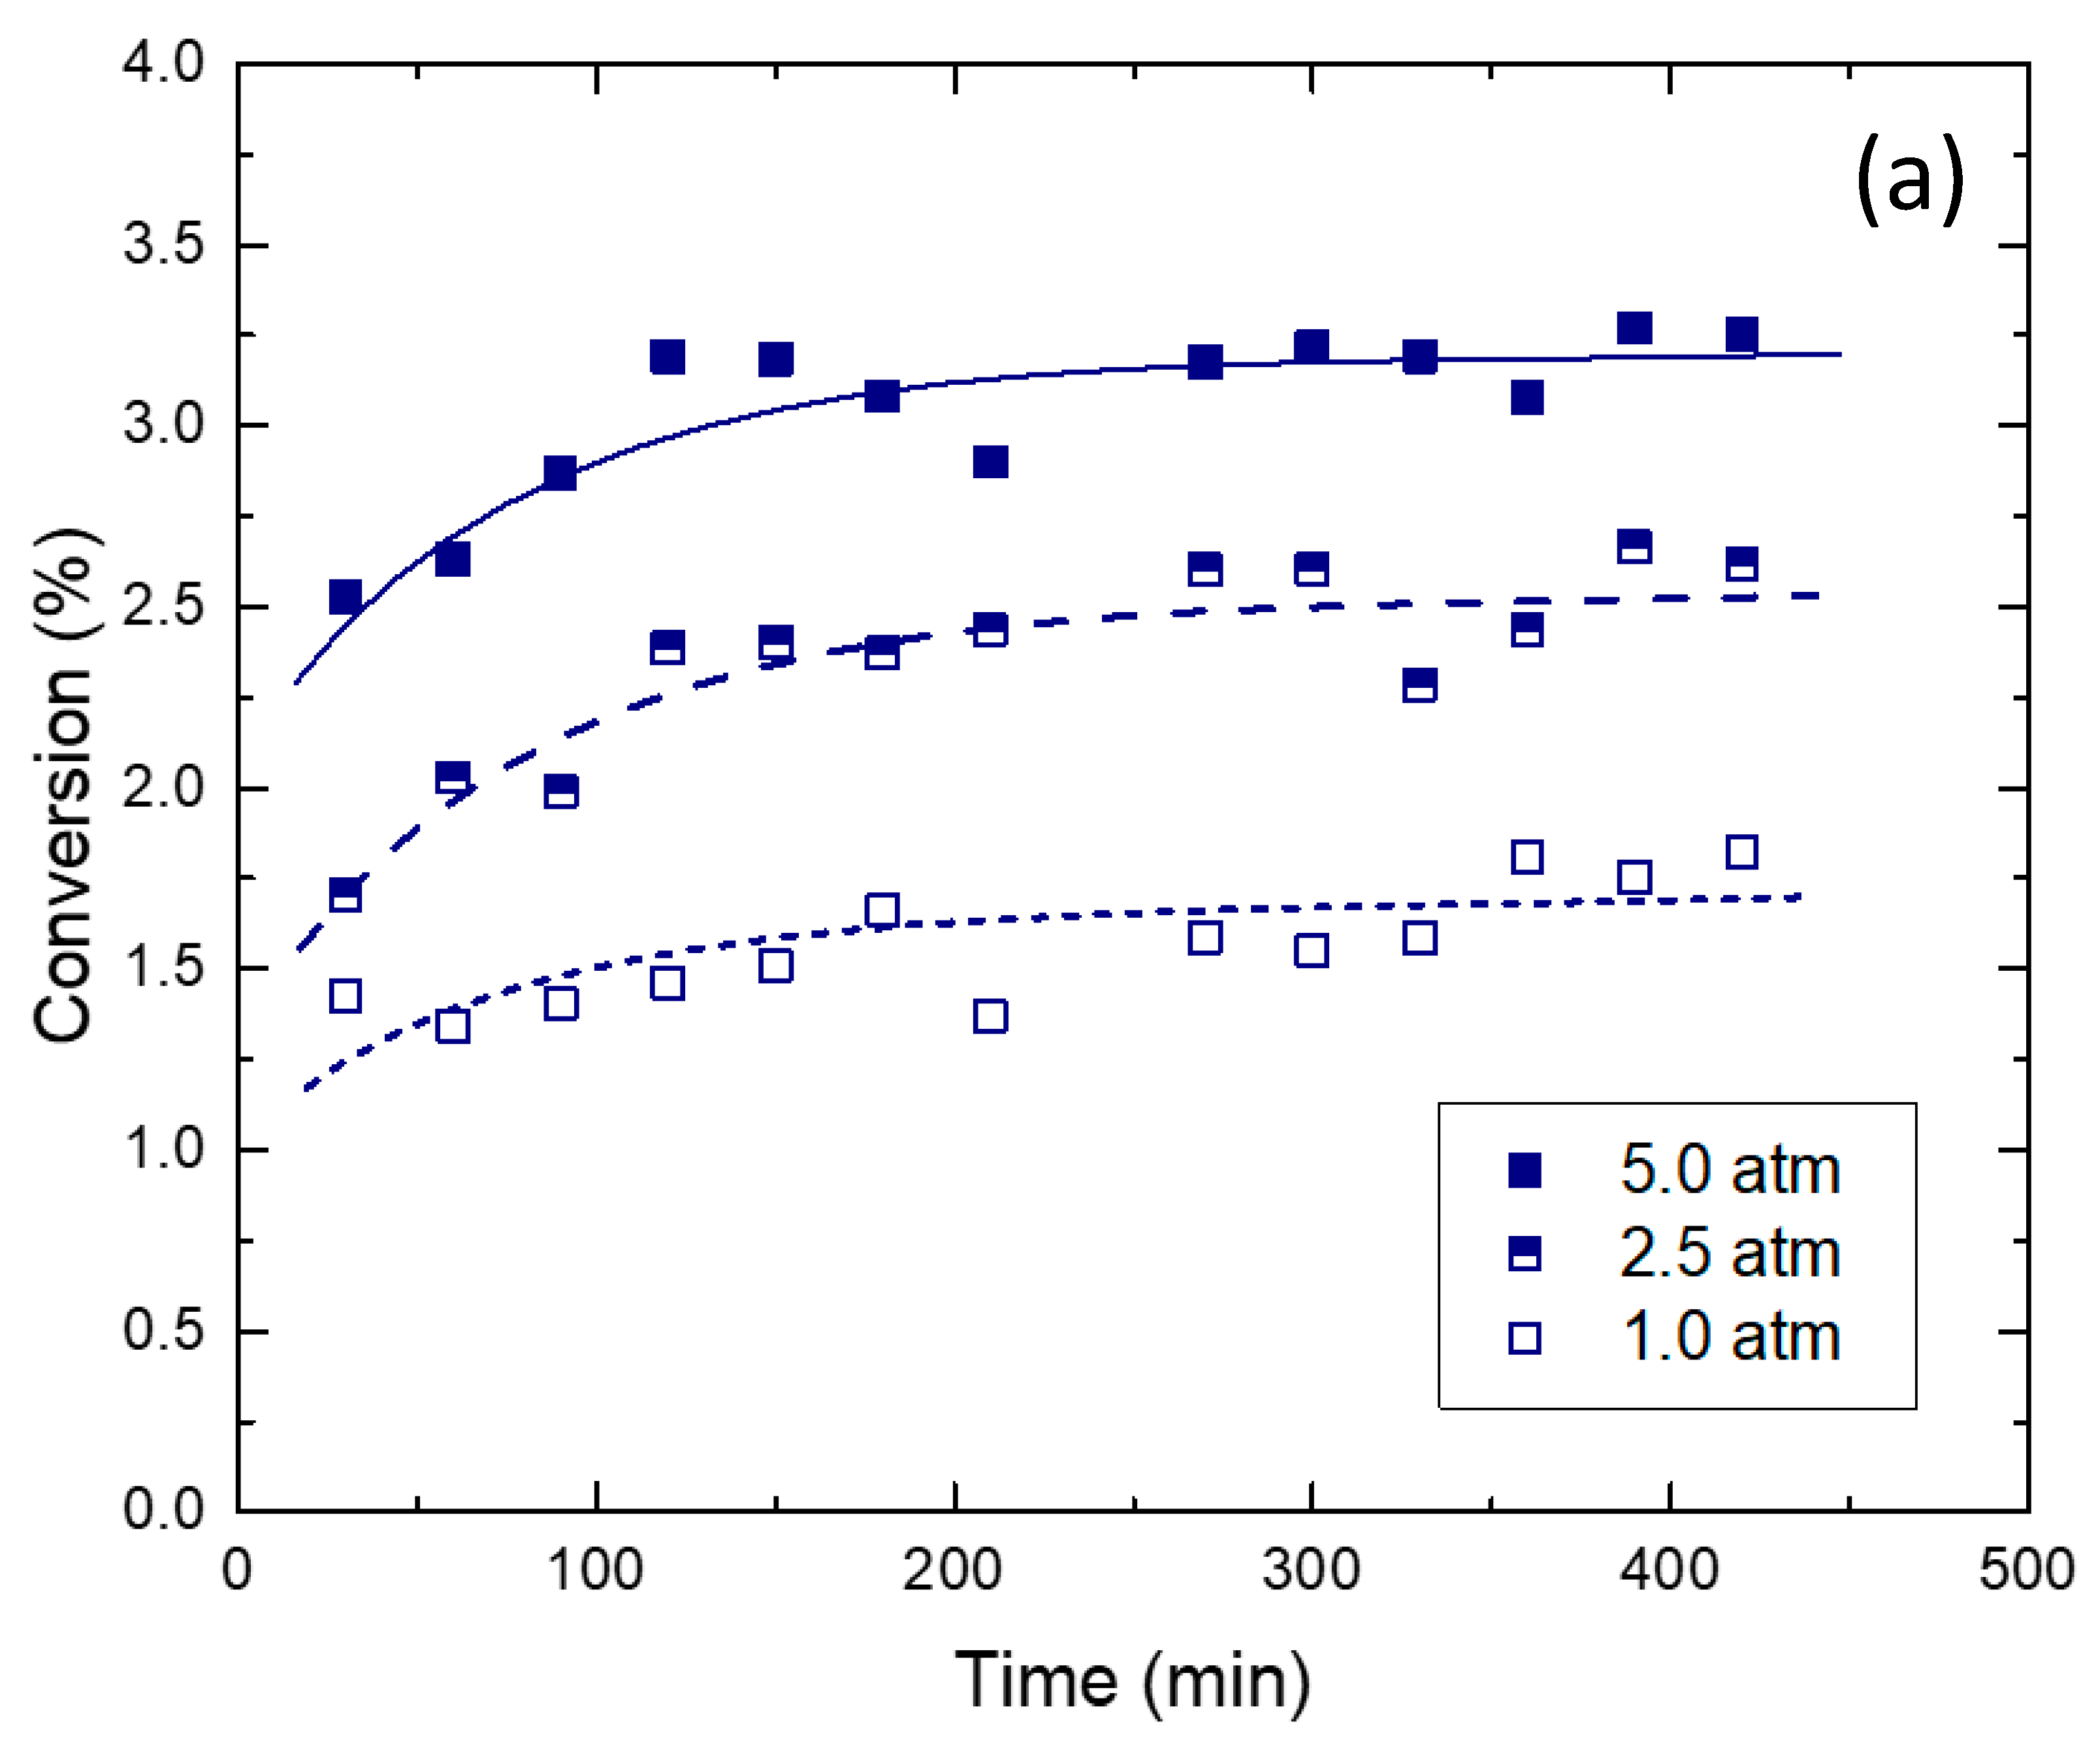
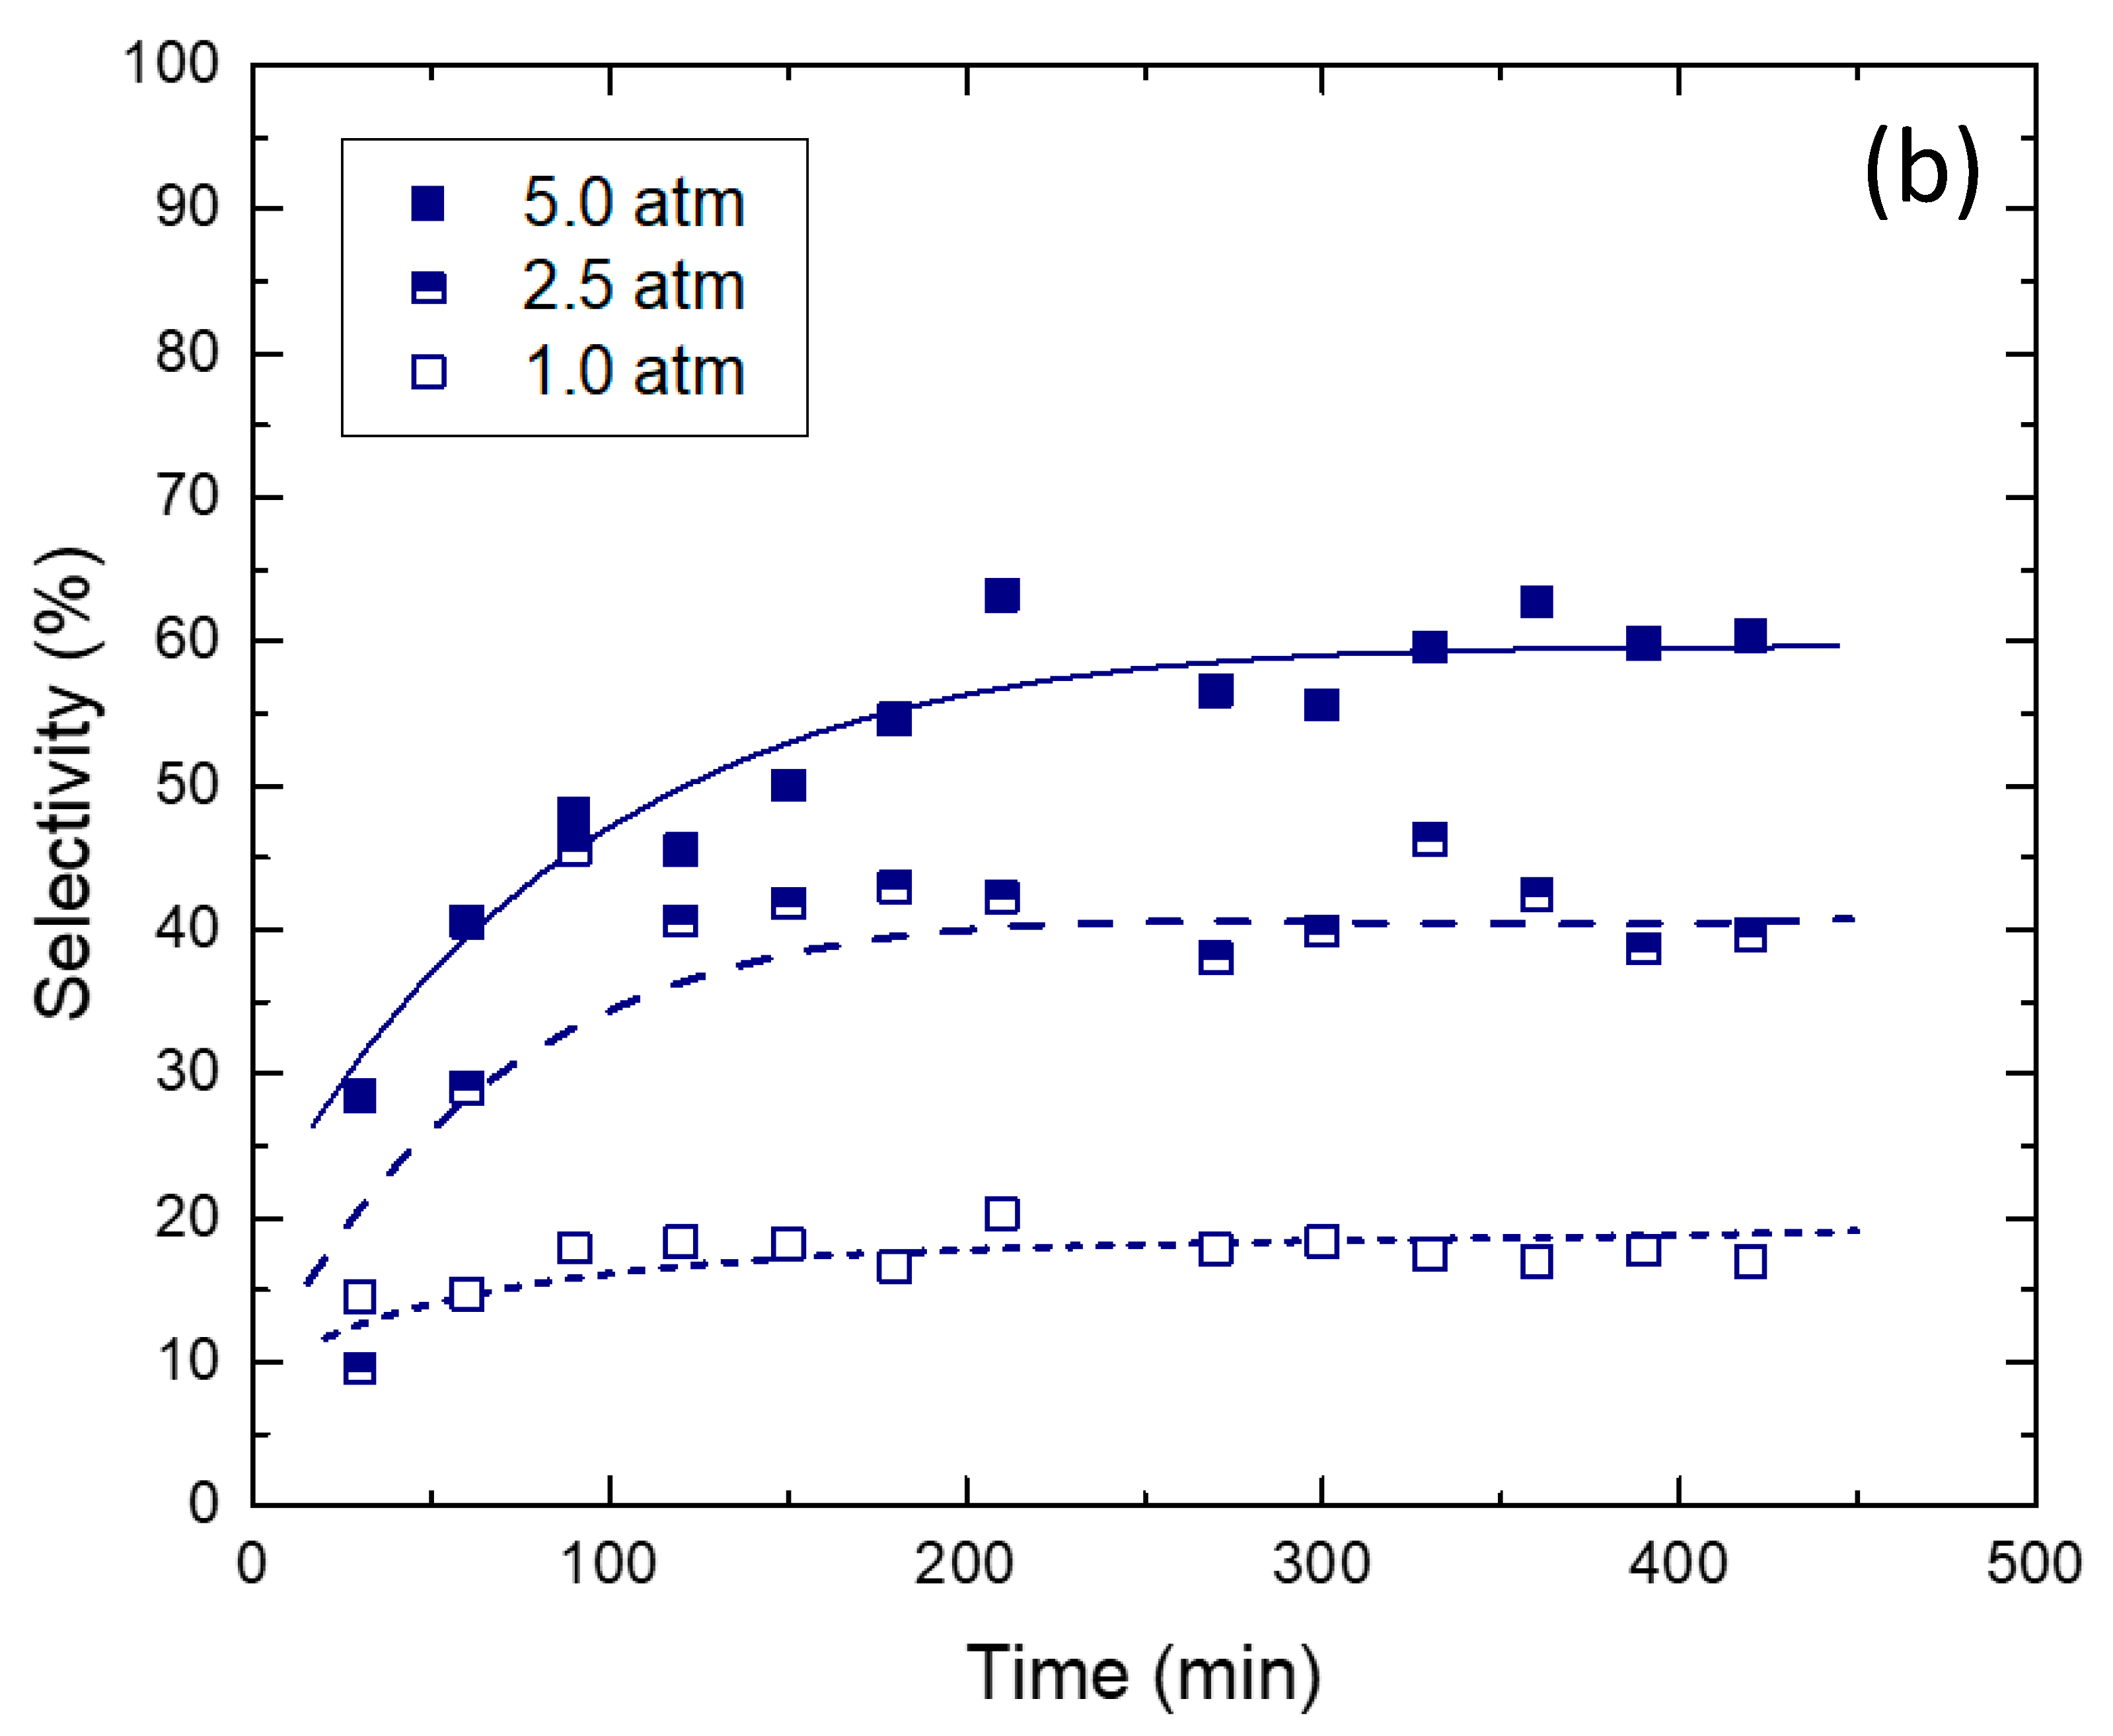
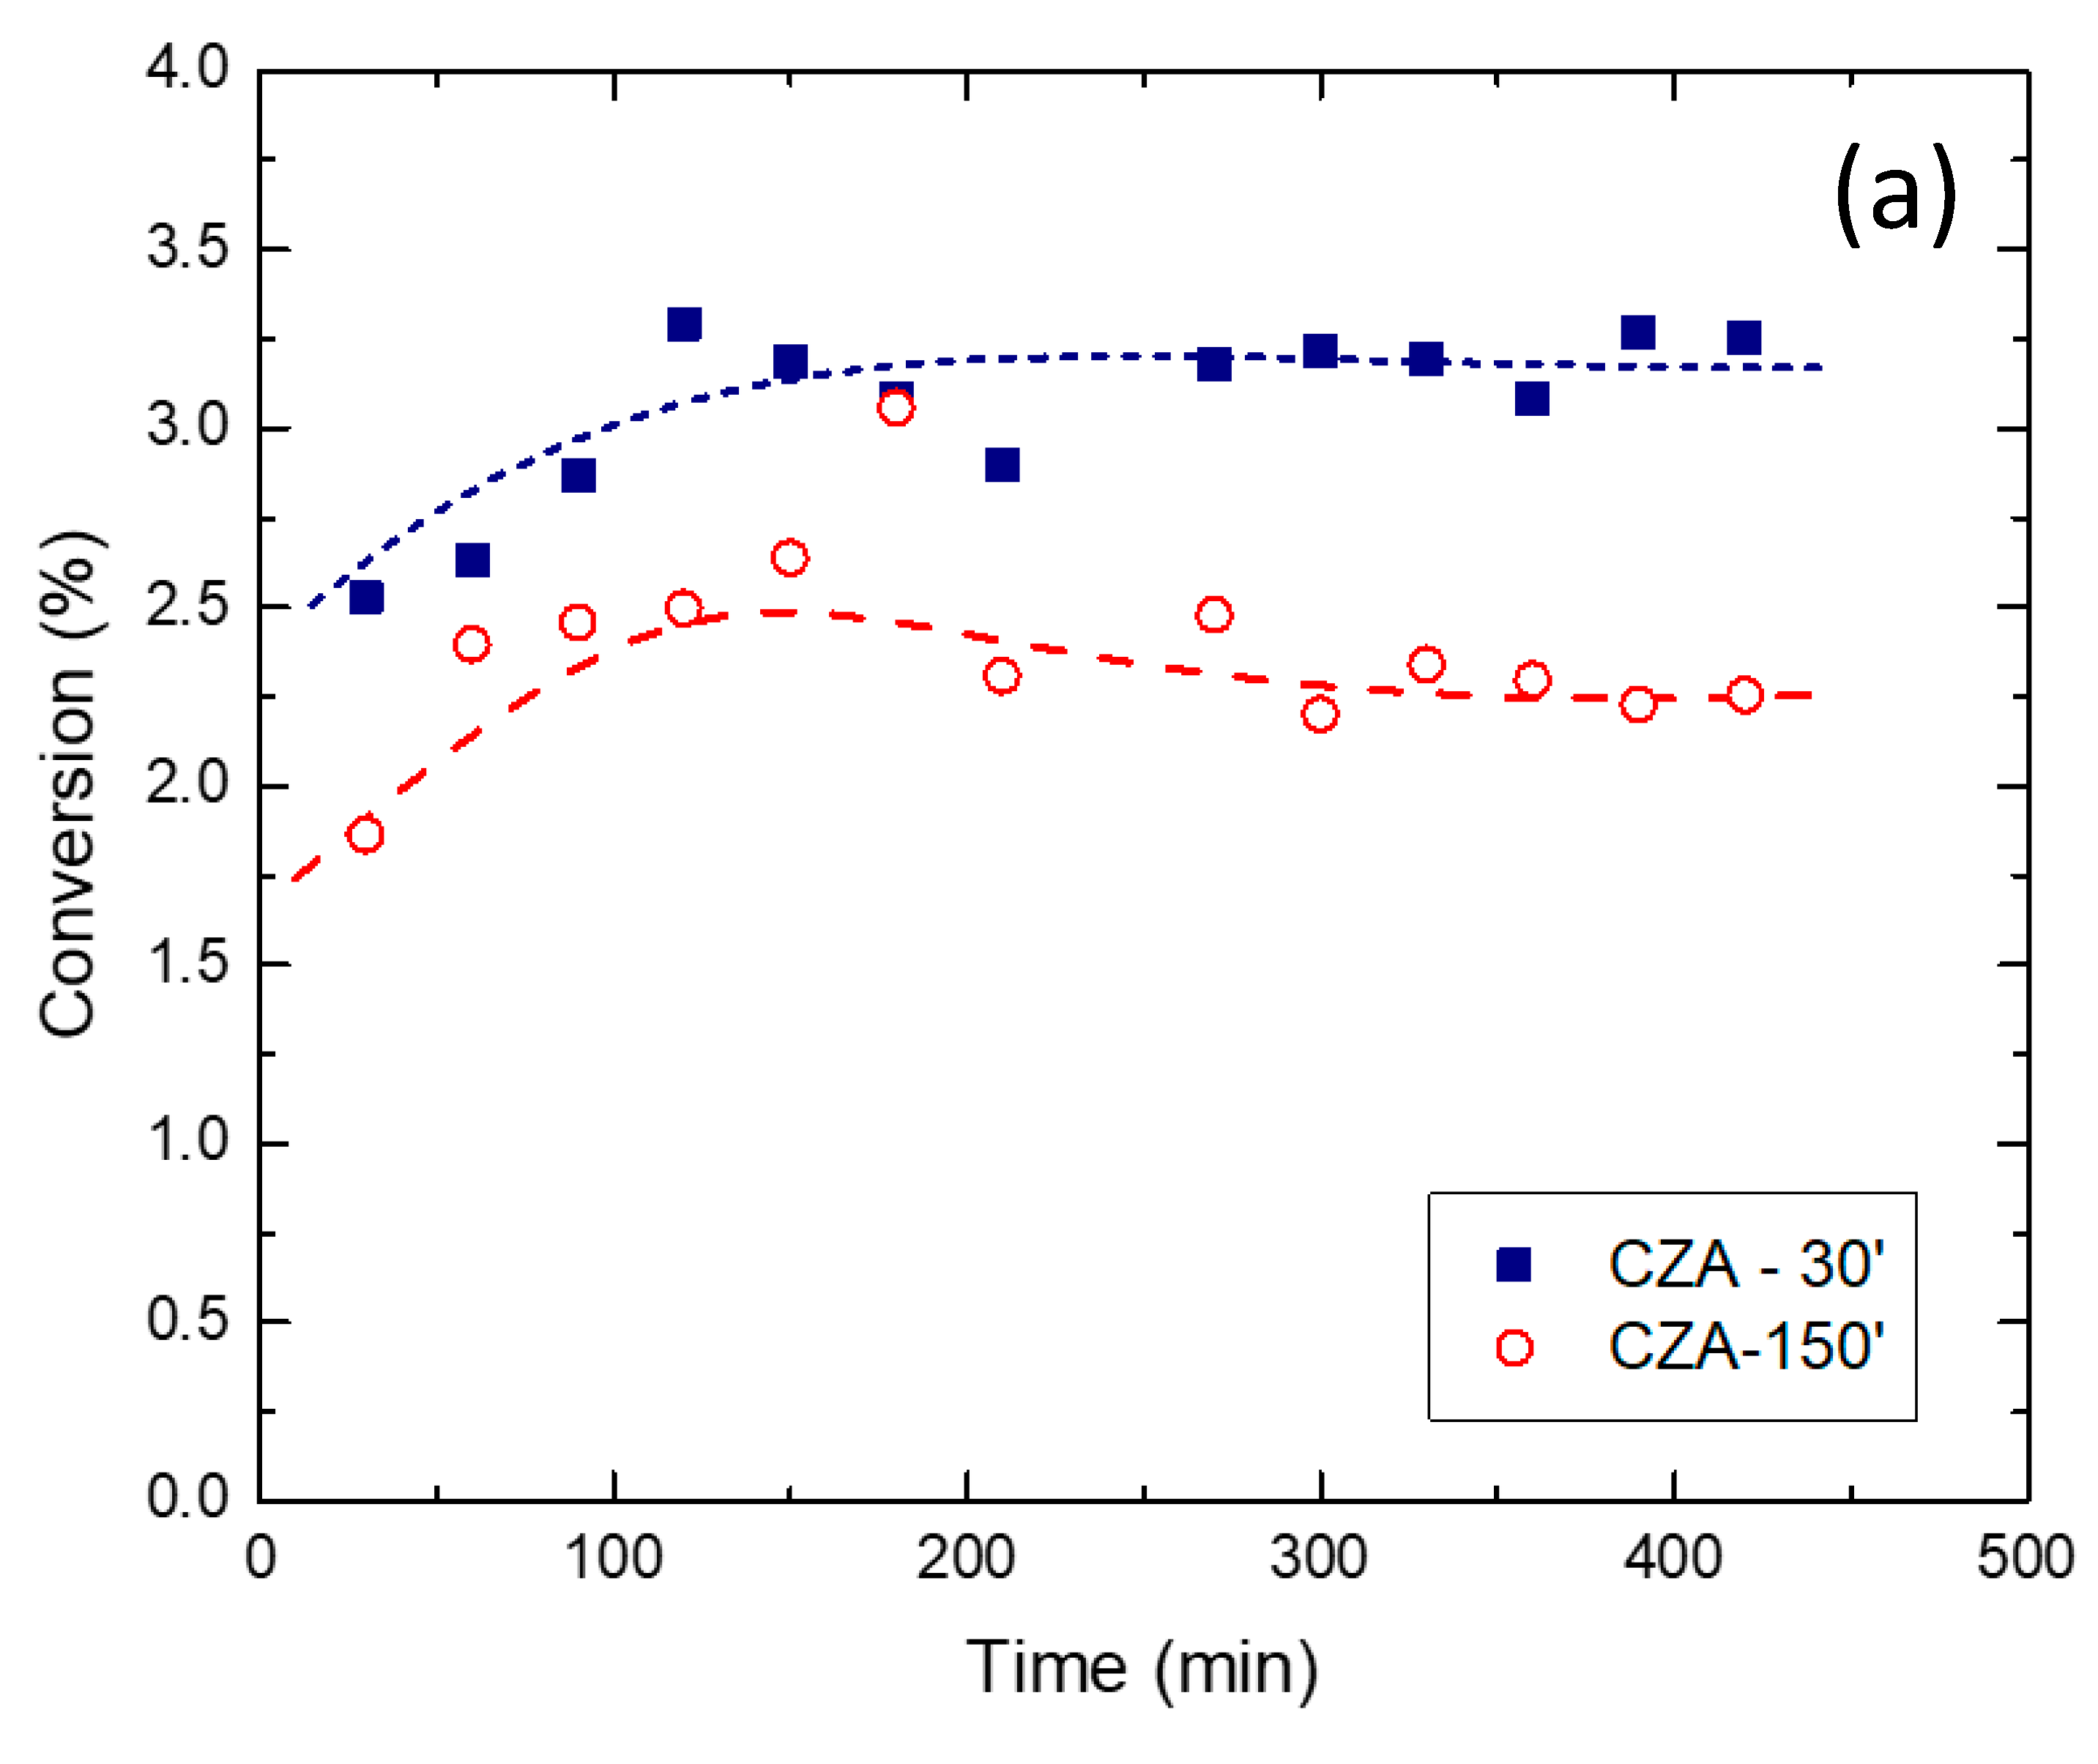
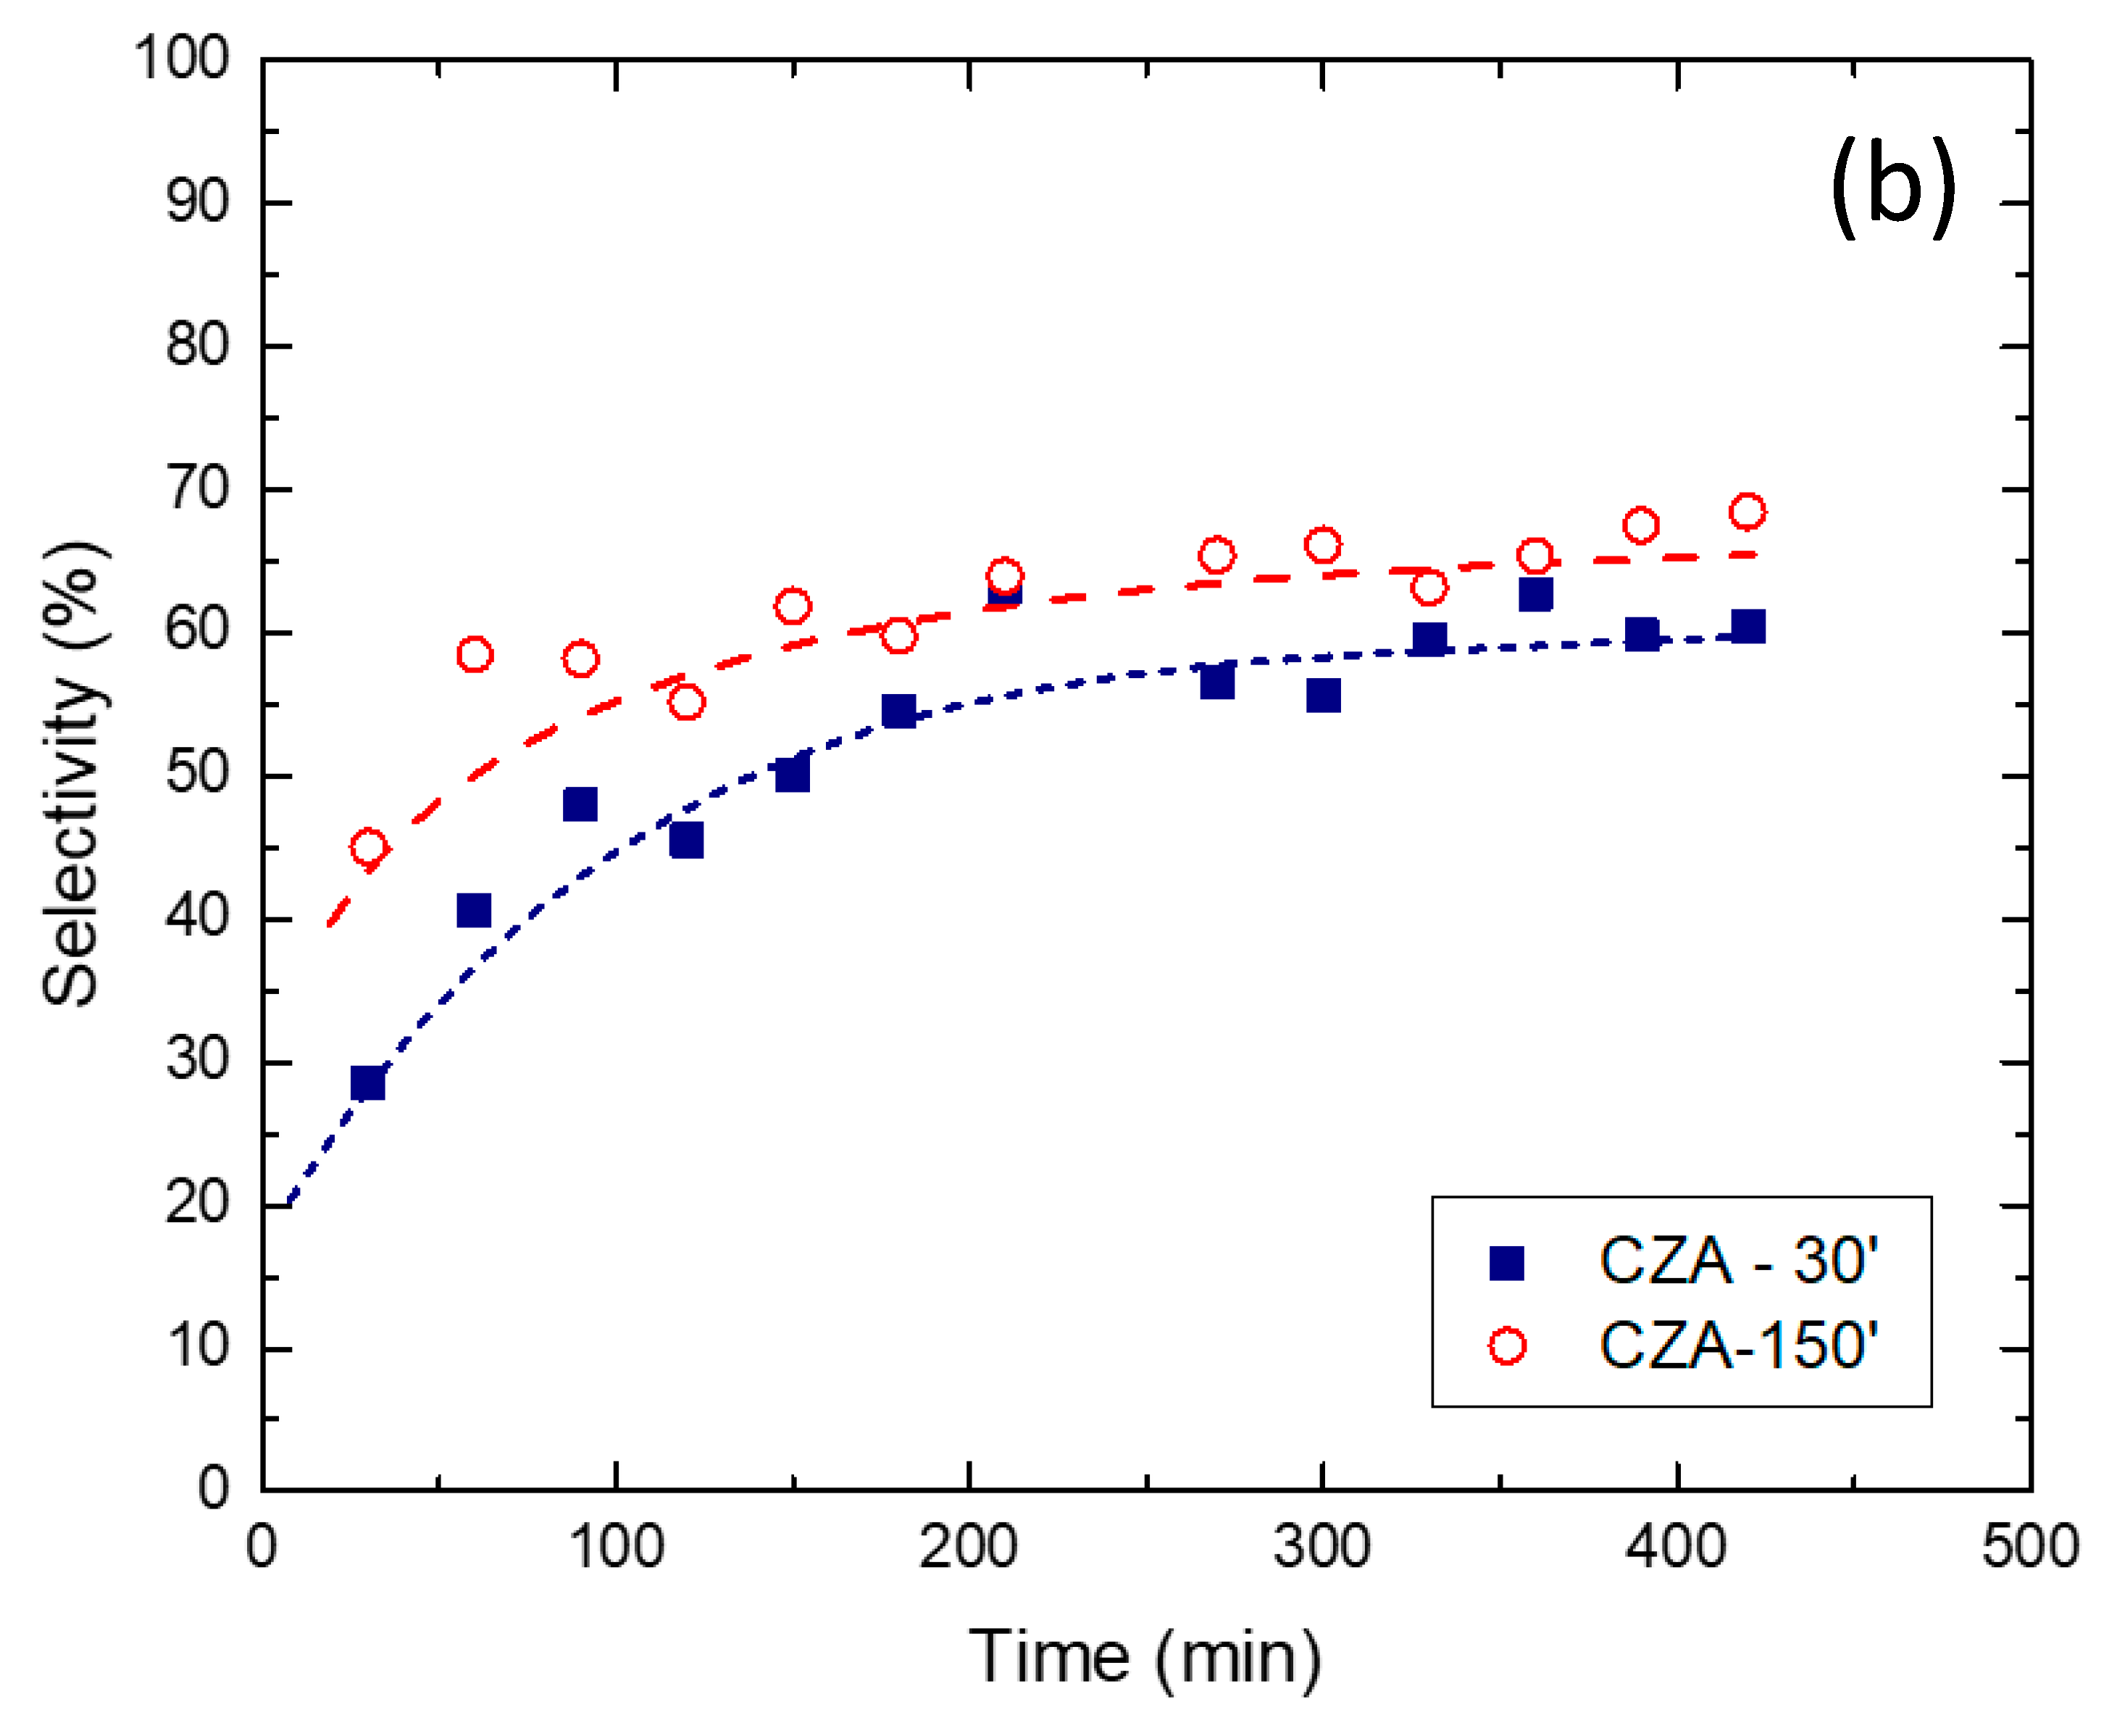
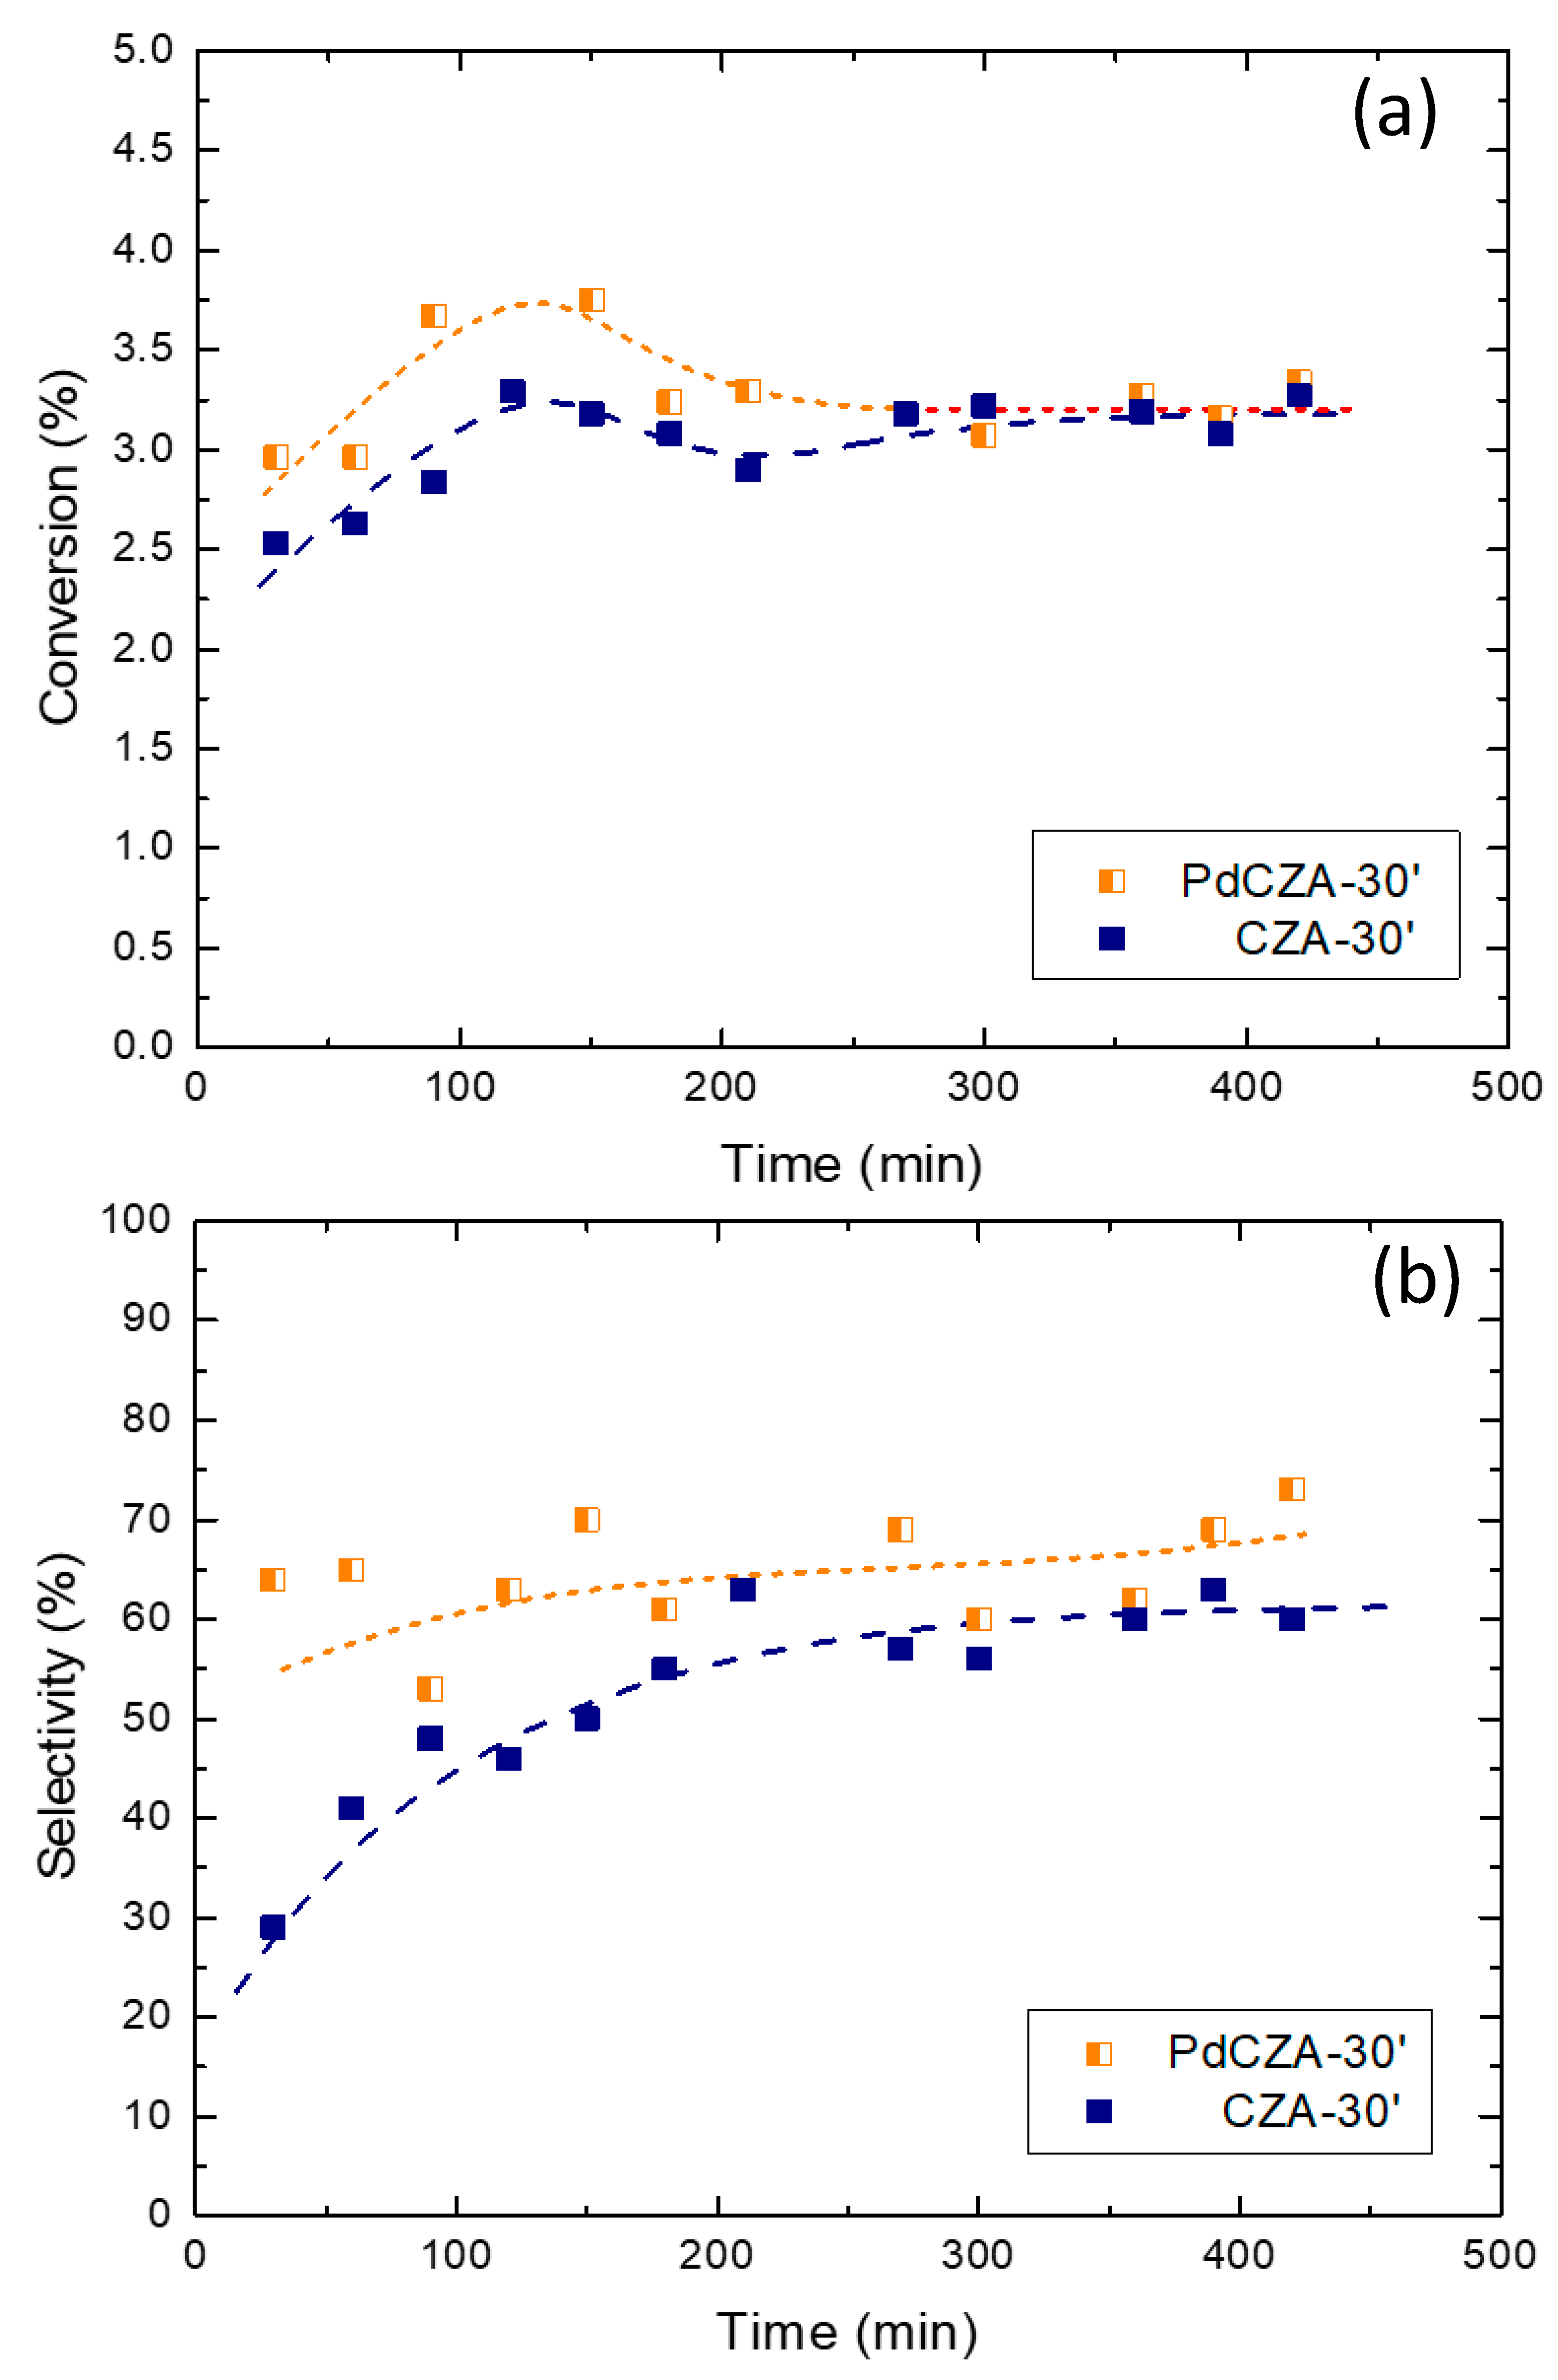
The obtained results from the nitrogen adsorption technique are shown in Table 1. The specific surface area decreases when the synthesis time is larger; therefore, CZA-30′ has a significantly bigger area than CZA-150′. This suggests that at a slower coprecipitation the formed crystals are bigger as they keep forming on top of precipitated crystals, while in a quick synthesis, when a higher oversaturation is reached, it causes the formation of more and smaller crystals. This makes CZA-150′ have a smaller specific surface area. The catalyst CZA-150′ shows an area similar to the catalyst synthesized by Hong et al. [19], but the CZA-30′ shows a higher value. When palladium is added on the traditional catalyst, the area slightly increases, but compared to CZA-30′ it shows no micropores. This is probably because palladium blocks the micropores of the original catalyst.
The morphology of the synthesized catalysts is presented in Figure 1 as comparison to CZA-30′ to show the changes produced by the different time of synthesis or supports used. Furthermore, a study between the fresh and used CZA-30′ was carried out to observe the impact of methanol synthesis process upon the catalyst. Therefore, the appearance and the size of these samples are going to be discussed for each of the three catalysts.
Upon adding the palladium, the crystal size remains similar to the original CZA-30′ catalyst (as illustrated in Figure 1a,b). This was expected, since the small amount (5%) of palladium was not enough to greatly change the catalyst morphology. The only modification seen is that the particles are much smaller than in the original one. The brighter spots present in the PdCZA-30′ sample are palladium coatings on the catalyst. Upon reaction, the aggregates are broken, and hence, they become smaller. Although the catalyst crushes a bit upon reaction, as seen in Figure 1e, later results showed that that the catalyst gives the same results, with high reproducibility.
In Figure 2, XRD of CZA-30′ is shown in comparison with that of CZA-150′. A structural change that is affected by the precipitation time. The catalyst coprecipitated in 150 min forms larger crystals, which are expected to give less reactivity. The calculation of the crystallite size for ZnO with the Scherrer equation, from the peak at 2θ = 31.8°, shows that the ZnO platelets have a thickness of 8.8 nm in the case of CZA-30′, and 12.7 nm in the case of CZA-150′. The crystal size of the CZA-30′ is smaller but these small crystals form larger aggregates, and this is caused by the shorter synthesis time that forms smaller particles. XRD of PdCZA-30′ is similar to the XRD of CZA-30′.
All the metal oxides, CuO, ZnO, and Al2O3 are present in the structure of the three catalysts and these were identified on the graph. These results correspond to the analysis carried out by Hong et al. [19]. As for the palladium-based catalyst, peaks for the dopant agent were not detected in the diffractogram. This is probably caused by the small percentage of palladium. Figure 3 shows the EDS mapping of Cu, Zn, and Al in the CZA-30′ catalyst; the distribution of all metals in the prepared catalyst was highly homogeneous.
The contents of these species observed for the catalysts (as illustrated in Table 2) were close to the nominal ratios used for preparing the starting solutions.

2.2. Reaction Tests

Reaction tests with the synthesized catalysts were carried out to find which one gives the highest selectivity to methanol. Prior to the comparison between the catalysts, the experimental conditions (temperature and pressure) that worked the best for CZA-30′ were determined. The rest of the catalysts were tested using the same experimental conditions, this way allowing them to be comparable. In addition, diagnostic tests performed by changing the catalyst particle size and flowrate allowed to exclude mass transfer limitations when working with 200–315 μm and 100 mL (STP)/min, respectively. Reaction tests were performed using CZA-30′ at 5 bar and 180, 200, 220, and 240 °C. A greater conversion of CO2 with temperature is observed (as illustrated in Figure 4a). However, this increase in conversion is solely a consequence of CO2 production due to the endothermic nature of the reverse water-gas shift reaction. As in Figure 4b, the selectivity at 240 °C was very poor, and therefore, these conditions are not useful for further tests. The highest selectivity was achieved at 180 °C, but the conversion was very low (1.1%). Therefore, to have a slightly better conversion and to maintain the highest selectivity possible, the choice remains between 200 and 220 °C. At 200 °C selectivity had a good value of 78.3%, but the conversion was only 1.8%, while at 220 °C there was a better conversion of 4.5%, but the selectivity dropped to 25.7%. Hence, an intermediate temperature was studied.
The evolution of conversion and selectivity along the time-on-stream at 5 bar and 200, 210, and 220 °C is shown in Figure 5. As expected, the middle temperature (210 °C) gives the best results in terms of yield to methanol (i.e., the product of conversion and selectivity) among the temperatures assessed. The objective was maintaining a high selectivity as well a high conversion. Hence, the water-gas-shift is indeed less favoured at this temperature, and it is more selective to methanol. Therefore, this temperature is chosen to be used for further reaction tests to analyse the effect of pressure for the CZA-30′ catalyst and for the further screening of catalysts.
To observe the effect of pressure for the synthesis of methanol by direct dehydrogenation of carbon dioxide, reaction tests for CZA-30′ were carried out at 210 °C. This temperature favours methanol selectivity and CO2 conversion, so by assessing different pressure values, should demonstrate which one works the best. The experimental setup reaches a maximum pressure of 5 bar. Therefore, apart from the highest value of 5 bar which was already tested at 210 °C giving a conversion of 3.1% and a selectivity of 52.7%, another two pressures were tested: 1 and 2.5 bar.
Pressure has a determining effect (as illustrated in Figure 6) because a decrease in the number of moles occurs in the formation of methanol, whereas the RWGS reaction does not produce any variation in this aspect. That is, according to Le Chatelier’s principle, a pressure increase shifts the equilibrium of reaction towards the formation of MeOH, while the equilibrium in reaction (2) is not affected. At lower pressure, the water-gas shift reaction is more favoured; hence, more carbon monoxide and water will be formed, decreasing the selectivity to methanol. According to the previous results, the experimental conditions for further comparison of catalysts were chosen as 5 bar and 210 °C.
Figure 7 shows the comparison of the carbon dioxide conversion with CZA-30′ and CZA-150′. As the precipitation time increases, the conversion becomes poorer, which is probably related with the lower surface area of the latter. Although the selectivity is greater when the synthesis time is larger, as the conversion has such a small value, the better yield was given by CZA-30′ (1.63% vs. 1.45%).
Selectivity and conversion with PdCZA-30′ are compared with those of CZA-30′ catalyst in Figure 8. The catalyst with Pd gave a similar conversion as the undoped one, it only exhibited higher conversion in the first 200 min, and then it slightly dropped reaching the same values as CZA-30′. As for the selectivity, PdCZA-30′ displayed a more irregular development in time, but overall it has a better selectivity than CZA-30′. To check its reproducibility, the PdCZA-30′ experiment at 210 °C and 5 bar was repeated, and we found that the catalyst activity and selectivity followed (not shown) the same patterns.
At 210 °C, CZA-30′selectivity had a value ca. 55% and PdCZA-30′ of 63.4% with a similar conversion of 3.2%. The addition of Pd represents an 18% increase in methanol yield. In other work, Melian–Cabrera et al. [20], with similar catalysts at 200 °C, reported a selectivity value of 90% with conversion was about 4% for CZA. However, an important decrease of activity happened with the addition of Pd to 3% with 95% of selectivity. In this case, PdCZA provides a 26% increase in methanol yield over CZA. They suggest that Pd in effect may already have reached saturation and the addition of Pd to the CZA catalyst has a beneficial effect on the methanol synthesis, but Pd does not act as an independent catalytic site for methanol synthesis because the observed promotion is independent of the metal loading.

3. Experimental

3.1. Reaction System

Gases are fed to the reactor using gas flow controllers (Alicat Scientific, Tucson, AZ, USA). The reactor was a quartz tube with an internal diameter of 10 and 40 mm length. For each reaction test, 1 g of catalyst was placed inside the reactor, having on top and bottom quartz wool to support it. A thermocouple is placed in the middle of the catalyst bed and the reactor sits inside a bath filled with silicone oil (Fluke Corporation, Everett, WA, USA), which allows working at a maximum temperature of 300 °C. The reaction products (composed by light vapours and condensable gases at room temperature), are carried out through a heat-insulated metal pipe to reach the condensation system, then placed into a flask with crushed ice, ethanol, and salt. In the analysis zone, after passing the condensation system, the noncondensable gases (H2, CO2, water and methanol that did not condense) can be leaded either to a bubble meter to measure the flow or to a gas chromatograph (Agilent Technologies 490 Micro GC, Santa Clara, CA, USA). The liquid, a mixture of water and methanol, is analysed offline by GC-MS (Shimadzu QP-2010, Kyoto, Japan).

3.2. Catalyst Synthesis

Two CuO/ZnO/Al2O3 catalysts were prepared using as basis a coprecipitation method described in literature [19]. Changes in the precipitation time from 30 (CZA-30′) to 150 min (CZA-150′) and the addition of palladium as a dopant agent (PdCZA-30′) were studied.
Two aqueous solutions of concentration 1 M were prepared, the first one using copper nitrate (Cu(NO3)2·3H2O, 98%, Panreac, Glenview, IL, USA) and zinc nitrate (Zn(NO3)2·6H2O, 98%, Sigma–Aldrich, St. Louis, MO, USA) and the second one with aluminium nitrate (Al(NO3)3·9H2O, Sigma-Aldrich, ≥98%) and sodium carbonate (Na2CO3, Sigma-Aldrich, 99.5%). The ratio (mass basis) of copper to zinc and to aluminium was 45:45:10. The two mixtures were slowly added into a 600 mL beaker containing distilled water over a period of 30 or 150 min, with vigorous stirring. The addition of the two aqueous solutions was performed at a temperature of 70 °C, and the pH was maintained constant at a value of 8. The blue formed precipitate was allowed to mature for further 30 min at the same temperature. The solution was filtered, and the precipitates were then thoroughly washed with hot deionized water. The solid was dried overnight at 110 °C and calcined in a muffle oven at 150 °C for 1 h, 200 °C for 1 h, 250 °C for 1 h, 300 °C for 1 h, and 350 °C for 4 h. The catalyst slightly changed its colour into a darker green upon calcination and it was then sieved to collect the desired particle size for the reactor (200–315 μm).
The addition of palladium was carried out by the incipient wetness technique. Therefore, the catalyst with precipitation time of 30 min with the chosen particle size of 200–315 μm was used to synthetize the Pd doped catalyst. To obtain 5% Pd/CuO/ZnO/Al2O3, palladium nitrate (Pd(NO3)2, Sigma–Aldrich, 100%) in water was added to the catalyst. The catalyst impregnated with Pd was dried at 110 °C for 12 h and then sieved again to assure the particle size stayed the same upon the addition of palladium [21].

3.3. Catalyst Characterisation

BET surface analysis was carried out by nitrogen physisorption using a Micrometrics Tristar 3000 V6.08 analyser. The samples were degassed at 200 °C for 10 h (VacPrep 061 of Micromeritics, Norcross, GA, USA). Electron microscopy was made with a Field Emission Scanning Electron Microscope from Carl Zeiss MERLINTM, Stuttgart, Germany which has an X-ray spectrometer with dispersive energy that also allows determining the semiquantitative analysis with EDS (INCA 350, Oxford Instruments–X-Max, Abingdon, Oxfordshire, UK). X-ray diffraction technique was carried out using a D-Max Rigaku diffractometer, Tokyo, Japan, which has a rotary anode and uses a graphite monochromator to pick the CuKα radiations. This equipment works at voltage of 40 kV and intensity of current of 80 mA which has a Cu anode.

3.4. Reaction Tests

Reaction experiments were performed using a conventional fixed-bed catalytic reactor. First, the catalyst CZA-30′ was tested at different temperatures (180, 200, 210, 220, and 240 °C) and pressures (1, 2.5, and 5 bar) to choose the optimal conditions for a high methanol selectivity. Once these parameters were decided, considering the results of the experiments with the conventional catalyst, the other two catalysts were tested under the same experimental conditions. Therefore, a screening of catalysts was performed for the direct hydrogenation of CO2 into methanol. For each catalyst, experiments were carried out using 1 g of sample and at a flow rate of 100 mL (STP)/min (H2/CO2 = 3/1), being the total time on stream 7 h.

4. Conclusions

The effect of temperature and pressure in the formation of methanol by CO2 hydrogenation was studied. As expected, the selectivity to methanol increased at high pressures and low temperatures. The most favourable conditions for the synthesized catalyst, working in the low pressure range (1–5 bar), were the pressure of 5 bar and a temperature of 210 °C. Furthermore, it was established that the change in the precipitation time from 30 min to 150 gave a smaller specific surface area than the conventional one, providing also a lower activity and yield to methanol. The best results were achieved for the palladium-based catalyst PdCZA-30′, which exhibited a selectivity to methanol with an average value of 63.4% for a conversion of 3.2%, better than the 55% with conventional CuO/ZnO/Al2O3 catalysts. Therefore, this catalyst constitutes the best option for further studies in membrane reactor.

Author Contributions

Conceptualization, J.S., J.H. and M.M.; methodology, J.S., J.H. and M.M.; validation, B.T. and J.L.; writing—original draft preparation, J.S. and J.H.; supervision, M.M. All authors read and agreed to the published version of the manuscript.

Funding

Ministerio de Ciencia, Innovación y Universidades: CTQ2016-76533-R and PID2019-106196RB-I00.

Conflicts of Interest

The authors declare no conflict of interest.

References

  1. Atsonios, E.K.K.; Panopolous, K.D. Investigation of technical and economic aspects for methanol production through CO2 hydrogenation. Int. J. Hydrogen Energy 2016, 41, 220–232. [Google Scholar] [CrossRef]
  2. Saedi, S.; Amin, N.S.A.; Rahimpour, M.R. Hydrogenation of CO2 to value-added products—A review and potential future developments. J. CO2 Util. 2014, 5, 66–81. [Google Scholar] [CrossRef]
  3. Aresta, M.; Dibenedetto, A.; Angelini, A. The changing paradigm in CO2 utilization. J. CO2 Util 2013, 3, 65–73. [Google Scholar] [CrossRef]
  4. Olah, G.A. Beyond Oil and Gas: The Methanol Economy. Angew. Chem. Int. Ed. 2005, 44, 2636–2639. [Google Scholar] [CrossRef] [PubMed]
  5. Olah, G.A. Towards oil independence through renewable methanol chemistry. Angew. Chem. Int. Ed. 2013, 52, 104–107. [Google Scholar] [CrossRef] [PubMed]
  6. Centi, G.; Perathoner, S. Opportunities and prospects in the chemical recycling of carbon dioxide to fuels. Catal. Today 2009, 148, 191–205. [Google Scholar] [CrossRef]
  7. Andersson, J.; Grönkvist, S. Large-scale storage of hydrogen. Int. J. Hydrogen Energy 2019, 44, 11901–11919. [Google Scholar] [CrossRef]
  8. Jadhav, S.G.; Vaidya, P.D.; Bhanage, B.M.; Joshi, J.B. Catalytic carbon dioxide hydrogenation to methanol: A review of recent studies. Chem. Eng. Res. Dev. 2014, 92, 2557–2567. [Google Scholar] [CrossRef]
  9. Tursunov, O.; Kutstov, L.; Tilybaev, Z. Methanol synthesis from the catalytic hydrogenation of CO2 over CuO–ZnO supported on aluminum and silicon oxides. J. Taiwan Inst. Chem. 2017, 78, 416–422. [Google Scholar] [CrossRef]
  10. Baltes, C.; Vukojevic, S.; Schuth, F. Correlations between synthesis, precursor, and catalyst structure and activity of a large set of CuO/ZnO/Al2O3 catalysts for methanol synthesis. J. Catal. 2008, 258, 334–344. [Google Scholar] [CrossRef]
  11. Ahoba-Sam, C.; Olsbye, U.; Jens, K.J. Low temperature methanol synthesis catalyzed by copper nanoparticles. Catal. Today 2018, 299, 112–119. [Google Scholar] [CrossRef] [Green Version]
  12. Riaz, A.; Zahedi, G.; Klemeš, J.J. A review of cleaner production methods for the manufacture of methanol. J. Clean. Prod. 2013, 57, 19–37. [Google Scholar] [CrossRef]
  13. Chinchen, G.C.; Spencer, M.S.; Waugh, K.C.; Whan, D.A. Promotion of methanol synthesis and the water-gas shift reactions by adsorbed oxygen on supported copper catalyst. J. Chem. Soc. Faraday Trans. 1 Phys. Chem. Condens. Phases 1987, 83, 2193–2212. [Google Scholar] [CrossRef]
  14. Ayodele, O.B. Eliminating reverse water gas shift reaction in CO2 hydrogenation to primary oxygenates over MFI-type zeolite supported Cu/ZnO nanocatalysts. J. CO2 Util. 2017, 20, 368–377. [Google Scholar] [CrossRef]
  15. Struis, R.; Stucki, S.; Wiedorn, M.A. membrane reactor for methanol synthesis. J. Membr. Sci. 1996, 113, 93–100. [Google Scholar] [CrossRef]
  16. Menéndez, M.; Piera, E.; Coronas, J.; Santamaría, J. Reactor de Membrana Zeolítica Para la Obtención de Metanol y Otros Alcoholes a Partir de Gas de Síntesis. Spanish Patent ES2164544, July 1999. [Google Scholar]
  17. Gallucci, F.; Paturzo, L.; Basile, A. An experimental study of CO2 hydrogenation into methanol involving a zeolite membrane reactor. Chem. Eng. Proc. Process Intens. 2004, 43, 1029–1036. [Google Scholar] [CrossRef]
  18. Raso, R.; Tovar, M.; Lasobras, J.; Herguido, J.; Kumakiri, I.; Araki, S. Comparison of zeolite membranes towards their use in membrane reactors for CO2 hydrogenation to methanol. Catal. Today 2020, 364, 270–275. [Google Scholar] [CrossRef]
  19. Hong, Z.S.; Cao, Y.; Deng, J.F.; Fan, K.N. CO2 hydrogenation to methanol over Cu/ZnO/Al2O3 catalysts prepared by a novel gel-network-coprecipitation method. Catal. Lett. 2002, 82, 37–44. [Google Scholar] [CrossRef]
  20. Melián-Cabrera, I.; López Granados, M.; Fierro, J.L.G. Reverse Topotactic Transformation of a Cu–Zn–Al Catalyst during Wet Pd Impregnation: Relevance for the Performance in Methanol Synthesis from CO2/H2 Mixtures. J. Catal. 2002, 210, 273–284. [Google Scholar] [CrossRef]
  21. Regabulto, J. Catalyst Preparation: Science and Engineering; CRC Press: Boca Raton, FL, USA, 2007. [Google Scholar]
Figure 1. FESEM images: (a) CZA-30′, (b) PdCZA-30′, (c) CZA-30′, (d) CZA-150′, and (e) CZA-30′ used.
Catalysts 11 00774 g001
Figure 2. XRD diffractogram for CZA-30′, CZA-150′, and PdCZA-30′.
Catalysts 11 00774 g002
Figure 3. EDS mapping of CZA-30′.
Catalysts 11 00774 g003
Figure 4. (a) Conversion and (b) selectivity for CZA-30′ at 5 bar, T = 180, 200, 220, and 240 °C.
Catalysts 11 00774 g004aCatalysts 11 00774 g004b
Figure 5. (a) Conversion and (b) selectivity for CZA-30′ at 5 bar.
Catalysts 11 00774 g005
Figure 6. (a) Conversion and (b) selectivity for CZA-30′ at 210 °C.
Catalysts 11 00774 g006aCatalysts 11 00774 g006b
Figure 7. (a) Conversion and (b) selectivity for CZA-30′ and CZA-150′ at 210 °C.
Catalysts 11 00774 g007aCatalysts 11 00774 g007b
Figure 8. (a) Conversion and (b) selectivity for PdCZA-30′ and CZA-30′ at 5 bar and 210 °C.
Catalysts 11 00774 g008
Table 1. EDS analysis results (% wt).
SampleOPdAlCuZn
CZA-30′34.4-6.334.724.6
PdCZA-30′21.33.92.930.837.4
CZA-150′21.9-4.230.538.7
Table 2. Specific surface area, pore volume, and diameter calculated after BET analysis.
SampleSpecific Surface Area (m2/g)Pore Volume
(cm3/g)
Pore Diameter
(nm)
SBETSmicroporeVporeVmicroporedporedmicropore
CZA-30′111.912.30.50.00518.21.6
PdCZA-30′123.7-0.3-10.7-
CZA-150′65.94.70.20.00214.61.7
Publisher’s Note: MDPI stays neutral with regard to jurisdictional claims in published maps and institutional affiliations.

