Article

Comparison of Synthetic and Natural Zeolite Catalysts’ Behavior in the Production of Lactic Acid and Ethyl Lactate from Biomass-Derived Dihydroxyacetone

Faculty of Chemical Engineering and Technology, Cracow University of Technology, Warszawska 24, 31-155 Kraków, Poland
*
Author to whom correspondence should be addressed.
Submission received: 27 July 2021 / Revised: 19 August 2021 / Accepted: 19 August 2021 / Published: 20 August 2021
(This article belongs to the Special Issue Catalysts in Biomass Valorization)

Abstract

:
This article presents the results of the conversion of dihydroxyacetone (DHA) to lactic acid (LA) with the use of zeolite catalysts. For this purpose, synthetic zeolite beta (BEA) and natural clinoptilolite (CLI) were used as a matrix. The zeolites were modified with various metals (Sn, Fe, Cu and Zn) during ion exchange under hydrothermal conditions. The DHA conversion process with the participation of metal-functionalized zeolites allowed us to obtain intermediates, i.e., pyruvic aldehyde (PAL), which during the further reaction was transformed into a mixture of products such as ethyl lactate (EL), pyruvic aldehyde (PA), lactic acid and ethyl acetate (EA). The best selectivity towards lactic acid was achieved using Sn-CLI (100%) > Na-BEA (98.7%) > Sn-BEA (95.9%) > Cu-BEA (92.9%), ethyl lactate using Cu-CLI, and pyruvic aldehyde using the Zn-BEA catalyst. In the case of a natural zeolite, modification with Sn is promising for obtaining a pure lactic acid with a relatively good carbon balance.

Graphical Abstract

1. Introduction

Renewable energy sources are slowly becoming a raw material for the production of fuels, energy and chemicals. This is related to their increasing demand and the awareness of the negative environmental impact of fossil fuel processing. To this end, intensive work is being carried out on the acquisition of alternative energy sources that contribute to a lesser extent to drastic climate change. A very important aspect of the production of chemicals or biofuels is the use of raw materials that will not constitute a food source [1]. One of the interesting applications as a raw material for the production of biochemicals and biofuels is biomass, which is waste from all industries [2]. Biomass obtained from processing in the agricultural industry—e.g., straw and grass—is a promising source of renewable energy carriers [3]. However, the use of the raw material as biomass requires appropriate chemical or physical treatment, due to its structure—the fraction from which it is made (cellulose, hemicellulose, lignin fractions). The most energetic and potentially applicable energy carrier is the cellulose fraction. For this purpose, attempts have been made to isolate it (to separate it from the other fractions surrounding it) and use it as transport fuel (biofuels) and chemicals [4,5,6].
Another advantage of using biomass is its price and the low costs of obtaining valuable chemical compounds from it, mainly glucose particles from the cellulose fraction. Glucose is the starting point of the chemical pathway for sourcing a wide variety of products. One of the methods of obtaining dihydroxyacetone (DHA) and glyceraldehyde (GLA) is the conversion of fructose as a result of a retro-aldol reaction. In turn, fructose is formed during glucose isomerization, which comes from the separated cellulose fraction from the biomass [7]. Figure 1 shows the chemical conversion of biomass to DHA, glycerol and pyruvaldehyde, and their further transformations.
The conversion of DHA obtained from biomass to LA and other compounds is of particular interest. The isomerization of DHA in an aqueous medium enables the production of lactic acid and its derivatives. The reaction proceeds to form methylglyoxal by the dehydration of the triose. This is followed by an intra-molecular Cannizzaro-type rearrangement reaction with hydrogen transfer (Figure 2) [8].
Lactic acid (LA), ethyl lactate (EL) and pyruvic acid (PAC) are valuable compounds, formed during the conversion of biomass to intermediates and their further reactions [6,9] Lactic acid is mainly a raw material for the production of biodegradable polylactide (PLA). In turn, pyruvic acid is used as a food additive, a precursor to drugs, and agrochemicals and cosmetics [10,11,12]. Because of the many promising applications of LA, EL and PAC, their commercial markets are considerably large. LA and PA are produced by the fermentation of glucose or the dehydrative decarboxylation of tartaric acid [13]. However, these methods are problematic due to the product-separation efficiencies, whereas the pyrolysis of tartaric acid or the transformation of propene consume a large amount of KHSO4/H2SO4 and energy [14]. Thus, developing renewable alternative pathways to produce LA and PAC under mild conditions is highly appealing.
Zeolites are a class of crystalline aluminosilicates, and are used as successful catalysts in many applications [8]. Many types of zeolites (BEA, FER, CLI and MOR) with a variety of pore sizes are found in nature, such as clinoptylolite (CLI), or are synthetized with a different framework, such as beta (BEA), ferrierite (FER) or mordenite (MOR). The zeolites are characterized by a variety of microporous structures featuring specific sizes, shapes, and connectivity, as well as the possibility of tuning the acid/base properties. The detailed structures and properties were presented previously [8]. Zeolites are effective three-dimensional supports for active nanoparticles, e.g., transition metals. Zeolites catalyze many types of hydrocarbon reactions, and therefore they are ideal candidates for the production of chemicals from biomass. Effective zeolite-based catalysts integrate three main functions and length scales: active sites located in micropores, access and transport provided by the introduced mesopores, and the macroscopic shape of the catalyst body. In the literature, different types of zeolites with a variety of pore sizes and with addition of gallium particles were used to obtain C1-C4 lactates from DHA [15]. The best results were obtained with Ga-FAU, which resulted in the formation of n-propyl, n-butyl lactate and ethyl lactate. Another possibility is the conversion of dihydroksyacetone to ethyl lactate on a Ga-USY catalyst [16] as well as on Sn-Beta, Zr-Beta, Ti-Beta, Al-Beta and Si-Beta [17].
Porous zeolites with densely embedded Lewis acid centers (tri-coordinated lattice aluminum ions Al3+) are particularly effective in the isomerization reaction, which is the subject of this work [18]. Zeolites can be subjected to numerous modifications. One of them is the so-called ion exchange (isomorphic substitution). The replacement of Si4+ with Al3+ induces the formation of a negative charge, which is canceled by introducing positively charged cations such as Na+, K+, H+, NH4+, Ca2+, Sr2+ and Mg2+ [5,19]. Modified zeolites with metal cations can also be obtained with so-called “grafting”, where metals are introduced into the pores or onto the surface of zeolites in the form of monomers, polymers or nanoparticles [5].
Our intention to tackle the subject of the transformation of DHA into PAC over natural zeolites was motivated by the literature, which reported LA and PAC production—including oxidations of propylene glycol or lactic acid—over other catalysts [20,21,22]. Another option is a fermentation method, although this method is difficult to scale-up to a large production unit [23]. Recently, the chemical way to produce PAC from LA [14,24,25] and LA from glycerol [26,27,28,29] in a one-step strategy has been also reported. In the case of liquid-phase LA oxidation into PAC, bimetallic catalysts have been suggested [21,24,30]. However, these catalysts contain metals (Pt, Pd, Pb, Te, or Bi) supported on carbon, which is problematic due to the high price of such metals. Therefore, according to such literature findings, we decided to use commercial BEA zeolite and natural clinoptilolite CLI modified with other metals (Fe, Cu, Sn and Zn) for PAC and LA production from DHA in a liquid phase. Especially promising are synthetic BEA zeolite and natural clinoptylolite CLI due to economic (much lower price concerning Pt and Pd metals price) and ecological reasons (the possibility of its easy reutilization after the process).

2. Results

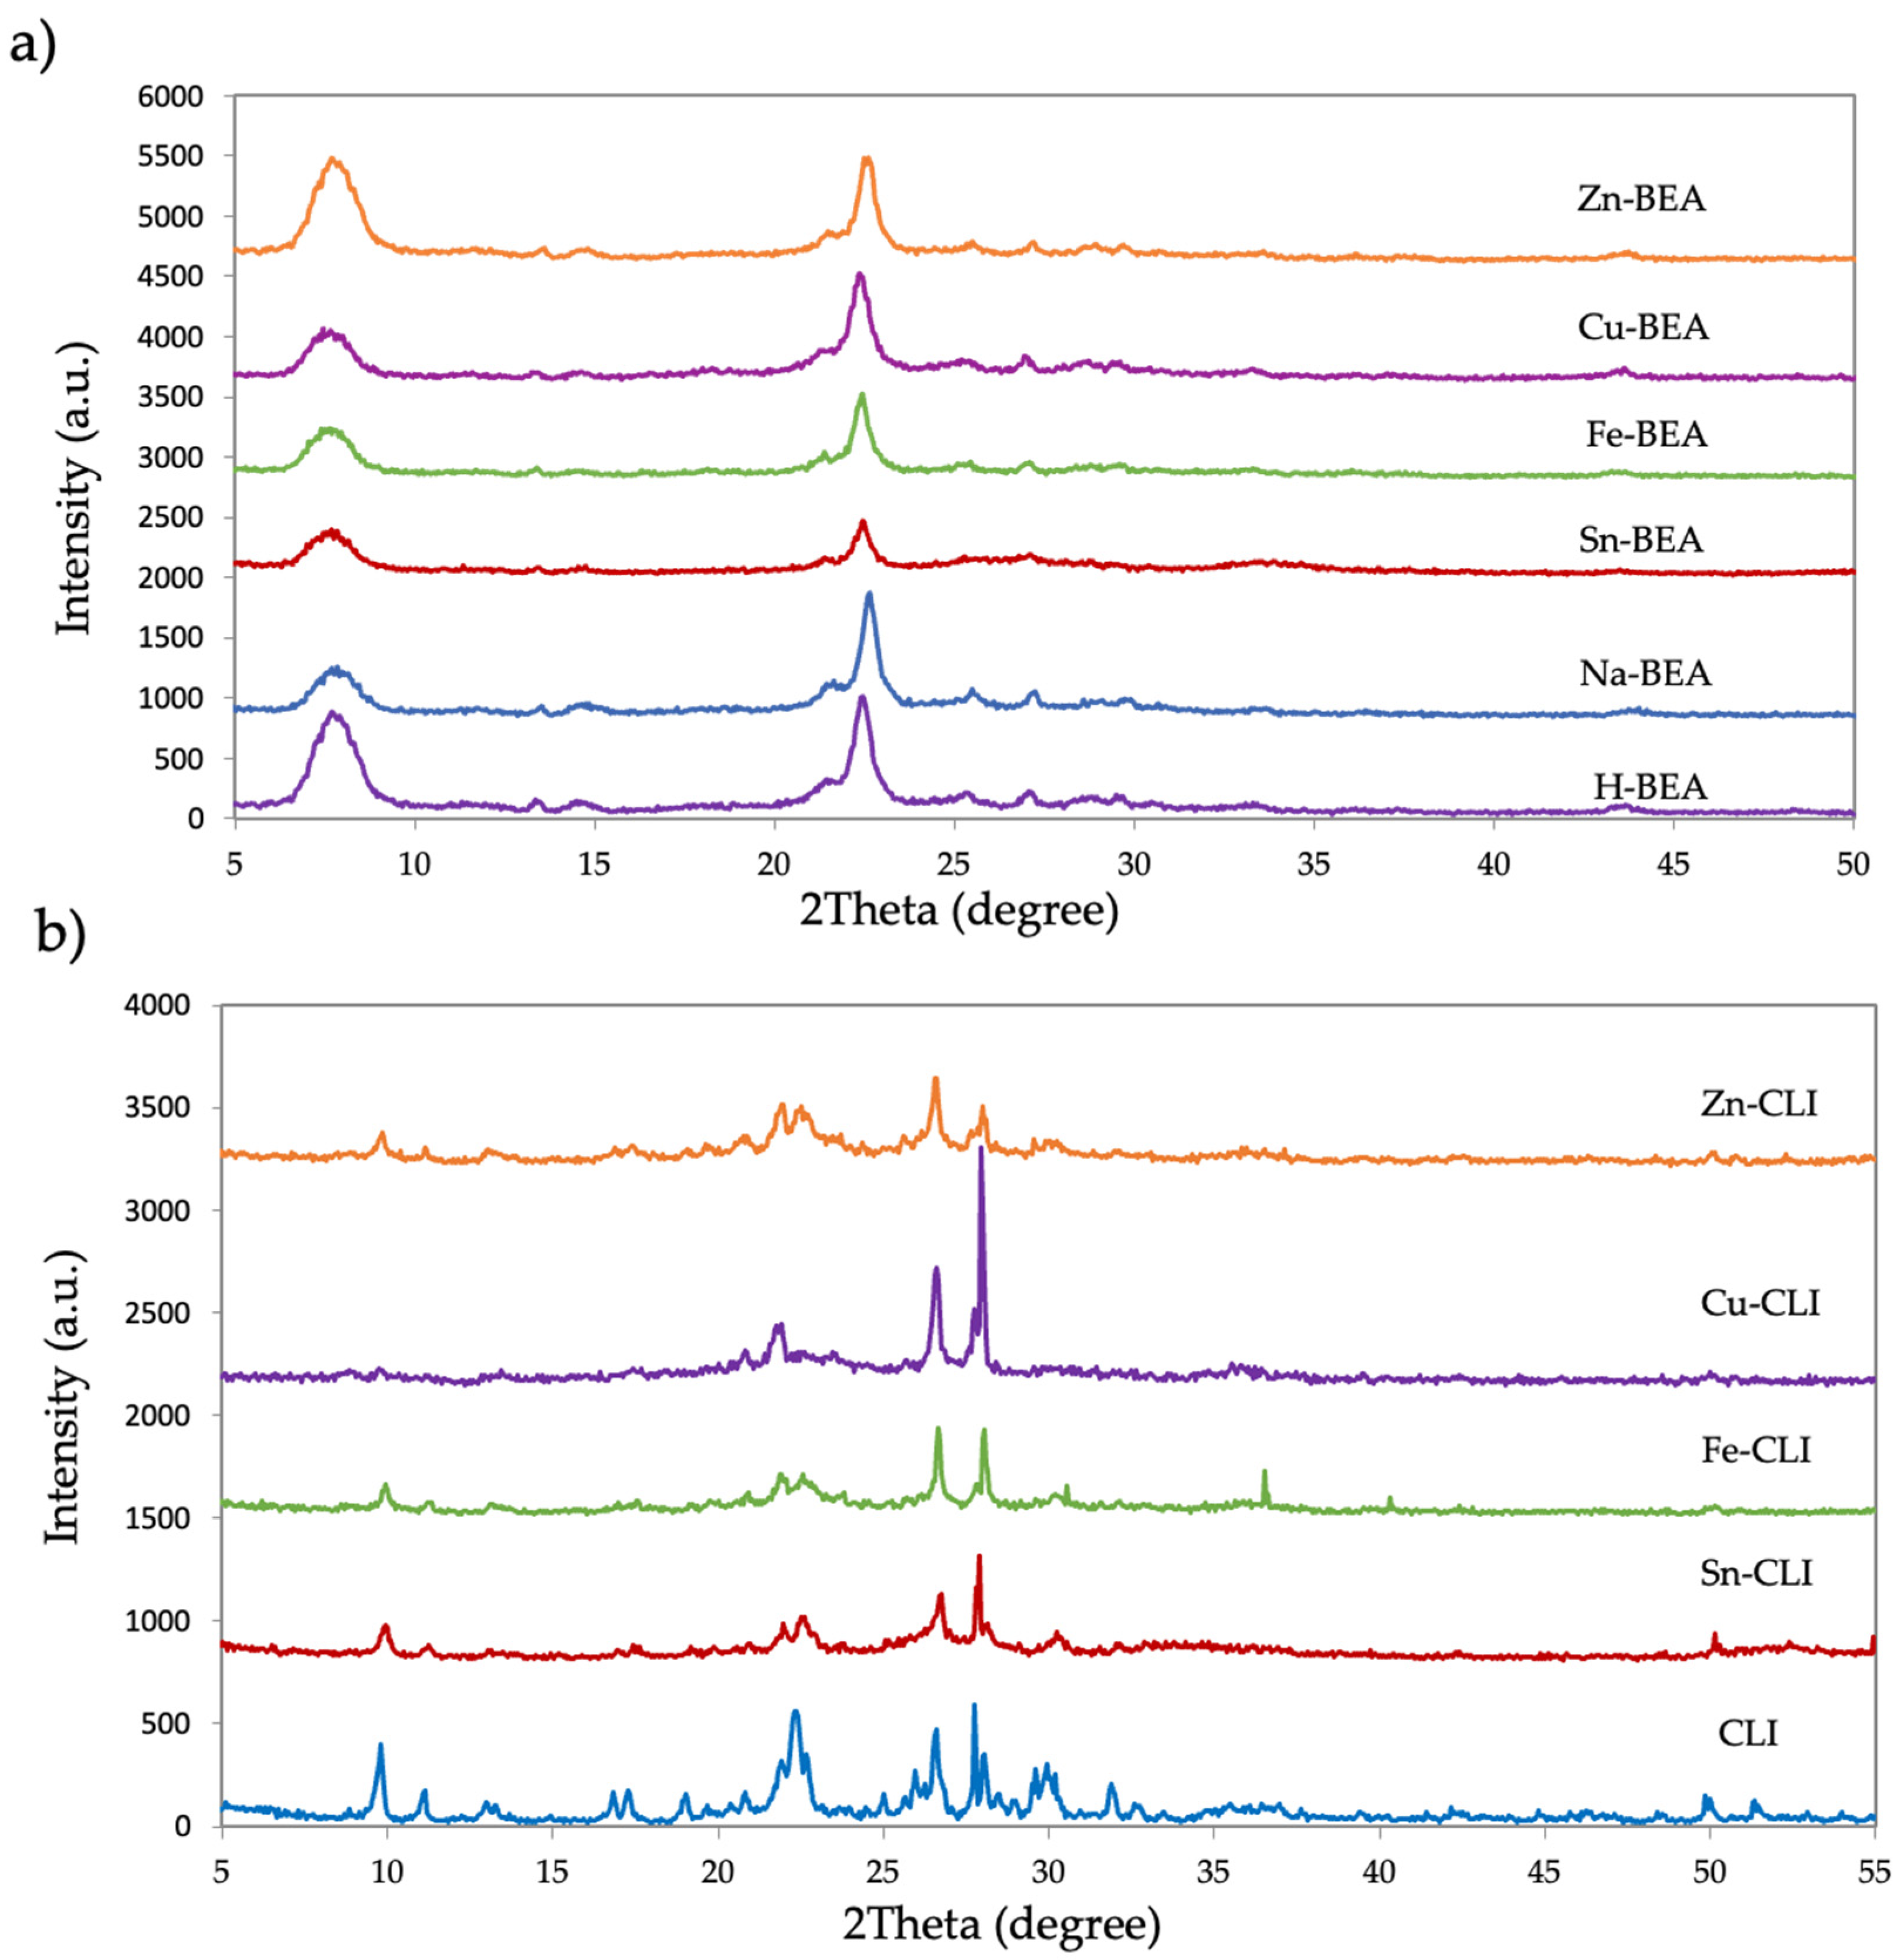
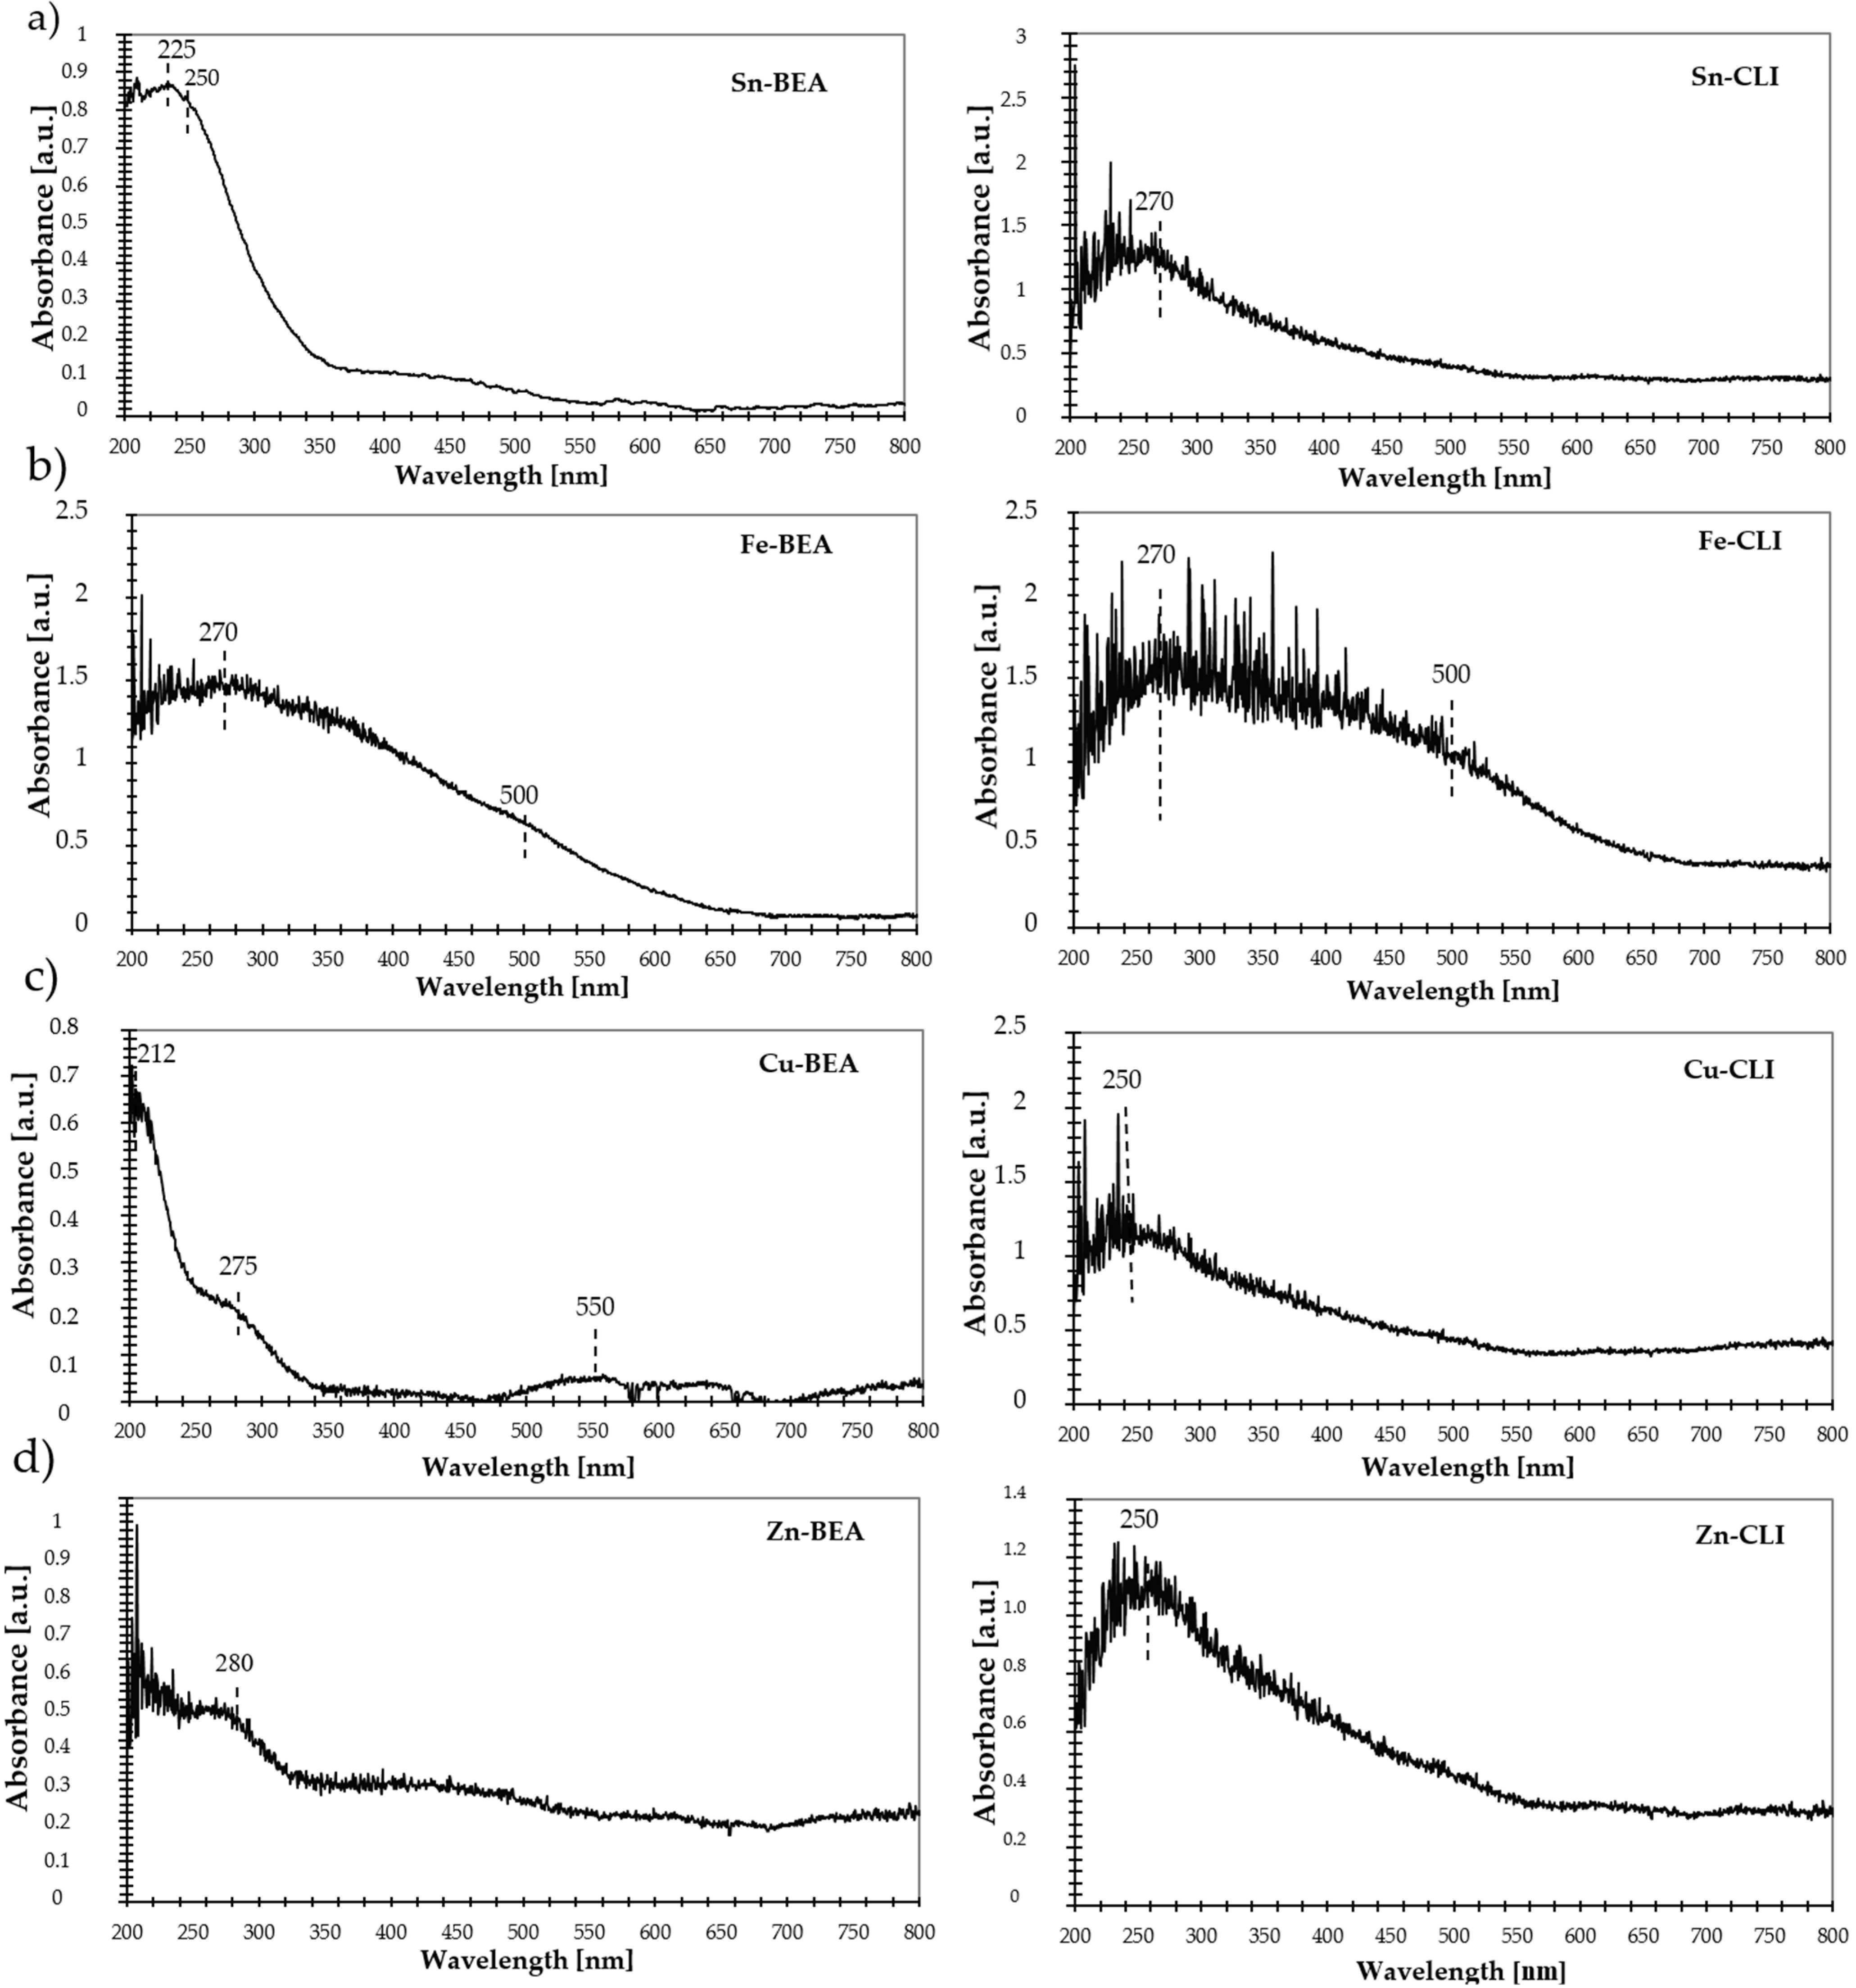
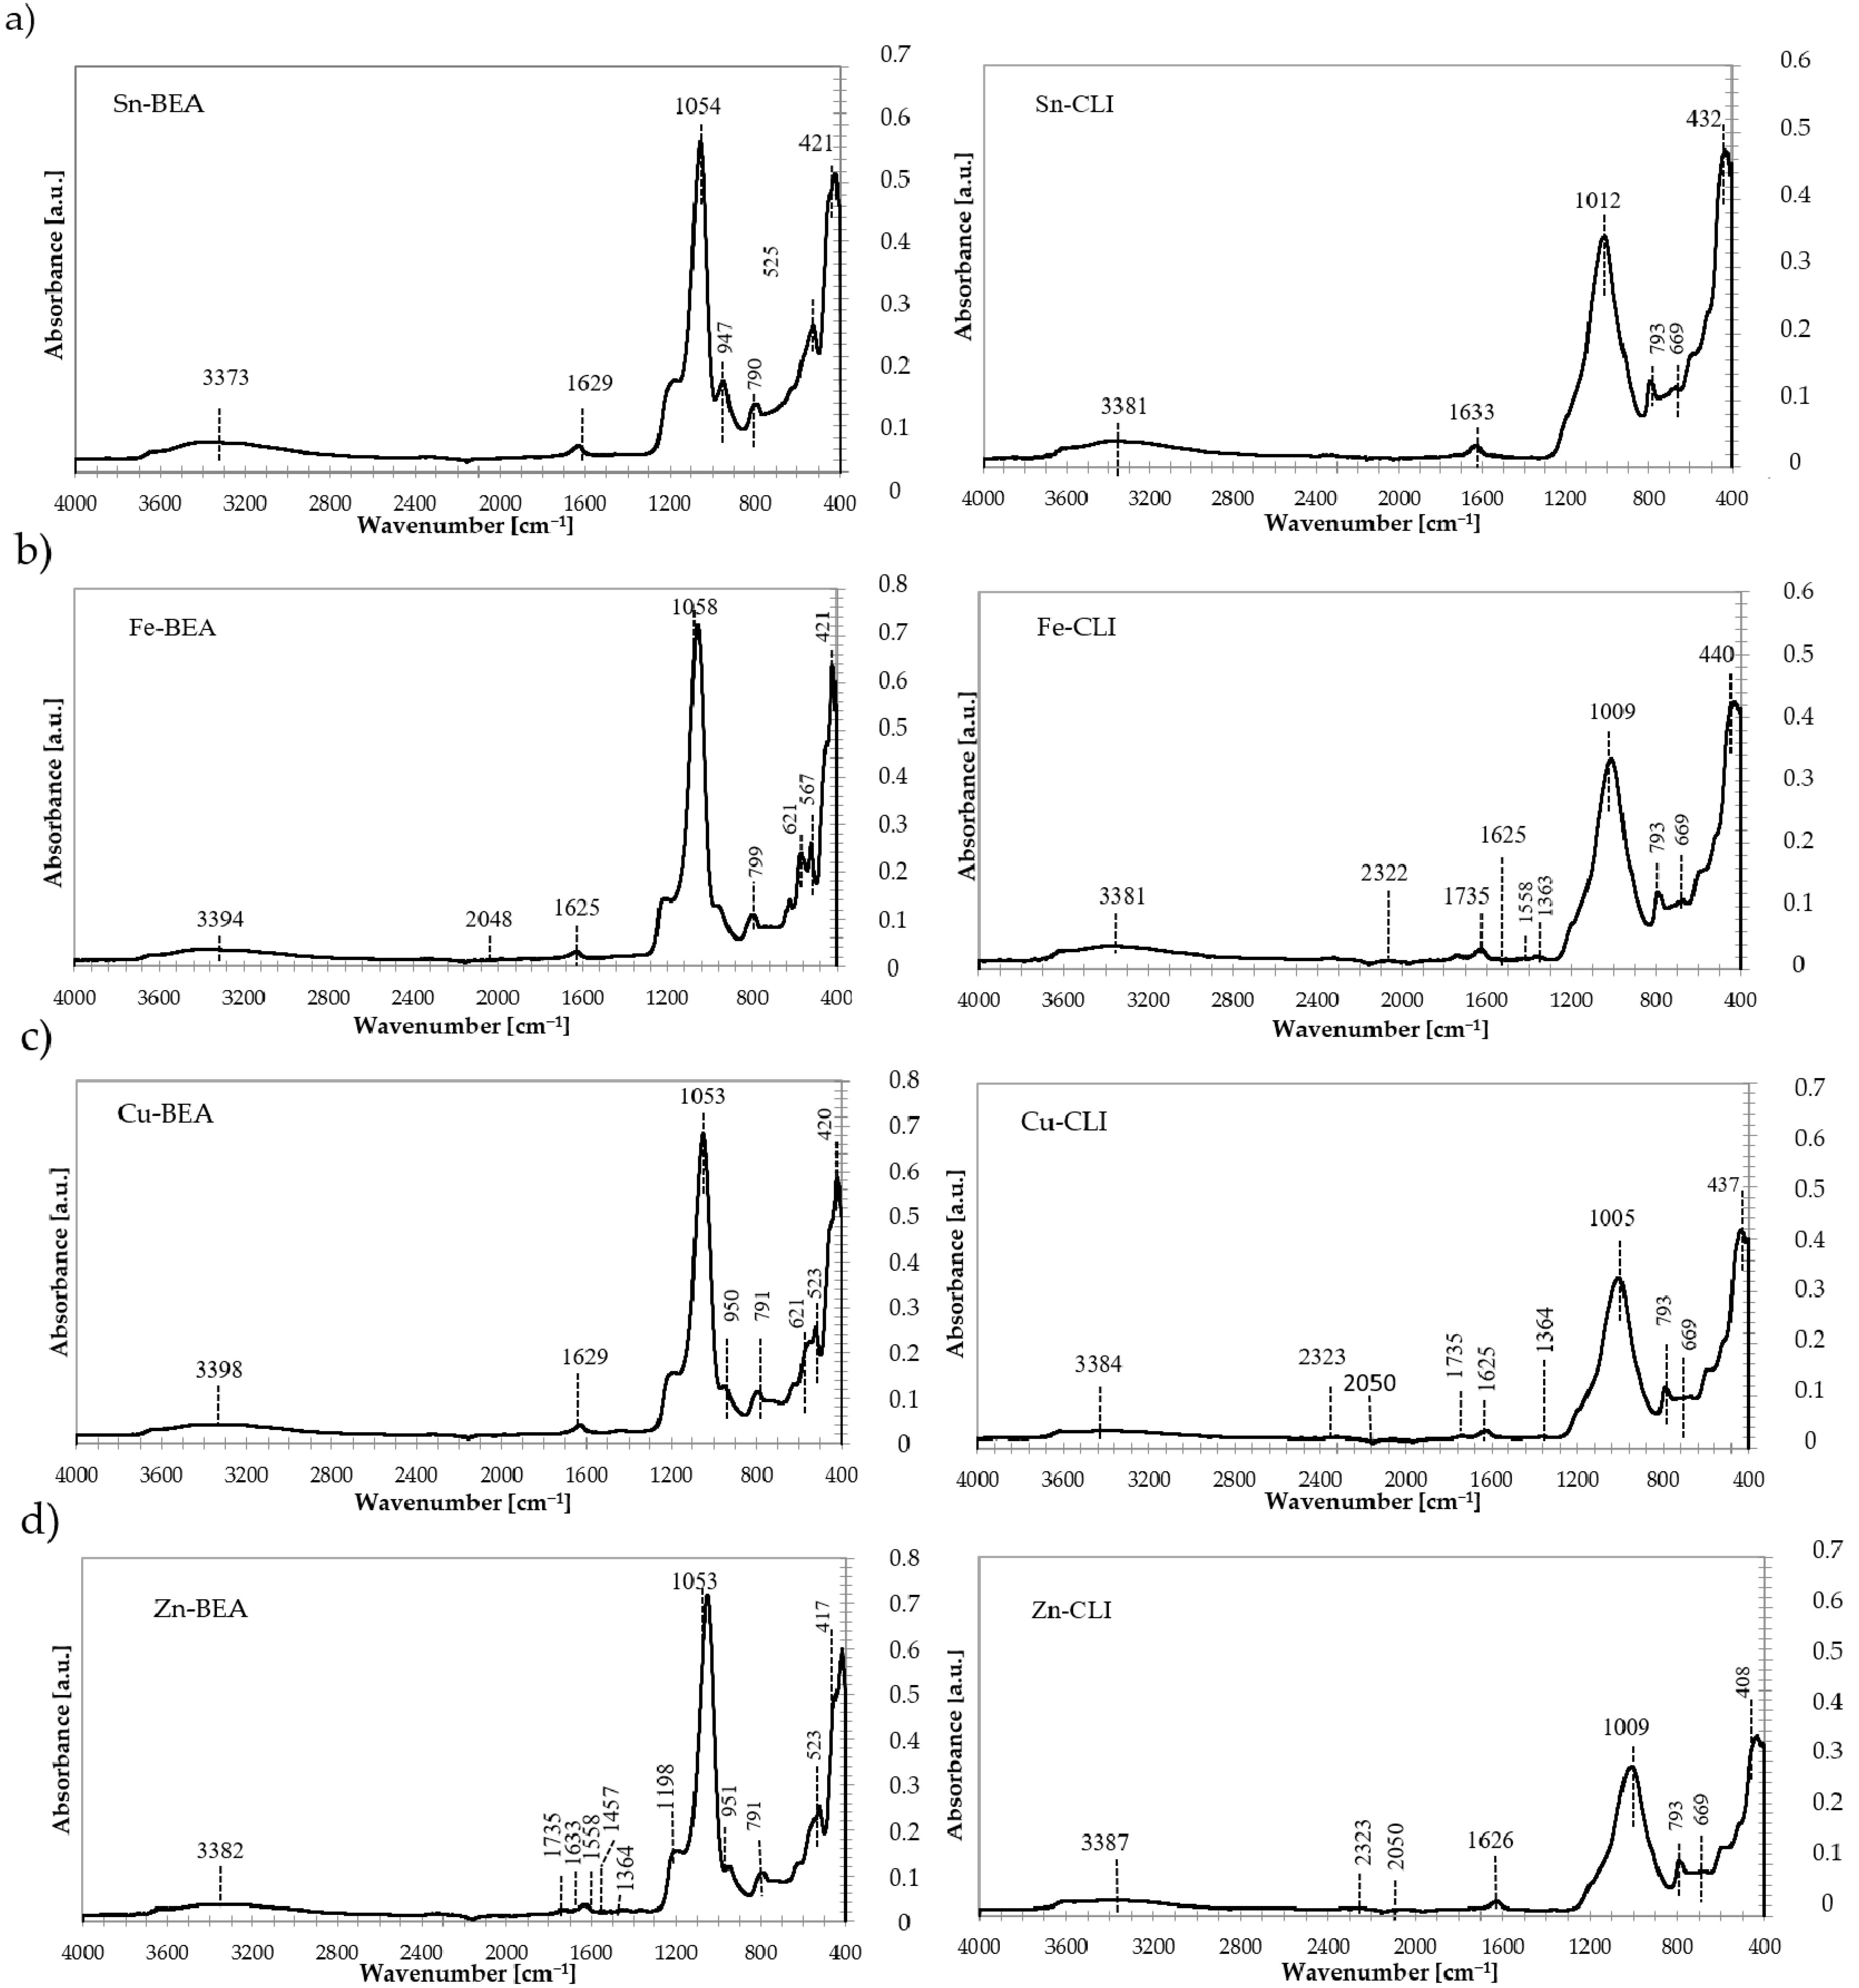
2.1. Structural Properties of Zeolite Catalysts

Figure 3, below, shows the diffractograms confirming the presence of a specific phase of the BEA zeolite and clinoptilolite. The analyzed materials showed no presence of other crystalline phases. The starting zeolites underwent a number of modifications, and all of the obtained XRD results confirm the presence of the crystal structure in an unchanged form.
The XRD measurements were performed for control samples: Na-BEA (Figure 3a) and CLI (Figure 3b). Measurements were also carried out for BEA and CLI zeolites modified with various metals (Sn, Fe, Cu, Zn).

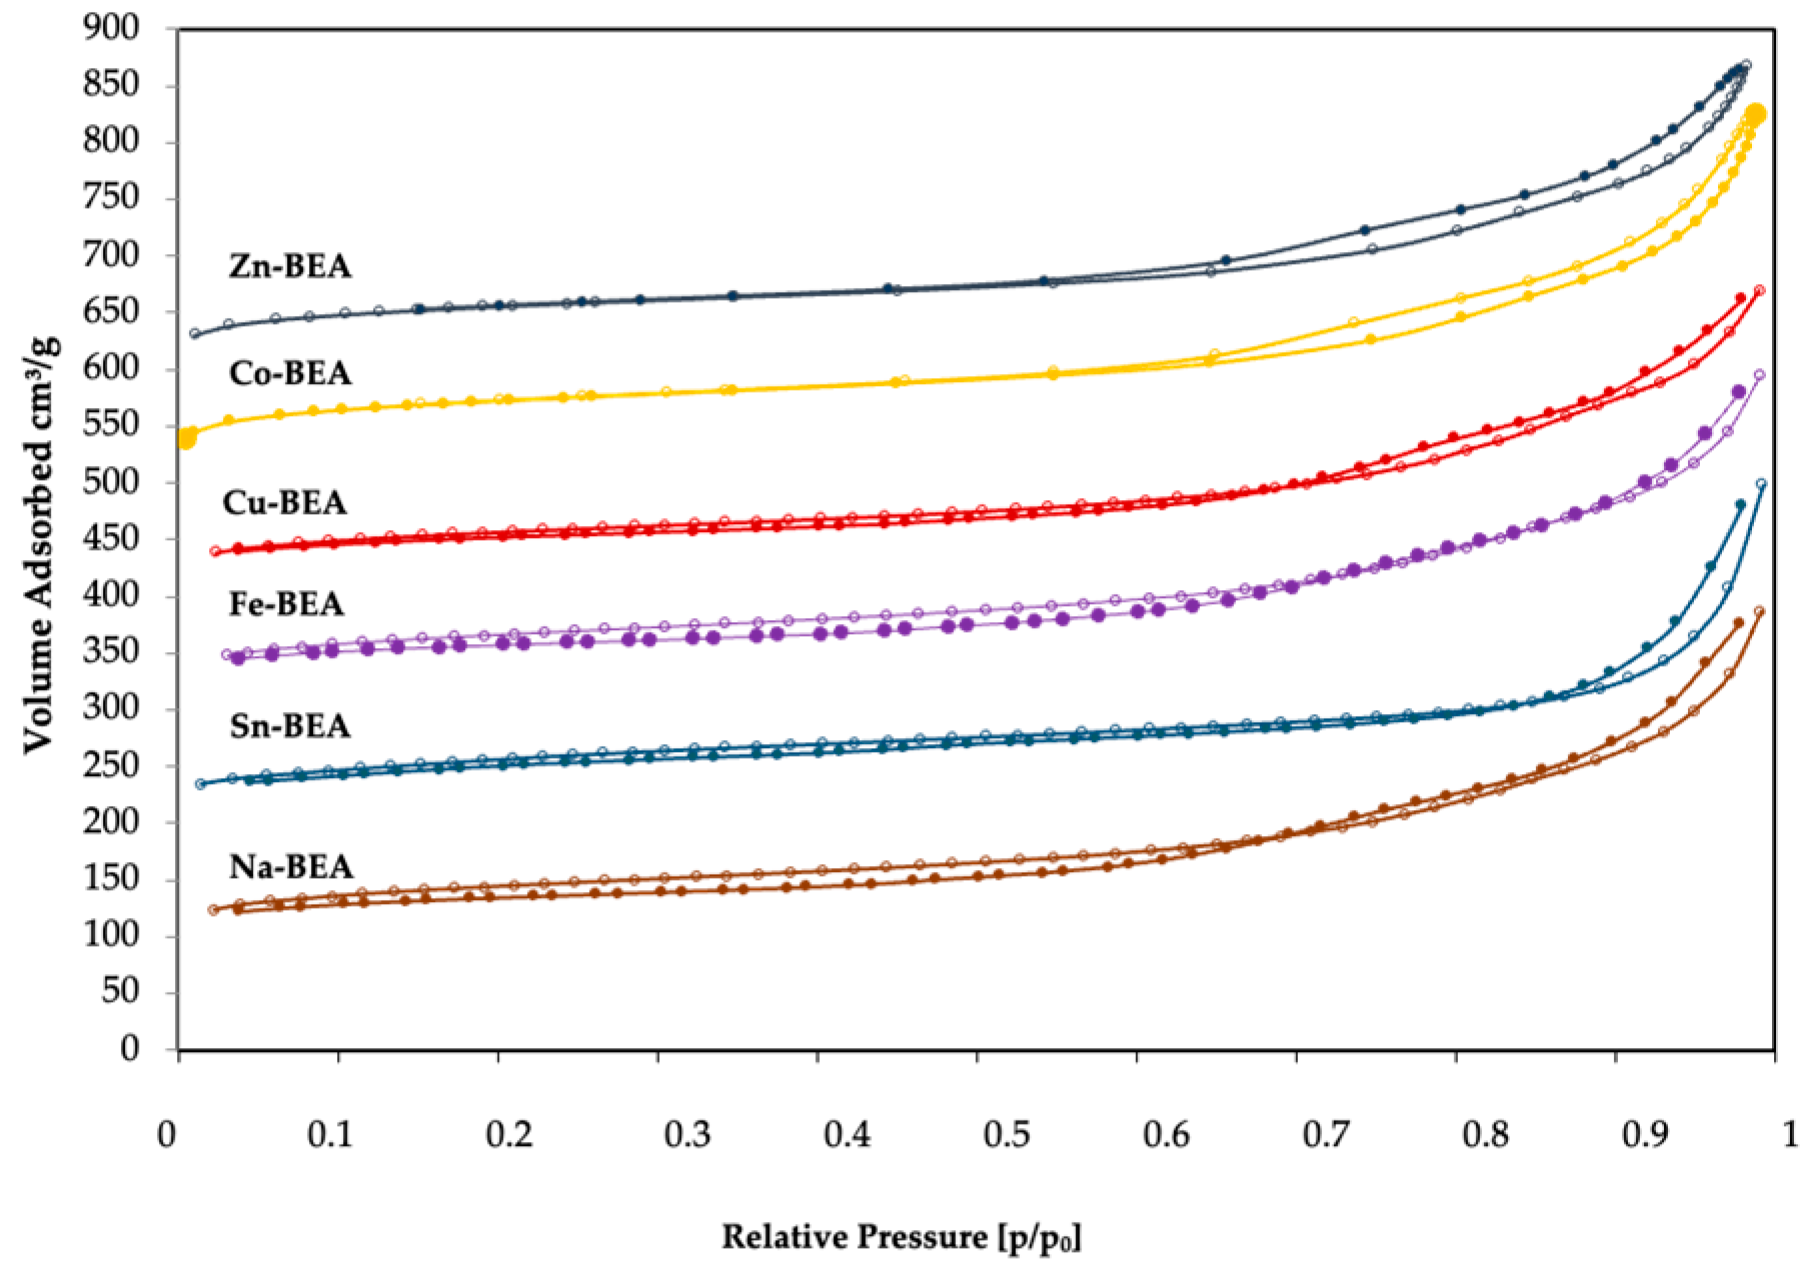
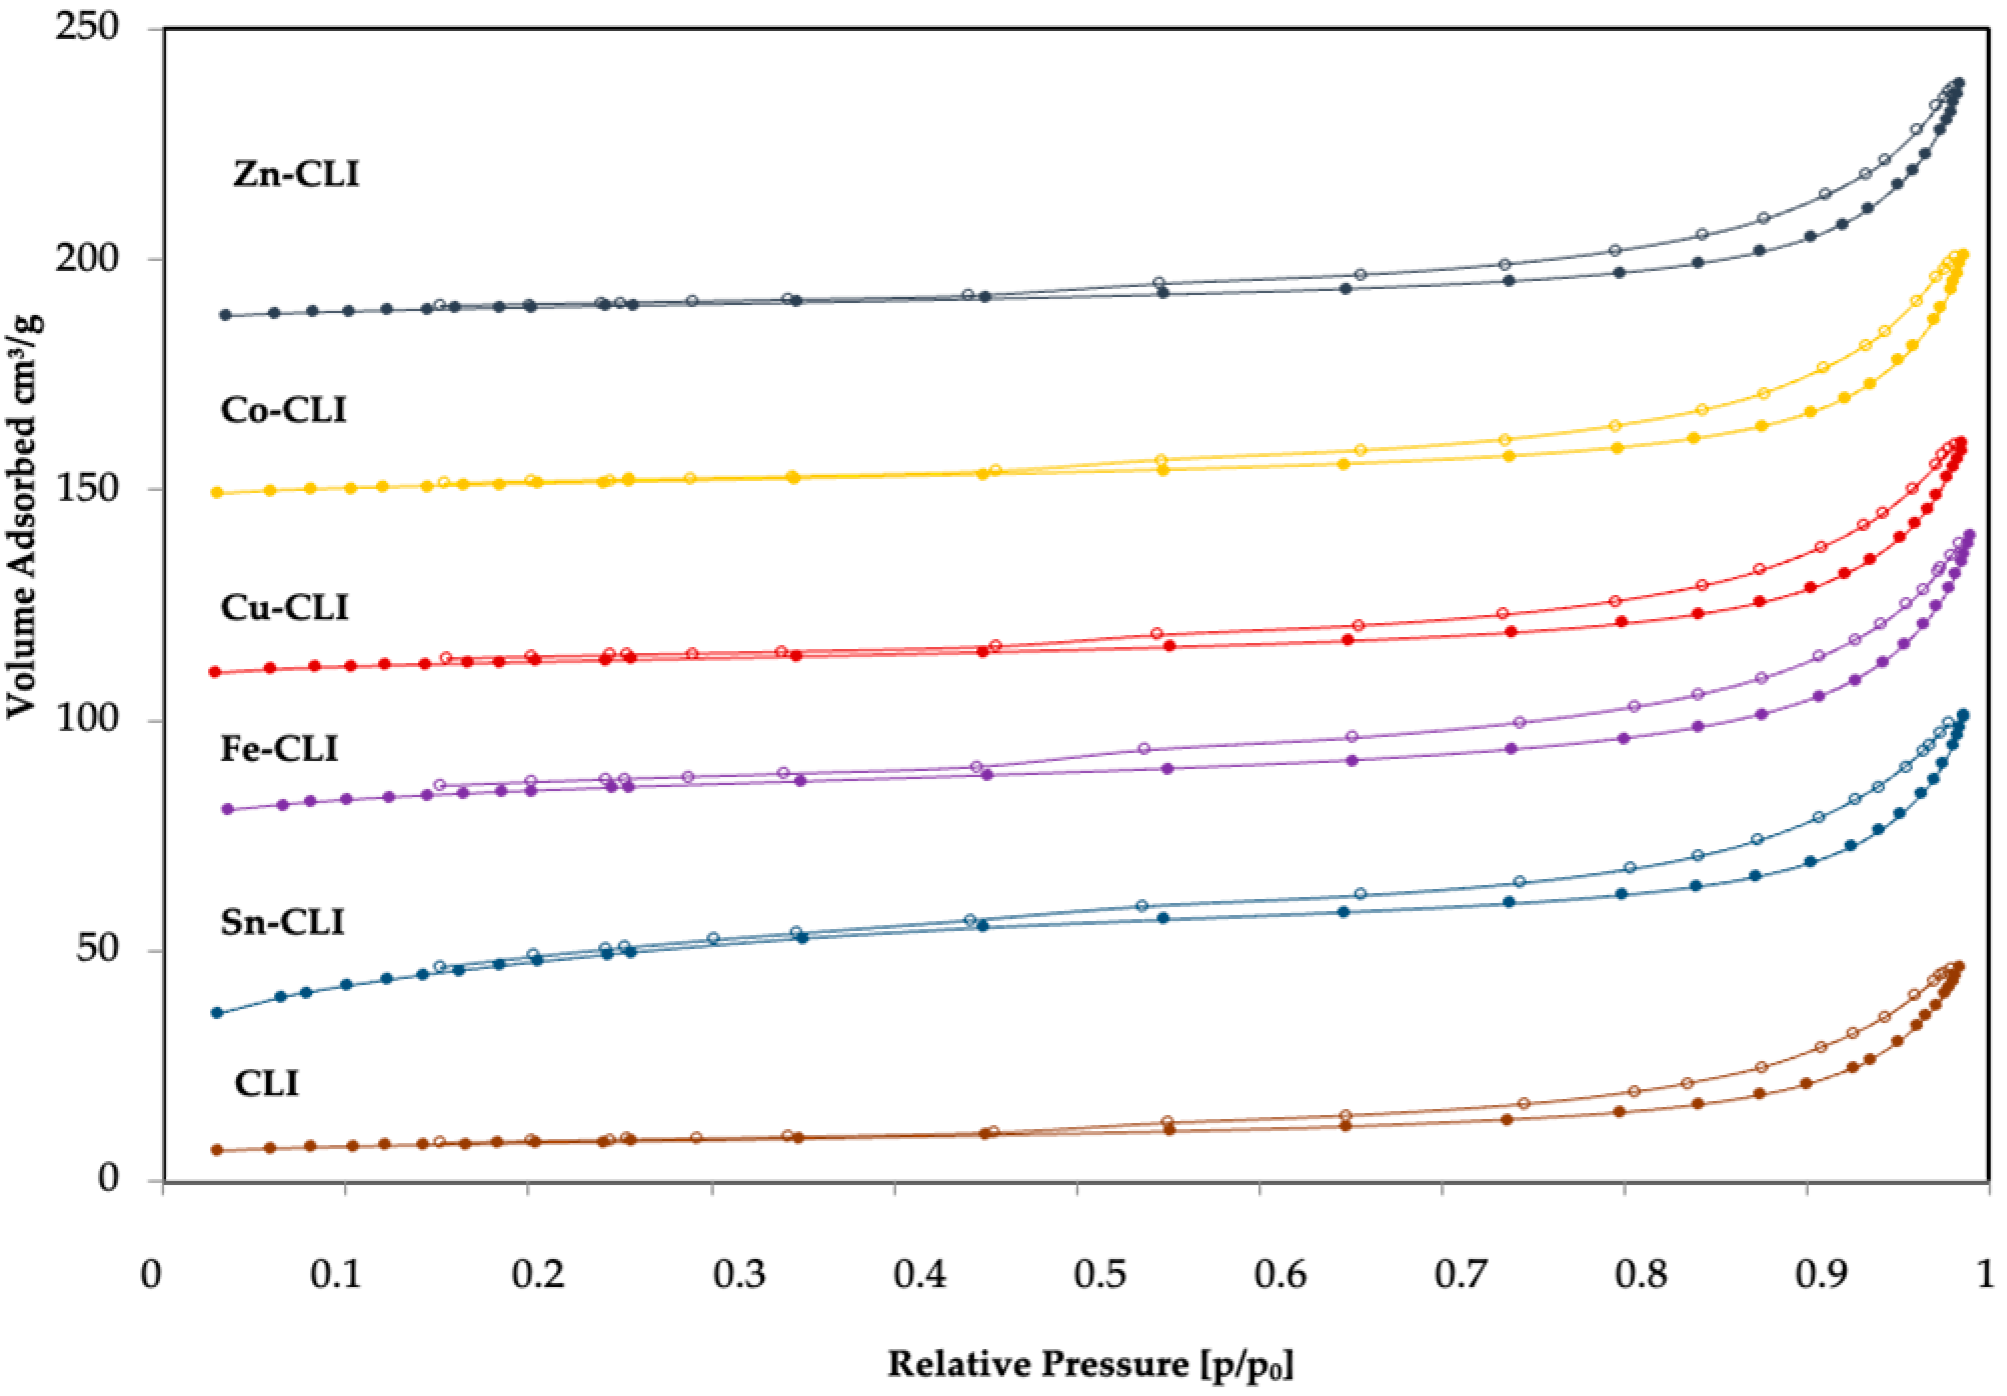
2.2. Porous Structure of Zeolite Catalysts

Figure 4 and Figure 5 show the nitrogen adsorption and desorption isotherms for selected samples. The isotherms of the selected zeolite catalysts show a similar character, and can be classified as type I (according to IUPAC). These materials show a microporous structure.
Table 1 shows the results of the surface area measurements and the pore size of the zeolite catalysts. The reference materials are Na-BEA and CLI. Changes in the specific surfaces of the modified zeolites based on BEA and clinoptilolite with various metals can be noticed. The surface areas of the ion-exchanged samples in solutions of the appropriate metal salt are larger than those of the starting material. The change in the BET surface of the zeolite catalysts may indicate that no structure degradation occurred during the modification and calcination of these materials. In contrast, a slight change in the size of the micropores may result from the presence of metal oxides, which may block access to the pores present in functionalized zeolites.

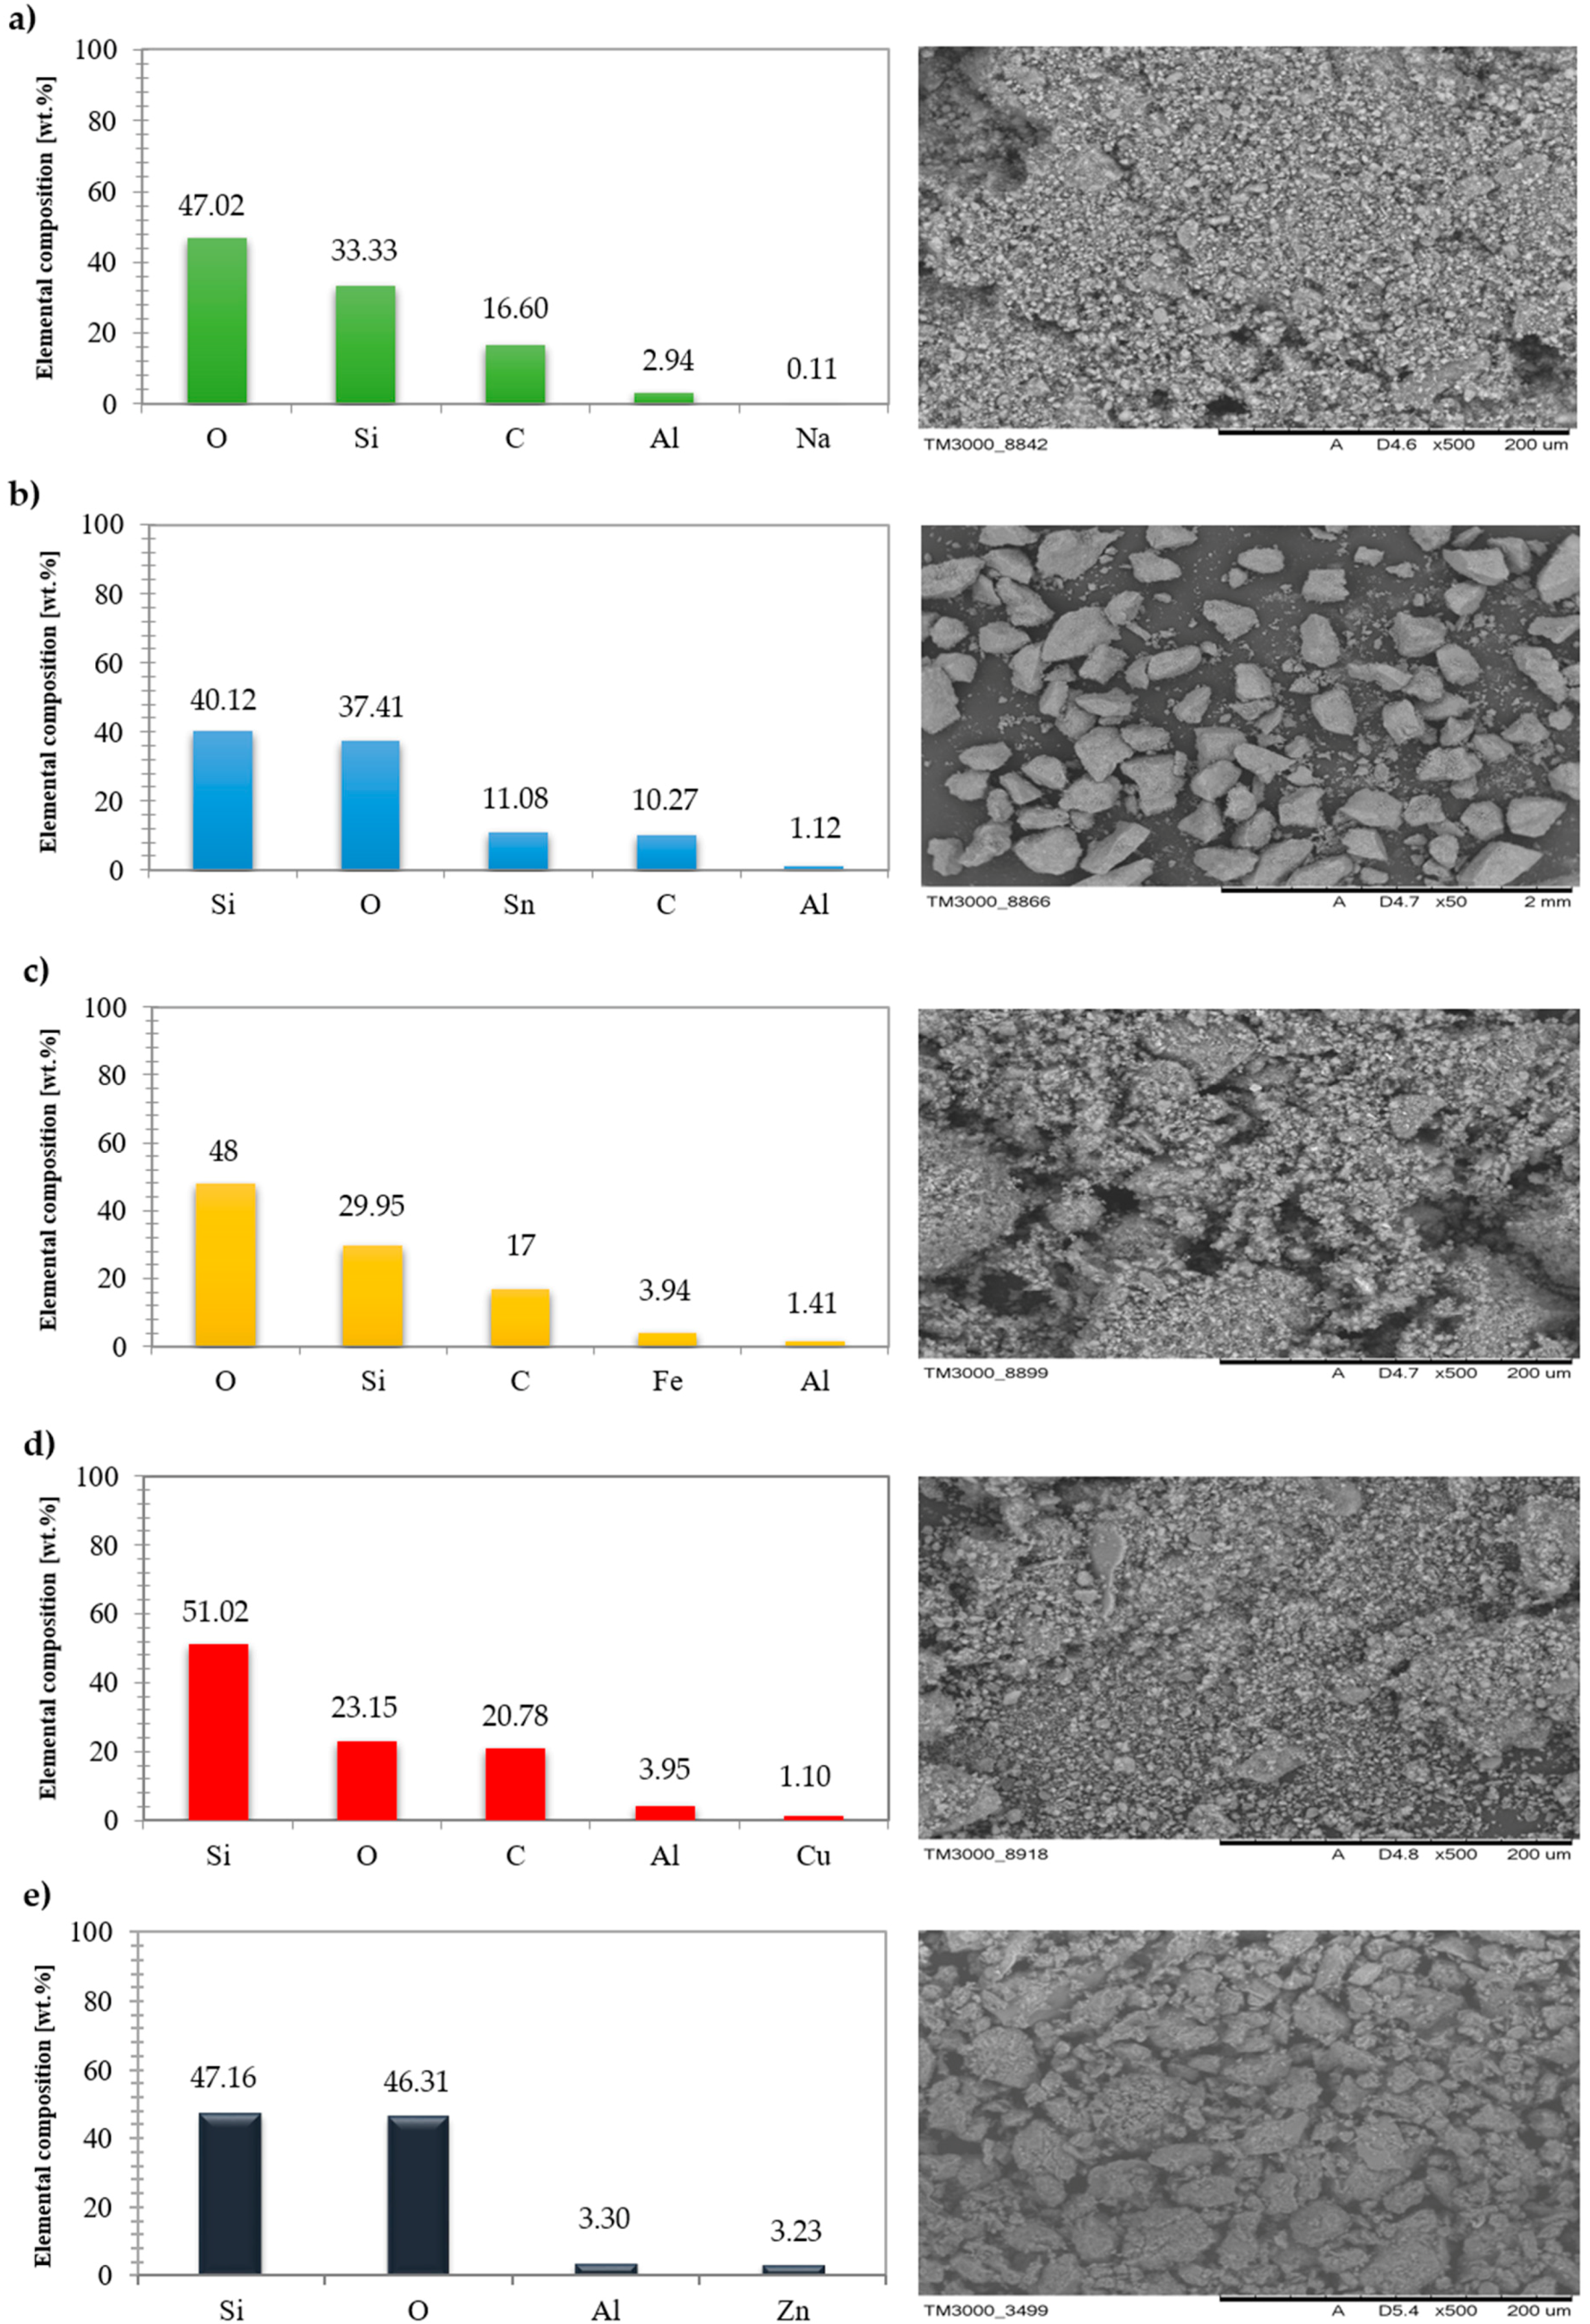
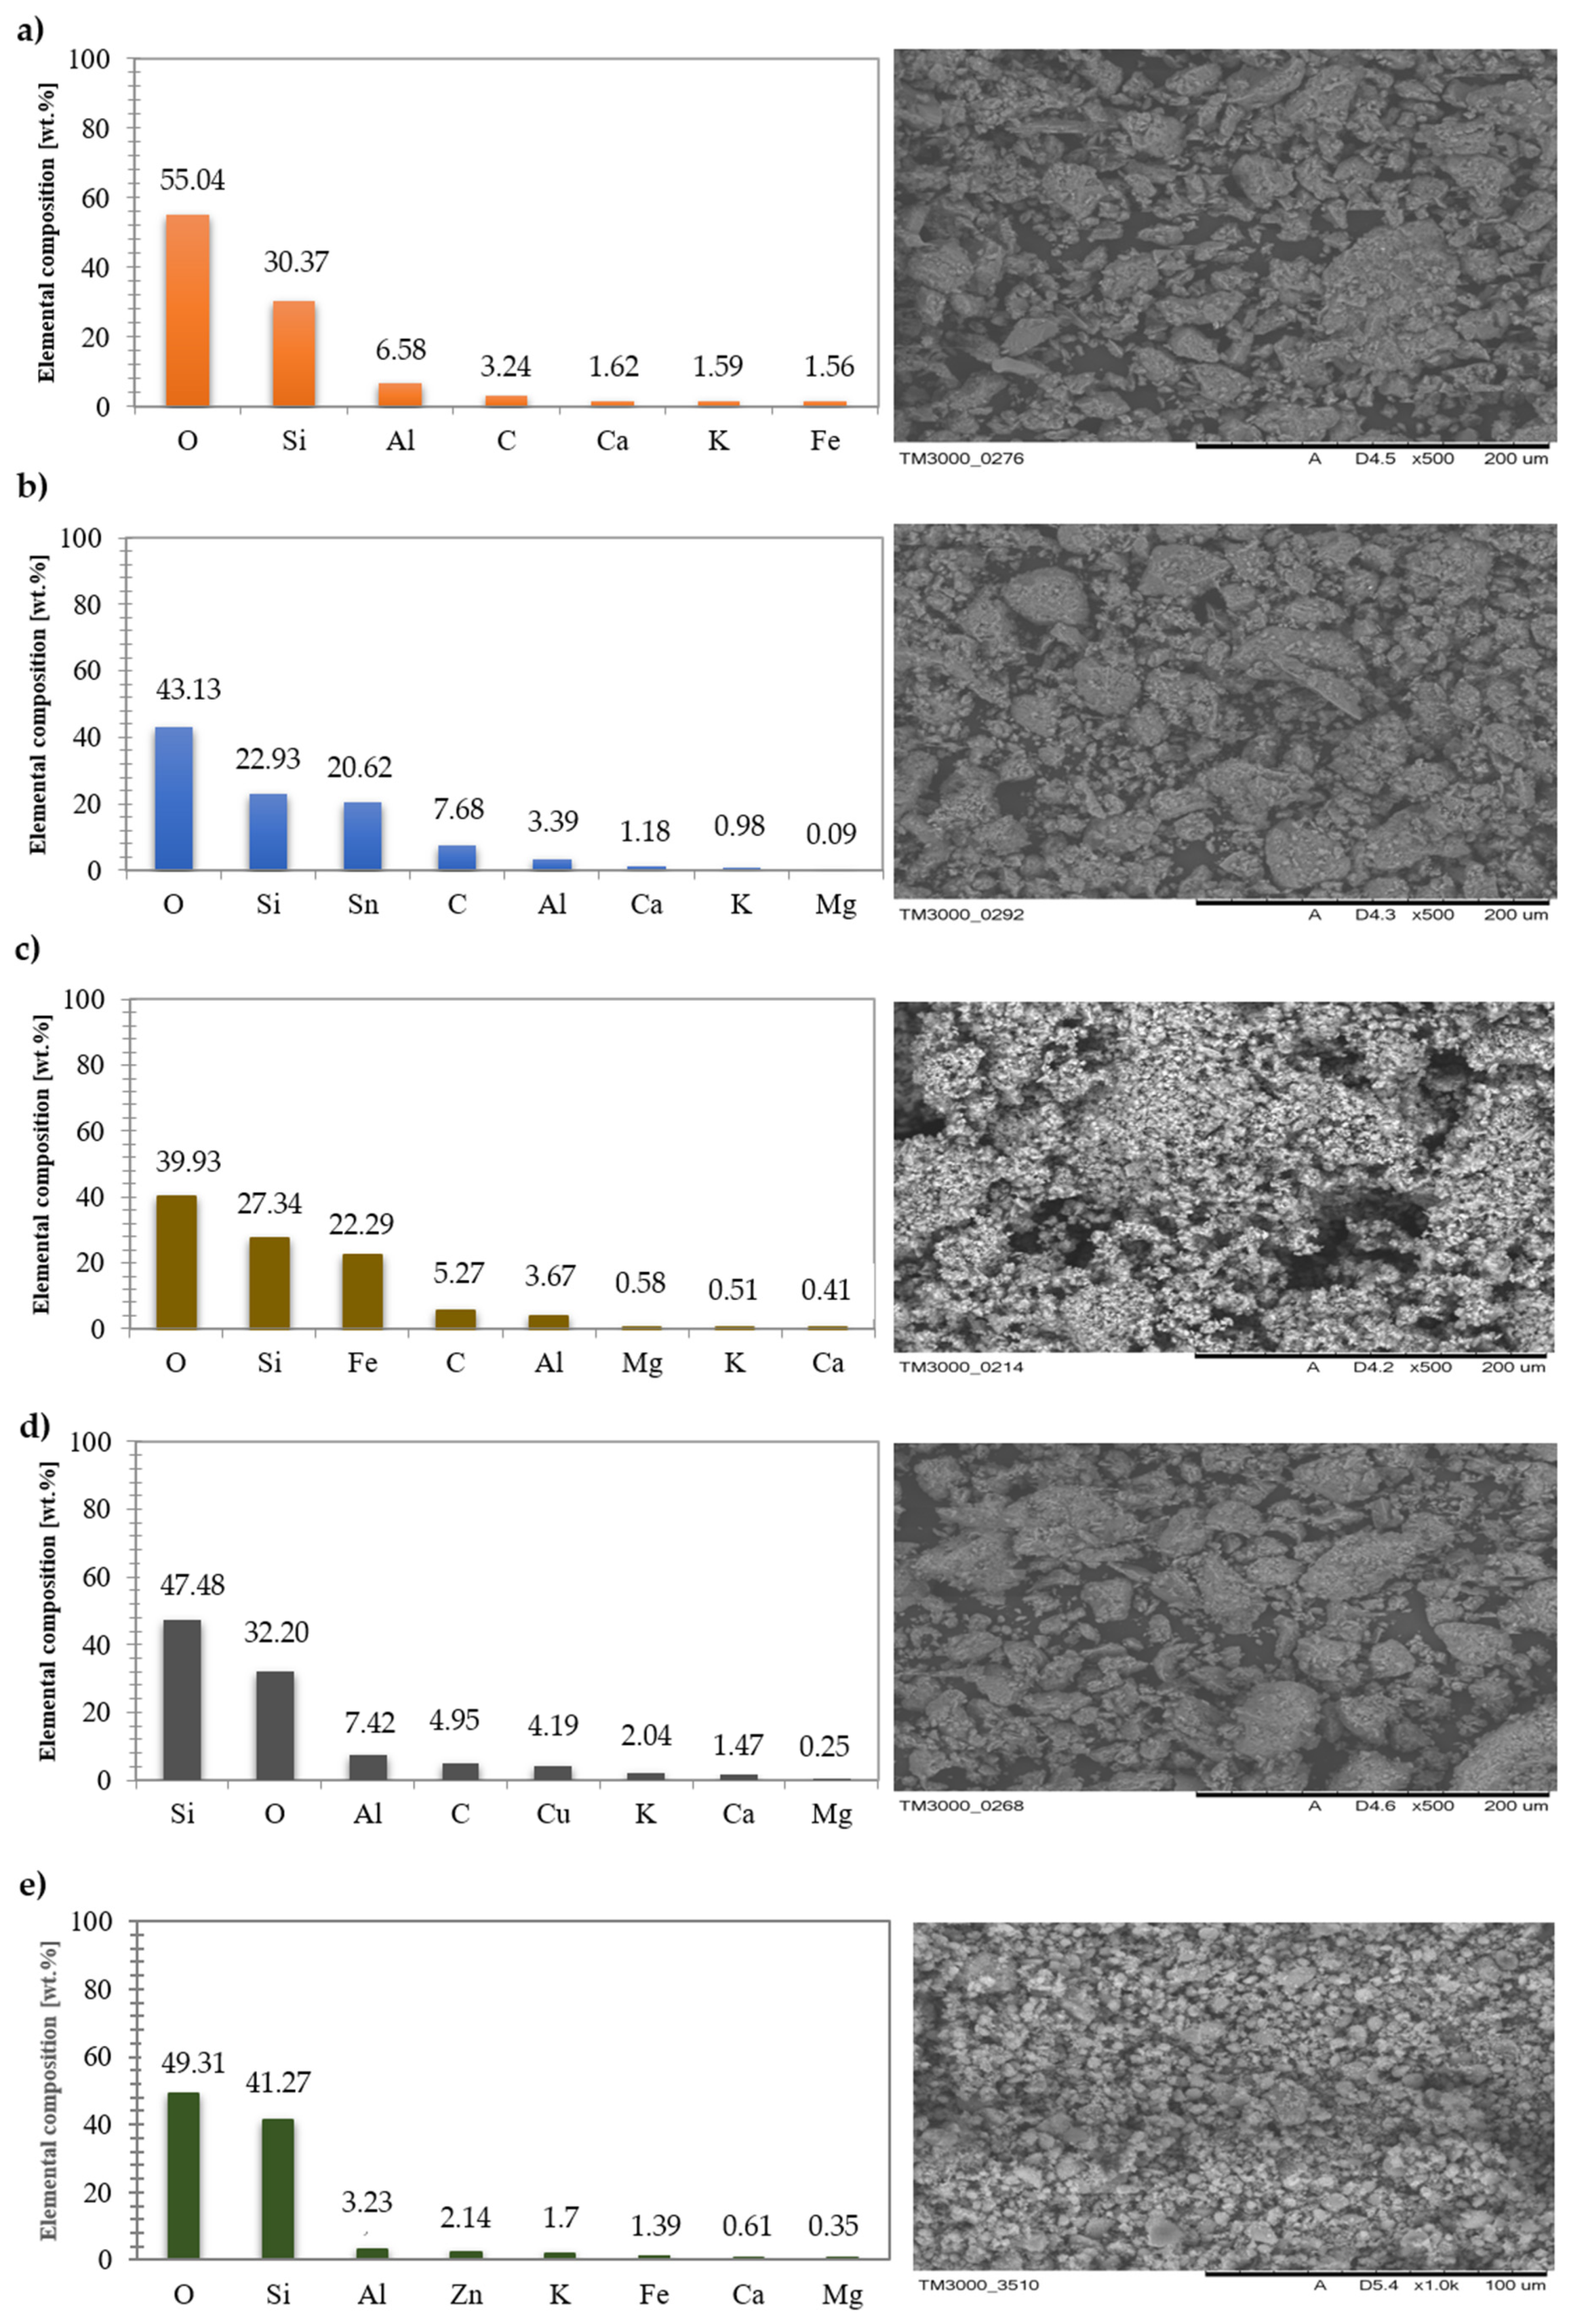
2.3. Metal Distribution in Zeolite Catalysts

The zeolite catalysts were obtained by introducing various metals (Fe, Sn, Cu, Zn) on their matrix (BEA, CLI) by ion exchange under hydrothermal conditions. Surface tests of the selected samples as well, as the elemental composition before modification and after ion exchange, were obtained by means of a scanning electron microscope with an EDS detector. The BEA (Figure 6) and CLI (Figure 7) zeolite catalysts with the incorporated metals Sn, Fe, Zn and Cu were analyzed. In order to compare the changes in morphology, images of the reference samples—Na-BEA and CLI—were taken.
Local measurements of the elemental composition were performed on the surfaces of the analyzed zeolite CLI catalysts. The presence of the elements Sn, Fe, Zn and Cu may indicate that they were incorporated during the modification of the zeolite by the ion exchange method. The presence of iron in the reference sample as one of the building blocks of this type of zeolite and the lack of catalysts formed may result from the modification process and partial substitution of this metal by the metals Sn, Zn and Cu. In the case of Fe-CLI, the amount of iron in the analyzed sample definitely increases. The presence of magnesium may be the result of sample contamination.
The Diffuse Reflectance Ultraviolet–visible Spectroscopy (DR UV-VIS) measurements were performed in the wavelength range of 200–800 nm to determine the possible metal coordinates in the structure of BEA and CLI zeolites. Figure 8 shows the UV-VIS spectra for the samples obtained by ion exchange under hydrothermal conditions.
The Attenuated Total Reflectance-Fourier Transform Infrared (ATR FTIR) spectra were used to characterized selected zeolite catalysts obtained by ion exchange under hydrothermal conditions, and they are presented in Figure 9.
Table 2 summarizes the properties of the samples according to their metal state using UV-VIS, ATR-FTIR and X-ray powder diffraction (XRD). Cu-CLI is clearly destroyed due to the disappearance of the main diffraction peaks of CLI, and some peaks at about 26° and 28° of the XRD are irregularly enhanced (see also Figure 3).

2.4. Catalytic Tests

The catalytic tests were carried out in an autoclave with a Teflon filling. In total, 0.3 g catalyst and 20 mL 0.125 M DHA solution in ethanol were introduced. The reaction was performed at 120 °C for 3 h and 5 h. The obtained products were recovered by centrifuging the suspension and analyzed by gas chromatography (GC). The procedure was performed for a series of the zeolite catalysts as well as the products, and is collected in Table 3. The carbon balance was determined by the weight difference of the reaction mixture before and after the process, including the carbon deposits in the catalyst.

3. Discussion

3.1. Structure of Metal-Modified Zeolite Catalysts

The analysis was aimed at the confirmation of the characteristic crystal structure derived from the BEA and CLI zeolites. No degradation of the metal-modified zeolite structures was observed (Figure 3). The description of the results based on the obtained diffractograms from the analyzed materials is presented below. The samples prepared by ion exchange show a crystal structure. During the modification, the Na+ ions are exchanged for NH4+. Further heat treatment transforms the form ≡Si–O–NH4 to ≡Si–O–H. The condensation or dehydration of silanol groups may cause the formation of the ≡Si–O–Si≡ bond, which helps to maintain the microporous crystal structure of all of the metal-exchanged BEA [31]. As reported in the literature, SnO2 diffraction peaks at 2θ = 26.7° and 2θ = 34° can be observed [32]. For the CLI samples, a decrease in d302 (Å) for Sn-CLI (3.2013 Å) compared to CLI (3.3508 Å) may indicate the incorporation of metal into the off-grid position.
The diffraction peaks characteristic for Fe2O3 are observed at 2θ = 33.2° or 35.5° [33]. In the case of the analyzed samples on the BEA matrix, regardless of the modification, the presence of iron(III) oxide can be observed in their structure. For samples on the CLI matrix, Fe2O3 can be observed at 2θ = 33–35° [34].
As shown in the literature, the diffraction peaks at 2θ = 35–36° can be assigned to Cu+ ions and Cu2+, as well as CuO at 2θ = 39–41°, 49–50° [35,36]. In the case of copper (CuO) present in zeolite, CLI can be observed at 2θ at 36°, 39°, 49–50° [37]. Based on the diffractogram we can observe CuO at 2θ = 36°, 50° for all of the samples on the CLI matrix.
In the diffraction pattern according to the literature, ZnO for 2θ can be observed at 36–38° [38,39]. In the above diffractograms showing zeolite catalysts based on BEA, no peaks derived from Zn can be observed. On the other hand, an increase in the d302 (Å) spacing of the Zn-BEA samples in comparison with the control samples indicates the presence of zinc in the lattice position of the zeolite.

3.2. Characteristics of Active Sites in Metal-Modified Zeolite Catalysts

In the case of the Sn-BEA sample (Figure 8a, left), two bands are visible at 225 nm and 270 nm, whereas for Sn-CLI (Figure 8a, right) one band was observed at 270 nm. The spectrum produced at 225 nm is assigned to a coordinated Sn(IV) tetrahedron incorporated into the zeolite structure. The spectrum at 270 nm is usually attributed to the octahedral tin species present in zeolite, which were observed in all of the analyzed samples [31,40].
The bands at 300 and 500 nm were observed in the DR UV-VIS spectra (Figure 8b). The band at 300 nm can be attributed to the isolated form of Fe3+. The presence of an additional band at around 500 nm corresponds to FeOx oligomers or Fe2O3 nanoparticles [41].
In the analyzed Cu-BEA sample (Figure 8c, left), two bands were observed at 212 nm and 275 nm. The 275 nm band is present in the Cu-CLI material (Figure 8c, right). The band at the lower wavelength (212 nm) is derived from the zeolite structure and is not related to copper. On the other hand, the band at 275 nm is present in all of the samples and indicates the presence of Cu2+, which interacts with the lattice oxygen present in the zeolites [42].
The observed bands in the range of 250–280 nm suggest the presence of an isolated ZnO, located in cavities and in the zeolite channels [43].
The ATR FTIR infrared spectroscopy method was performed in order to confirm the presence of metal complexes in the lattice positions of BEA zeolites and clinoptilolite (Figure 9). The presence of a band at 3372–3381 cm−1 is characteristic of the Si-OH group. Based on the literature, the band at 960 cm−1 is characteristic of the BEA zeolite, as are the Si-O stretching bonds which belong to SiO4 tetrahedra. The visible bands at 947–948 cm−1 indicate the presence of a metal in the BEA lattice structure in the form of Sn4+. In Sn-CLI, the tin is located in off-grid positions—there is no band at 940–960 cm−1 [44,45].
The band at 3381–3394 cm−1 comes from the Si–OH group, or from the Si–O (H) –Al bridges [46]. The spectral area between 600 and 1200 cm−1 is difficult to interpret due to the presence of vibrations from the Si–O and Al–O structures present in the zeolite. However, a band at 790–947 cm−1 can be observed, which can be attributed to the disturbed vibration of the Si–O–T skeleton (T = Si, Al) as a result of the presence of iron [47,48,49,50].
The bands at 3384–3398 cm−1 can come from the Si–OH group or the Si–O (H) –Al bridge junction [46]. According to the literature, the frequencies belonging to CuO were recorded at 422, 497 and 600 cm−1 [51].
In the case of the analyzed samples, the presence of the spectra can be attributed to the presence of CuO in all of the tested catalysts. The copper in the zeolite structure is also confirmed by DR UV-VIS.
According to the available literature, a wide band between 3500–3000 cm−1 is assigned to the Si–O (H) –Al bridge bond. The lower intensity of the band indicates the presence of Zn2+ or ZnO during the ion exchange [52]. In the tested samples, this band is present at 3382–3415 cm−1, which proves the presence of a bridge bond with the zinc present. The strongest adsorption peak of 1074 cm−1 relates to the stretching vibration band belonging to the Si (Al)–O zeolite backbone. The presence of this band after calcination above 400 °C indicates the high thermostability of the zeolite skeleton. On the other hand, the wide band at 965–1140 cm−1 is attributed to the Si (Al)–O stretching vibrations, which shift during ion exchange without changes in the zeolite structure. ZnO is associated with the zeolite frame, and can be observed at 475–798 cm−1. The vibrations at the peaks of 1550 cm−1 and 1726 cm−1 indicate the presence of ZnO on the material surface [52]. During the analysis of the obtained peaks of the tested samples, a slight shift of the band peaks in comparison with literature data proves the incorporation of ZnO into the zeolite skeleton and the presence of Zn-BEA on the surface.

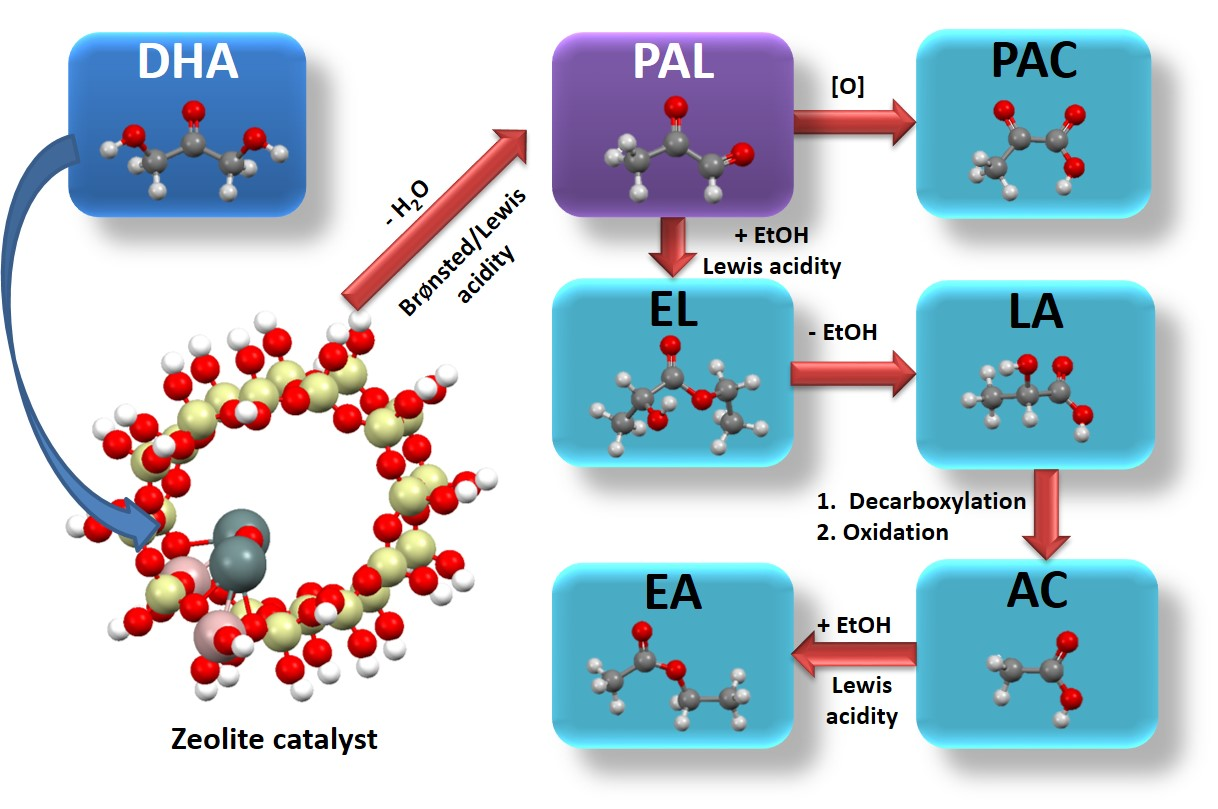
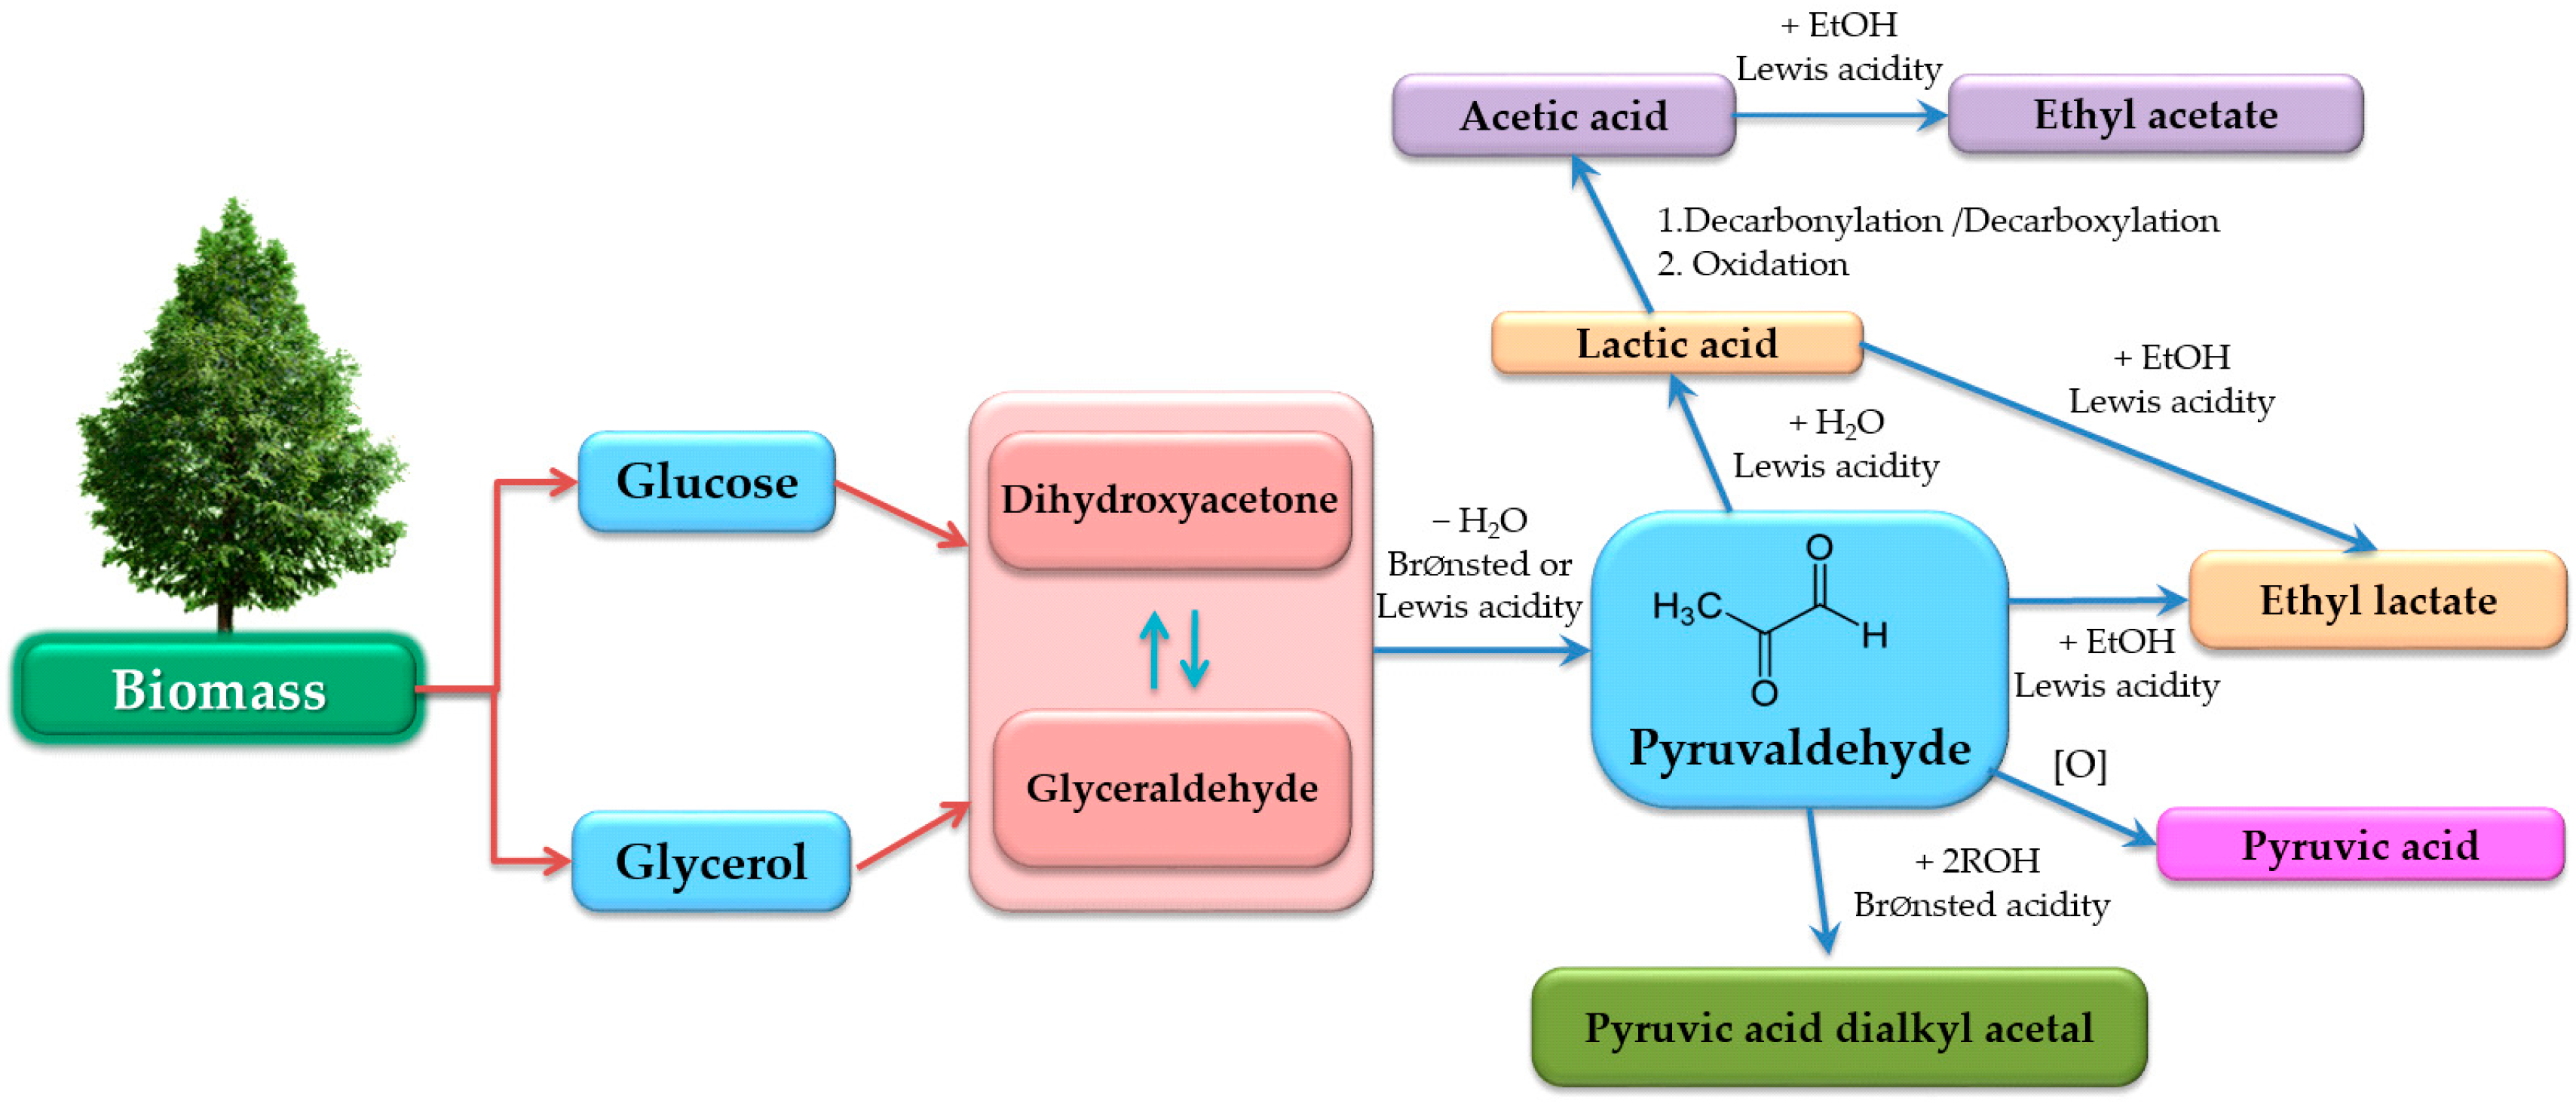
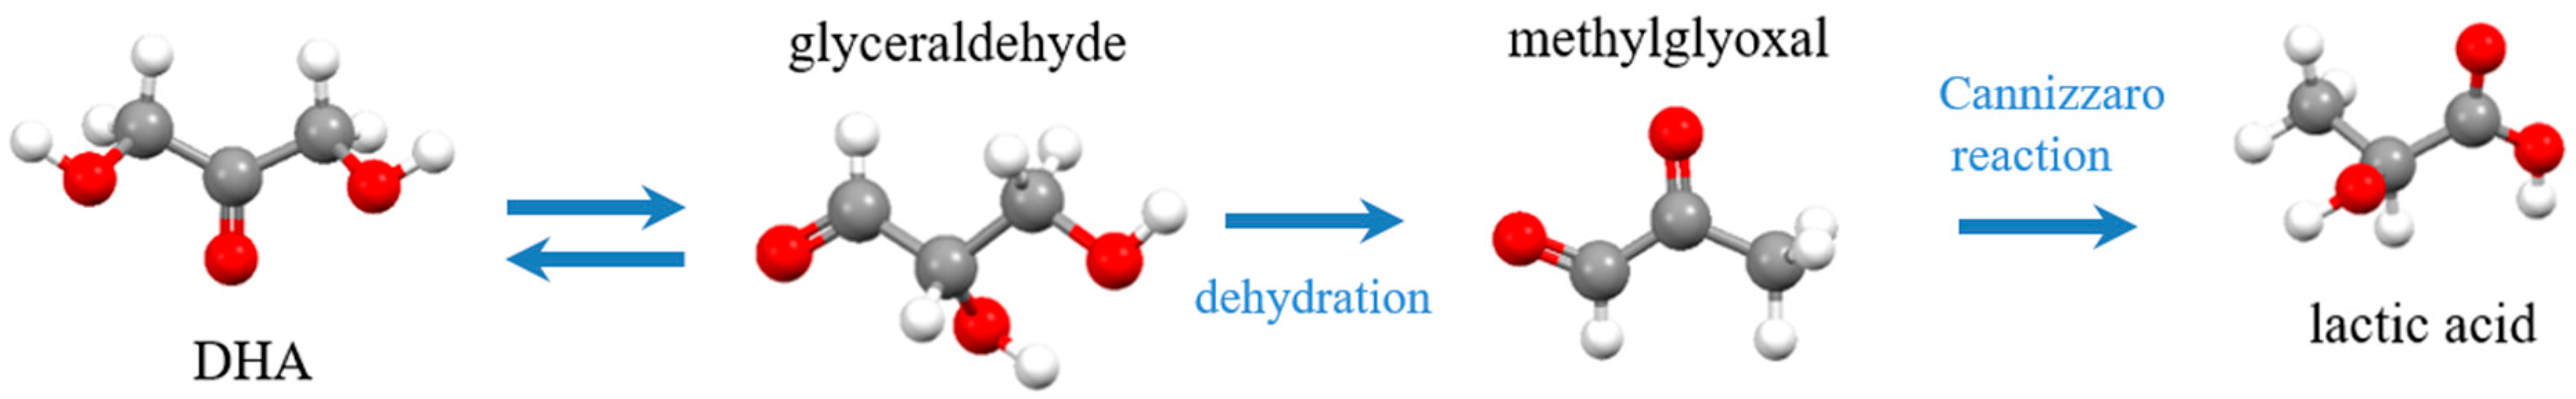
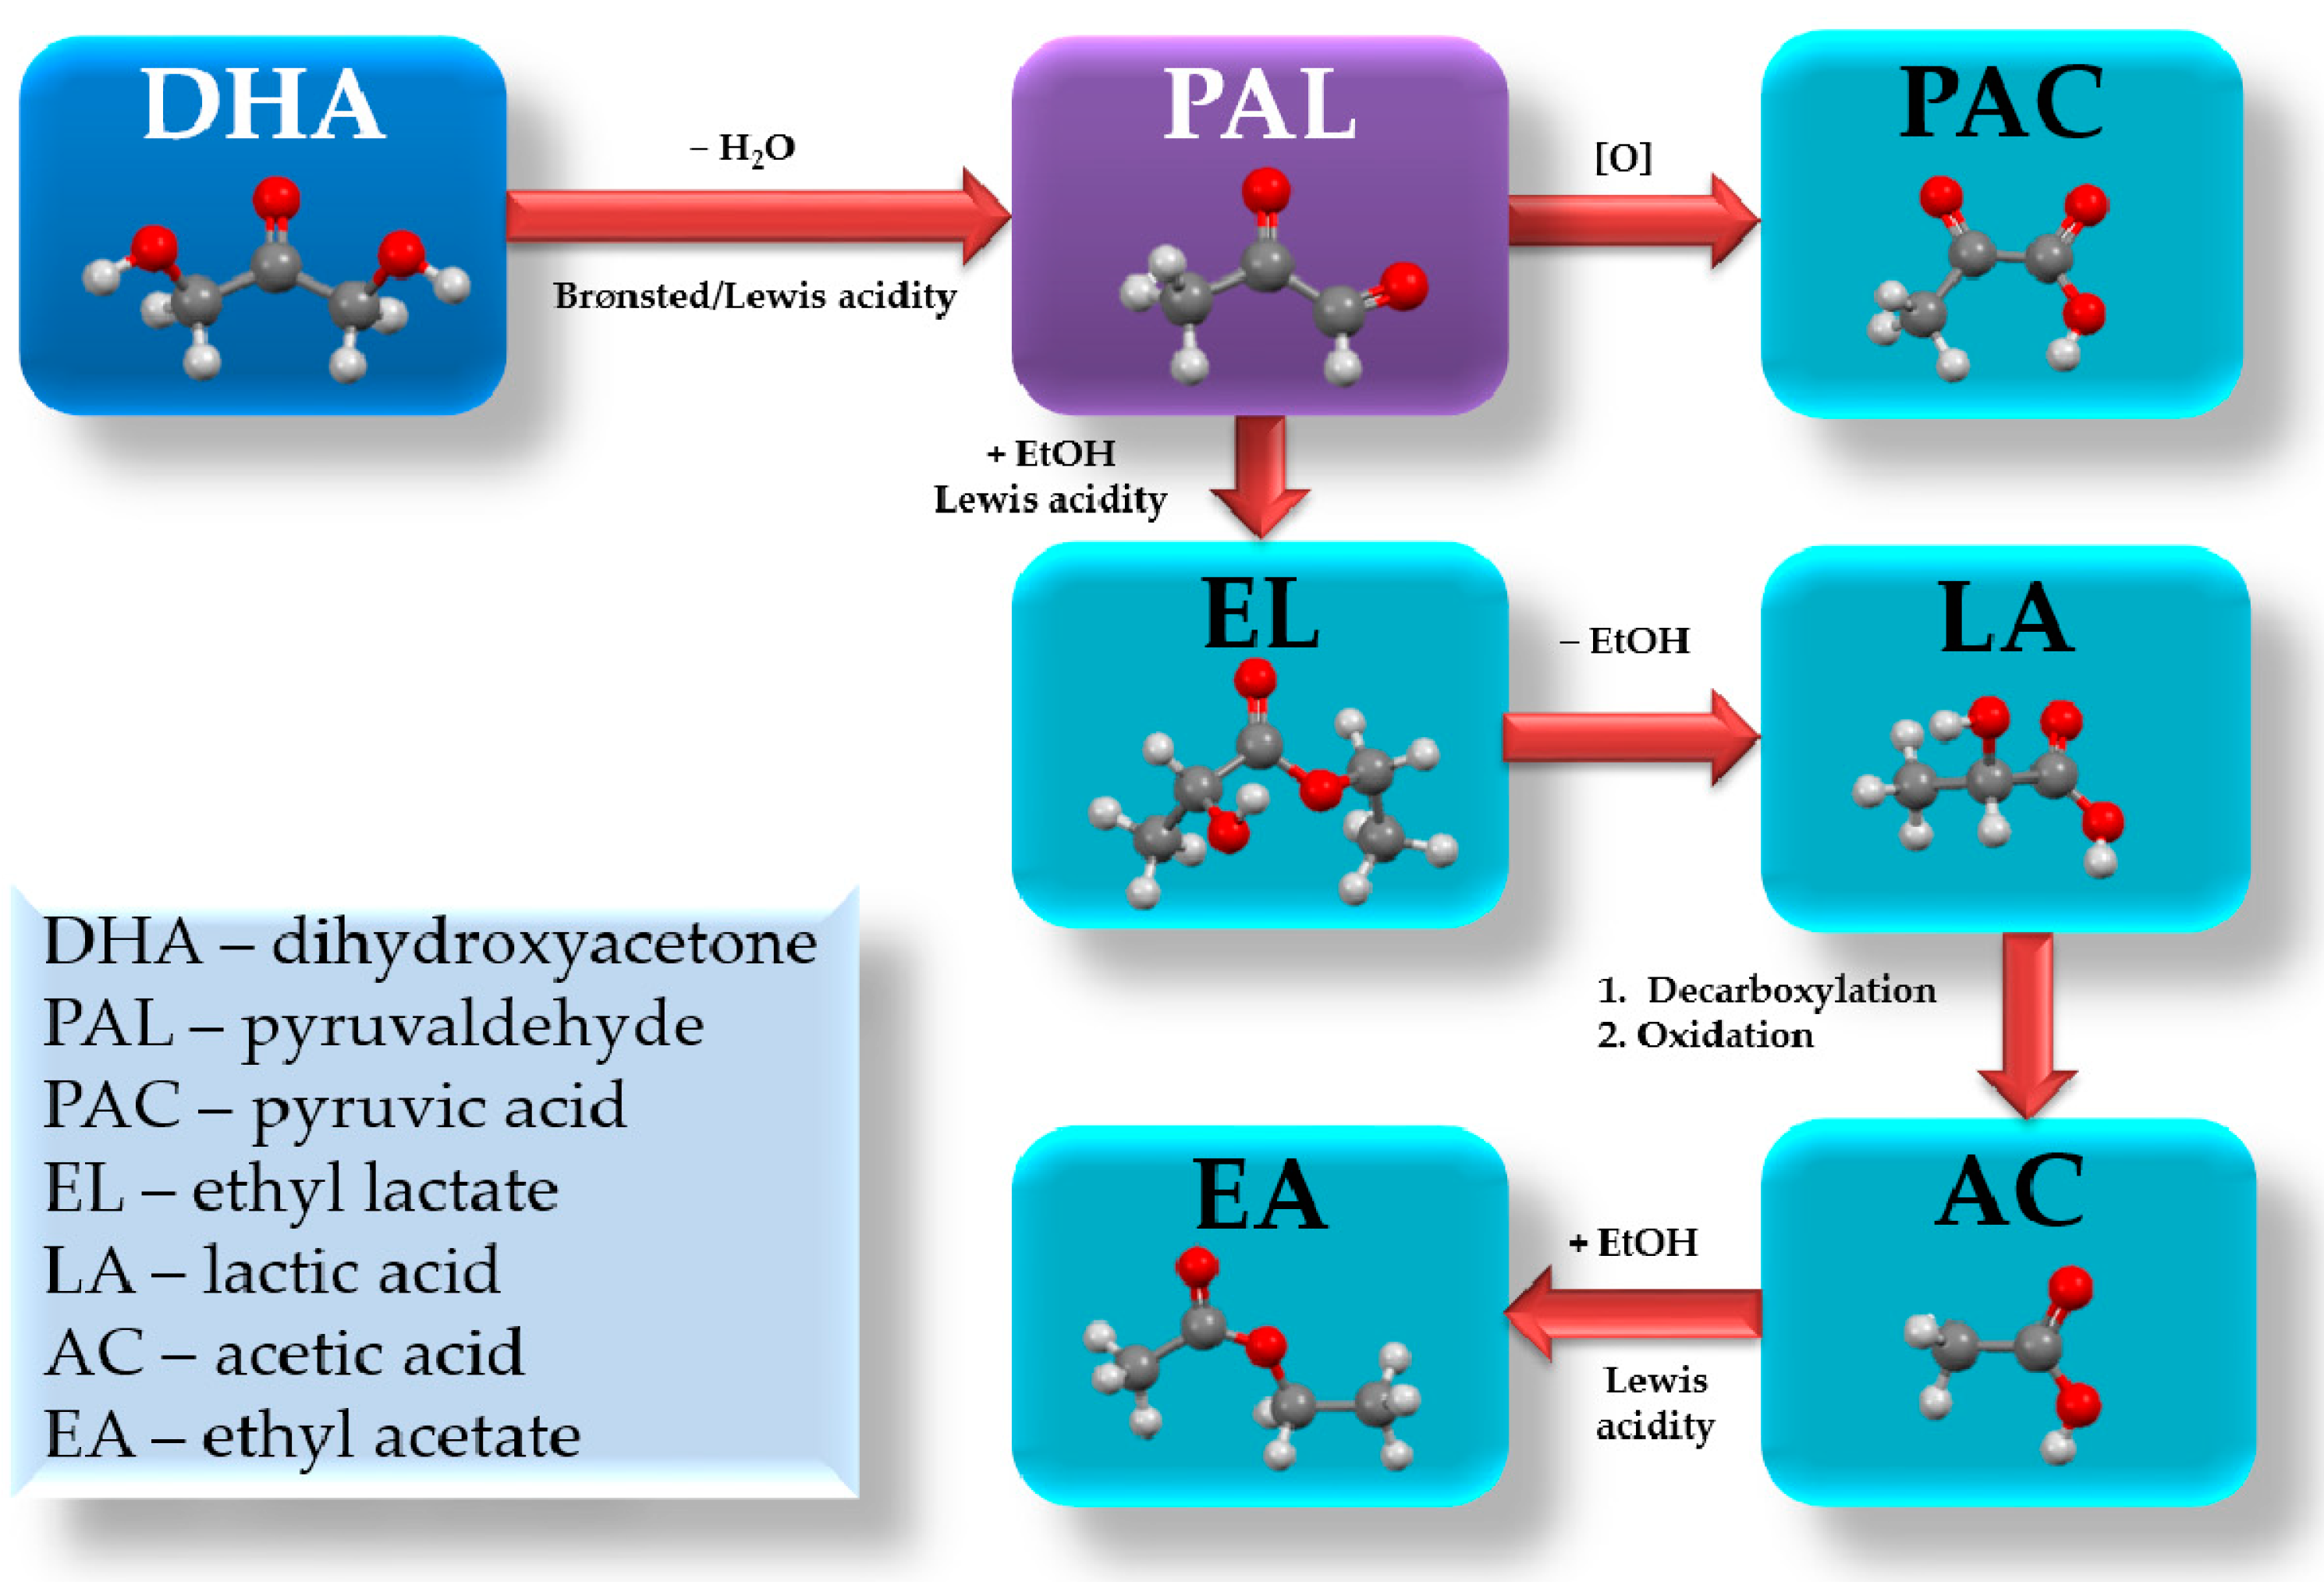
3.3. Catalytic Conversion of DHA in the Liquid Phase over Metal-Modified Seolite Catalysts

The goal of the studies was to design zeolite catalysts for the production of lactic acid from DHA (Table 3). The conversion of DHA after three hours of process varies between 93.2 and 99.8% depending on a zeolite catalyst used: in the case of clinoptilolite, the maximum conversion equals 97.7%, whereas with synthetic BEA for all of the samples, the DHA conversion is above 99%. The conversion of DHA after five hours of the process is, in all cases, almost complete. During a three-hour autoclave process a number of other important products or intermediates were obtained, such as ethyl lactate, acetic acid, ethyl acetate, pyruvic acid and lactic acid. After a prolonged, five-hour autoclave process, the number of other important products or intermediates are limited into ethyl lactate, ethyl acetate, pyruvaldehyde and lactic acid.
The selectivity to pyruvaldehyde is observed only in case of Zn-BEA zeolite. It seems that the surface development and the presence of micropores do not have a significant effect on the formation of pyruvaldehyde. More relevant is the nature and structure of the metallic centers, which are present in the form of small dimers with presence of oxygen. Taking into account the comparison of the structure of the active components, it is visible that oxidized small metal species, such as ZnO, favor the production of pyruvaldehyde.
The most selective zeolite catalysts for lactic acid are samples based on natural clinoptilolite obtained as a result of hydrothermal ion exchange—Sn-CLI (100%) and Zn-CLI (47.6%). In the case of synthetic zeolites based on BEA, the selectivity to LA is in the range of 92.9–98.7% and changes in the following order: Na-BEA (98.7%) > Sn-BEA (95.9%) > Cu-BEA (92.9%).
The catalytic conversion process of DHA leads to the production of valuable products, such as ethyl lactate, with a conversion of 83.5% (Cu-CLI), 59.9% (CLI) or 52.4% (Zn-BEA).
Comparing the structure of the active components in the case of LA production, the most important are Brønsted sites such as Na, as well as zeolites with high, well developed surfaces like BEA and Sn-CLI.
The main processes which occur in the case of both BEA and CLI catalysts are described in Figure 10. In the cases of BEA catalysts doped with metals, the dehydration of DHA into pyruvaldehyde and its further oxidation into pyruvic acid take place. However, our results after five hours of the process show that most of the pyruvaldehyde was transformed into lactate form. The other important path is a reaction of pyruvaldehyde with ethanol at the Lewis centers, which succeed with ethyl lactate formation and further lactic acid production. Lactic acid is partially transformed into acetic acid via decarbonylation/decarboxylation and oxidation reactions. The next step is the interaction of acetic acid with ethanol, with ethyl acetate formation. This path with the formation of ethyl acetate is observed especially for the Fe-CLI catalyst.
The metal-modified BEA and CLI zeolites are promising zeolite catalysts for the production of lactic acid or a lactic acid and ethyl lactate mixture from dihydroxyacetone. The most promising catalyst for the production of lactic acid is clinoptylolite modified with Sn. The Zn-CLI exhibits good performance for the production of the LA + EL mixture.

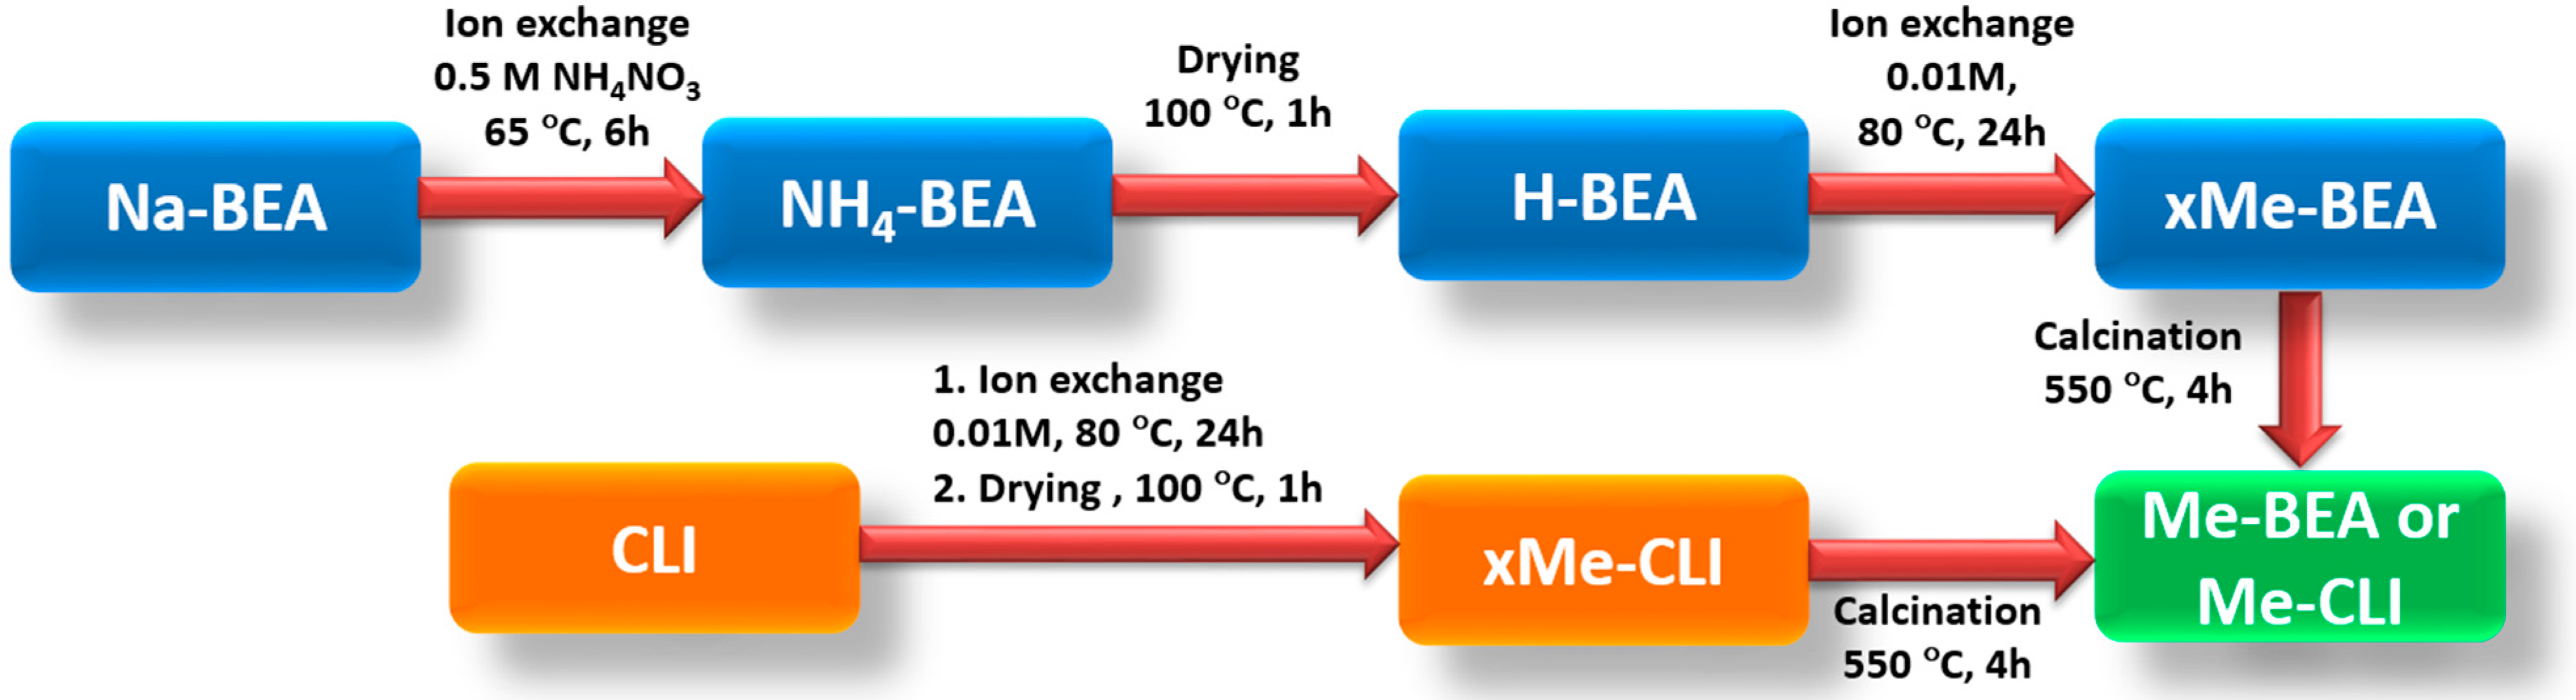
4. Materials and Methods

In this work, zeolite catalysts based on synthetic BEA (Clariant, Clariant, Muttenz, Switzerland) and natural clinoptilolite (CLI, Kucin Quarry, Slovakia, VSK PRO-ZEO s.r.o, fraction 0–2 mm) with the physicochemical properties presented in Table 4 and Table 5 were used. The SnCl4∙5H2O, Fe(NO3)3∙9H2O, Cu(NO3)2∙3H2O and Zn(NO3)2∙6H2O were purchased from Sigma Aldrich (Saint Louis, MO, USA), and were used without further purification.
The modification of zeolites with metal cations (Sn, Fe, Cu. Zn) under hydrothermal conditions was performed using the ion exchange method, as presented in a scheme in Figure 11. The ion exchange was performed in a homemade batch reactor system using a magnetic stirrer with a thermostat. The ion exchange in NH4NO3 and the drying were performed on Na-BEA zeolite to obtain H-BEA form. In total, 2.5 g of dried zeolite, H-BEA and CLI zeolite were introduced into a 250 mL polypropylene beaker, followed by topping-up with a 0.01 M solution of the appropriate metal salt (1 g zeolite per 100 cm3 solution). The process was carried out at 80 °C over 24 h. The suspension was then centrifuged, washed and dried at 100 °C for 1 h. The dried samples were then calcined for 4 h at 550 °C to remove any impurities.
The low-temperature nitrogen sorption (−196 °C) was measured on a Micromeritics ASAP 2020 analyzer (Micromeritics Instrument Corporation, Norcross, GA, USA). The specific surface area was determined using the Brunauer–Emmett–Teller method in the pressure range p/p0 = 0.05–0.15. On the other hand, the pore size was determined using the Barrett–Joyner–Halenda method on the basis of the volume of adsorbed nitrogen, p/p0 = 0.98.
The X-ray powder diffraction (XRD) for the zeolite catalysts was performed using a PANalytical X’Pert PRO MPD diffractometer (Philips Research, AE Eindhoven, The Netherlands) equipped with a CuKα radiation source, at a voltage of 40 kV and an intensity of 30 mA. The scanning was performed in a continuous mode in the range of 2θ from 5 to 90°.
The photographs of the samples were taken with the aid of a scanning electron microscope (SEM) with EDS (Energy Dispersive X-ray Spectroscopy) detector, HITACHI®TM3000 (Hitachi High-Tech, Schaumburg, IL, USA) with a beam voltage of 5.15 keV, magnification of up to 30,000 times, and a resolution of approximately 30 nm.
The Diffuse Reflectance Ultraviolet–visible Spectroscopy analysis (DR UV-VIS) was performed at room temperature in an air atmosphere. An Avantes StarLine AvaSpec-2048 spectrometer (Avantes, 7333 NS Apeldoorn, The Netherlands) equipped with a suction cup to record the spectrum for powder materials was used. BaSO4 was used as the reference.
The analysis of the zeolite catalysts by the Attenuated Total Reflectance-Fourier Transform Infrared Spectroscopy (ATR FTIR) method was performed on a Thermo Scientific Nicolet iS5 FTIR spectrometer (Thermo Fisher Scientific, Waltham, MA, USA) equipped with the iD7 ATR accessory. The spectra were recorded in the range 4000–400 cm−1.
The above methods were used to check the metal distribution and chemical state in the investigated zeolites.
The reaction of the dihydroxyacetone was carried out in a liquid phase using a one-pot reactor. The catalytic tests were carried out in an autoclave with a Teflon filling. In total, 0.3 g catalyst and 20 mL 0.125 M solution of DHA in ethyl alcohol were introduced. The reaction was carried out at 120 °C for 3 and 5 h. The resulting products were recovered by the centrifugation of the suspension and analyzed using an Agilent 6890 N gas chromatograph (GC, Agilent, Santa Clara, CA, USA) with a BP21 FFAP capillary column (60 m, diameter 0.25 mm) and a flame ionization detector (FID, Agilent, Santa Clara, CA, USA).

5. Conclusions

In summary, the one-step production of lactic acid (LA) and ethyl lactate (EL) from biomass-derived dihydroxyacetone (DHA) was investigated. Both types of zeolite, clinoptilolite and BEA, modified with metals (Cu, Fe, Zn and Sn), are interesting materials for the DHA conversion. The unmodified BEA zeolite and the Sn-modified CLI and BEA zeolites are the most promising zeolite catalysts for the production of LA from DHA. In the case of ethyl lactate, pure CLI and those modified with Cu and Zn are the most efficient.
The Zn-BEA catalyst is favorable for dihydroxyacetone’s transformation to pyruvaldehyde, with a selectivity slightly below 60%.
The essential in of the transformation of DHA into lactic acid is the time of the process. In the case of too short a time, the conversion of DHA is incomplete and the mixture of products is not acceptable for an industrial scale. However, the prolongation of the processing time succeeded in the improvement of the pure lactic acid production.

Author Contributions

Both authors declare equal contribution to the manuscript. Conceptualization, I.C.; formulation of the scientific problem and development of experimental part, I.C.; experimental tests, N.S.; zeolite synthesis and modifications, N.S.; zeolite characterization, I.C., and N.S.; All authors have read and agreed to the published version of the manuscript.

Funding

This article is the effect of the realization of the project “Nano-design of zeolite-based catalysts for selective conversion of biomass into chemicals” sponsored by the National Science Centre, Poland, under Polonez-1 grant no. 2015/19/P/ST4/02482. This project received funding from the European Union’s Horizon 2020 research and innovation programme under the Marie Skłodowska-Curie grant agreement No. 665778.

Data Availability Statement

Data is contained within the web-page of project: http://zeodesign-polonez.pk.edu.pl.

Acknowledgments

We are thankful to M. Piotrowski for technical help with chromatograph. We are grateful to the Clariant and VSK PRO-ZEO companies for supporting us with the zeolite samples.

Conflicts of Interest

The authors declare no conflict of interest.

References

  1. Pacala, S.; Socolow, R. Stabilization Wedges: Solving the Climate Problem for the Next 50 Years with Current Technologies. Science 2004, 305, 968–972. [Google Scholar] [CrossRef] [Green Version]
  2. Werpy, T.; Petersen, G.; Aden, A.; Bozell, J.; Holladay, J.; White, J.; Manheim, A. Report No. NREL/TP510–35523. Top Value Added Chemicals from Biomass:Results of Screening for Potential Candidates from Sugars and Synthesis Gas; National Renewable Energy Laboratory: Golden, CO, USA, 2004; Volume 1, pp. 1–77. [Google Scholar]
  3. Huber, W.; Iborra, S.; Corma, A. Synthesis of Transportation Fuels from Biomass:  Chemistry, Catalysts, and Engineering. Chem. Rev. 2006, 106, 4044–4098. [Google Scholar] [CrossRef] [Green Version]
  4. Langan, P.; Gnanakaran, S.; Rector, K.D.; Pawley, N.; Fox, D.T.; Cho, D.W.; Hammel, K.E. Exploring new strategies for cellulosic biofuels production. Energy Environ. Sci. 2011, 4, 3820–3833. [Google Scholar] [CrossRef]
  5. da Costa Sousa, L.; Chundawat, S.P.S.; Balan, V.; Dale, B.E. Cradle-to-grave’ assessment of existing lignocellulose pretreatment technologies. Curr. Opin. Biotechnol. 2009, 20, 339–347. [Google Scholar] [CrossRef]
  6. Himmel, M.E.; Ding, S.Y.; Johnson, D.K.; Adney, W.S.; Nimlos, M.R.; Brady, J.W.; Foust, T.D. Biomass Recalcitrance: Engineering Plants and Enzymes for Biofuels Production. Science 2007, 315, 804–807. [Google Scholar] [CrossRef] [Green Version]
  7. Wang, A.; Zhang, T. One-pot conversion of cellulose to ethylene glycol with multifunctional tungsten-based catalysts. Acc. Chem. Res. 2013, 46, 1377–1386. [Google Scholar] [CrossRef]
  8. Czekaj, I.; Sobuś, N. Nano-Design of Zeolite-Based Catalysts for Selective Conversion of Biomass into Chemicals; Wydawnictwo PK: Kraków, Poland, 2018; ISBN 978-83-7242-785-4. [Google Scholar]
  9. Rutkowska, M.; Piwowarska, Z.; Micek, E.; Chmielarz, L. Hierarchical Fe-, Cu- and Co-Beta zeolites obtained by mesotemplate-free method. Part I: Synthesis and catalytic activity in N2O decomposition. Microporous Mesoporous Mater. 2015, 209, 54–65. [Google Scholar] [CrossRef]
  10. Zhang, C.; Wang, T.; Ding, Y. One-step synthesis of pyruvic acid from glycerol oxidation over Pb promoted Pt/activated carbon catalysts. Chin. J. Catal. 2017, 38, 928–937. [Google Scholar] [CrossRef]
  11. Dusselier, M.; van Wouwe, P.; Dewaele, A.; Makshina, E.; Sels, B.F. Lactic acid as a platform chemical in the biobased economy: The role of chemocatalysis. Energy Environ. Sci. 2013, 6, 1415–1442. [Google Scholar] [CrossRef]
  12. Corma, A.; Iborra, S.; Velty, A. Chemical Routes for the Transformation of Biomass into Chemicals. Chem. Rev. 2007, 107, 2411–2502. [Google Scholar] [CrossRef]
  13. Xu, P.; Qiu, J.H.; Gao, C.; Ma, C.Q. Biotechnological routes to pyruvate production. J. Biosci. Bioeng. 2008, 105, 169–175. [Google Scholar] [CrossRef]
  14. Yasukawa, T.; Ninomiya, W.; Ooyachi, K.; Aoki, N.; Mae, K. Efficient Oxidative Dehydrogenation of Lactate to Pyruvate Using a Gas−Liquid Micro Flow System. Ind. Eng. Chem. Res. 2011, 50, 3858–3863. [Google Scholar] [CrossRef]
  15. Dapsens, P.Y.; Kusema, B.T.; Mondelli, C.; Pérez-Ramírez, J. Gallium-modified zeolites for the selective conversion of bio-based dihydroxyacetone into C1–C4 alkyl lactates. J. Molec. Catal. A Chem. 2014, 388–389, 141–147. [Google Scholar] [CrossRef] [Green Version]
  16. Dapsens, P.Y.; Menart, M.J.; Mondelli, C.; Pérez-Ramírez, J. Production of bio-derived ethyl lactate on GaUSY zeolites prepared by post-synthetic galliation. Green Chem. 2014, 16, 589–593. [Google Scholar] [CrossRef] [Green Version]
  17. Taarning, E.; Saravanamurugan, S.; Spangsberg Holm, M.; Xiong, J.; West, R.M.; Christensen, C.H. Zeolite-Catalyzed Isomerization of Triose Sugars. ChemSusChem. 2009, 2, 625–627. [Google Scholar] [CrossRef]
  18. Fjermestad, T.; Svelle, S.; Swang, O. Mechanistic Comparison of the Dealumination in SSZ-13 and the Desilication in SAPO-34. J. Phys. Chem. C 2013, 117, 13442–13451. [Google Scholar] [CrossRef]
  19. Malola, S.; Svelle, S.; Bleken, F.L.; Swang, O. Detailed Reaction Paths for Zeolite Dealumination and Desilication from Density Functional Calculations. Angew. Chem. Int. Ed. 2012, 51, 652–655. [Google Scholar] [CrossRef]
  20. Pinxt, H.H.C.M.; Kuster, B.F.M.; Marin, G.B. Promoter effects in the Pt-catalysed oxidation of propylene glycol. Appl. Catal. A. 2000, 191, 45–54. [Google Scholar] [CrossRef]
  21. Tsujino, T.; Ohigashi, S.; Sugiyama, S.; Kawashiro, K.; Hayashi, H. Oxidation of propylene glycol and lactic acid to pyruvic acid in aqueous phase catalyzed by lead-modified palladium-on-carbon and related systems. J. Mol. Catal. 1992, 71, 25–35. [Google Scholar] [CrossRef]
  22. Zhang, C.; Wang, T.; Ding, Y.J. Oxidative dehydrogenation of lactic acid to pyruvic acid over Pb-Pt bimetallic supported on carbon materials. Appl. Catal. A 2017, 533, 59–65. [Google Scholar] [CrossRef]
  23. Finogenova, T.V.; Morgunov, I.G.; Kamzolova, S.V.; Chernyavskaya, O.G. Organic Acid Production by the Yeast Yarrowia lipolytica: A Review of Prospects. Appl. Biochem. Microbiol. 2005, 41, 418–425. [Google Scholar] [CrossRef]
  24. Sugiyama, S.; Kikumoto, T.; Tanaka, H.; Nakagawa, K.; Sotowa, K.I.; Maehara, K.; Himeno, Y.; Ninomiya, W. Enhancement of Catalytic Activity on Pd/C and Te–Pd/C During the Oxidative Dehydrogenation of Sodium Lactate to Pyruvate in an Aqueous Phase Under Pressurized Oxygen. Catal. Lett. 2009, 131, 129–134. [Google Scholar] [CrossRef]
  25. Ai, M. Catalytic activity of iron phosphate doped with a small amount of molybdenum in the oxidative dehydrogenation of lactic acid to pyruvic acid. Appl. Catal. A 2002, 234, 235–243. [Google Scholar] [CrossRef]
  26. Sharninghausen, L.S.; Campos, J.; Manas, M.G.; Crabtree, R.H. Efficient selective and atom economic catalytic conversion of glycerol to lactic acid. Nat.Commun. 2014, 5, 5084. [Google Scholar] [CrossRef]
  27. Shen, Y.H.; Zhang, S.H.; Li, H.J.; Ren, Y.; Liu, H.C. Efficient Synthesis of Lactic Acid by Aerobic Oxidation of Glycerol on Au–Pt/TiO2 Catalysts. Chem. Eur. J. 2010, 16, 7368–7371. [Google Scholar] [CrossRef] [PubMed]
  28. Purushothaman, R.K.P.; van Haveren, J.; van Es, D.S.; Melián Cabrera, I.; Meeldijk, J.D.; Heeres, H.J. An efficient one pot conversion of glycerol to lactic acid using bimetallic gold-platinum catalysts on a nanocrystalline CeO2 support. Appl. Catal. B 2014, 147, 92–100. [Google Scholar] [CrossRef] [Green Version]
  29. Roy, D.; Subramaniam, B.; Chaudhari, R.V. Cu-Based Catalysts Show Low Temperature Activity for Glycerol Conversion to Lactic Acid. ACS Catal. 2011, 1, 548–551. [Google Scholar] [CrossRef]
  30. Hayashi, H.; Sugiyama, S.; Katayama, Y.; Kawashiro, K.; Shigemoto, N. An alloy phase of Pd3Pb and the activity of Pb/Pd/C catalysts in the liquid-phase oxidation of sodium lactate to pyruvate. J. Mol. Catal. 1994, 91, 129–137. [Google Scholar] [CrossRef]
  31. Chang, C.C.; Cho, H.J.; Wang, Z.; Wang, X.; Fan, W. Fluoride-free synthesis of a Sn-BEA catalyst by dry gel conversion. Green Chem. 2015, 17, 2943–2951. [Google Scholar] [CrossRef]
  32. Cho, H.J.; Gould, N.S.; Vattipalli, V.; Sabnis, S.; Chaikittisilp, W.; Okubo, T.; Xu, B.; Fan, W. Fabrication of hierarchical Lewis acid Sn-BEA with tunable hydrophobicity for cellulosic sugar isomerization. Microporous Mesoporous Mater. 2019, 278, 387–396. [Google Scholar] [CrossRef]
  33. Shwan, S.; Jansson, J.; Olsson, L.; Skoglundh, M. Chemical deactivation of Fe-BEA as NH3-SCR catalyst—Effect of phosphorous. Appl. Catal. B Environ. 2014, 147, 111–123. [Google Scholar] [CrossRef]
  34. Davari, N.; Farhadian, M.; Nazar, A.R.S.; Homayoonfal, M. Degradation of diphenhydramine by the photocatalysts of ZnO/Fe2O3 and TiO2/Fe2O3 based on clinoptilolite: Structural and operational comparison. J. Environ. Chem. Eng. 2017, 5, 5707–5720. [Google Scholar] [CrossRef]
  35. Wilken, N.; Nedyalkova, R.; Kamasamudram, K.; Li, J.; Currier, N.W.; Vedaiyan, R.; Yezerets, A.; Olsson, L. Investigation of the Effect of Accelerated Hydrothermal Aging on the Cu Sites in a Cu-BEA Catalyst for NH3-SCR Applications. Top Catal. 2013, 56, 317–322. [Google Scholar] [CrossRef]
  36. Maćkiewicz, E.; Szynkowska, M.I. Oxidation of odorous nitrogen-containing compounds: Ammonia and trimethylamine over Cu/zeolite catalysts. Reac. Kinet Mech. Cat 2014, 111, 763–773. [Google Scholar] [CrossRef]
  37. Yosefi, L.; Haghighi, M.; Allahyari, S.; Ashkriz, S. The beneficial use of HCl-activated natural zeolite in ultrasound assisted synthesis of Cu/clinoptilolite–CeO2 nanocatalyst used for catalytic oxidation of diluted toluene in air at low temperature. J. Chem. Technol. Biotechnol. 2014, 90, 765–774. [Google Scholar] [CrossRef]
  38. Meneau, F.; Sankar, G.; Morgante, N.; Cristol, S.; Catlow, C.R.A.; Thomas, J.M.; Greaves, G.N. Characterization of zinc oxide nanoparticles encapsulated into zeolite-Y: An in-situ combined X-ray diffraction, XAFS, and SAXS study. Nucl. Instrum. Methods Phys. Res. Sect. B Beam Interact. Mater. At. 2003, 199, 499–503. [Google Scholar] [CrossRef]
  39. Colyer, L.M.; Greaves, G.N.; Carr, S.W.; Fox, K.K. Collapse and Recrystallization Processes in Zinc-Exchanged Zeolite-A:  A Combined X-ray Diffraction, XAFS, and NMR Study. J. Phys. Chem. B 1997, 101, 10105–10114. [Google Scholar] [CrossRef]
  40. Popovych, N.O.; Kyriienko, P.I.; Millot, Y.; Valentin, L.; Gurgul, J.; Socha, R.P.; Żukrowski, J.; Soloviev, S.O.; Dzwigaj, S. Sn-BEA zeolites prepared by two-step postsynthesis method: Physicochemical properties and catalytic activity in processes based on MPV reduction. Microporous Mesoporous Mater. 2018, 268, 178–188. [Google Scholar] [CrossRef]
  41. Boroń, P.; Chmielarz, L.; Gurgul, J.; Łątka, K.; Gil, B.; Krafft, J.M.; Dzwigaj, S. The influence of the preparation procedures on the catalytic activity of Fe-BEA zeolites in SCR of NO with ammonia and N2O decomposition. Catal. Today 2014, 235, 210–225. [Google Scholar] [CrossRef]
  42. Urquieta-González, E.A.; Martins, L.; Peguin, R.P.S.; Batista, M.S. Identification of Extra-Framework Species on Fe/ZSM-5 and Cu/ZSM-5 Catalysts Typical Microporous Molecular Sieves with Zeolitic Structure. Mater. Res. 2002, 5, 321–327. [Google Scholar] [CrossRef]
  43. Aboul-Gheit, A.K.; Ahmed, S.M.; Hanafy, S.A. Exchanged zeolites with transition metals of the first period as photocatalyts for n-hexadecane degradation. J. Mol. Catal. A-Chem. 2008, 288, 52–57. [Google Scholar] [CrossRef]
  44. Courtney, T.D.; Chang, C.C.; Gorte, R.J.; Lobo, R.F.; Fan, W.; Nikolakis, V. Effect of water treatment on Sn-BEA zeolite: Origin of 960 cm−1 FTIR peak. Microporous Mesoporous Mater. 2015, 210, 69–76. [Google Scholar] [CrossRef] [Green Version]
  45. Pieterse, J.A.Z.; Pirngruber, G.D.; van Bokhoven, J.A.; Booneveld, S. Hydrothermal stability of Fe-ZSM-5 and Fe-BEA prepared by wet ion-exchange for N2O decomposition. Appl. Catal. B Environ. 2007, 71, 16–22. [Google Scholar] [CrossRef]
  46. Vimont, A.; Thibault-Starzyk, F.; Lavalley, J.C. Infrared Spectroscopic Study of the Acidobasic Properties of Beta Zeolite. J. Phys. Chem. B 2000, 104, 286–291. [Google Scholar] [CrossRef]
  47. Isernia, L.F. FTIR study of the relation, between extra-framework aluminum species and the adsorbed molecular water, and its effect on the acidity in ZSM-5 steamed zeolite. Mater. Res. 2013, 4, 792–802. [Google Scholar] [CrossRef] [Green Version]
  48. Mauvezin, M.; Delahay, G.; Coq, B.; Kieger, S.; Jumas, J.C.; Olivier-Fourcade, J. Identification of Iron Species in Fe−BEA:  Influence of the Exchange Level. J. Phys. Chem. B 2001, 105, 928–935. [Google Scholar] [CrossRef]
  49. Nosuhi, M.; Nezamzadeh-Ejhieh, A. High catalytic activity of Fe(II)-clinoptilolite nanoparticales for indirect voltammetric determination of dichromate: Experimental design by response surface methodology (RSM). Electrochim. Acta 2017, 223, 47–62. [Google Scholar] [CrossRef]
  50. Amiri, M.; Nezamzadeh-Ejhieh, A. Improvement of the photocatalytic activity of cupric oxide by deposition onto a natural clinoptilolite substrate. Mater. Sci. Semicond. Process. 2015, 31, 501–508. [Google Scholar] [CrossRef]
  51. Doula, M.K.; Ioannou, A. The effect of electrolyte anion on Cu adsorption–desorption by clinoptilolite. Microporous Mesoporous Mater. 2003, 58, 115–130. [Google Scholar] [CrossRef]
  52. Nezamzadeh-Ejhieh, A.; Khodabakhshi-Chermahini, F. Incorporated ZnO onto nano clinoptilolite particles as the active centers in the photodegradation of phenylhydrazine. J. Ind. Eng. Chem. 2014, 20, 695–704. [Google Scholar] [CrossRef]
Figure 1. Scheme of the reaction pathways of biomass into DHA, glycerol, and pyruvaldehyde and its further derivatives.
Catalysts 11 01006 g001
Figure 2. Scheme of reaction pathways of DHA and glyceraldehyde into methylglyoxal and lactic acid.
Catalysts 11 01006 g002
Figure 3. Diffractograms of control samples: (a) BEA, (b) CLI, and modified from metals (Sn, Fe, Cu, Zn).
Catalysts 11 01006 g003
Figure 4. Nitrogen adsorption and desorption isotherms for synthetic BEA zeolites.
Catalysts 11 01006 g004
Figure 5. Nitrogen adsorption and desorption isotherms for natural clinoptilolite zeolites.
Catalysts 11 01006 g005
Figure 6. SEM and EDS for BEA zeolites with the metals (a) Na, (b) Sn, (c) Fe, (d) Cu and (e) Zn.
Catalysts 11 01006 g006
Figure 7. SEM and EDS for CLI zeolites with the metals (a) -, (b) Sn, (c) Fe, (d) Cu, (e) Zn.
Catalysts 11 01006 g007
Figure 8. DR UV-VIS spectra for BEA (left column) and CLI (right column): (a) Sn, (b) Fe, (c) Cu and (d) Zn.
Catalysts 11 01006 g008
Figure 9. ATR FTIR spectra for BEA (left column) and CLI (right column): (a) Sn, (b) Fe, (c) Cu and (d) Zn.
Catalysts 11 01006 g009
Figure 10. Scheme of the reaction pathways of DHA observed experimentally.
Catalysts 11 01006 g010
Figure 11. Scheme for obtaining zeolite catalysts based on BEA and CLI; Me (metals: Sn, Fe, Cu, Zn), and xMe (salt solution concentration—0.01 M).
Catalysts 11 01006 g011
Table 1. Specific surface area and pore size of the zeolite catalysts. Vp total is the total pore volume; Vp micro is the micropore volume determined using the Saito-Foley (SF) model and calculated using the t-plot method.
SampleSBET [m2/g]Vp total [cm3/g]Vp micro [cm3/g]
H-BEA5150.510.16
Na-BEA4470.600.14
Sn-BEA3410.540.01
Fe-BEA4510.580.14
Cu-BEA4220.540.14
Zn-BEA5250.540.17
CLI290.060.006
Sn-CLI1650.150.025
Fe-CLI580.110.007
Cu-CLI440.080.01
Zn-CLI330.080.01
Table 2. Properties of the samples and the metal states deduced.
CatalystXRDM State UV-VISM State ATR-FTIRM State
Sn-CLI2θ = 26.7°SnO2270 nmOctahedral tin species
Fe-CLI2θ = 33–35°Fe2O3300 nm;
500 nm
Isolated form of Fe3+;
FeOx Oligomers or Fe2O3 nanoparticles
790–947 cm−1Si-O-T skeleton (T = Si, Al, Fe)
Cu-CLI2θ = 35–36°;
2θ = 39–41°;
2θ = 49–50°
Cu+;
Cu2+;
CuO
275 nmCu2+422, 497 and 600 cm−1CuO
Zn-CLI 250–280 nmIsolated ZnO475–798 cm−1ZnO
Sn-BEA2θ = 26.7° and
2θ = 34°
SnO2225 nmSn(IV) tetrahedron947–948 cm−1Form of Sn4+
Fe-BEA2θ = 33.2° or 35.5°
2θ = 37°
Fe2O3
FeO
300 nm;
500 nm
Isolated form of Fe3+;
FeOx Oligomers or Fe2O3 nanoparticles
790–947 cm−1Si-O-T skeleton (T = Si, Al, Fe)
Cu-BEA2θ = 36°, 50°CuO275 nmCu2+948–950 cm−1;
422, 497 and 600 cm−1
Si-O-T skeleton (T = Si, Al, Cu);
CuO
Zn-BEA2θ = 36–38ZnO250–280 nmIsolated ZnO1550 cm−1 and 1726 cm−1;
475–798 cm−1
ZnO;
Table 3. The results of the GC analysis and carbon balance for the catalytic conversion of DHA in the liquid phase: (a) after three hours of the process, and (b) after five hours of process. LA—lactic acid, EL—ethyl lactate, EA—ethyl acetate, AC—acetic acid, PAC—pyruvic aldehyde, PAL—pyruvaldehyde. The others are mixtures of LA, EL and unreacted DHA.
CatalystDHA Conversion [%]Process Time [h]Selectivity [%]LA + EL Yield [%]PAC Yield [%]
LAELEAACPACOthers
CLI93.2317.05.65.84.9-66.721.1-
Sn-CLI97.736.620.718.51.52.150.726.72.1
Fe-CLI97.3313.84.430.82.110.738.217.710.4
Cu-CLI95.0317.17.95.05.13.960.923.83.7
Zn-CLI97.039.916.23.72.539.528.225.338.3
Na-BEA99.830.249.64.2-37.78.349.737.6
Sn-BEA99.731.427.30.7-60.610.128.660.4
Fe-BEA99.237.615.111.60.633.531.622.533.2
Cu-BEA99.131.536.72.8-34.124.937.933.8
Zn-BEA99.431.332.62.50.339.124.133.738.9
CatalystDHA Conversion [%]Time [h]Selectivity [%]LA Yield [%]EL Yield [%]Carbon Balance [%]
LAELEAPAL
CLI100540.159.9--40.159.999.0
Sn-CLI1005100---100-97.1
Fe-CLI1005--100---95.0
Cu-CLI1005-83.516.5--83.597.9
Zn-CLI100547.652.4--47.652.495.5
Na-BEA100598.7-1.3-98.7-93.5
Sn-BEA100595.9-4.1-95.9-95.2
Fe-BEA99.9530.27.653.0-27.56.995.2
Cu-BEA100592.9-7.1-92.9-95.3
Zn-BEA100551.9-0.647.551.9-95.3
Table 4. Physicochemical properties of the commercial zeolite BEA (Clariant).
ParametersUnit
Crystal structureIUPACBEA
BET aream2/g544
Nappm40
Cppm30
Silicon module-24,7
Table 5. Physicochemical properties of the commercial zeolite CLI (Kucin Quarry).
ParametersUnit
Crystal structureIUPACCLI
BET aream2/g25
Al[%]5–14
Si[%]23–32
K[%]2–14
Ca[%]1–2.5
Fe[%]0.01–1.5
O[%]40–50
Publisher’s Note: MDPI stays neutral with regard to jurisdictional claims in published maps and institutional affiliations.

