Article

Dehydration of 2,3-Butanediol to 1,3-Butadiene and Methyl Ethyl Ketone: Modeling, Numerical Analysis and Validation Using Pilot-Scale Reactor Data

1
School of Chemical Engineering, Chonnam National University, 77 Yongbong-ro, Buk-gu, Gwangju 61186, Korea
2
Department of Environment and Energy Engineering, Chonnam National University, 77 Yongbong-ro, Buk-gu, Gwangju 61186, Korea
*
Authors to whom correspondence should be addressed.
Submission received: 28 July 2021 / Revised: 16 August 2021 / Accepted: 16 August 2021 / Published: 19 August 2021
(This article belongs to the Special Issue Modern Catalytic Reactor: From Active Center to Application Tests)

Abstract

:
This work presents the numerical analysis and validation of a fixed bed reactor model for 2,3-butanediol (2,3-BDO) dehydration. The 1D heterogeneous reactor model considering interfacial and intra-particle gradients, was simulated and numerical analysis of the model was conducted to understand the characteristics of the reactions in a catalyst along the reactor length. The model was also validated by comparing predicted performance data with pilot-scale plant data operated at 0.2 bar, 299–343 °C and 0.48–2.02 h−1 of weight hourly space velocity (WHSV). The model showed good agreement with the temperature profile, 2,3-BDO conversion and selectivity of target products. In addition, sensitivity analyses of the model were investigated by changing feed flow rate, feed composition, and inlet temperature. It was found that stable and efficient operation conditions are lower than 0.65 h−1 of WHSV and 330–340 °C of inlet temperature. Additionally, the reactor performance was not affected by 2,3-BDO feed concentration above 70%.

1. Introduction

The finite source of fossil fuel has inspired aggressive research efforts on alternative energy sources such as renewable biomass [1]. The U.S. Department of Energy reported 12 bio-based intermediate chemicals from the lignocellulosic biomass as potential replacements for the petroleum energy production route [2]. Among them, 2,3-Butanediol (2,3-BDO), a chemical that is produced by fermentation of xylose or glucose, is one of the most potential chemicals [3]. The valorization of 2,3-BDO is widely applied as a fuel additive, and in the food and pharmaceutical industries [4]. 2,3-BDO is best utilized in its dehydrated form: 1,3-butadiene (1,3-BD) and methyl ethyl ketone (MEK). For instance, 1,3–BD is a significant feedstock in the production of several chemicals and materials, especially rubber [5,6,7], and MEK has a wide range of potential applications, including as a catalyst in the hardening of polyester resins and as a general-purpose solvent in the paint industry [8,9,10]. The two have seen an increased demand, and consequently dehydration of 2,3-BDO is becoming an attractive research area [11].
Dehydration of 2,3-BDO to 1,3-BD and MEK mainly involves three aspects: catalyst development, kinetic model, and reactor design. The reaction was first conducted in 1945 by Winfield et al. with Thorium oxide as the catalyst [12]. The maximum yield of 1,3-BD is 60% obtained at 350 °C. Zhang et al. [13] have reported that the yield of MEK could be approached 62.1% using HZSM-5 catalyst and 97.2% by adding 1% wt of boric acid. The excellent catalyst performance was due to the strong acidic site. Other strong acidics, in particular, H4[SiMol2O40], H3[PMol2O40], H4[SiW12O40] and H3[PW12O40] were investigated by Torok et al. [14]. The best selectivity of MEK was confirmed with PW12 catalyst in heterogeneous condition (81–86%). Tsukamoto et al. found that the SiO2-supported CsH2PO4 catalyst achieved 90% of 1,3-BD selectivity [15]. Duan et al. investigated the experiment over Sc2O3 and showed 94% selectivity of 1,3-BD [16]. Kim et al. analyzed the 2,3-BDO dehydration performance with silica-supported alkali phosphate catalyst based on the production of both 1,3-BD and MEK [17]. Compared with other catalysts, the a-CP catalyst showed the highest total MEK and 1,3-BD selectivity [18,19]. Most of the research mentioned above focused on the increase of 1,3-BD and MEK yield. On the other hand, Song et al. developed both a kinetic model and deactivation model for 2,3-BDO dehydration on a-CP catalyst [18,19]. The models were validated with a lab-scale fixed bed reactor. In an effort to commercialize the technology, a pilot-scale reactor model was proposed [20]. However, the model validation lacked experimental data and model numerical analysis. In addition, the model did not show sensitivity analysis data of major operating variables and report the optimal condition for the reactor.
In this work, numerical analysis of the reactor model was conducted to understand the characteristics of the reactions over the CP catalyst and along the reactor length. The model was validated with adiabatic fixed-bed reactor experiments in a variety of performance parameters such as temperature profile, 2,3-BDO conversion rate, and selectivity of the main products at the outlet of the reactor. In addition, the sensitivity analysis of the feed flow rate was done, and the temperature of the reaction, and feed composition were investigated to determine the optimal reaction conditions. The findings of this study are expected to provide valuable insights in the development of commercial-scale reactor design.

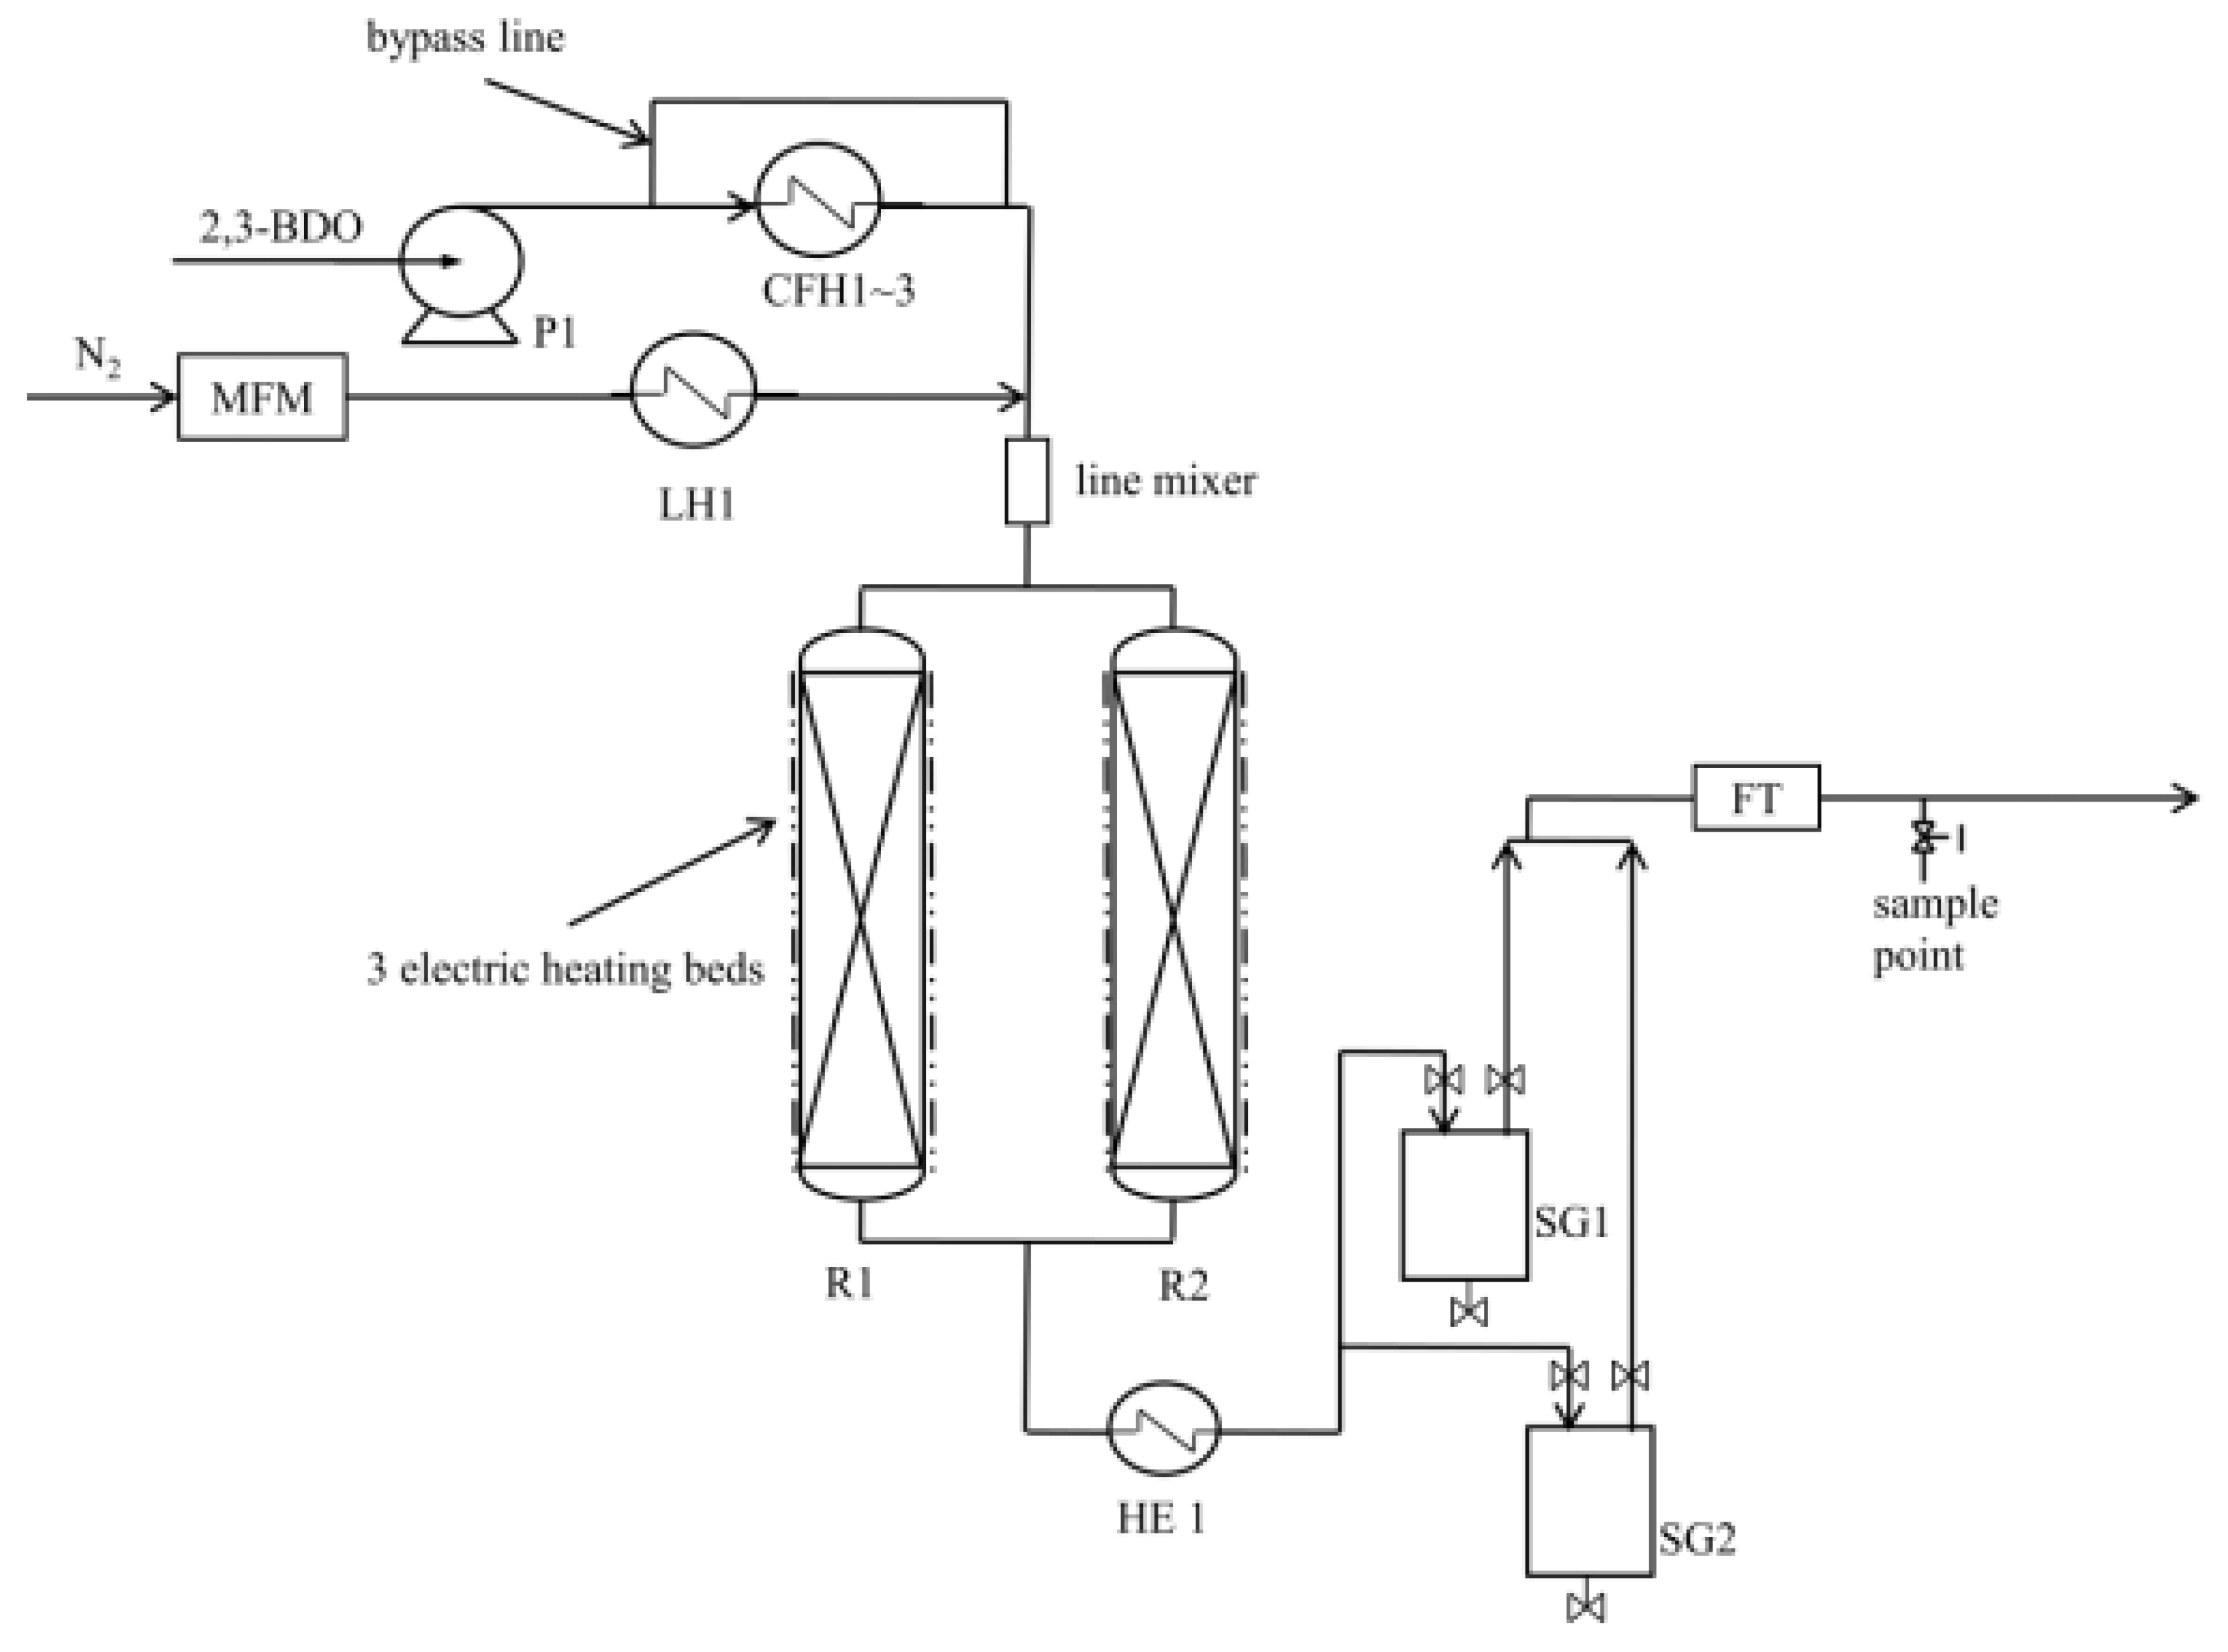
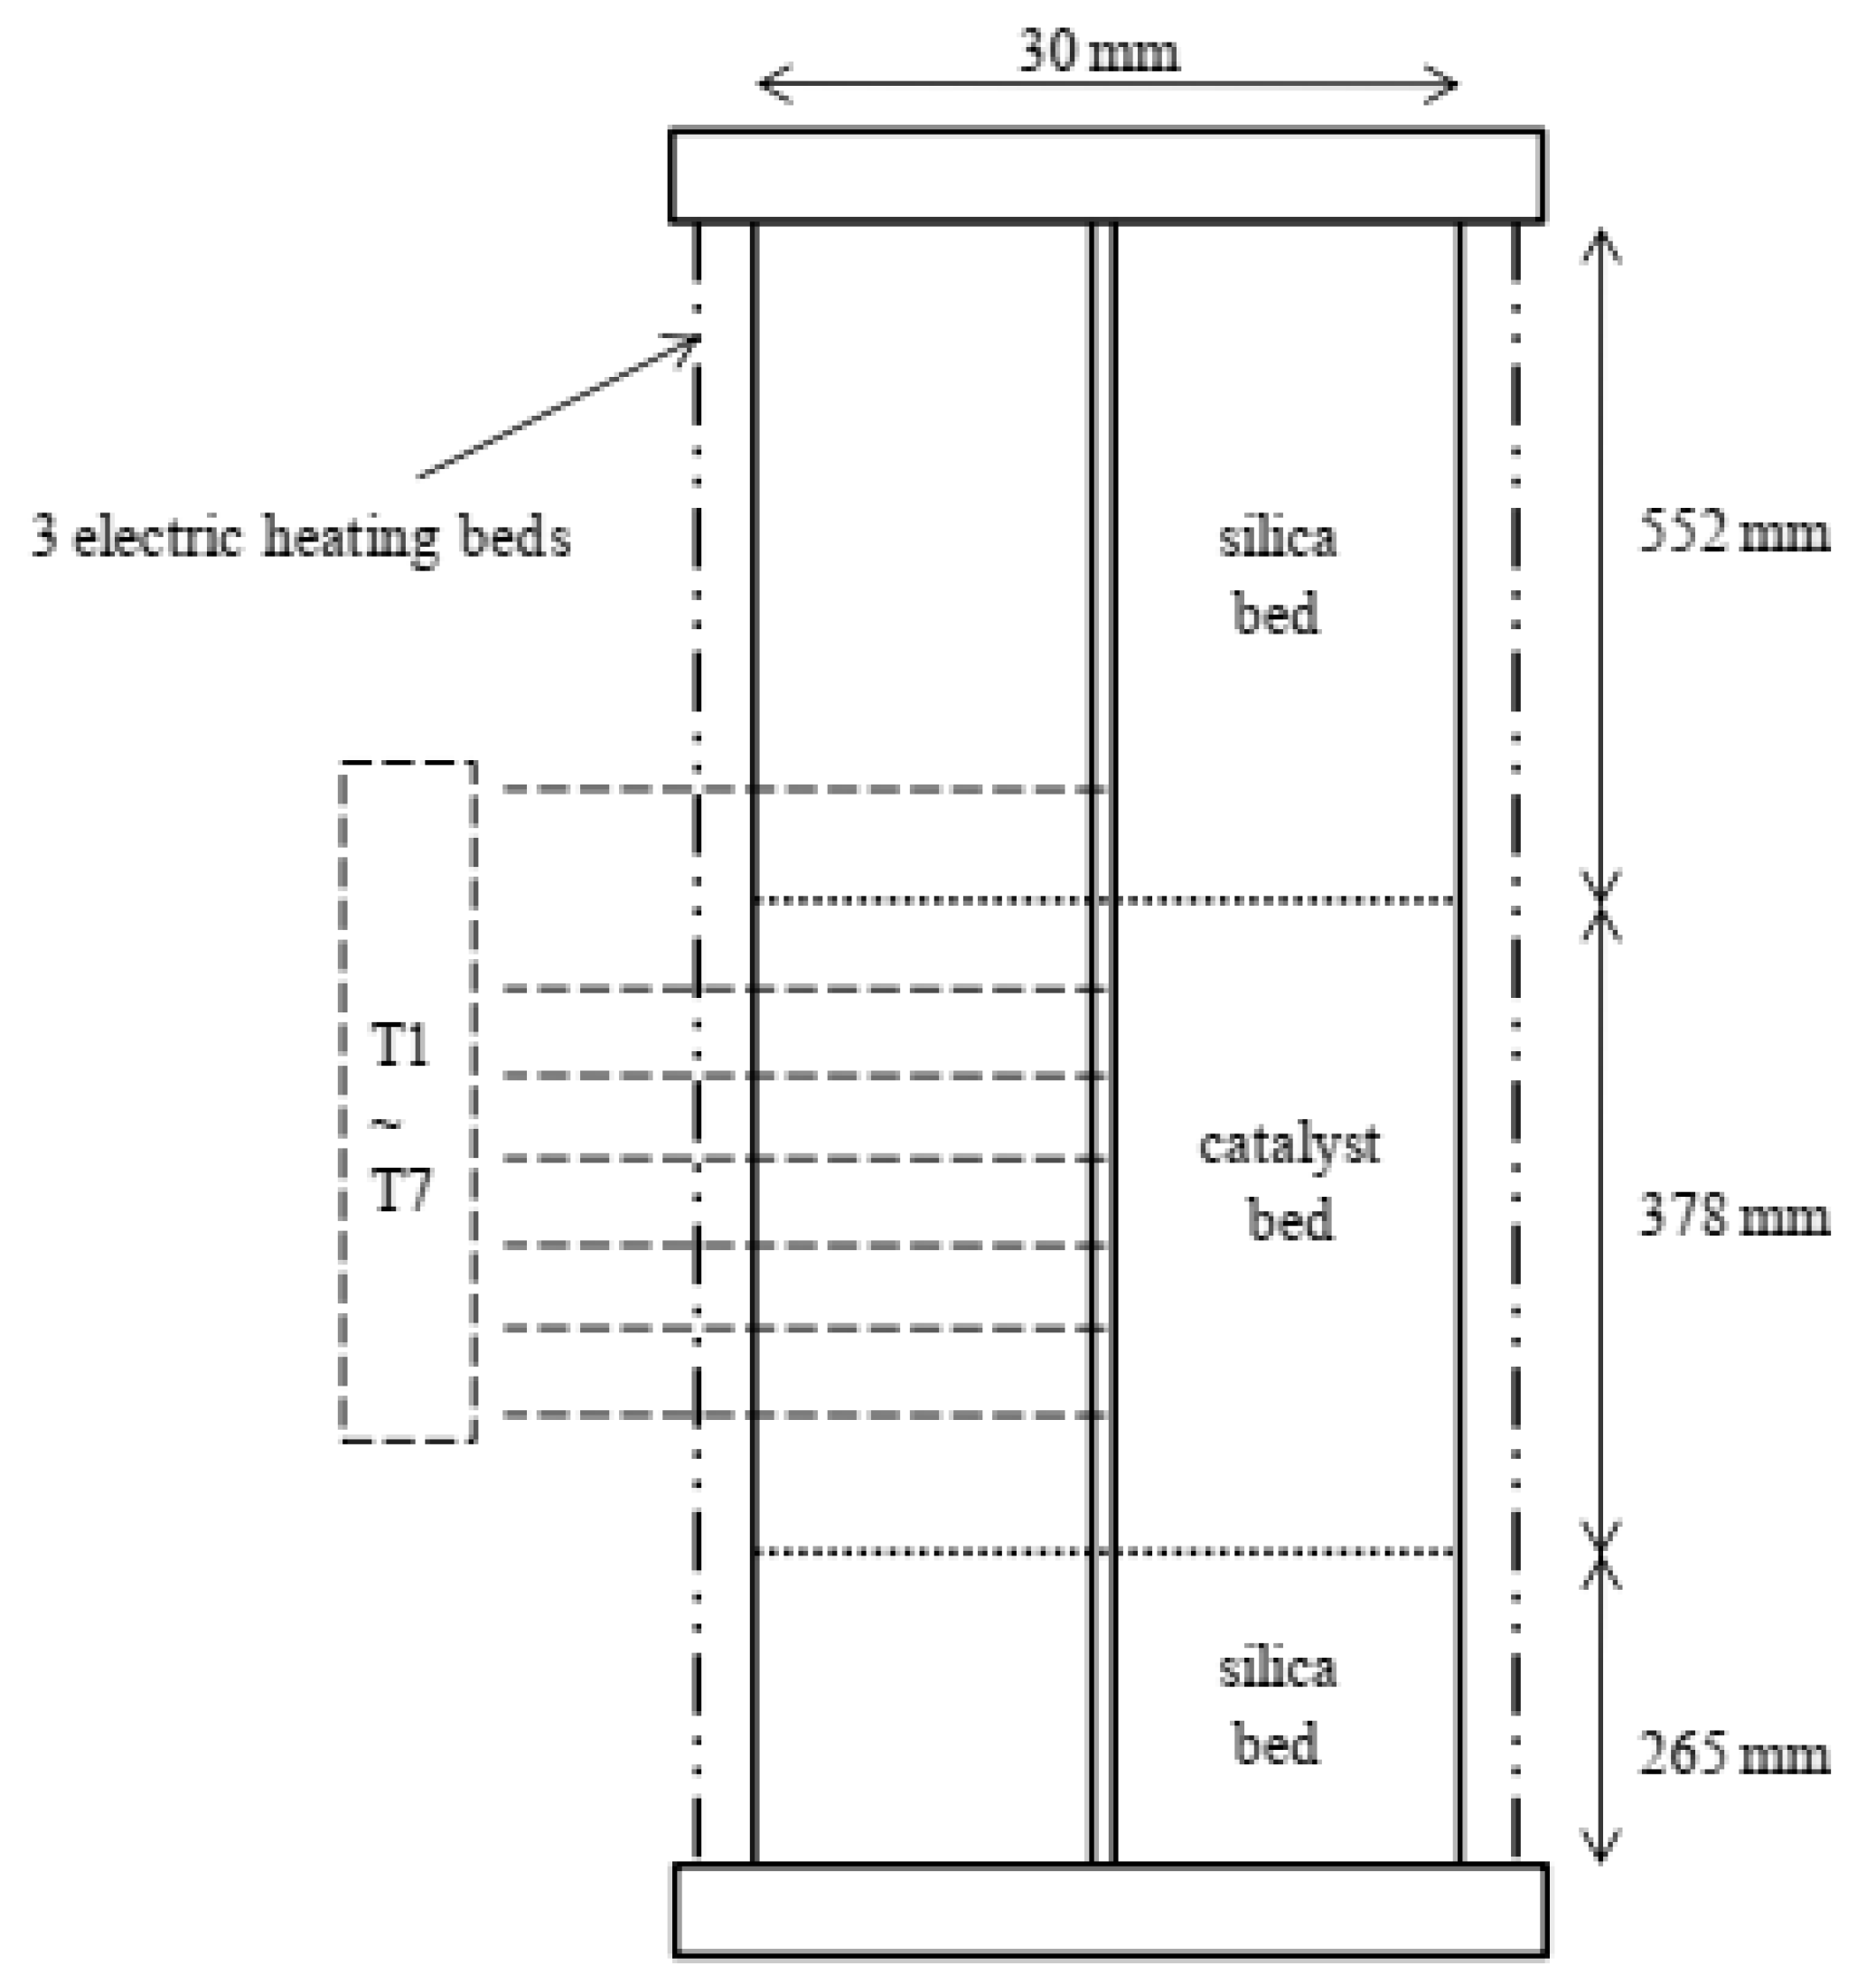
2. Pilot-Scale Experiment

The dehydration of the 2,3-BDO pilot system is shown schematically in Figure 1, and the detailed pilot test procedures were described previously [20]. Briefly, 2,3-BDO (98.65 percent, Sigma-Aldrich, St. Louis, MO, USA) was introduced into the reactor through an HPLC pump (P1) to a ceramic fiber heater (CFH1), and N2 was introduced via a mass flow meter (MFM) to a line heater (LE1) to bring it to the reaction temperature. 2,3-BDO was heated to the reaction temperature using three ceramic fiber heaters (CFH1–3). The heated mixture was delivered into one of the two reactors (R1&R2) through a line mixer, and the reactor’s temperatures were maintained by electric heaters surrounding the R1&R2. A cooler was used to cool the output of the reactor (HE1). Through sight glasses, the condensed mixture was separated into gas and liquid phases (SG1&SG2, respectively). A liquid sample was taken from the SG1 and SG2. The gas product was sent to the flow transmitter (FT), and a gas sample was taken through the sampling point using a gasbag.
The fixed-bed reactor is schematically shown in Figure 2. As in earlier work [18,19], a thermocouple tube was added to the central site of the reactor to accommodate temperature-detecting sensors (T1–T7). T1 was situated 414 mm from the top of the reactor and was used to determine the intake temperature of the catalyst bed. T2–T7 were positioned at 38, 88, 138, 188, 238, and 288 mm from the top of the catalyst bed, respectively. T2–T7 were used to establish the temperature profiles inside the catalyst bed. The reactor spec details are presented in Table S1 (Supplementary Material).
The testing set-up conditions are summarized in Table 1 [21]. The reactor was operated at 0.2 bar gauge, at 299–343 °C. The weight hourly space velocity (WHSV) was changed in the range of 0.48–2.02 h−1. The WHSV is the rate of the feed in the reactor excluding N2. The main outlet products were 2,3-BDO, 1,3-BD, MEK, H2O, 3-Buten-2-ol (3B2OL), and 2-Methylpropanal (2MPL). The other compounds were considered as impurities due to negligible concentration. Thus, the outlet composition was normalized without impurity.

3. Reactor Modeling

3.1. Reaction Kinetics

The dehydration of 2,3-BDO into 1,3-BD and MEK is expressed through the following four main reactions (Equations (1)–(4)):
C 4 H 10 O 2 ( 2 , 3 BDO ) r 1 C 4 H 8 O ( 3 B 2 OL ) +   H 2 O
C 4 H 8 O ( 3 B 2 OL ) r 2 C 4 H 6 ( 1 , 3 BD ) +   H 2 O
C 4 H 10 O 2 ( 2 , 3 BDO ) r 3 C 4 H 8 O ( MEK ) +   H 2 O
C 4 H 10 O 2 ( 2 , 3 BDO ) r 4 C 4 H 8 O ( 2 MPL ) +   H 2 O
Dehydration of 2,3-BDO may be described as a series of two parallel pathways that yield the four main products (1,3-BD, MEK, 3B2OL, 2MPL). The first pathway reflects the conventional rearrangement process, which involves a 1,3-hydride shift that yields MEK or a 1,2-methyl shift that yields 2MPL. The second pathway involves a series of 1,2-eliminations of water, resulting in the production of 3B2OL after the first dehydration and 1,3-BD after the second one. The impurities in the reaction products in this research are overpass since the total quantity of minor butene isomers and heavy compounds regarded as impurities in all the tests is less than 0.3 wt percent, and excluding impurities simplifies the kinetic model significantly. The kinetic model was investigated based on the power-law model and is shown in Table S2 in Supplementary Material. The kinetic parameter study details were presented in the previous work [18].

3.2. The Reactor Model

For the reactor model, the 1D heterogeneous reactor model was used, which took into consideration interfacial and intra-particle gradients. The assumption was that the fluid is a plug flow, the axial dispersion and thermal conductivity would be neglected, and there was no channeling along the reactor tube. The conventional Ergun equation [22] was used to estimate pressure drop in the reactor tube. Ergun correlations comprise the friction factor equation for highly turbulent flow in a channel with the equation for laminar flow in an empty conduit. Hougen correlation [23], based on the Colburn j-factor analogy, calculates the fluid-to-particle interfacial heat and mass transfer resistance. For packed beds of spheres, the correlation connects the j-factor and the Reynolds number. The tube interior heat transfer coefficient is determined by subtracting the effective bed heat conductivity from the bed-wall heat transfer coefficient [24]. These two coefficients have both static and dynamic contributions; in terms of the static contribution relating to heat transfer in the hypothetical condition of zero-flow, while the dynamic component accounts for the hydrodynamic processes [25]. The pertinent correlations and equations for the 1D heterogeneous model are explained in Table S3 in Supplementary Material. A full description of the reactor model was expressed in the previous work [20].

4. Numerical Analysis

The 1D fixed bed reactor model was solved by numerical DAE solvers provided by gPROMS. To analyze the numerical model’s performance, (1) temperature profile of the reactor in the catalyst bed, (2) molar fraction, (3) reaction rate, and the effectiveness factor of the outlet stream were evaluated. The simulation was run at a temperature of 330 °C and pressure of 1 bar and WHSV was 0.5 h−1.

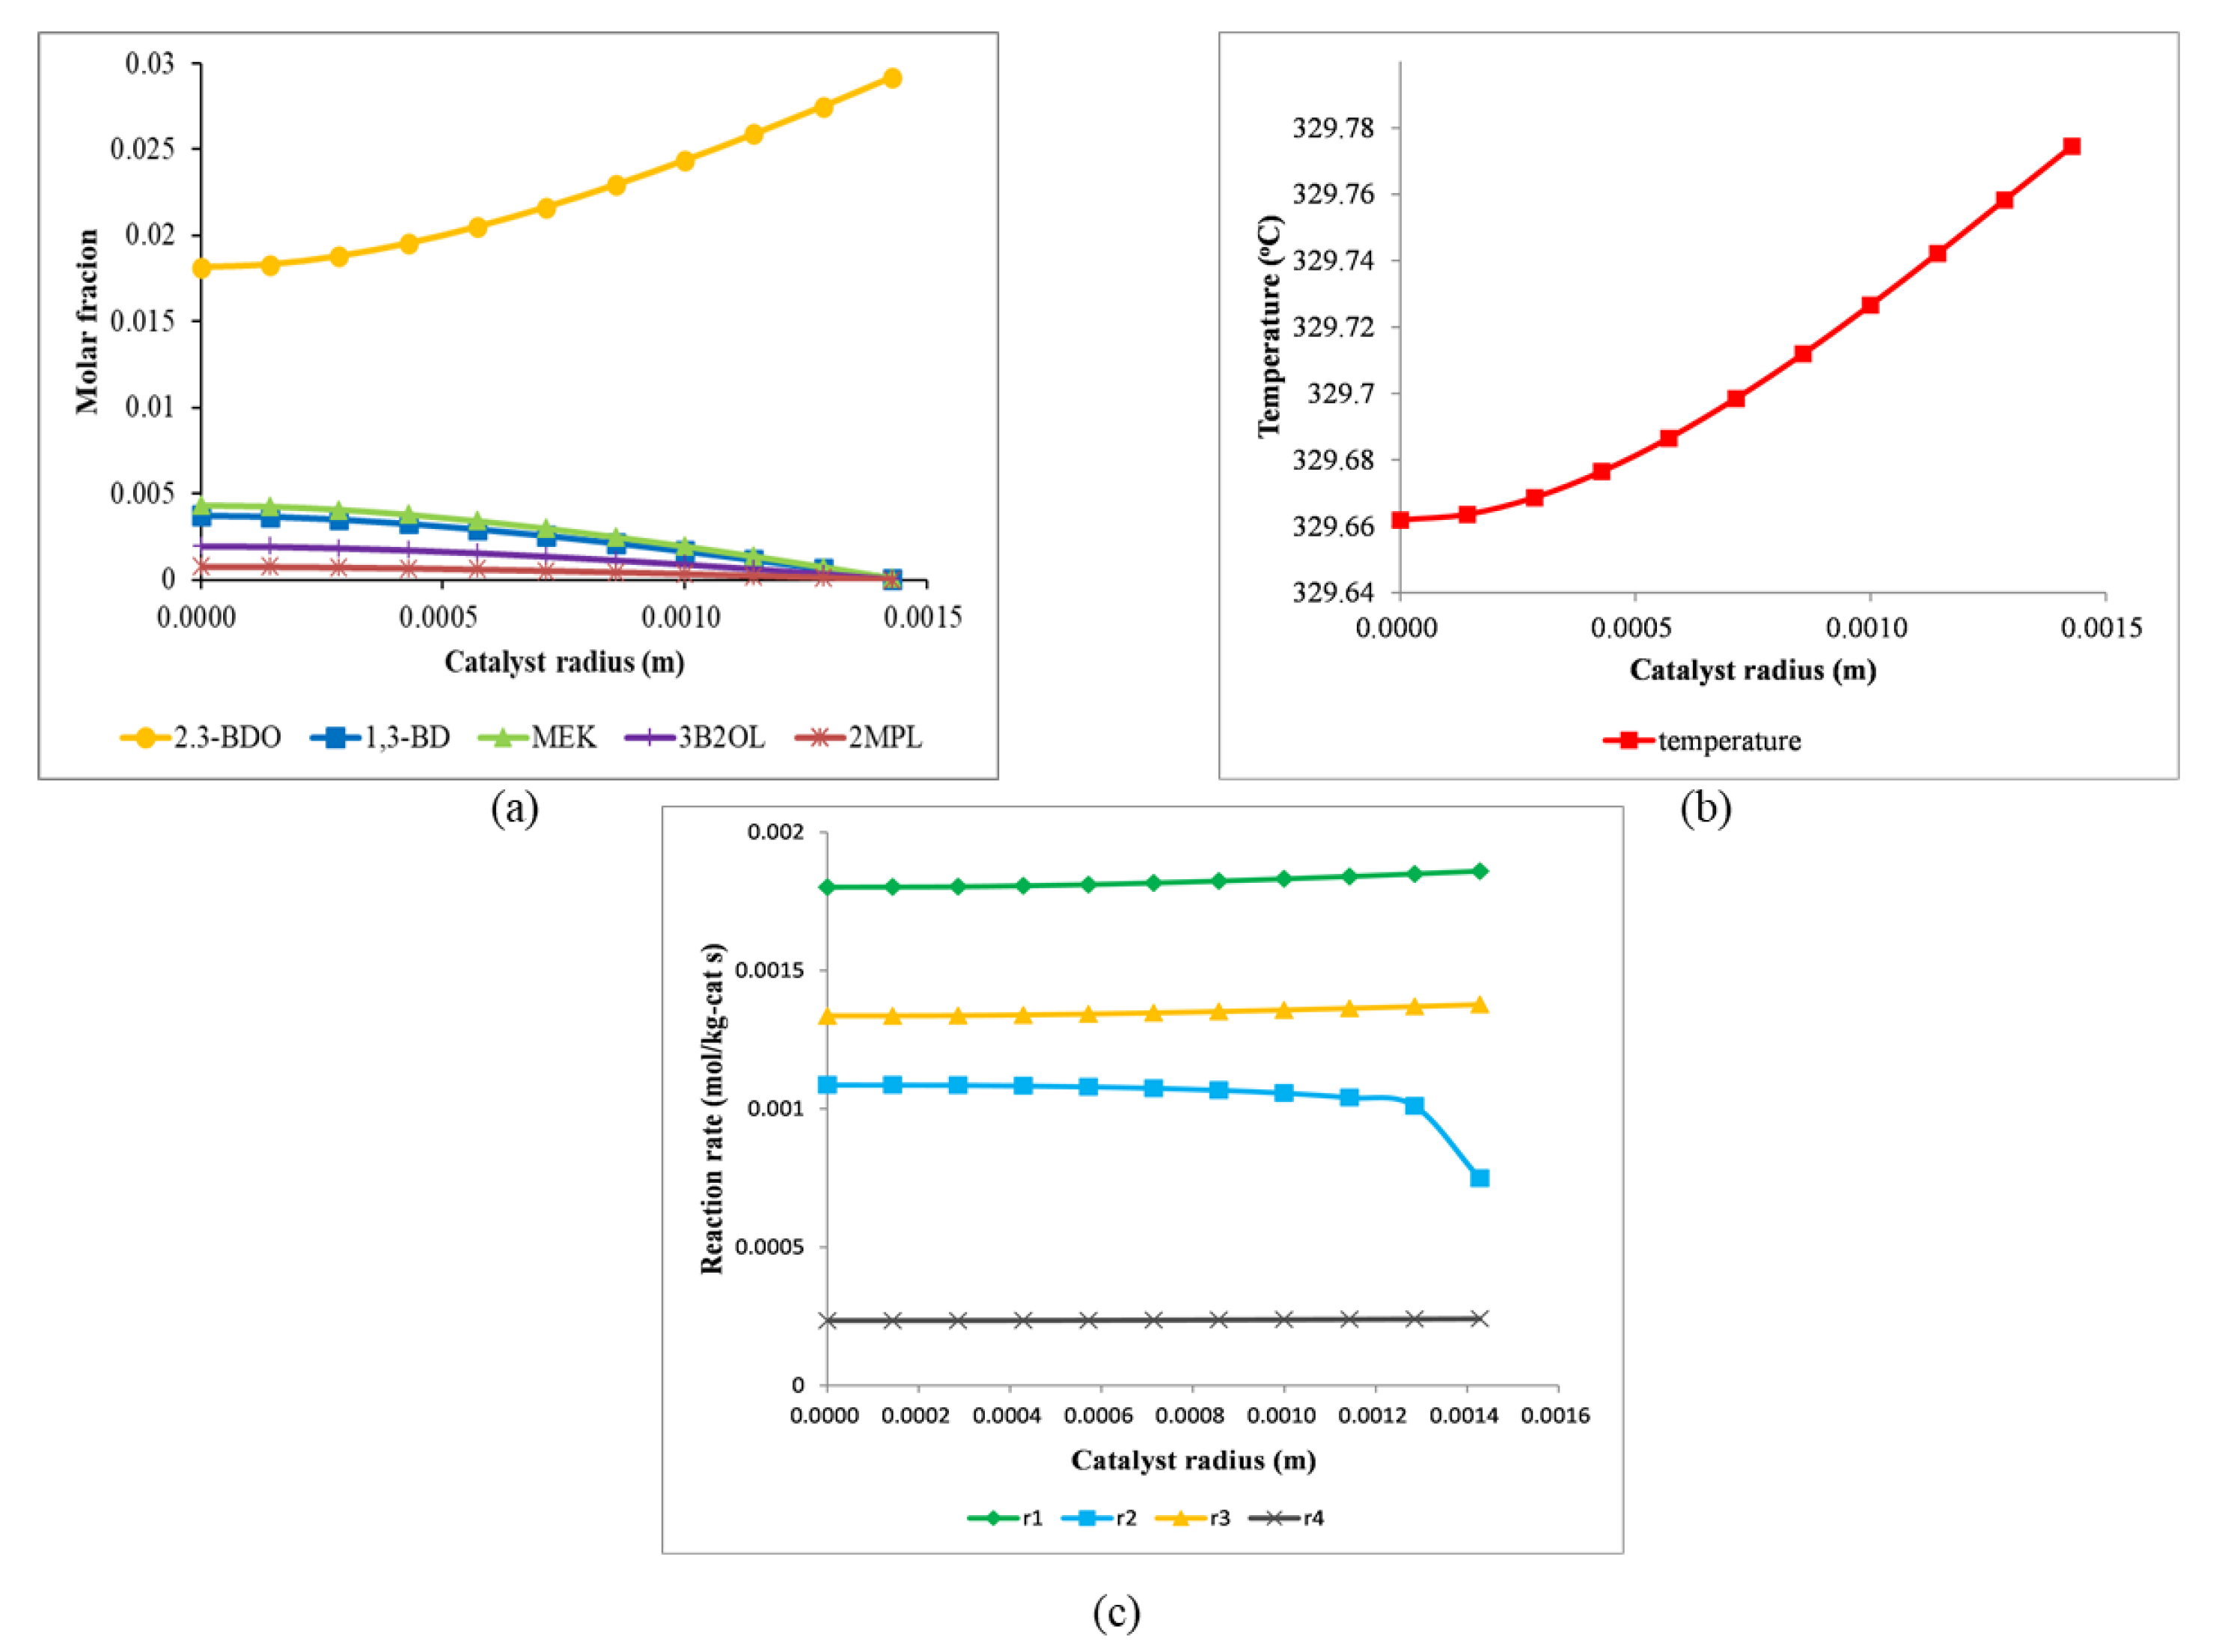
4.1. Molar Fractions of Components and Temperature, and Reaction Rate Profile Analysis in the Catalyst Pellet

Figure 3 shows the molar fractions of components and the temperature and reaction rate profiles in the catalyst under the inlet conditions of the reactor. As shown in Figure 3a, the molar fraction of the reactant, 2,3-BDO, exhibits a decreasing trend towards the center of the catalyst pellet as a result of a pore diffusion effect. Otherwise, the molar fractions of the components except for 2,3-BDO are higher at the center of the pellet than on the pellet surface because reactions (r1–r4) take place in the pellet. In the case of the temperature profile shown in Figure 3b, the temperature decreases slightly toward the center of the catalyst pellet owing to the endothermic nature of the reactions. The temperature difference between the center and the surface of the catalyst is very little and does not significantly affect the performance of the reactor. Therefore, we assumed that the temperature in the catalysis is constant for the simulation model used in Section 5 and Section 6. As represented in Figure 3c, the reaction rate, r2, increases toward the center of the pellet, especially near the surface of the catalyst, because of 3B2OL, the reactant of r2, produced from 2,3-BDO by r1. On the other hand, other reactions except for r2 decrease slightly toward the center of the pellet because of the pore diffusion effects of the reactant, 2,3-BDO.

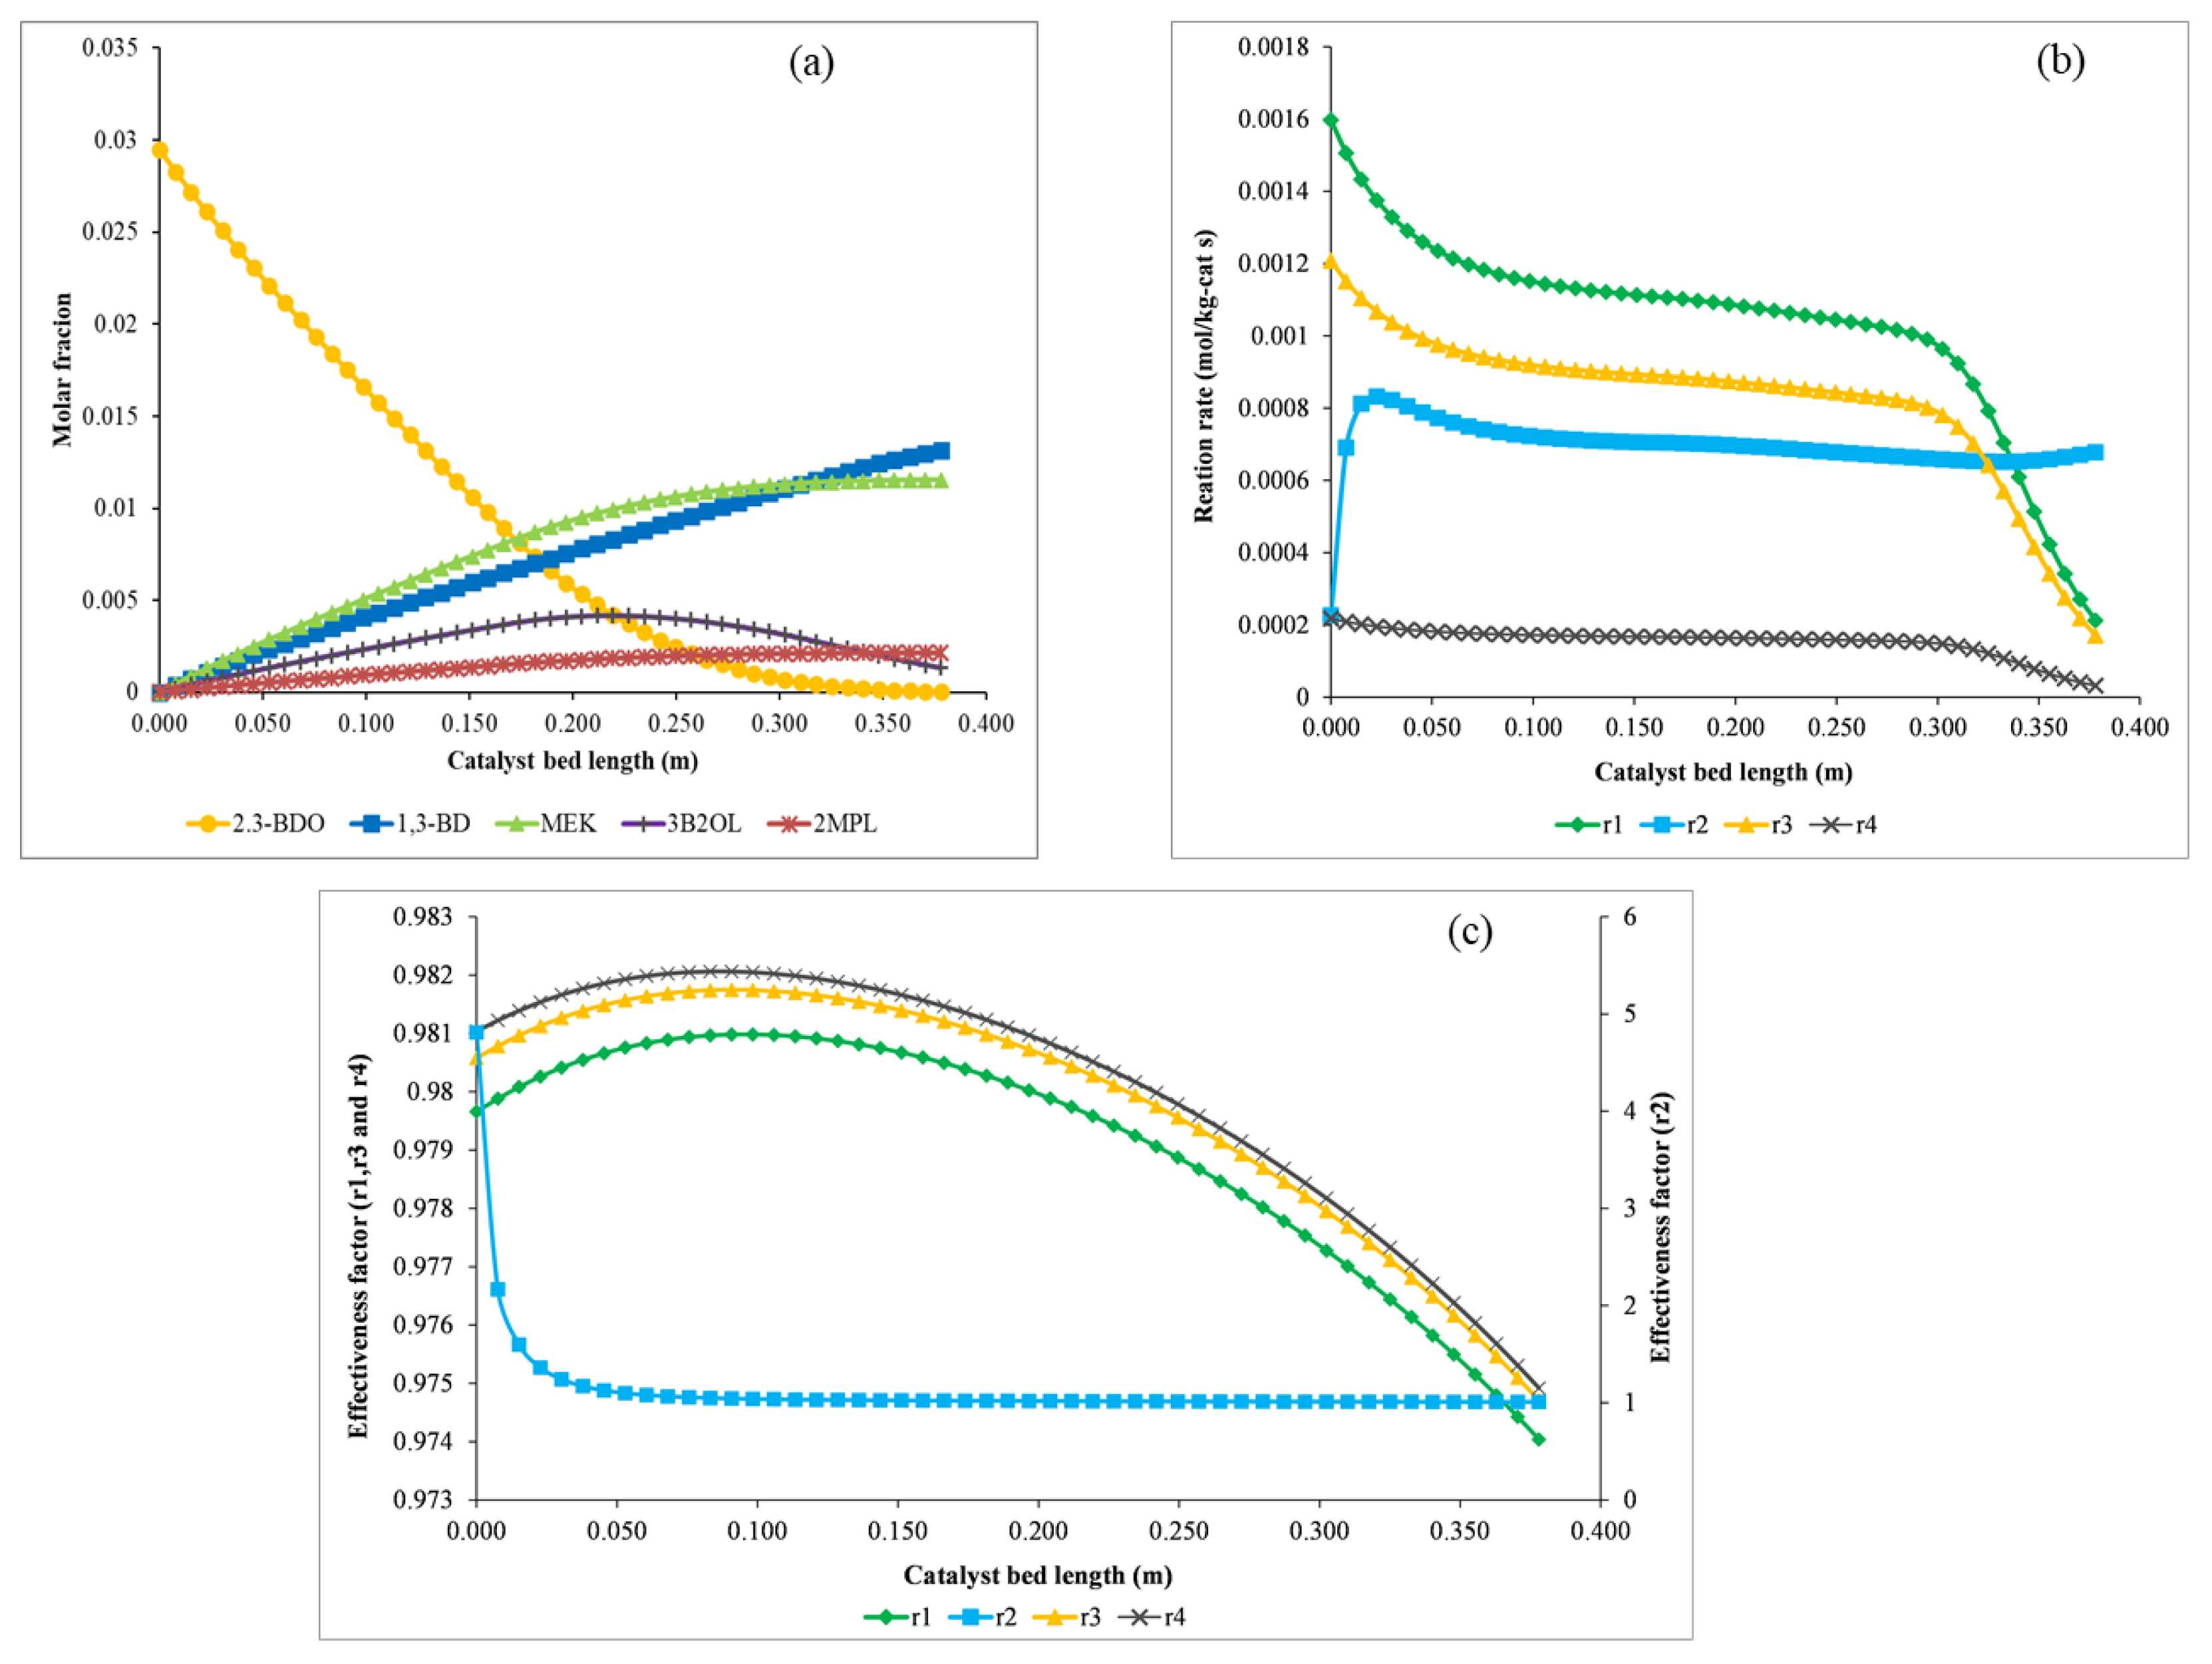
4.2. Molar Fractions of Components, Reaction Rate, and Effectiveness Factor Profile Analysis along the Length of the Catalyst Bed

Figure 4 shows the molar fractions of components, reaction rates, and effectiveness factor profiles along the length of the catalyst bed. The molar fractions of the components are shown in Figure 4a. The reactant, 2,3-BDO, decreases in concentration linearly by 0.21 m from the inlet of the catalyst bed, the rate of decrease drops after 0.21 m, and the reactant is almost consumed at the outlet of the reactor. MEK and 2MPL, which are produced by r3 and r4, increase linearly by 0.21 m from the inlet of the catalyst bed, and the rate of increase declines after 0.21 m. On the other hand, the concentration of 3B2OL, made by r1, increases by 0.23 m at the inlet of the reactor and decreases towards the end of the reactor. The concentration of 1,3-BD, produced by r2, increases linearly towards the outlet of the reactor owing to the 3B2OL produced by r1. Figure 4b shows the profiles of reaction rates at the surface of the catalyst along the length of the catalyst bed. The reaction rates (r1, r3, and r4) show a similar pattern, albeit they may be greater or less. After 0.29 m, the reaction rates decrease sharply because most of the reactant, 2,3-BDO, is consumed by that point. On the other hand, the reaction rate (r2) increases sharply near the entrance of the reactor, decreases a little bit, then is constant until it exits the catalyst bed thanks to the 3B2OL produced by r1, as shown in Figure 4a. The profiles of the effectiveness factors are represented in Figure 4c. The effectiveness factors (η1, η3, and η4) increase a little bit by 0.7 m from the inlet of the catalyst bed and decrease slightly towards the outlet of the reactor, but their values are very close to 1, meaning that mass transfer is fast compared to kinetics. Otherwise, the effectiveness factor (η2) is about 4.8 at the inlet of the reactor because the reaction rate, r2, increases toward the center of the pellet owing to 3B2OL, the reactant of r2, as shown in Figure 4b. η2 decreases sharply by 0.05 m because r2 at the surface of the catalyst increases with the intermediate product 3B2OL along the length of the catalyst bed. η2 remains approximately 1, like the other effectiveness factors, after 0.05 m.

5. Validation of the Reactor Model

To compare performance between the numerical model and the pilot reactor, (1) temperature profile of the reactor along with the axis of the catalyst bed, (2) BDO conversion, and (3) major products’ selectivity at the outlet stream was evaluated for the twelve cases showed in Table 1.

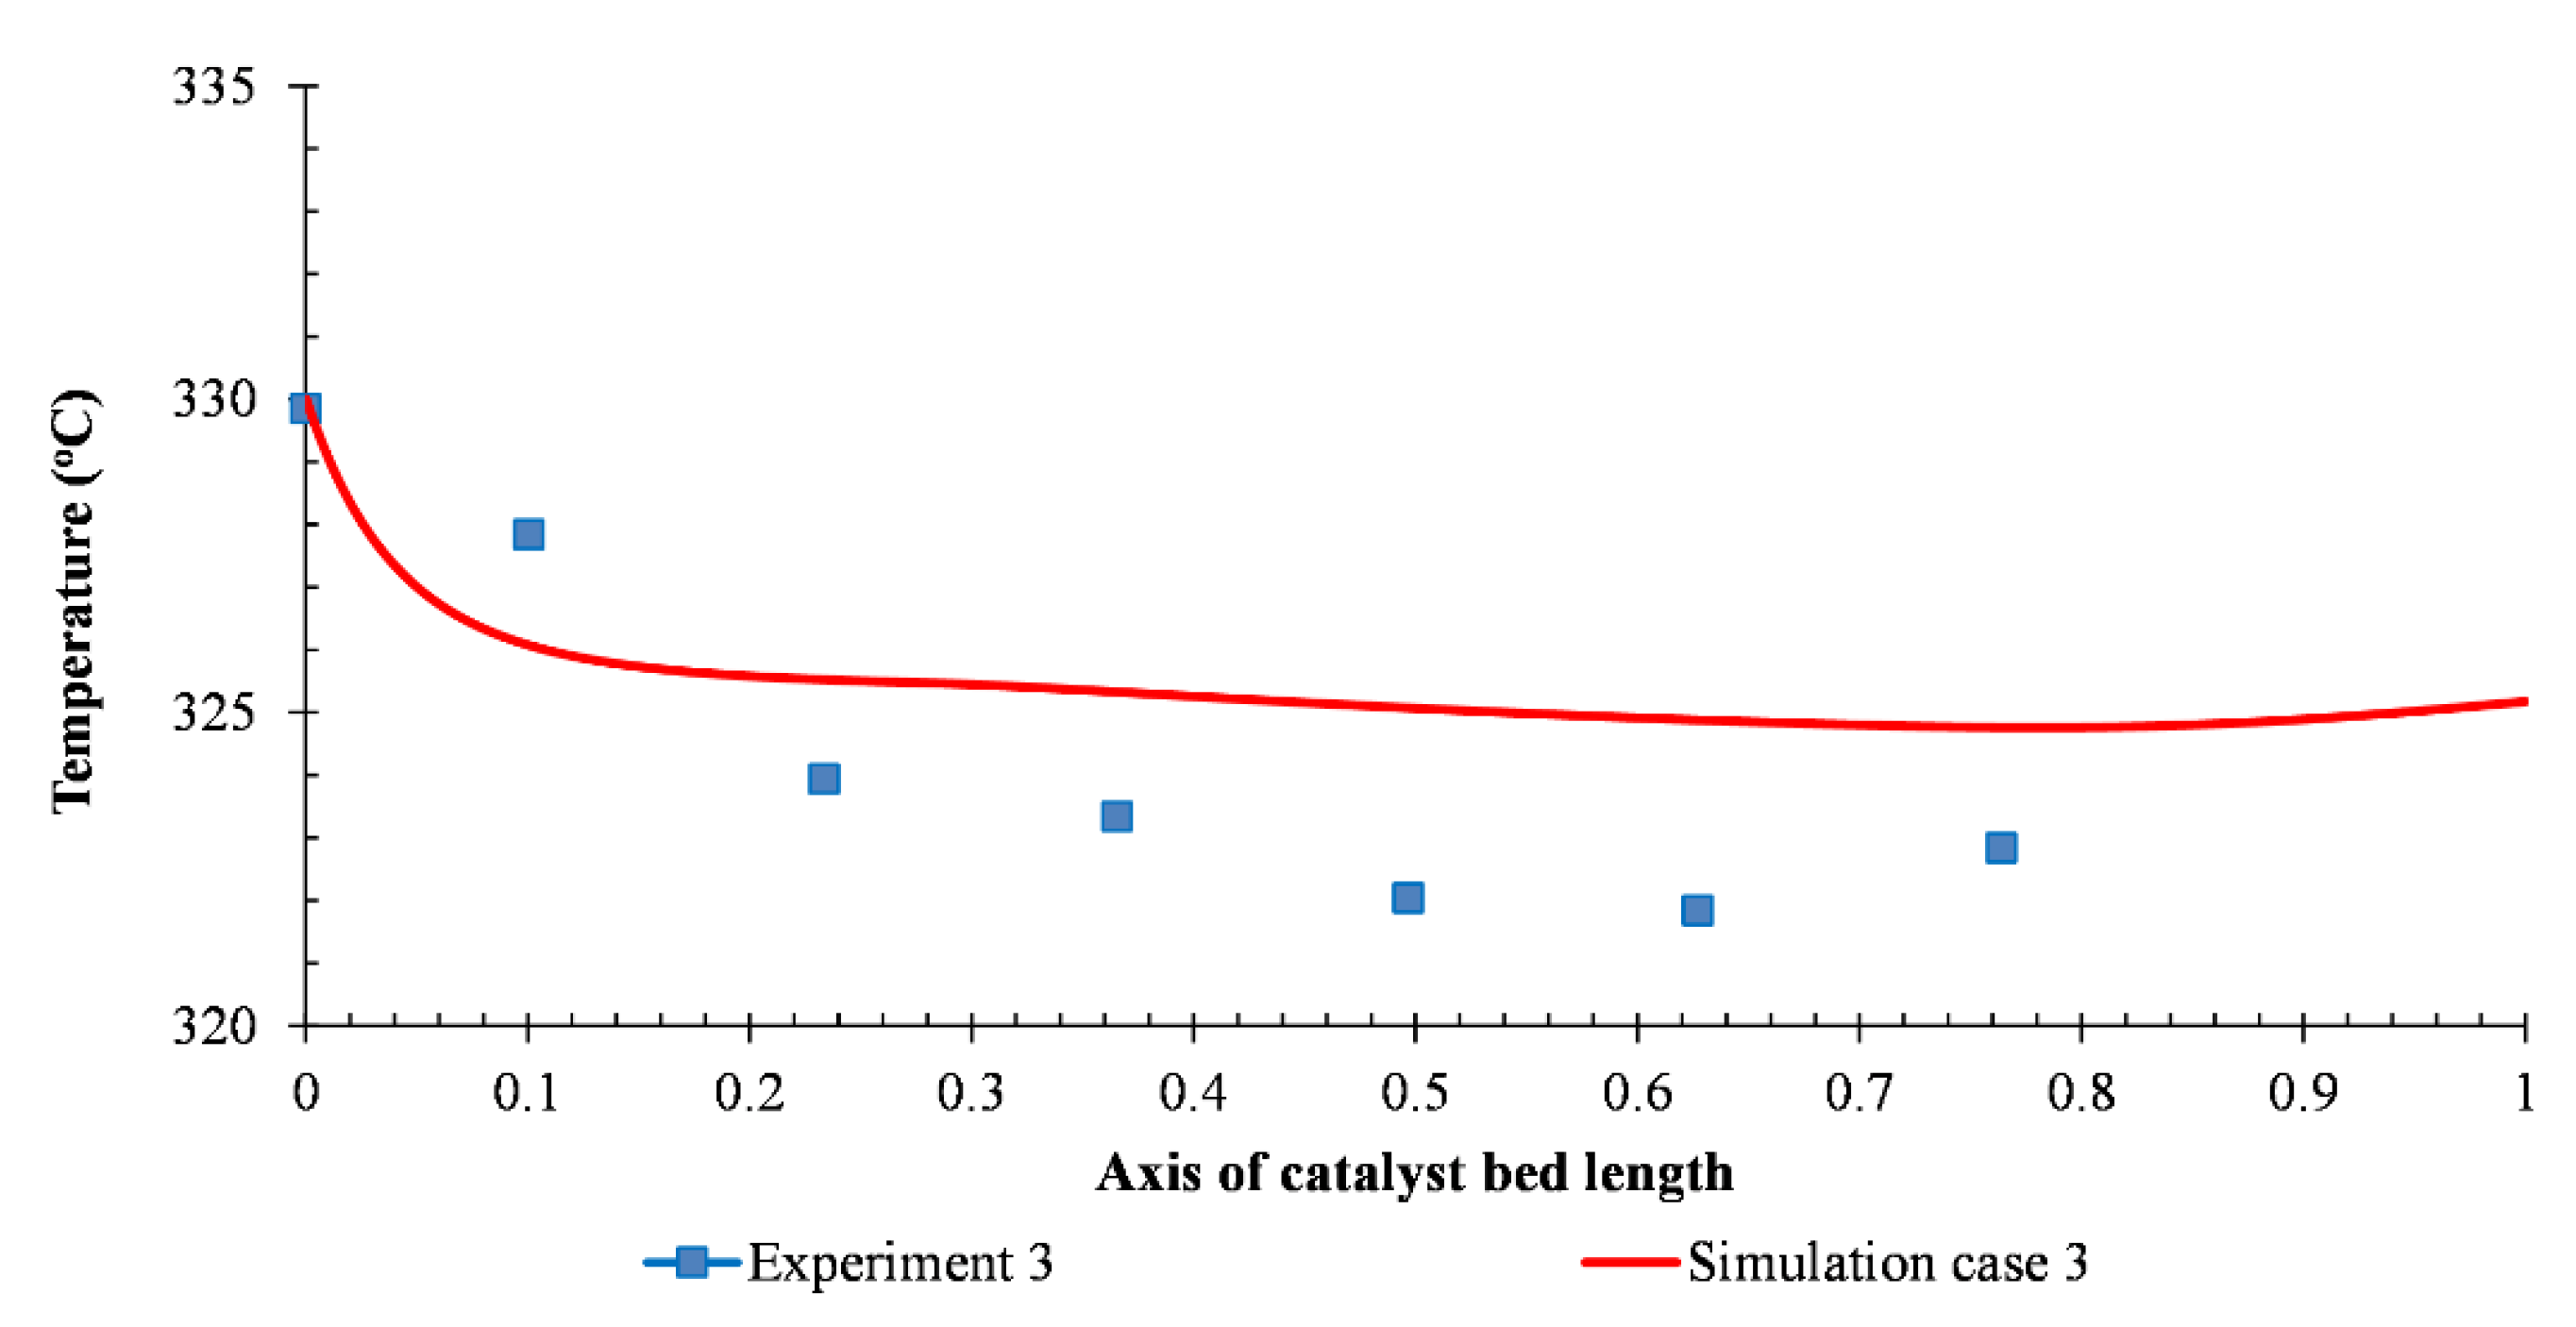
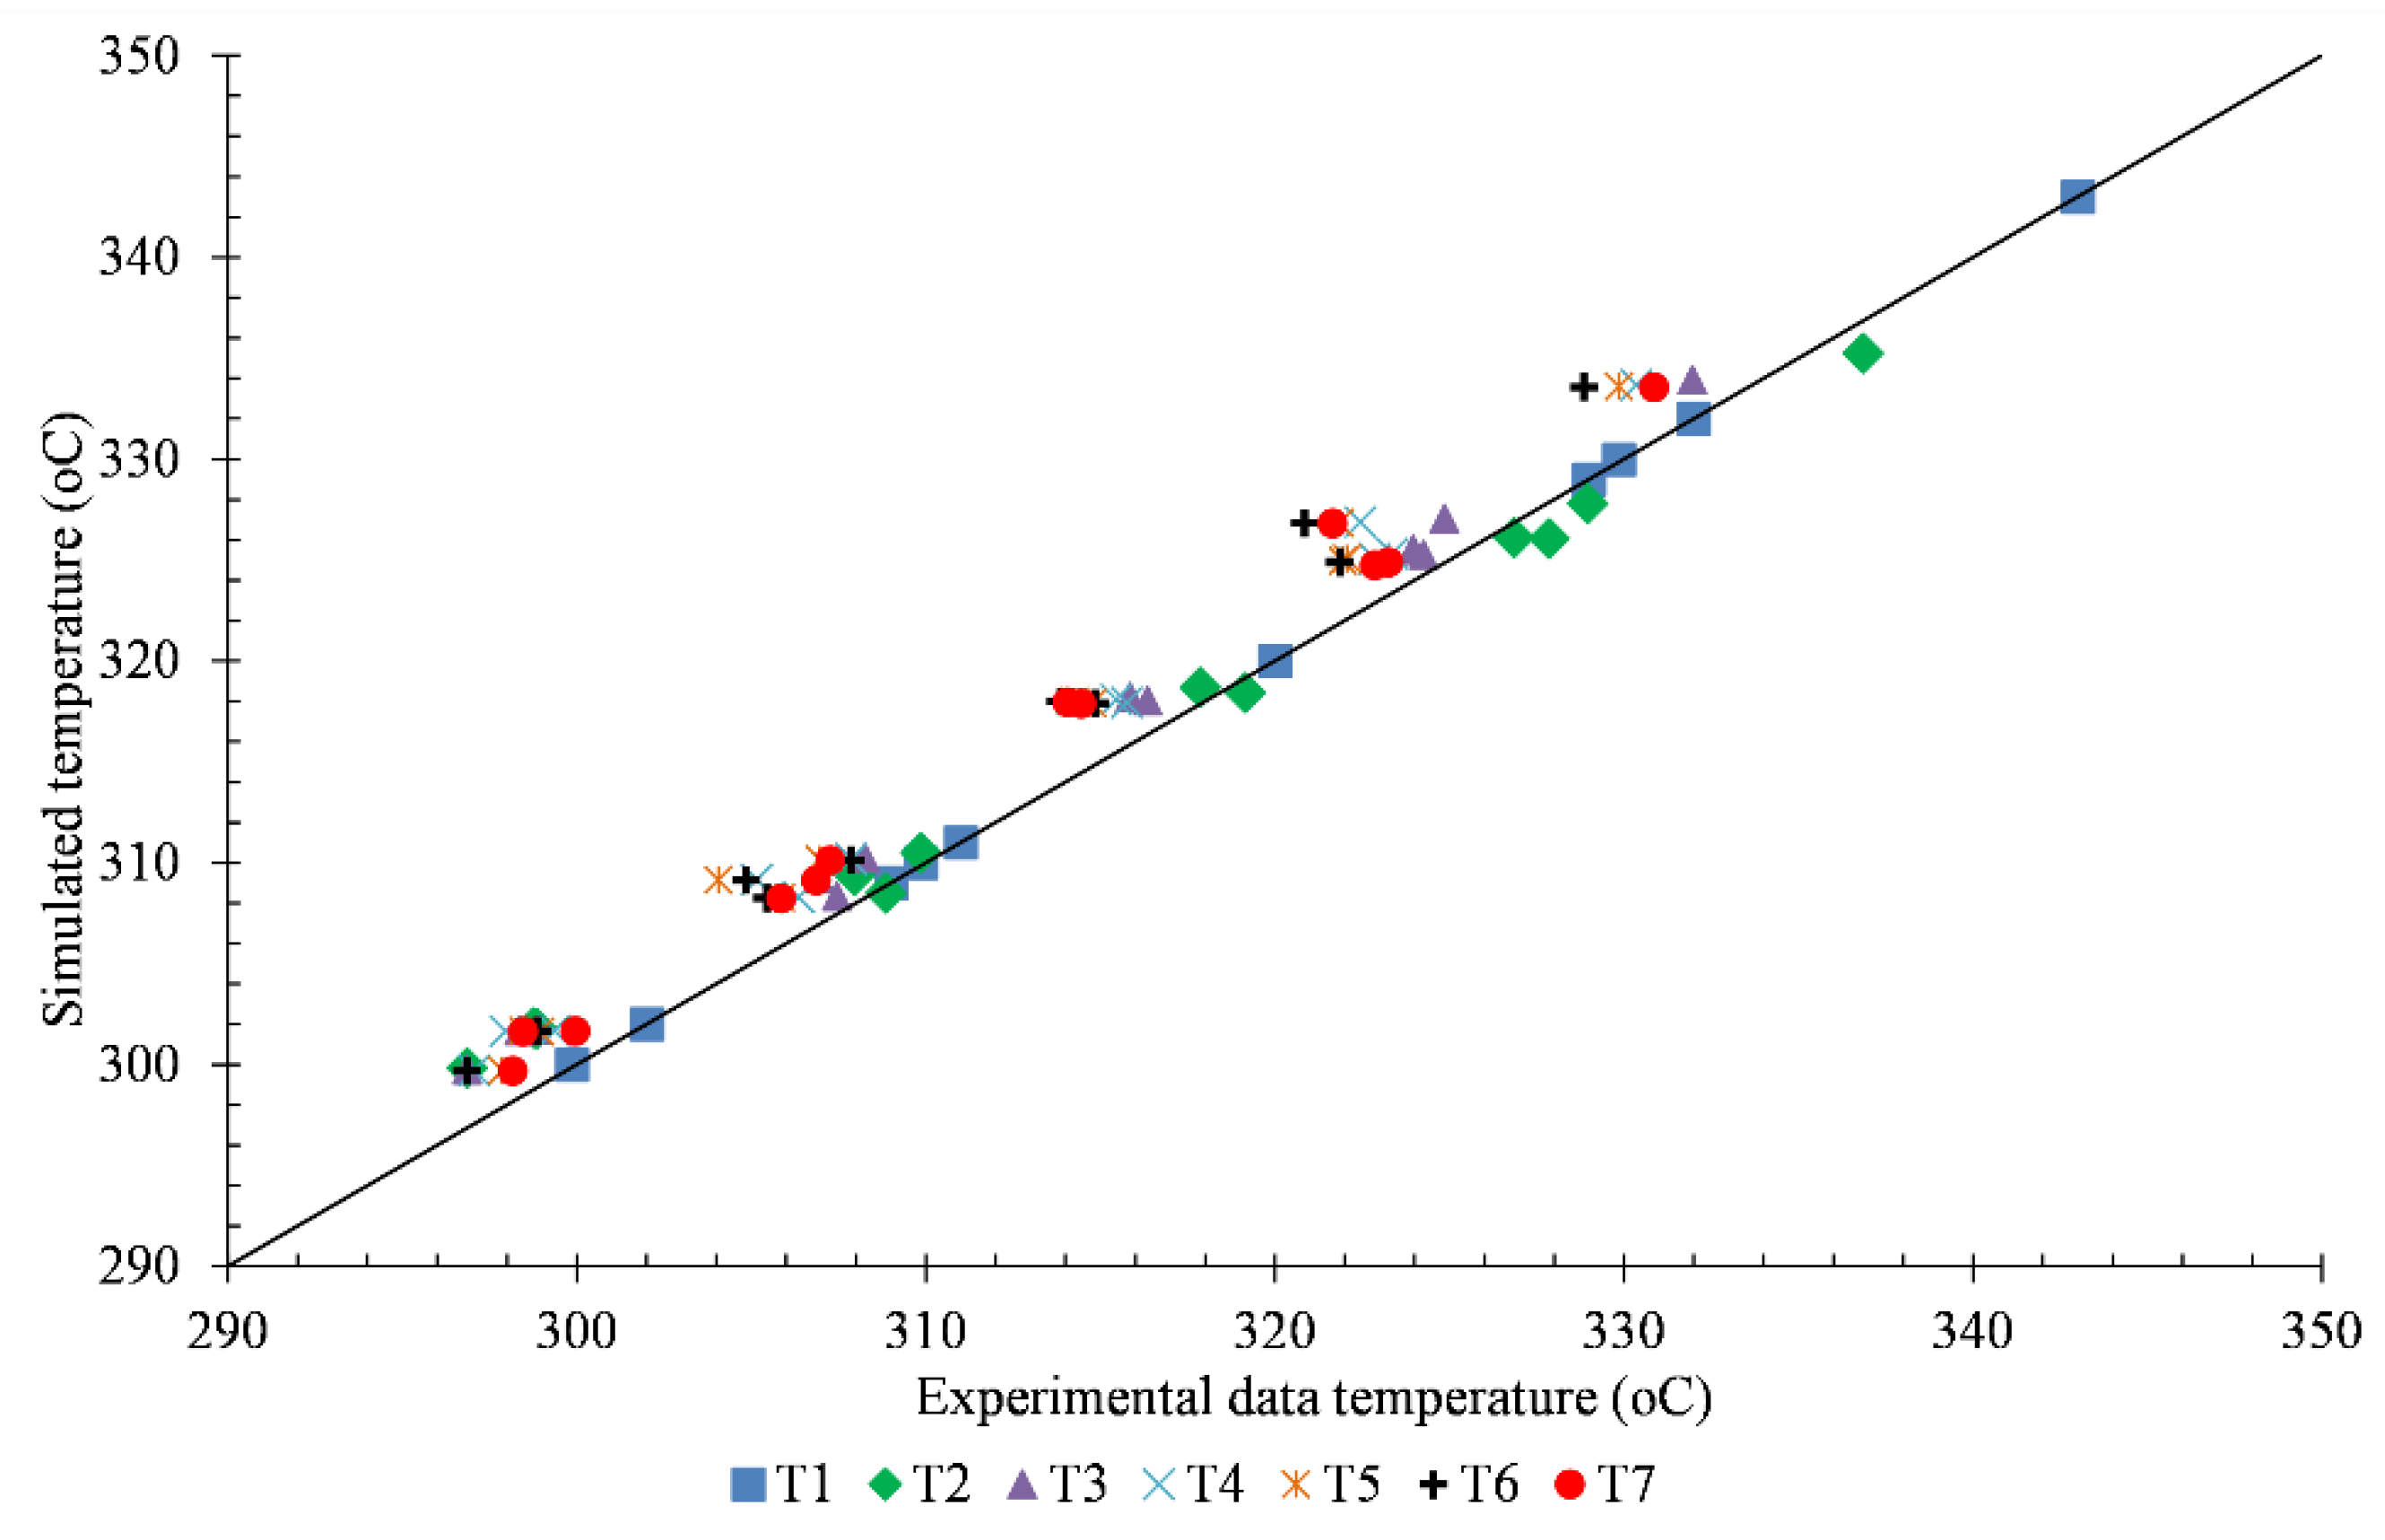
5.1. Temperature Profile

The simulated temperature profile and the third experimental temperature data were presented in Figure 5. The scattered points are the temperatures measured by the sensors, while the solid lines are the fluid temperature profiles from the simulation. The temperature of the actual reactor gradually decreases from 330 °C to 323 °C which is obtained from sensors T1 to T7, respectively. At the inlet of the catalyst bed, the concentration of 2,3-BDO was high, and the reaction occurred rapidly, while the temperature dropped. Due to the reduction of the reactant 2,3-BDO, the reaction was slower, and there was no reaction after 0.3 m. The variation in temperature profile was more significant where the inlet temperature was high. This variation trend can be explained with the reaction orders (n1, n3, n4: 0.0187 and n2: 0.146) that are close to 0, meaning that reaction rates mainly depend on the temperature. The temperature comparison of the rest of the cases can be seen in Figure 6. There was a great similarity between simulation results and experimental data in the majority of the cases. The temperature profile of all cases was found to decrease noticeably in about 30% of the height from the top of the catalyst bed, then slowly decrease till 70% of the height and imperceptibly for the rest of the bed.

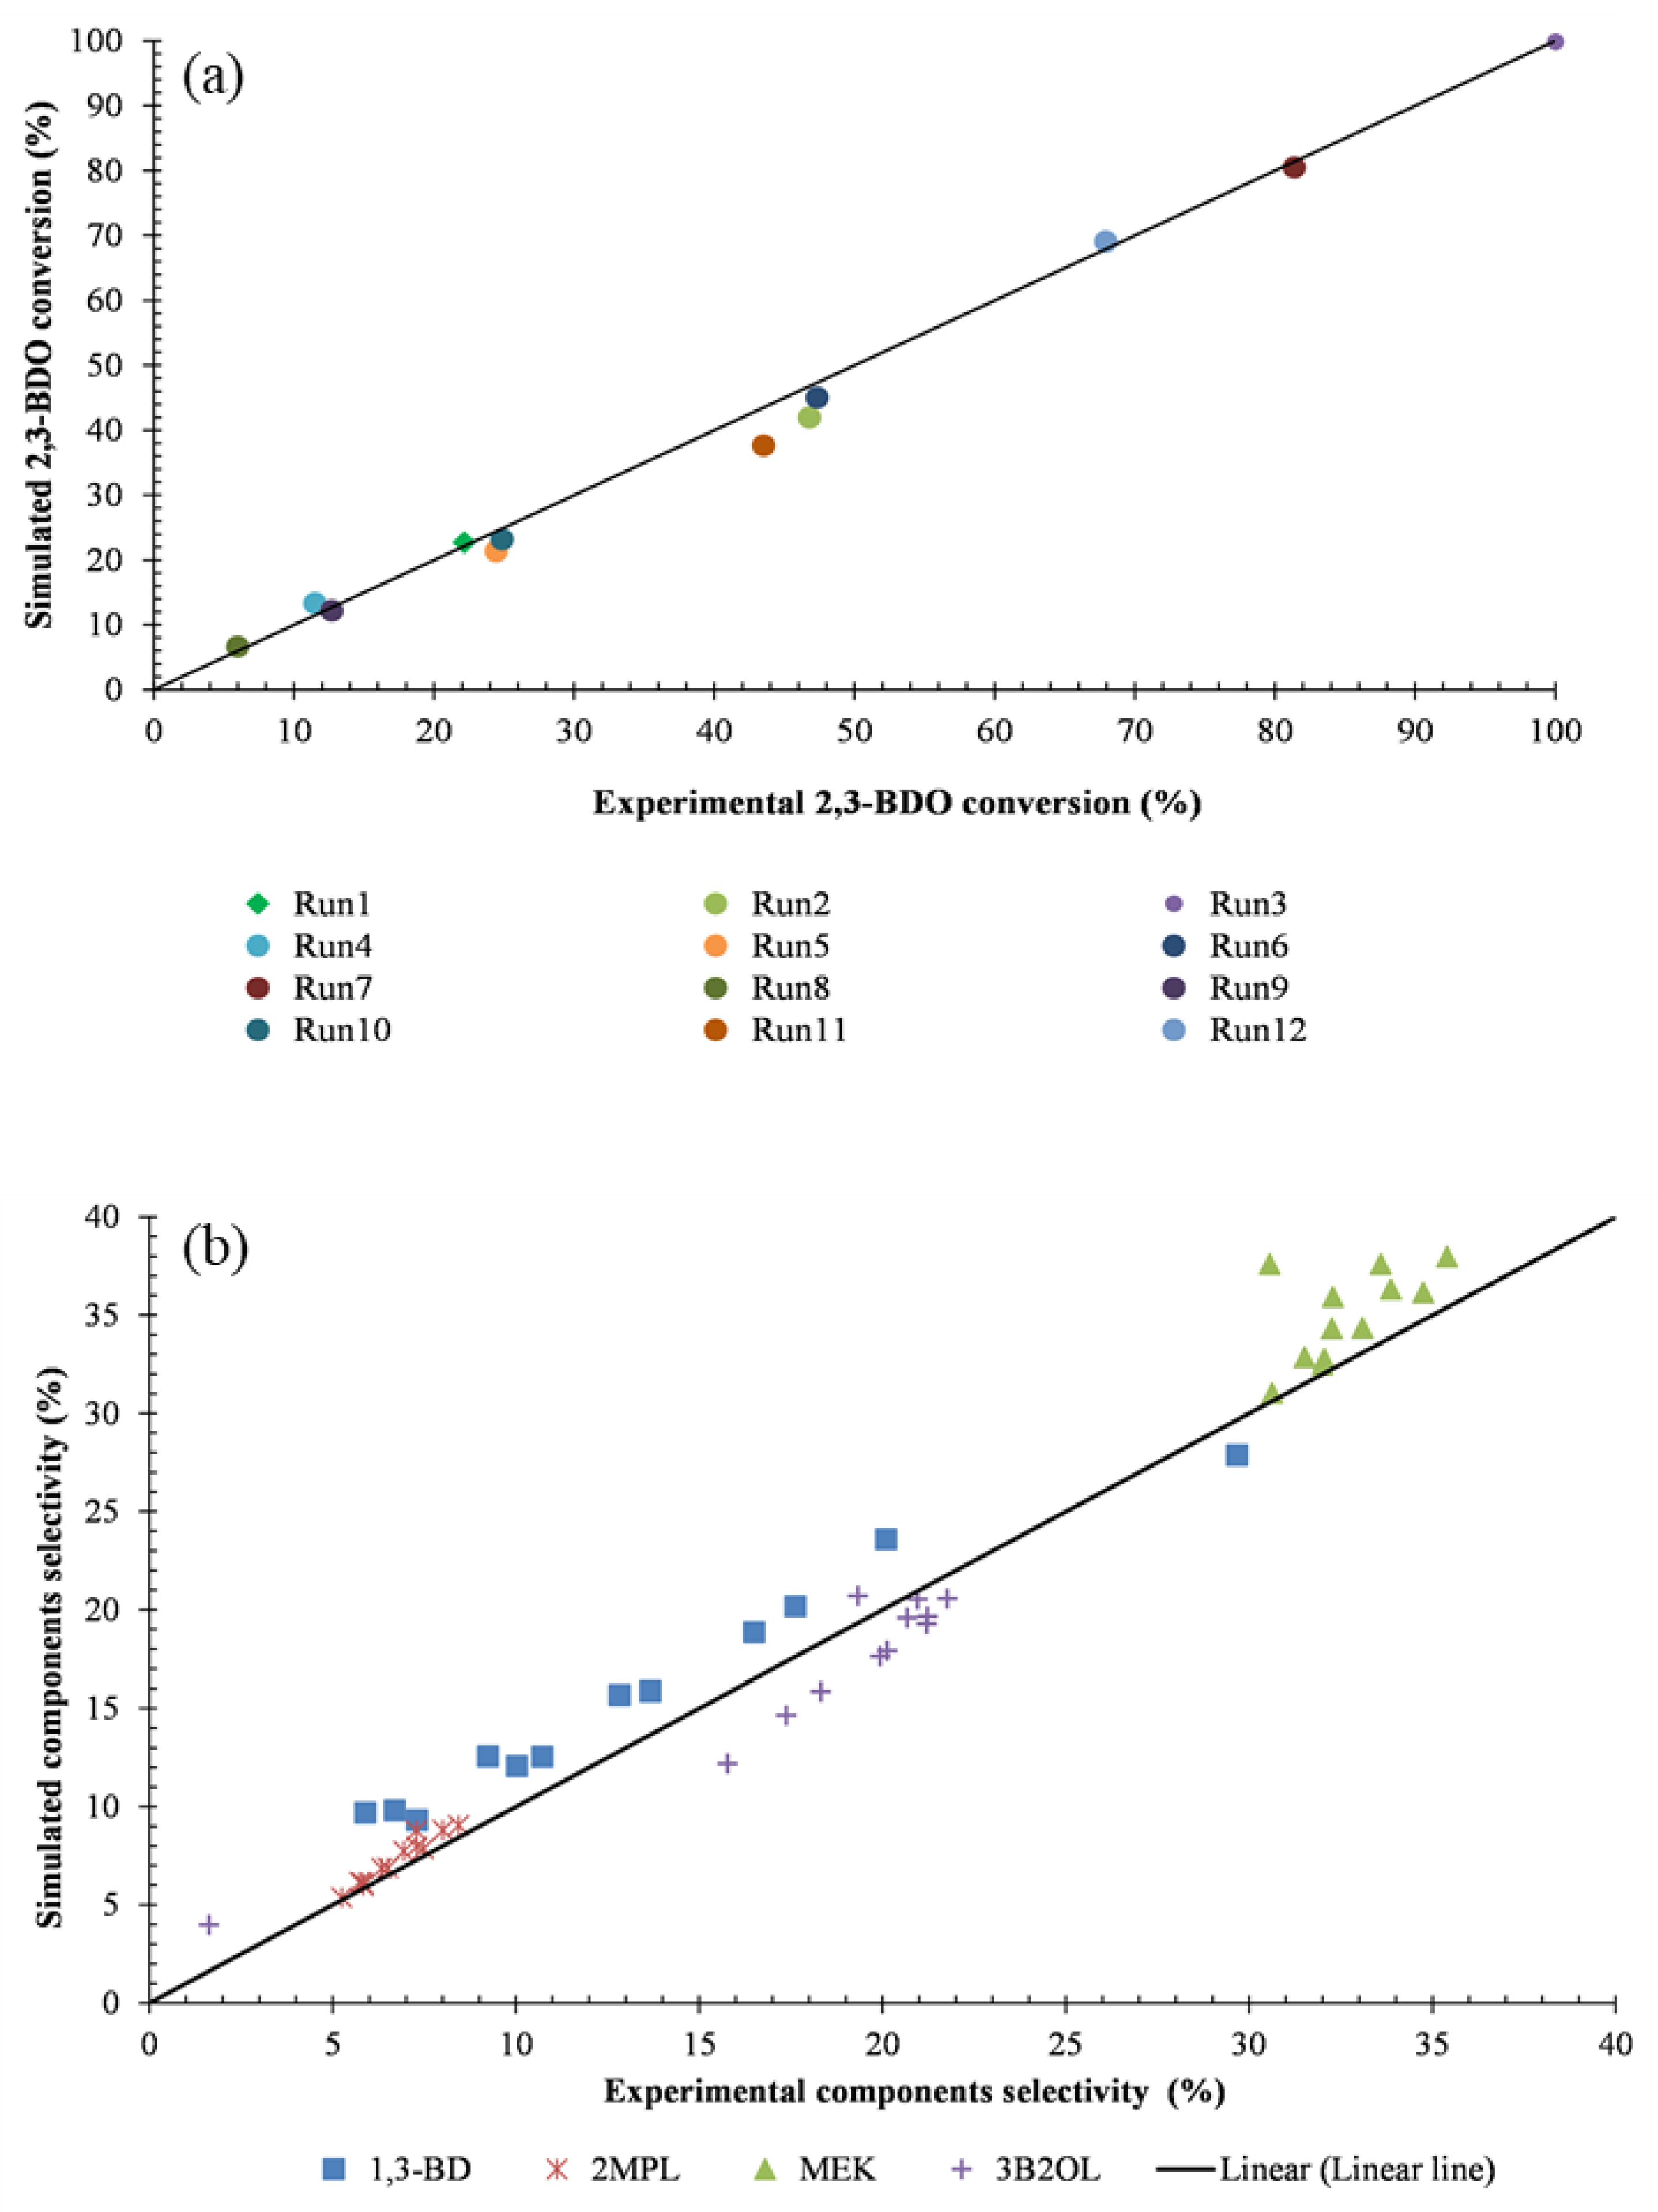
5.2. BDO Conversion and Major Components Selectivity

Figure 7 shows that the model is an excellent fit to the experimental data in the aspect of 2,3-BDO conversion. The highest error is observed in experiment 5 (5.9%). The conversion depends on the fluid inlet temperature as explained in Section 5.1. 2,3-BDO is converted less than 25% when the inlet temperature is lower than 310 °C and doubles when the temperature is approximately 320 °C. On the other hand, the 2,3-BDO conversion achieved the highest value when the inlet temperature is 330 °C. Besides, it was observed that the higher the WHSV, the lower the 2,3-BDO conversion. The reason for this effect is the shorter residence time of 2,3-BDO when the WHSV increases.
The selectivity of 1,3-BD, 2MPL, 2-Butanone (MEK), and 3-Buten-2-ol were reported in Figure 7b. In the majority of the cases, the selectivity of all components in experiments is similar to the calculation result. The differences of selectivity of 1,3 butadiene and MEK, the final products of 2,3-BDO dehydration, are less than 3.4% and 4%, respectively. The MEK selectivity was higher and more stable compared to1,3-BD (30.6–35.4% compared to 6.9–29.7%, respectively). The reason is that the activation energy of the reaction routes (Equations (1) and (2)) of 1,3-BD is higher than that of the reaction route (Equation (3)) of MEK, explaining the sharp changing rate of 1,3-BD selectivity compared to the MEK selectivity (see Table S2 in Supplementary Material). The validation result demonstrates that the reactor model can be used to analyze and predict reactor performance.

6. Sensitive Analysis
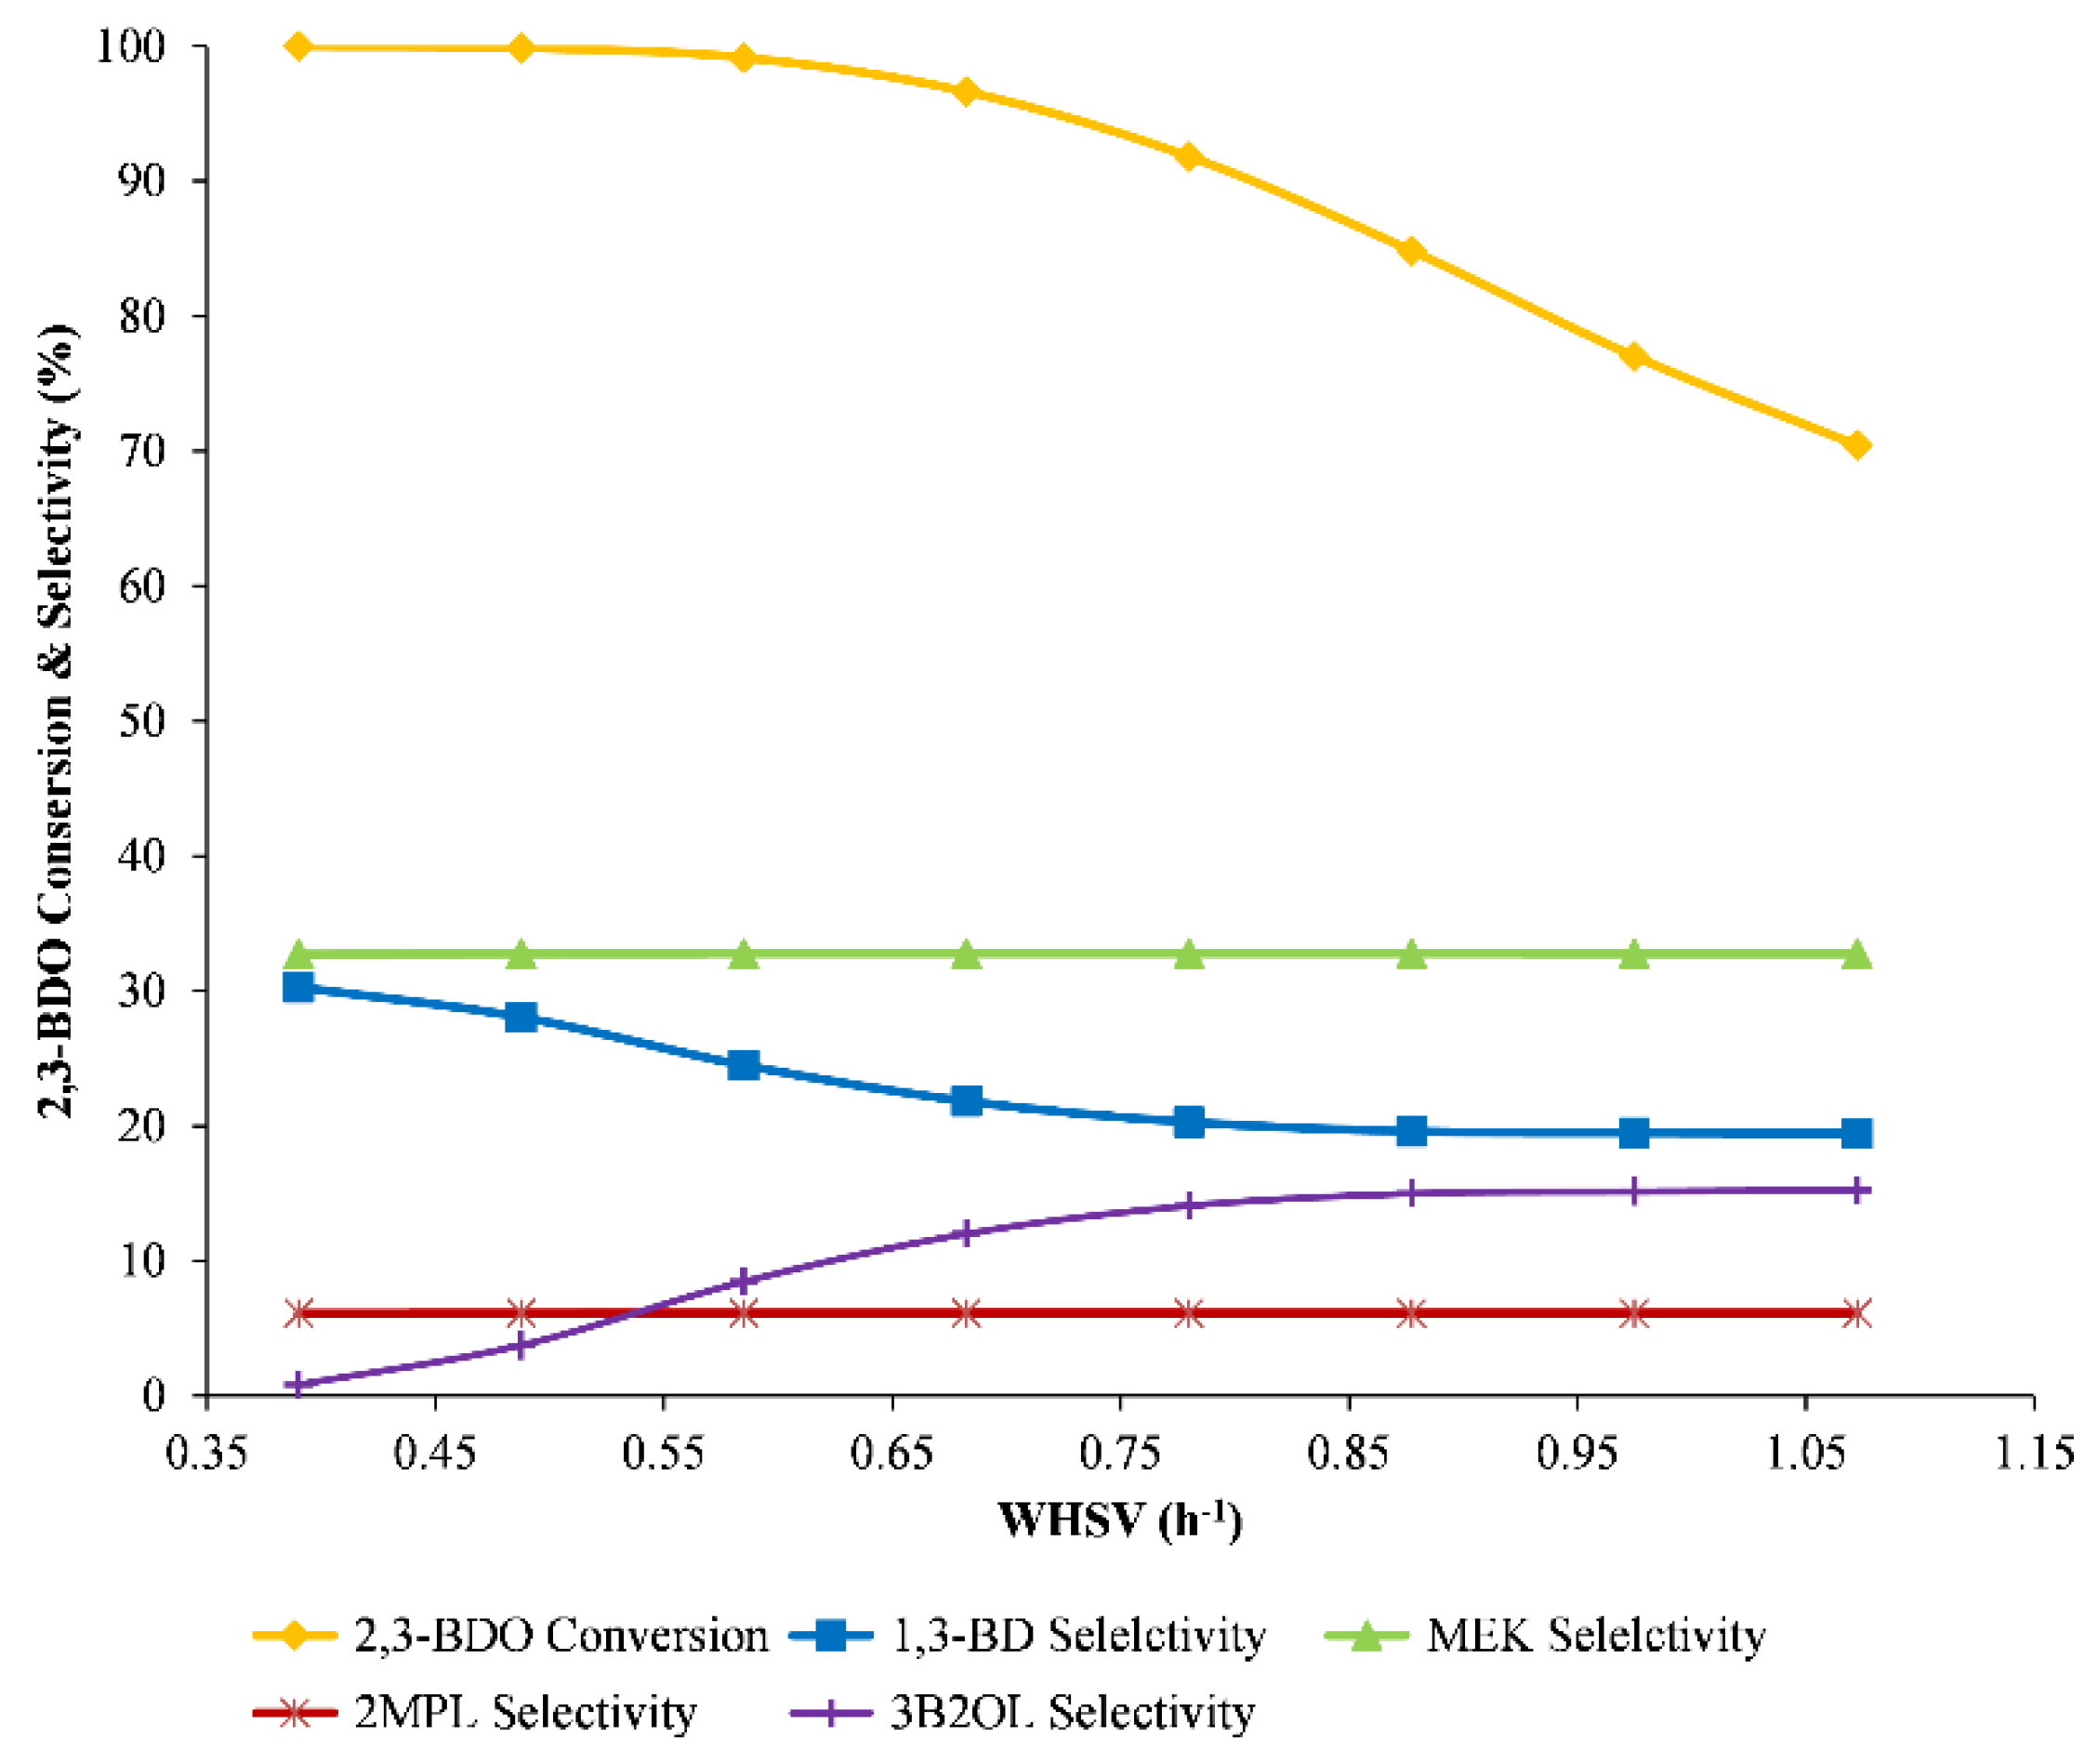
We conducted the sensitivity analyses by adjusting major operating variables. WHSV, inlet temperature, and feed composition were modified to analyze the performance of the reactor model in terms of BDO conversion and components selectivity.

6.1. Effect of WHSV

As an obtained result from experimental data, the high value of WHSV (2 h−1) reflects the low efficiency of the reaction. Thus, the range of WHSV from 0.39 to 1.07 h−1 was considered to investigate the effect of WHSV. The reactor model operating conditions were maintained at 330 °C and 1 bar. The simulation result is shown in Figure 8. With the increase of WHSV, the 2,3-BDO conversion rate decreased from approximately 100% to 70%. The resulting line goes down significantly from the point 0.68 of WHSV. This indicated that although increasing WHSV raises the outlet product flow rate, the WHSV condition should be lower than 0.65 h−1.

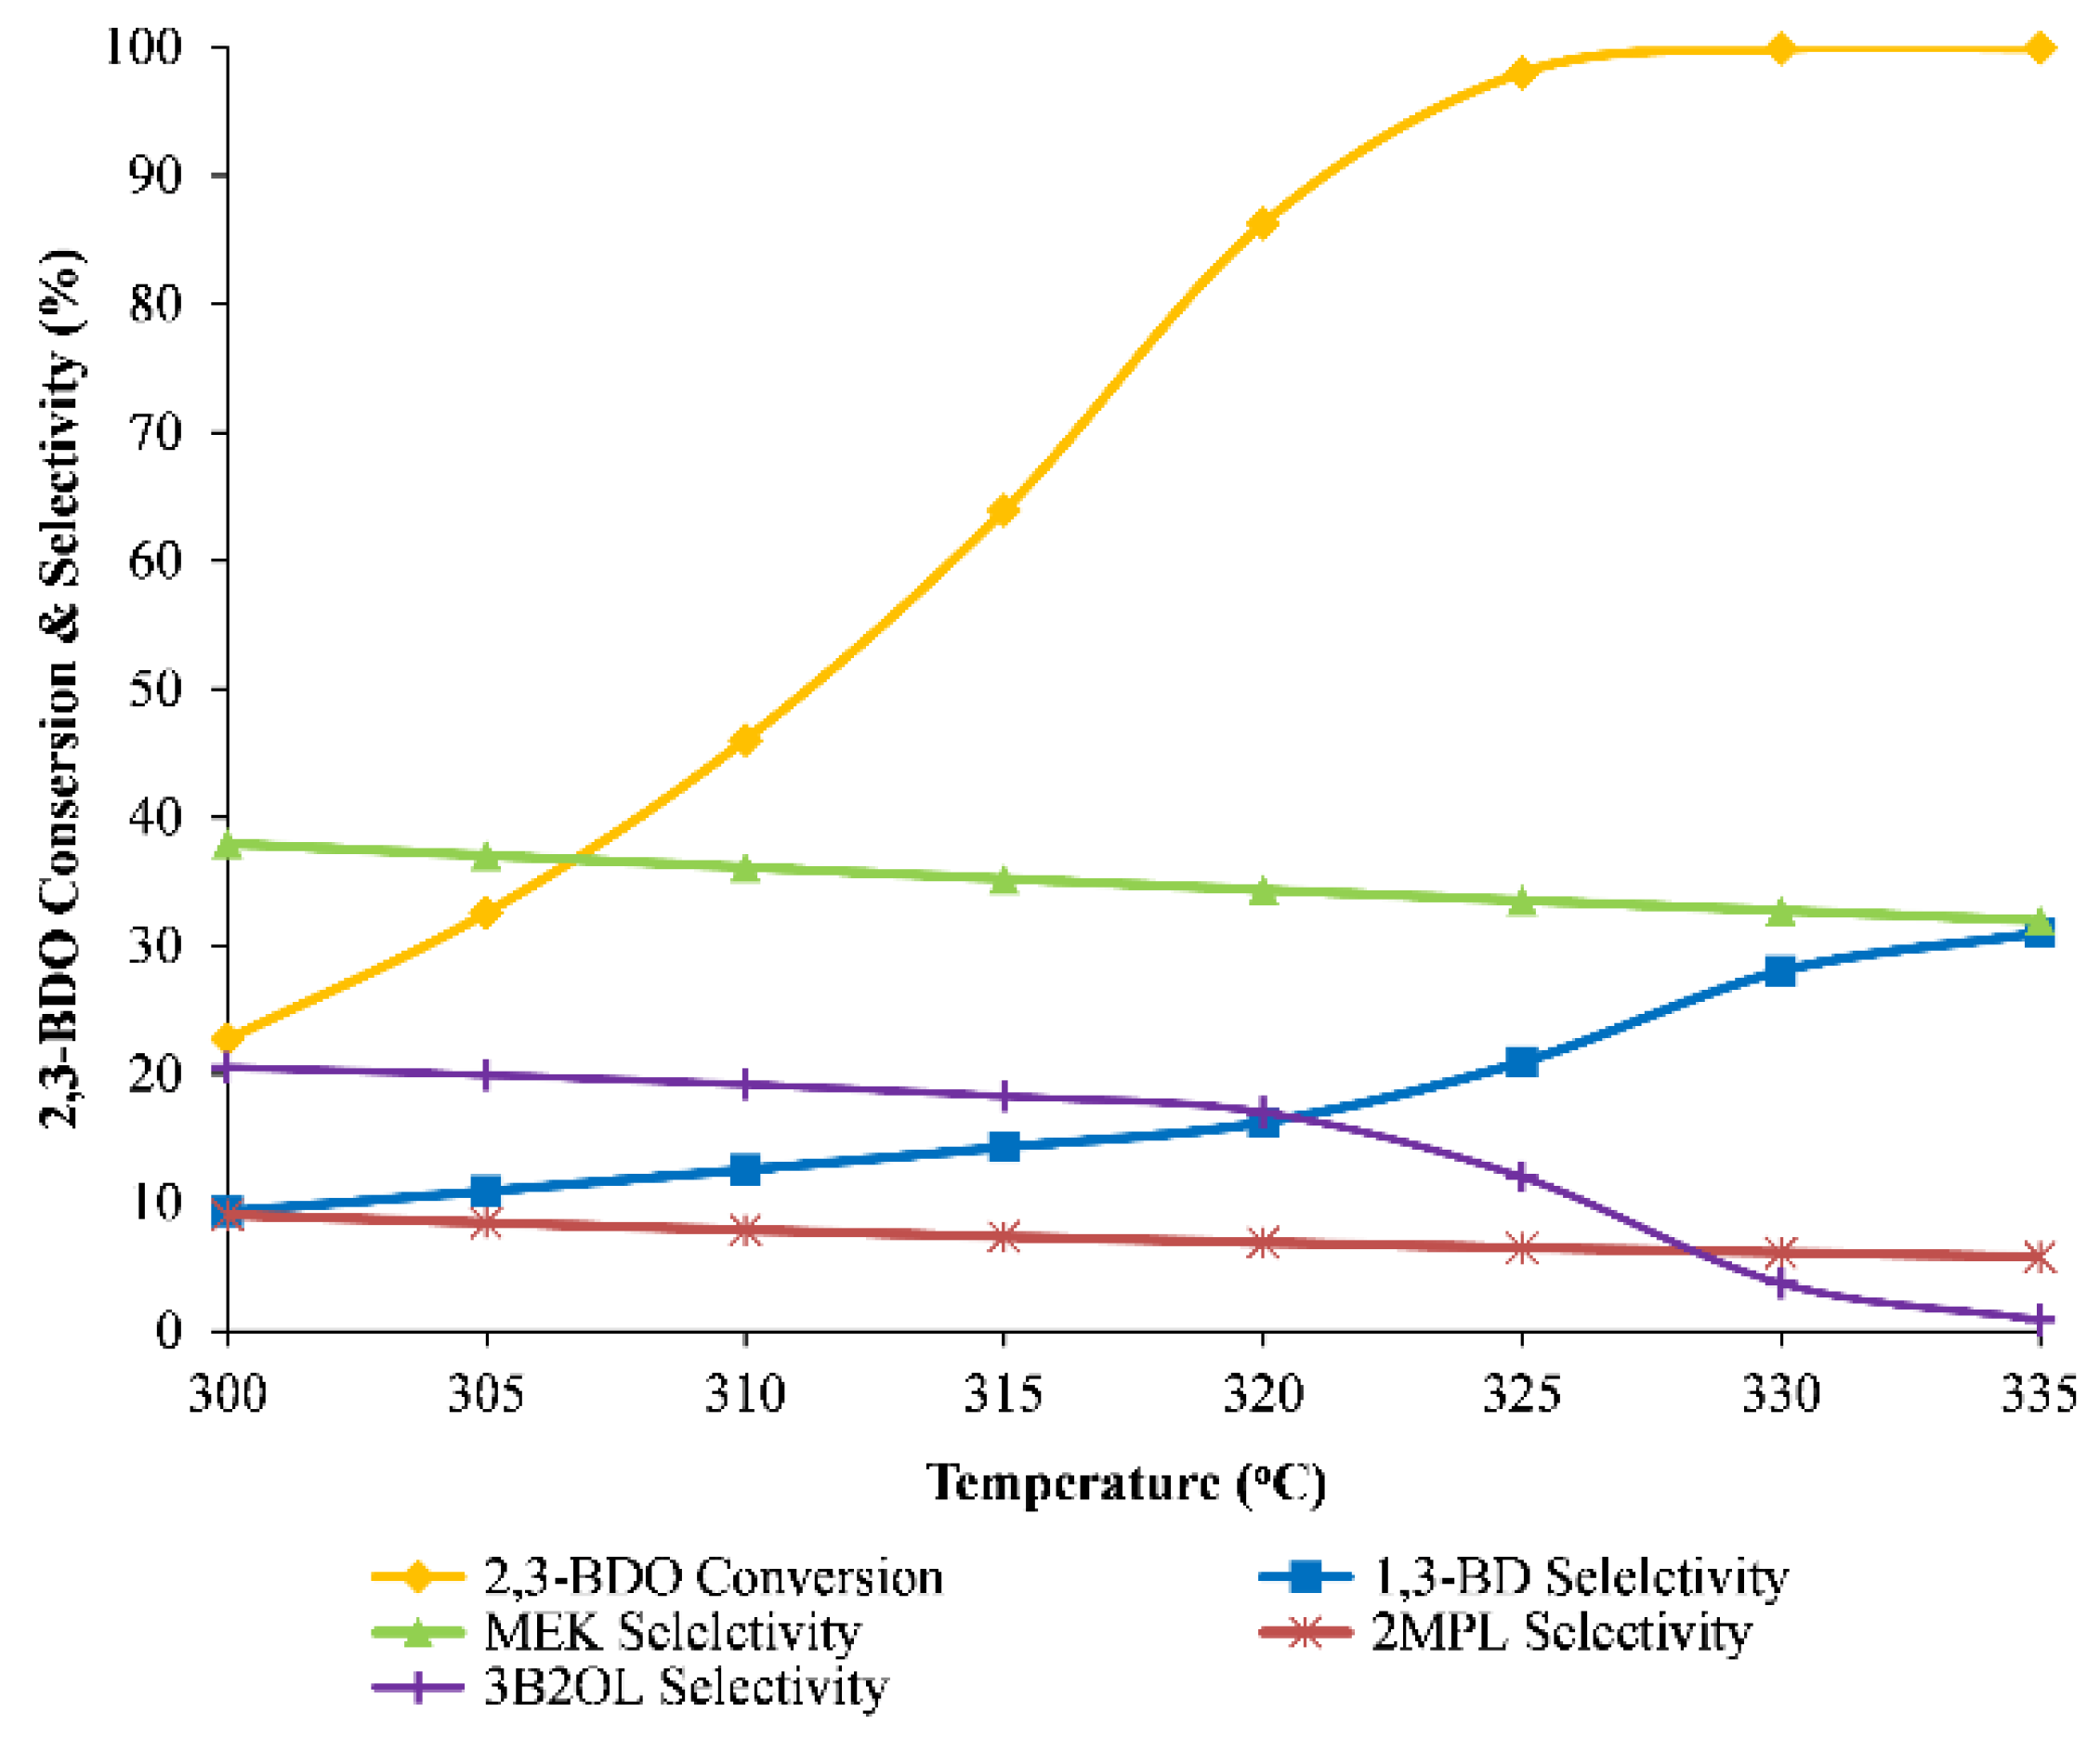
6.2. Effect of Inlet Temperature

The feed stream temperature at the beginning of the catalyst bed was investigated while the WHSV is kept at 0.5 h−1. Figure 9 shows that almost complete conversion of 2,3-BDO is achieved when the temperature is higher than 330 °C. The overall 2,3-BDO conversion rises from 23% to 98% in the range 300–325 °C and attains 99.9% at 335 °C. Through the increase of temperature, the 1,3-BD selectivity increases considerably from 9.3% to 31%, while MEK selectivity reduces slightly from 37% to 32%. This can be explained by the activation differences of the related reaction mentioned in Section 5.2. However, the concentration of impurities increased sharply when the inlet temperature is higher than 340 °C [21]. The result shows that the reactor should be operated in the temperature range of 330–340 °C.

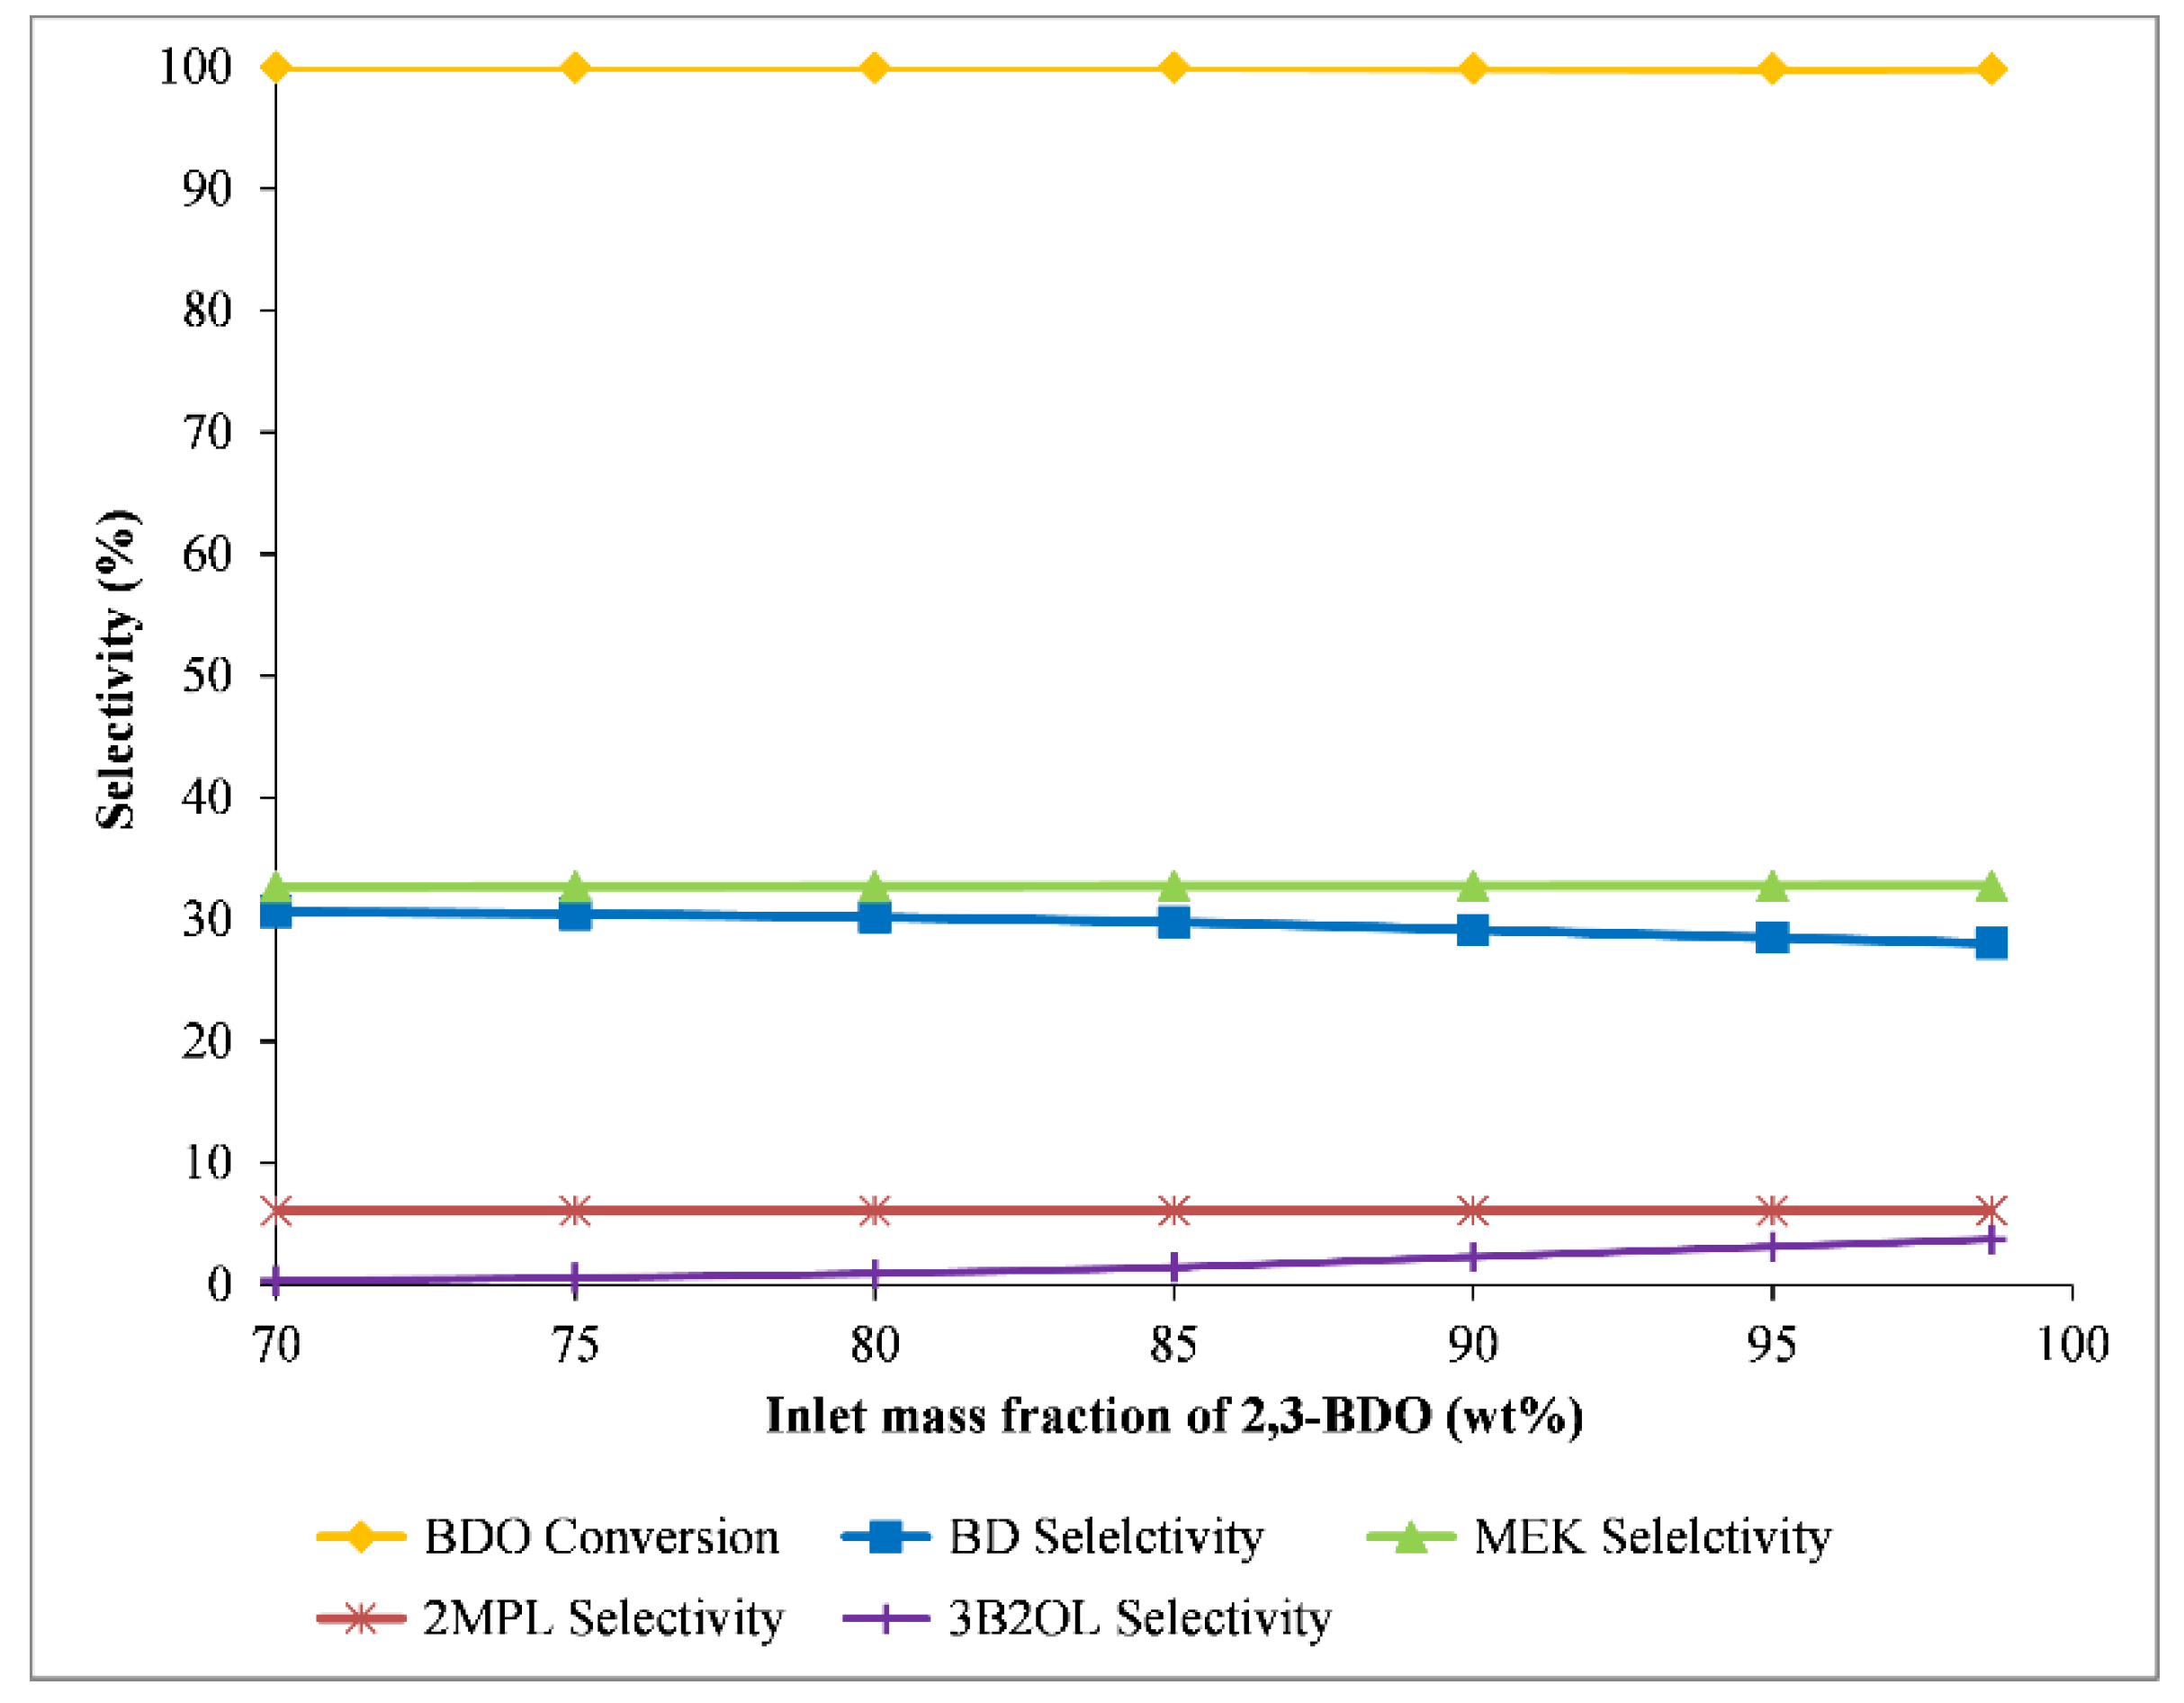
6.3. Effect of Feed Composition

Due to external factors affecting plant operation, the feed composition is not stable at all operating times. Thus, the mass fraction of BDO was varied from 98.6% to 70% to check the effect of feed composition. The rest of the feed composition is H2O. The operating conditions (inlet temperature, 330 °C, and WHSV, 0.5 h−1) were chosen for the sensitivity analysis. The results are presented in Figure 10. Although the inlet BDO decreased to approximately 30%, the MEK selectivity was stable at around 32.7%. The 1,3-BD selectivity increased slightly from 28% to 30.6%, while the 3B2OL selectivity reduced from 3.7% to 0.3%. The results suggest that the high selectivity of the desired product (MEK and 1,3-BD) could be achieved with low purity of 2,3-BDO feedstock. This means that the high concentration 2,3-BOD is not necessary for the dehydration reaction. The concentration is determined by the purification process of a Biofermentation process to produce 2,3-BDO [11]. This concentration issue would lead to a trade-off relationship between production costs and 2,3-BOD concentration. The trade-off relationship should be studied as part of the whole process, including Biofermentation and 2,3-BDO dehydration processes.

7. Conclusions

This paper presented the numerical analysis data and validating results of the 1D heterogeneous reactor model with the pilot-scale fixed bed reactor data for the 2,3-BDO dehydration reaction. From the numerical analysis data, we can get useful insights on the reaction characteristics that affect the reactor performance. For validation, twelve experiments were conducted under various conditions: the inlet temperature was controlled in the range 299–343 °C, and WHSV was varied from 0.5 h−1 to 2 h−1. In all cases, the errors in validated temperature results were lower than 3%. The model showed good agreement with 2,3-BDO conversion and selectivity of target products (MEK and 1,3-BD). It is evident that the reactor model is satisfactory for analyzing the catalyst bed behavior.
The sensitivity analysis was investigated based on the change of the WHSV, the inlet temperature, and the feed composition. The stable and efficient operation conditions were found to be lower than 0.65 h−1 of WHSV, and 330–340 °C of inlet temperature. Also, the high selectivity of MEK and 1,3-BD was not affected by the inlet 2,3-BDO concentration. This concentration issue would lead to a trade-off relationship between production costs and 2,3-BD concentration. The trade-off relationship should be studied as part of the whole process, including Biofermentation and 2,3-BDO dehydration processes. The techno-economic analysis of the whole process will be studied further. The data obtained from the experiments and models was valuable in designing a commercial 2,3-BDO dehydration plant.

Supplementary Materials

The following materials are available online at https://0-www-mdpi-com.brum.beds.ac.uk/article/10.3390/catal11080999/s1, Table S1. Specification of the reactor, Table S2. Reaction rate equations and kinetic parameters, TableS3. The pertinent correlations and equations for the 1D heterogeneous model.

Author Contributions

Conceptualization, D.S.; methodology, D.S.; software D.S., writing—reviews and editing D.S., S.-Y.C., T.-T.V., H.-P.-Y.D. and E.K.; funding acquisition, D.S., S.-Y.C. All authors have read and agreed to the published version of the manuscript.

Funding

This research was funded by the National Research Foundation of Korea (NRF) grant funded by the Korea government (MSIT) (No. 2019R1G1A1003364) and the National Research Foundation of Korea (NRF) grant funded by the Korea government (MSIT) (No. 2021R1F1A1048416).

Acknowledgments

The authors also express sincere gratitude to the RFB project by the Ministry of Trade, Industry and Energy.

Conflicts of Interest

The authors declare no conflict of interest.

References

  1. Nguyen, N.T.T.; Matei-Rutkovska, F.; Huchede, M.; Jaillardon, K.; Qingyi, G.; Michel, C.; Millet, J.M.M. Production of 1,3-butadiene in one step catalytic dehydration of 2,3-butanediol. Catal. Today 2019, 323, 62–68. [Google Scholar] [CrossRef]
  2. Kim, J.S.; Lee, Y.Y.; Kim, T.H. A review on alkaline pretreatment technology for bioconversion of lignocellulosic biomass. Bioresour. Technol. 2016, 199, 42–48. [Google Scholar] [CrossRef] [PubMed]
  3. Ji, X.J.; Huang, H.; Ouyang, P.K. Microbial 2,3-butanediol production: A state-of-the-art review. Biotechnol. Adv. 2011, 29, 351–364. [Google Scholar] [CrossRef]
  4. Hazeena, S.H.; Sindhu, R.; Pandey, A.; Binod, P. Lignocellulosic bio-refinery approach for microbial 2,3-Butanediol production. Bioresour. Technol. 2020, 302, 122873. [Google Scholar] [CrossRef]
  5. Shylesh, S.; Gokhale, A.A.; Scown, C.D.; Kim, D.; Ho, C.R.; Bell, A.T. From sugars to wheels: The conversion of ethanol to 1,3-butadiene over metal-promoted magnesia-silicate catalysts. ChemSusChem 2016, 9, 1462–1472. [Google Scholar] [CrossRef] [PubMed] [Green Version]
  6. Makshina, E.V.; Dusselier, M.; Janssens, W.; Degreve, J.; Jacobs, P.A.; Sels, B.F. Review of old chemistry and new catalytic advances in the on-purpose synthesis of butadiene. Chem. Soc. Rev. 2014, 43, 7917–7953. [Google Scholar] [CrossRef] [Green Version]
  7. González, G.M.C.; Perales, A.L.V.; Campoy, M.; Beltran, J.R.L.; Martínez, A.; Vidal-Barrero, F. Kinetic modelling of the one-step conversion of aqueous ethanol into 1,3-butadiene over a mixed hemimorphite-HfO2/SiO2 catalyst. Fuel Process. Technol. 2021, 216, 106767. [Google Scholar] [CrossRef]
  8. Halawy, S.A.; Mohamed, M.A.; Abdelkader, A. Hierarchical nanocrystalline NiO with coral-like structure derived from nickel galactarate dihydrate: An active mesoporous catalyst for methyl ethyl ketone production. Arab. J. Chem. 2018, 11, 991–999. [Google Scholar] [CrossRef]
  9. Hoppe, F.; Burke, U.; Thewes, M.; Heufer, A.; Kremer, F.; Pischinger, S. Tailor-Made Fuels from Biomass: Potentials of 2-butanone and 2-methylfuran in direct injection spark ignition engines. Fuel 2016, 167, 106–117. [Google Scholar] [CrossRef]
  10. Thion, S.; Diévart, P.; van Cauwenberghe, P.; Dayma, G.; Serinyel, Z.; Dagaut, P. An experimental study in a jet-stirred reactor and a comprehensive kinetic mechanism for the oxidation of methyl ethyl ketone. Proc. Combust. Inst. 2017, 36, 459–467. [Google Scholar] [CrossRef]
  11. Song, D.; Yoon, Y.-G.; Lee, C.-J. Conceptual design for the recovery of 1,3-Butadiene and methyl ethyl ketone via a 2,3-Butanediol-dehydration process. Chem. Eng. Res. Des. 2017, 123, 268–276. [Google Scholar] [CrossRef]
  12. Winfield, M.E. The catalytic dehydration of 2,3-butanediol to 1,3-Butadiene. J. Sci. Ind. Res. 1945, 412–423. [Google Scholar]
  13. Zhang, W.; Yu, D.; Ji, X.; Huang, H. Efficient dehydration of bio-based 2,3-butanediol to butanone over boric acid modified HZSM-5 zeolites. Green Chem. 2012, 14, 3441–3450. [Google Scholar] [CrossRef]
  14. Torok, B.; Bucsi, I.; Beregszászi, T.; Kapocsi, I.; Molnár, Á. Transformation of diols in the presence of heteropoly acids under homogeneous and heterogeneous condition. J. Mol. Catal. A Chem. 1996, 107, 305–311. [Google Scholar] [CrossRef]
  15. Tsukamoto, D.; Sakami, S.; Ito, M.; Yamada, K.; Yonehara, T. Production of bio-based 1,3-butadiene by highly selective dehydration of 2,3-butanediol over SiO2-supported cesium dihydrogen phosphate catalyst. Chem. Lett. 2016, 45, 831–833. [Google Scholar] [CrossRef] [Green Version]
  16. Duan, H.; Yamada, Y.; Sato, S. Efficient production of 1,3-butadiene in the catalytic dehydration of 2,3-butanediol. Appl. Catal. A Gen. 2015, 491, 163–169. [Google Scholar] [CrossRef]
  17. Kim, W.; Shin, W.; Lee, K.J.; Cho, Y.; Kim, H.S.; Filimonov, I.N. 2,3-Butanediol dehydration catalyzed by silica-supported alkali phosphates. Appl. Catal. A Gen. 2019, 570, 148–163. [Google Scholar] [CrossRef]
  18. Song, D. Kinetic model development for dehydration of 2,3-butanediol to 1,3-butadiene and methyl ethyl ketone over an amorphous calcium phosphate catalyst. Ind. Eng. Chem. Res. 2016, 55, 11664–11671. [Google Scholar] [CrossRef]
  19. Song, D. Development of a deactivation model for the dehydration of 2,3-butanediol to 1,3-butadiene and methyl ethyl ketone over an amorphous calcium phosphate catalyst. Ind. Eng. Chem. Res. 2017, 56, 11013–11020. [Google Scholar] [CrossRef]
  20. Song, D. Modeling of a Pilot-Scale Fixed-Bed Reactor for Dehydration of 2,3-Butanediol to 1,3-Butadiene and Methyl Ethyl Ketone. Catalysts 2018, 8, 72. [Google Scholar] [CrossRef] [Green Version]
  21. Song, D. Method of Preparing 1,3-Butadiene and Methyl Ethyl Ketone from 2,3-Butanediol Using Adiabatic Reactor. U.S. Patent 9,884,800 B2, 2 August 2018. [Google Scholar]
  22. Ergun, S. Fluid Flow Through Packed Columns. Chem. Eng. Prog. 1952, 48, 89–94. [Google Scholar]
  23. Hougen, O. Engineering aspects of solid catalysts. Ind. Eng. Chem. 1961, 53, 509–528. [Google Scholar] [CrossRef]
  24. Dixon, A.G. An improved equation for the overall heat transfer coefficient in packed beds. Chem. Eng. Process. 1996, 35, 323–331. [Google Scholar] [CrossRef]
  25. Specchia, V.; Baldi, G.; Sicardi, S. Heat transfer in packed bed reactors with one phase flow. Chem. Eng. Commun. 1980, 4, 361–380. [Google Scholar] [CrossRef]
Figure 1. The dehydration of the 2,3-BDO pilot system [20].
Catalysts 11 00999 g001
Figure 2. A schematic representation of the adiabatic reactor [20].
Catalysts 11 00999 g002
Figure 3. Profiles of the molar fractions of components (a), temperature (b), and reaction rates (c) in the catalyst under the inlet conditions of the reactor.
Catalysts 11 00999 g003
Figure 4. Profiles of the molar fractions of components (a), reaction rates (b), and effectiveness factors (c) along the length of the catalyst bed.
Catalysts 11 00999 g004
Figure 5. The temperature profile comparison between simulation and third experimental data.
Catalysts 11 00999 g005
Figure 6. The simulated temperatures and experimental temperatures at 7 points (0, 38, 88, 138, 188, 238, and 288 mm from top of the catalyst bed).
Catalysts 11 00999 g006
Figure 7. (a) 2,3-BDO conversion, (b) The selectivity of major components. (Run x: Experimental test x).
Catalysts 11 00999 g007
Figure 8. The influence of WHSV on reactor performance.
Catalysts 11 00999 g008
Figure 9. The influence of inlet temperature on reactor performance.
Catalysts 11 00999 g009
Figure 10. The influence of feed composition on reactor performance.
Catalysts 11 00999 g010
Table 1. The testing conditions.
Run 1Run 2Run 3Run 4Run 5Run 6
Inlet temperature(°C)300310330302309320
Outlet temperature (°C)299308328299308316
WHSV (/h)0.50.480.51.011.030.99
Pressure (bar)0.220.210.20.190.20.321
N2 (g/h)393391392392390392
Run 7Run 8Run 9Run 10Run 11Run 12
Inlet temperature (°C)332302311320329343
Outlet temperature (°C)324299308316323329
WHSV (/h)0.982.022.012.021.981.99
Pressure (bar)0.210.190.20.190.20.2
N2 (g/h)393391393394392395
Publisher’s Note: MDPI stays neutral with regard to jurisdictional claims in published maps and institutional affiliations.

