
Performance Evaluation of Selenite (SeO32−) Reduction by Enterococcus spp.


Water Utilisation and Environmental Engineering Division, Department of Chemical Engineering, University of Pretoria, Pretoria 0002, South Africa
*
Author to whom correspondence should be addressed.
Catalysts 2021, 11(9), 1024; https://0-doi-org.brum.beds.ac.uk/10.3390/catal11091024
Submission received: 14 July 2021
/
Revised: 19 August 2021
/
Accepted: 23 August 2021
/
Published: 24 August 2021
(This article belongs to the Special Issue Biocatalysis for Green Chemistry)
Abstract
:Lactic acid bacteria (LAB) such as Enterococcus spp. have an advantage over several bacteria because of their ability to easily adapt to extreme conditions which include high temperatures, highly acidic or alkaline conditions and toxic metals. Although many microorganisms have been shown to reduce selenite (SeO32−) to elemental selenium (Se0), not much work has been done on the combined effect of Enterococcus spp. In this study, aerobic batch reduction of different selenite concentrations (1, 3 and 5 mM) was conducted using Enterococcus hermanniensis sp. and Enterococcus gallinarum sp. (3.5 h, 35 ± 2 °C, starting pH > 8.5). Results from the experiments showed that the average reductions rates were 0.608, 1.921 and 3.238 mmol·(L·h)−1, for the 1, 3 and 5 mM SeO32− concentrations respectively. In addition, more selenite was reduced for the 5 mM concentration compared to the 1 and 3 mM concentrations albeit constant biomass being used for all experiments. Other parameters which were monitored were the glucose consumption rate, protein variation, pH and ORP (oxidation reduction potential). TEM analysis was also conducted and it showed the location of electron-dense selenium nanoparticles (SeNPs). From the results obtained in this study, the authors concluded that Enterococcus species’s high adaptability makes it suitable for rapid selenium reduction and biosynthesis of elemental selenium.
1. Introduction
Selenium (Se) is an essential micronutrient for both plants and animals. Selenium is termed a double-edged element because of its narrow range of acceptable concentrations. Concentrations below 40 µg·d−1 are considered a dietary deficiency, whereas once the concentrations exceed 400 µg·d−1, Se becomes toxic to living organisms [1]. Industrial practices such as petrol refining and mining as well as other agricultural discharges [2] lead to selenium-laden water, which is a major environmental concern. In the aquatic environment, selenate (SeO42−) and selenite (SeO32−) are the dominant selenium species. Both oxyanions are known to be toxic, soluble in water and bio-accumulate in the food chain, even at low concentrations [3,4]. Of the two selenium oxyanions mentioned above, SeO32− is more toxic, the most reactive due to its polar character and basicity [5], and is typically found in mildly oxidising acidic environments [6], thus making it the selenium species of most concern.
Selenite can be reduced to elemental selenium (Se0), in the form of selenium nanoparticles (SeNPs), which have low bioavailability and are relatively less toxic [7,8]. The reduction of SeO32− to Se0 has been reported in several microorganisms and the most notable examples include Pseudomonas fluorescens and most recently Pseudomonas stutzeri NT-I [4,9]. However, not many studies have demonstrated the rapid reduction of selenite (under 4 h) by a group of Enterococcus species. To date, a number of enterococcus species have been individually investigated for selenium bioremediation, and though reduction has been reported, it has never been as rapid. Enterococcus faecalis has been shown to biosynthesise selenium nanoparticles from selenite reduction [10]. Another example is of E. faecium, which removed 9.91 mg·L−1 and 59.70 mg·L−1 selenite after 24 h. In this study, Enterococcus spp. were used for selenite reduction and the biosynthesis of SeNPs in a rapid reduction reaction not previously reported with respect to specific Enterococcus strains.
Biologically synthesised SeNPs show particular spectral and optical properties [11] and are attracting growing interest for possible applications in different fields of nanotechnology (due to their photoconductivity), medicine (due to their antimicrobial and anticancer activities) and environmental biotechnology (e.g., due to their mercury capturing properties) [12]. Therefore, it is imperative to find microorganisms with a high conversion of SeO32− to SeNPs. This will in turn strengthen the case for the suitability of microbial reduction as a potential synthesis method for the bioproduction of selenium nanoparticles.
Literature suggests that SeO32− reduction can occur aerobically via detoxification [1,6], via Painter-type reactions (Equation (1)) [13,14] or with the aid of siderophores [15,16], as a form of self-defence.
4RSH + H2SeO3 → RS-Se-SR + RSSR + H2O
Painter type reactions such as the one shown above are thermodynamically favourable reactions, and these involve selenium oxyanions and the reduced thiol groups of proteins that result in the formation of selenotrisulphides (RS-Se-SR) [17]. Moreover, reduction can also take place anaerobically via periplasmic nitrate and sulphite reductases [2,18].
In the reduction of selenium using bacteria, carbon sources such as molasses, glucose [19], lactate, ethanol and woodchips [20] can be utilised by the bacteria. For example, Yuxia Ji and Yi-Tin Wang (2017) demonstrated selenite bioreduction using a genetically modified Escherichia coli strain, EWB32213, which included the consumption of a carbon and nitrogen source coupled with the synthesis of biomass [9].
As already stated, the Enterococcus hermanniensis sp. and Enterococcus gallinarum sp. employed in this study fall under lactic acid bacteria comprising of both pathogenic and commensal microorganisms ubiquitous in the environment [21]. They usually inhabit the alimentary tract of humans, and they can also be isolated from other environmental and animal sources. Enterococcus spp. are Gram-positive, catalase-negative, non-spore-forming and facultative anaerobic bacteria [22]. They are highly competitive because they are characteristically tolerant to extreme pHs (4.5–10), temperatures (5–65 °C) and high salt concentration [22,23].
In addition, a variety of Enterococcus strains have been reported to produce antimicrobial compounds including bacteriocins [21]. Bacteriocins are peptides produced by bacterial species in their ecological niches for self-preservation [24]. Some Enterococcus strains have a competitive edge over other microbial species in ecological niches because they harbour many bacteriocin-related genes simultaneously [25]. These features are useful in food applications against spoilage and pathogenic organism contamination [26]. They are also known to produce three types of enzymes that contribute to their opportunistic pathogenicity: hyaluronidase, gelatinase and serine protease [27].
Moreover, some bacterial strains are capable of secreting biomolecules or metabolites into their surrounding environments which participate in toxic metal remediation [15]. These biomolecules include proteins [28], siderophores [15,16], outer membrane vesicles [29] and extracellular polymeric substances (EPS) [30].
In this study, Enterococcus spp. was used in the aerobic batch reduction of SeO32− to Se0 and the elemental selenium was recovered and quantified.
2. Results
Tracking the variation of substrates and parameters in microbial processes is imperative as it aids in giving a clearer perspective on how microbes function and can assist in the optimisation of these processes. In order to study the mechanism of SeO32− to Se0 reduction, bacteria biomass was used to reduce various selenite concentrations (1, 3 and 5 mM), which were added as Na2SeO3.
The changes in the selenite, elemental selenium, protein and glucose concentrations, as well as variations in the ORP and pH, were monitored. In this study, aerobic batch experiments were conducted for 3.5 h, at 35 ± 2 °C, starting with a pH > 8.5 and a salinity of 5 g·L−1. Moreover, an average bacterial biomass of 5 g DW·L−1 (dry weight) was used in each set of experiments. Samples were taken at specific time intervals, and they were centrifuged (6000 rpm, 25 °C, 10 min) before any analysis was performed.
A control for each of the different concentrations was subjected to the same conditions, the only difference being the absence of the bacterial biomass throughout the experiment. No selenite reduction or any significant changes in the monitored parameters were observed. All experiments were done in triplicate unless stated otherwise. Therefore, n = 3 and the error bars represent the standard deviation.
2.1. Microbial Characterisation
Microbial characterisation was conducted on bacterial colonies which had been grown on agar plates laced with 100 mM of selenite. The colonies which had turned red (an indicator of the formation elemental selenium) were streaked once again and sent for analysis. This analysis was outsourced to Inqaba Biotechnical Industries (Pty) Ltd. The results for the characterisation are presented in the form of a phylogenetic tree (Figure S1 of the Supplementary Material). The BLAST results and 16S report (also attached as Supplementary Material) showed that the sequence was most similar to that of Enterococcus hermanniensis AY396048 and Enterococcus gallinarum MW175593. This indicated a mixed template; however, phylogenetic analysis based on the maximum likelihood method also placed the results within the Enterococcus spp. cluster (Figure S1). Moreover, besides being Gram-positive, Enterococcus spp. are known to be spherical or ovoid with sizes in the range of 0.6–2.0 µm by 0.6–2.5 µm, and this morphology is depicted in Figure S2 (Supplementary Material), which shows the SEM micrographs. Several studies have shown that in bioremediation of toxic metals, the use of a consortium or mixed culture can be more effective in the degradation of a contaminant. A group of strains can possess microbial interaction (like co-metabolism) which make them more effective compared to single strains. An example of this is a study by Cilliers et al. (2020) in which Pb(II) bio-removal was achieved via the use of an industrial microbial consortium [31].
2.2. The Growth of Enterococcus spp. in the Presence of Increasing SeO32− Concentrations
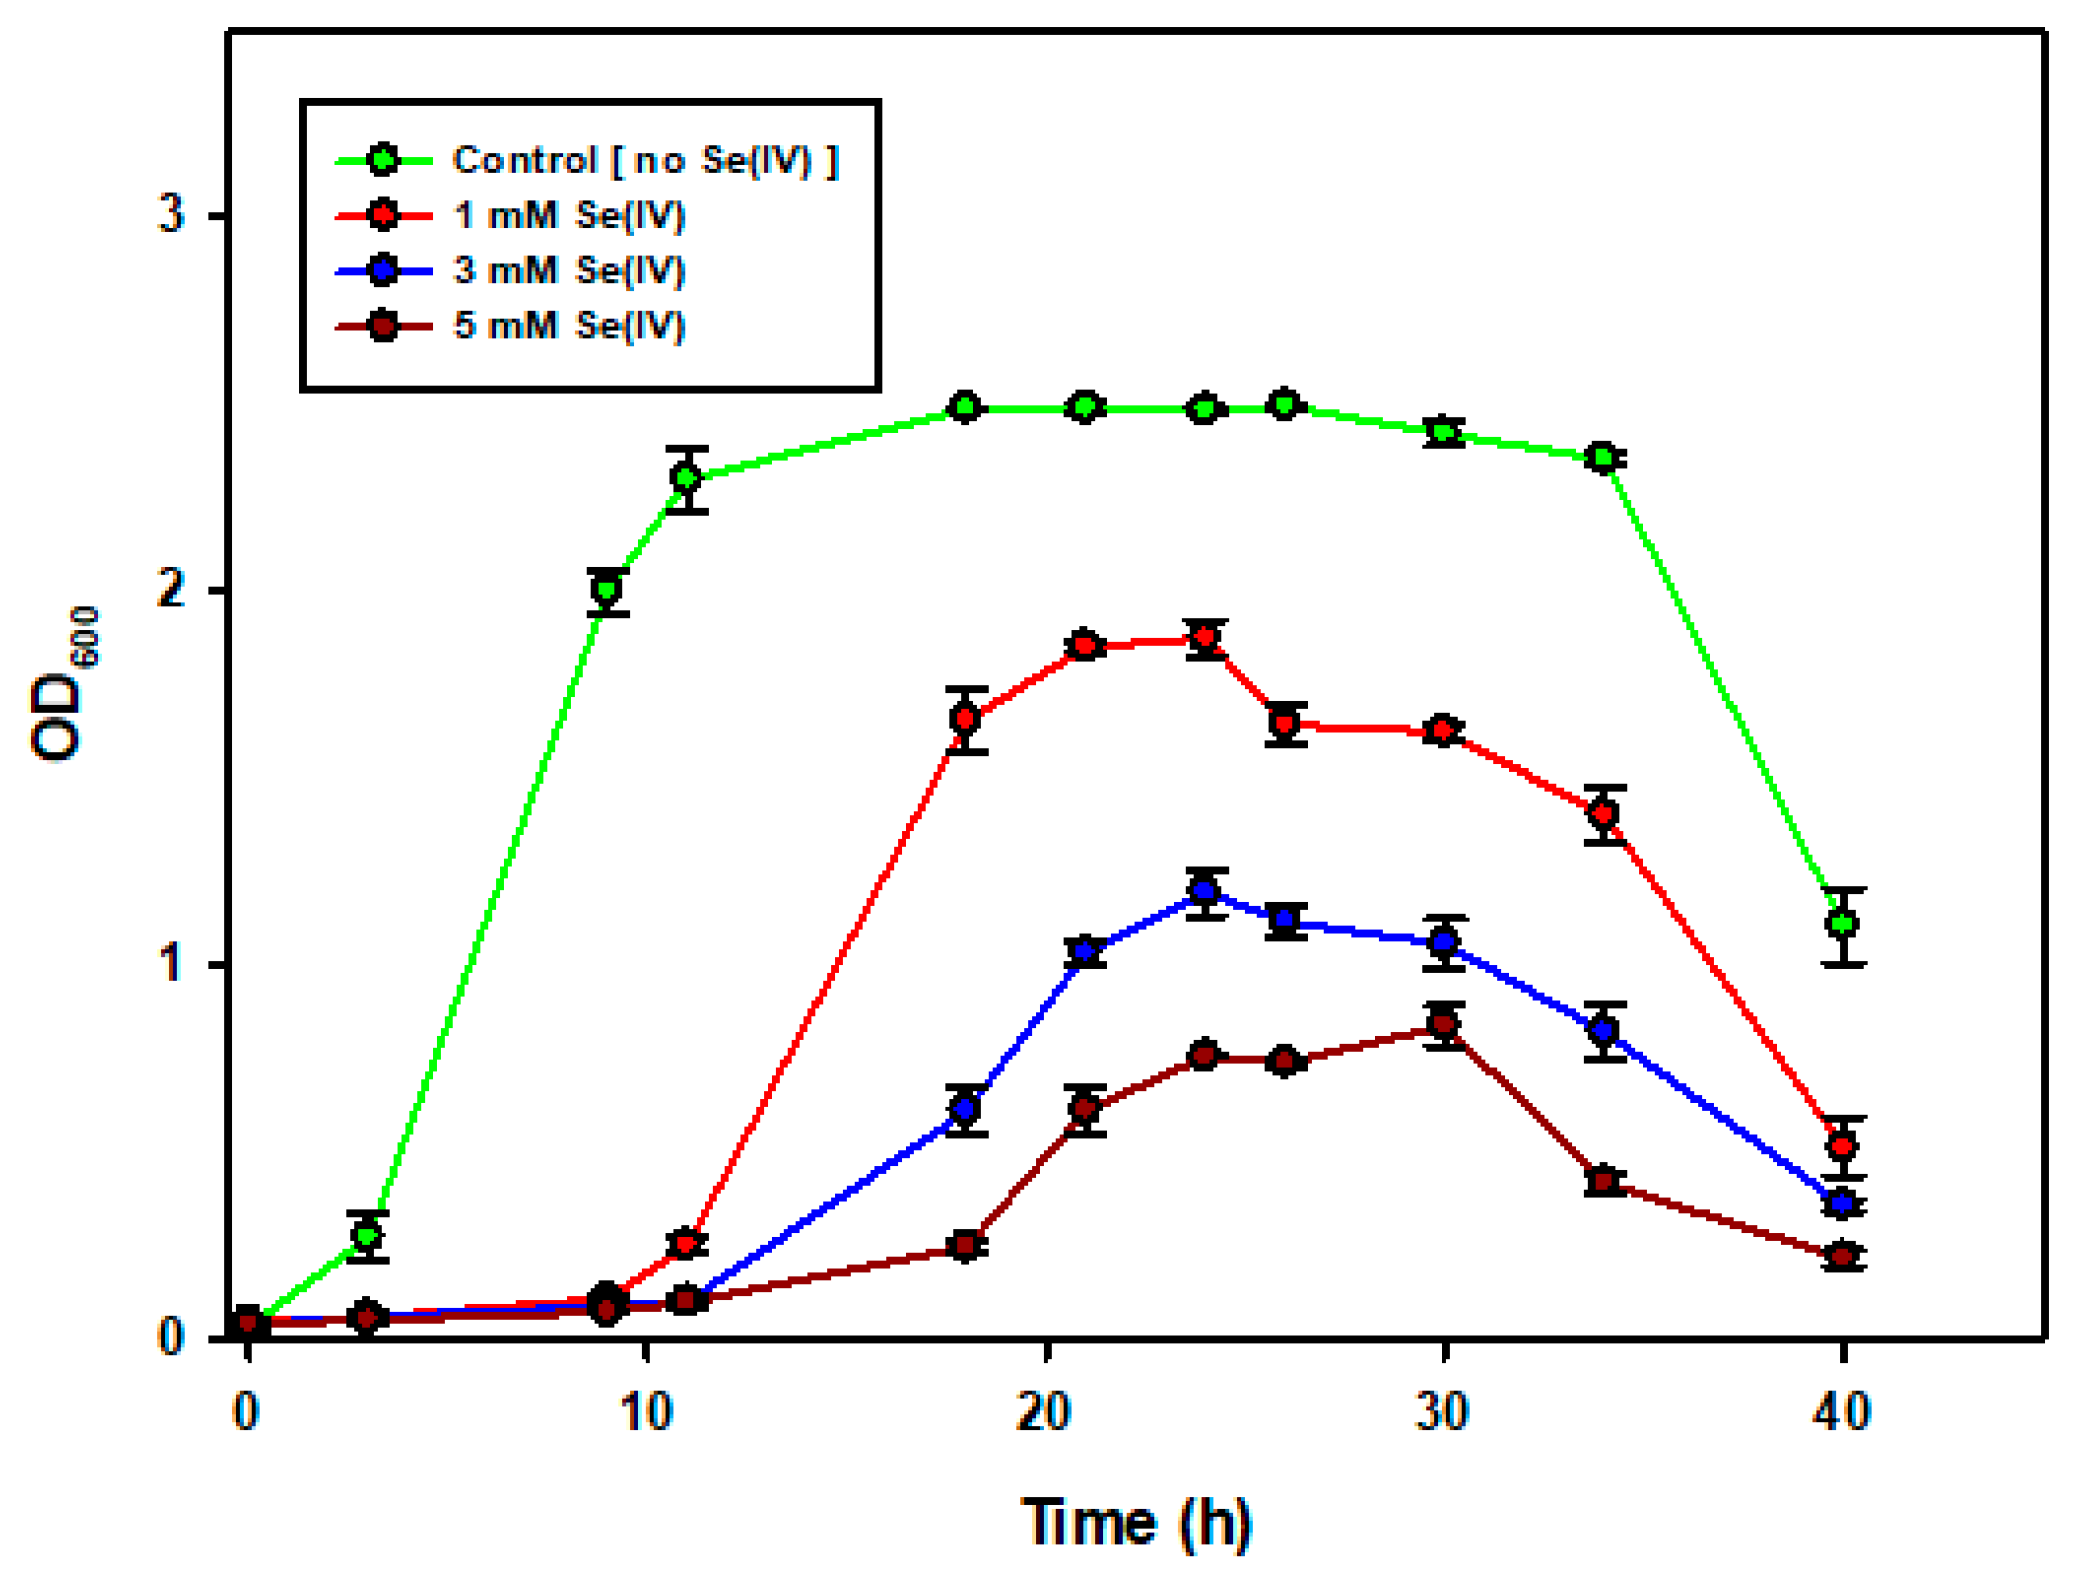
After culturing the bacteria for 24 h in TSB, 2 mL of the bacteria and spent broth were transferred into fresh TSB with different selenite concentrations (1, 3 and 5 mM). Across all the 3 concentrations, bacterial growth was hindered, an exception being the control, which also had fresh broth but no selenite. This was more evident after 40 h when the recorded OD600 was higher in the control compared to those flasks spiked with selenite. Figure 1 depicts this observed trend and it can be seen that there was an extension in the lag phase and the stationary phase was reached much later. Selenite has long been reported to affect bacterial growth and cause severe damage to the cells. The reason behind this is that it is thought to react with thiol groups of proteins with the production of free radicals, and it is these free radicals that damage the cells [32].
2.3. Minimum Inhibitory Concentration (MIC) Assay for SeO32− Tolerance
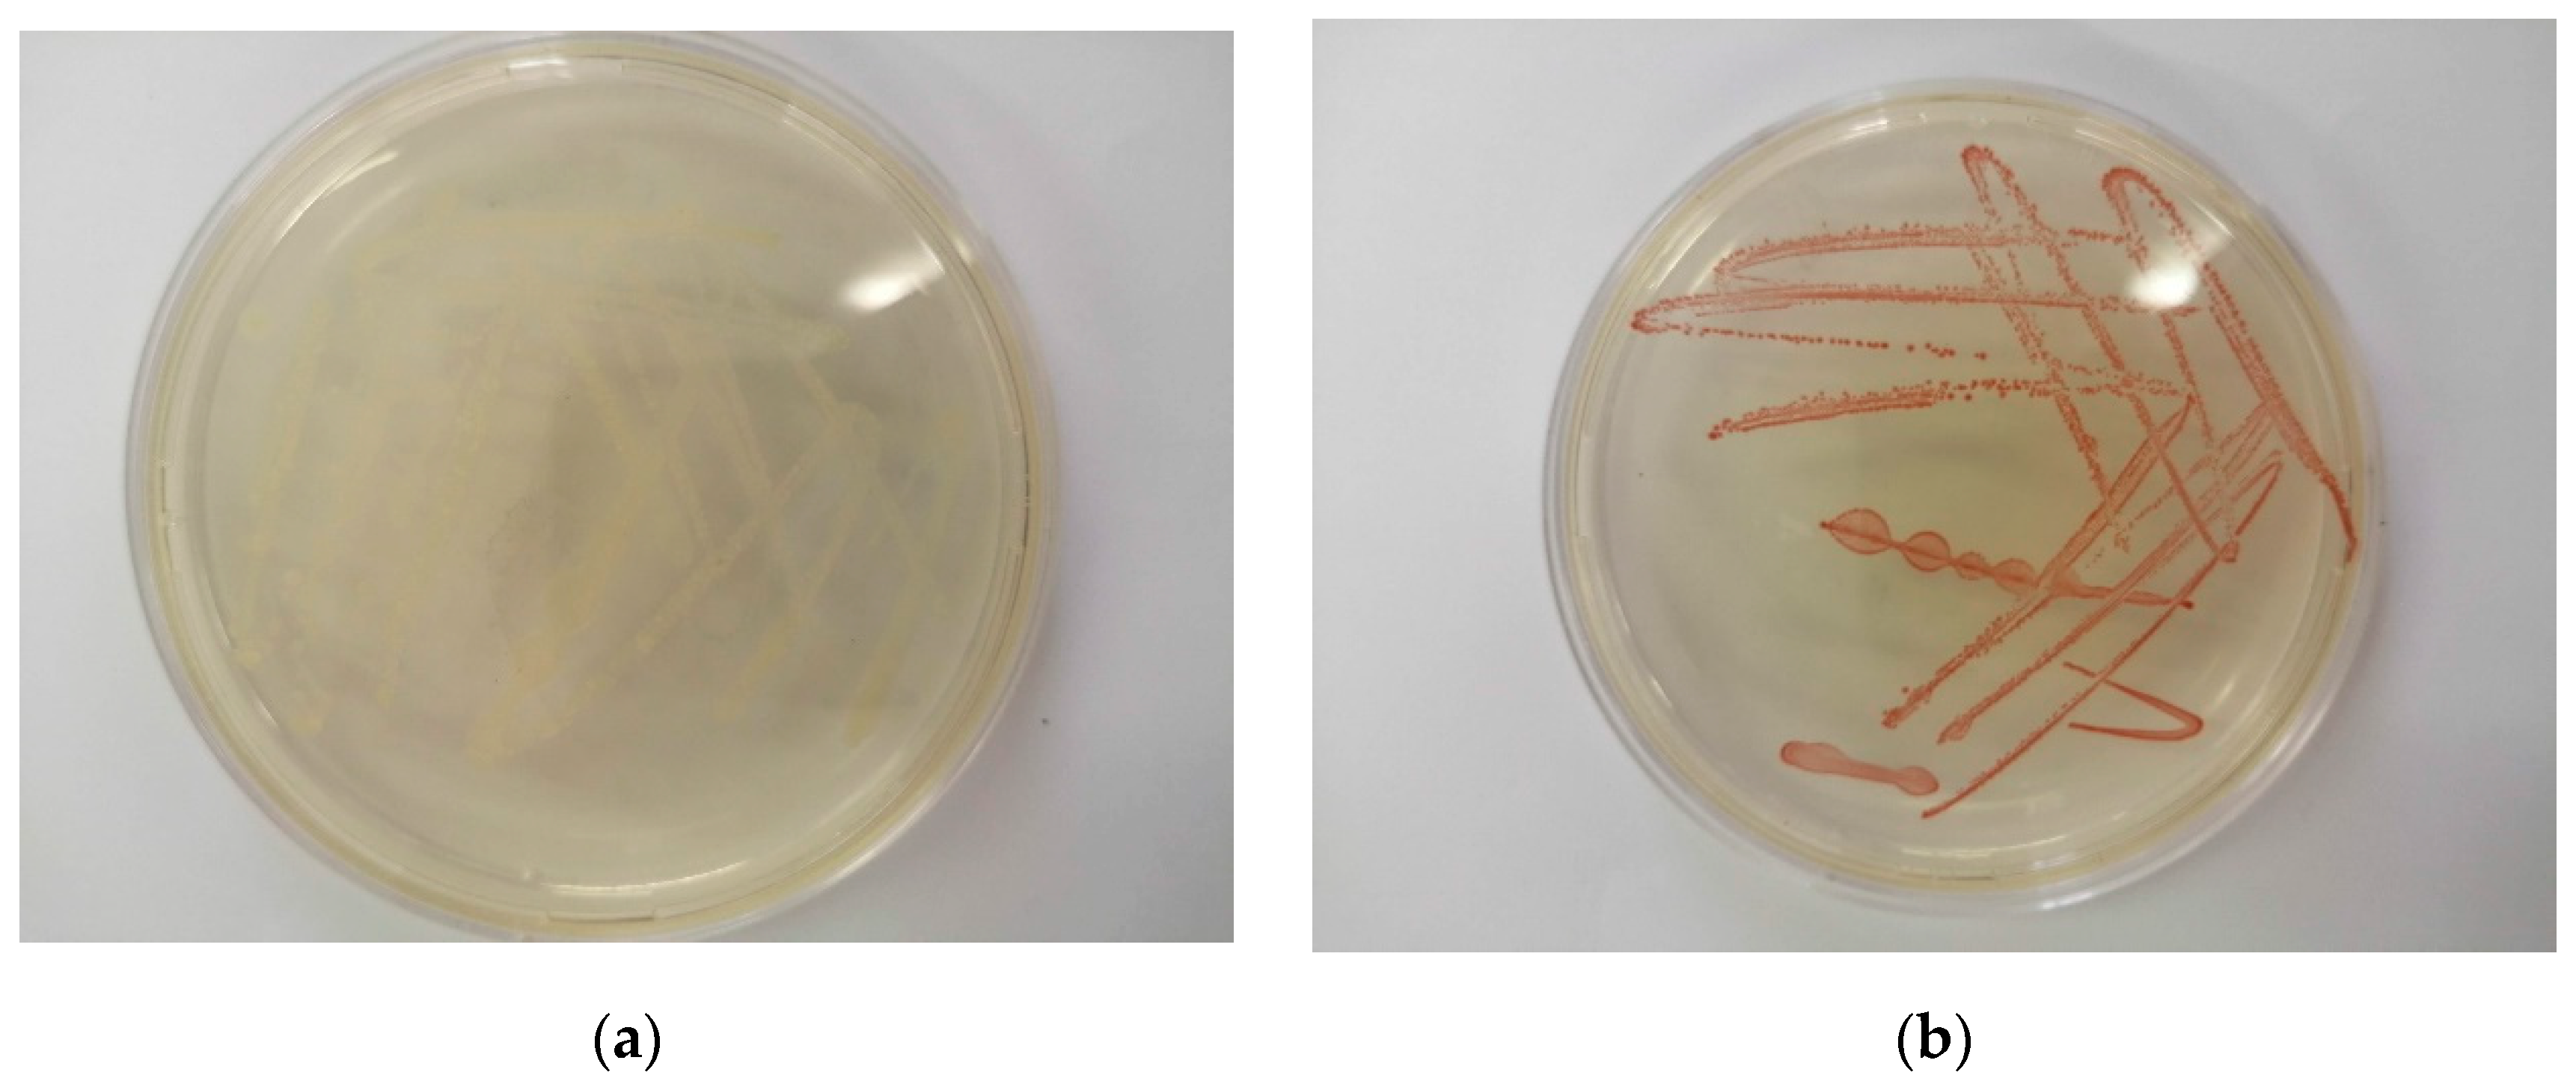
The minimum inhibitory concentration (MIC) is defined as the lowest concentration of the element at which complete inhibition of colony formation is observed [33]. Figure 2 shows streaked agar plates depicting growth of Enterococcus spp. bacteria colonies after 24 h. Figure 2a shows the state of the streaked plate when no SeO32− was added. Figure 2b shows the state of the streaked plate when 100 mM selenite was added. The visible red colour in Figure 2b indicates the formation of Se0 as well as the Enterococcus spp.’s tolerance to high SeO32− concentrations.
Table 1 shows the MICs of various selenite-reducing microorganisms from literature, comparable to Enterococcus spp. It is evident that the bacteria’s tolerance to selenite concentrations is among the highest. However, what distinguishes Enterococcus spp. from the other bacteria with an MIC of at least 100 mM of selenite is its quick response to SeO32− reduction. This is because the formation of elemental selenium when using this strain is evident within the first 0.5 h. The culture’s ability to withstand very high selenium concentrations (>100 mM) make it an attractive and versatile microbial species suitable for applications of this bio-catalytic process.
2.4. SeO32− Depletion and Se0 Formation
Reduction of selenite by the Enterococcus spp. is shown in Figure 3, and the formation of a reddish colour is typical of Se0, as depicted. Larger quantities of selenite were quickly reduced and transformed to Se0 for higher selenite concentrations, whilst it was less rapid in reducing the lower selenite concentrations. This was probably due to the mechanism adopted by the bacteria, as it would react to the toxic effect of elevated levels of selenite concentrations. It is imperative to note that 100 % reduction could not be achieved in any of the concentrations, and selenite abatement drastically slowed down after 1.5 h.
During the first 1.5 h, when reduction was at its most rapid, the average reduction rates for the different selenite concentrations were calculated. For the 1 mM concentration, 0.913 mM (91% reduction) selenite was reduced, translating to an average reduction rate of 0.608 mmol·(L·h)−1. As the concentration to be reduced increased, so did the reduction rate. This is evidenced by the fact that in the first 1.5 h, 2.881 mM (96% reduction) of the 3 mM initial selenite concentration was reduced, and this was a reduction rate of 1.921 mmol·(L·h)−1. Likewise, the same was observed for 5 mM, where 4.857 mM (97% reduction) was reduced, and the reduction rate was 3.238 mmol·(L·h)−1. The time courses are shown in Figure 4 below.
The rate of Se0 formation across the three different concentrations was independent to the rate of SeO32− reduction. The delay in the production of elemental selenium with respect to SeO32− reduction was attributed to the formation of metabolic intermediates before elemental selenium was formed [32]. However, almost all of the reduced SeO32− was recovered as Se0, and this indicated little or no volatisation as compared to other bacterial strains [36]. Variations in glucose concentration are shown in Figure 4.
Figure 5 shows TEM images for Enterococcus spp. grown in the presence and absence of selenite, and Figure 5b shows SeNPs located extracellularly.
In addition to monitoring SeO32− and Se0 concentrations, glucose was also tracked. Glucose is one of the many organic substrates (carbon sources) utilised as an energy source by microorganisms [20]. It also promotes growth and activity of selenite-reducing microorganisms. That is why monitoring its concentration in this study was essential as it would give an indication of microbial activity. The specific glucose consumption rates (qg) for the different selenite concentrations were calculated using Equation (2). The consumption rate was 6.114, 6.457 and 7.029 mmol·h−1 for the 1, 3 and 5 mM SeO32− concentration, respectively. The glucose consumption rate was proportional to the selenite concentration to be reduced, that is, the higher the selenite concentration, the higher the consumption rate and vice versa. Glucose was likely used for fulfilling the metabolic needs of the bacteria other than for growth in order to acclimatise better to the high selenite concentrations.
where qg = specific glucose consumption rate (g·(L·h)−1) and t = time (h).
qg = concentration of glucose consumed/(t)
2.5. Redox Potential Measurements as A Monitoring Technique for SeO32− Reduction
If water has redox active species such as the salts of a variety of metals, determining its ORP can be significant. Therefore, in theory, ORP can be used to track metallic pollution. When determining the ORP, the measured potential reflects all the dissolved species in the medium; hence, it is a nonspecific measurement. Moreover, ORP measurements are sensitive to fluctuations in pH due to the involvement of hydrogen ions (H+) in either the reduction or oxidation reaction [37].
Selenium (Se) is directly sensitive to redox changes. Its redox status often has bearing on its toxicity. Cr(III) for example is less toxic compared to its oxidised form, Cr(VI) [38]. Furthermore, as mentioned earlier, Se0 is regarded as relatively less toxic as compared to its oxidised forms, SeO42− and SeO32−.
When monitoring ORP and pH variation in this study, a uniform trend was apparent across all the three selenite concentrations. An increase in ORP correlated with a decrease in both the pH and the selenite concentration and vice versa. This was explained by the fact that the lower the ORP, the greater the concentration of the reducing agent. As more reduction occurred, this would result in an increase of the oxidising agent (Se0), hence the higher ORP [39]. Variations in ORP and pH are shown in Figure 6 below.
The measured ORP values (ORPmeasured) were input into the Nernst equation (Equation (4)) in order to get the calculated ORP values (ORPcalculated). Thereafter, the ORPmeasured values were plotted against the ORPcalculated ones using the SeO32−/Se0 redox couple (Equation (3)) for interpretation of the monitoring results.
The Nernst equation was developed in order to investigate the theory of galvanic cells. It enables the determination of the voltage of an electrochemical cell (ΔE) taking the Gibbs energy change (ΔG) and the mass action expression or reaction quotient (Q) into account [40]. Therefore, if you change the concentrations in a reaction (thus changing Q), the cell potential also changes.
In general, the Nernst equation can be used to calculate cell potentials under non-standard conditions, and the calculated cell potentials can then be related to the process of the reaction. Much of biology consists of electron transfer for reactions to occur. Hence, the Nernst equation is applicable as the energy required for building and maintaining structures needed by microorganisms is obtained from those reactions [40].
where E = the cell potential (V), E° = the standard cell potential (V), R = the gas constant equal to 8.314 J·(mol·K)–1, T = the temperature (K), n = the number of electrons transferred in the cell reaction or half-reaction, F = the Faraday constant equal to 96,500 C·mol−1 and Q = the reaction quotient of the cell reaction.
E = E° − (RT/nF) × LN(Q),
Figure 7a,c,e show how comparable the ORPmeasured and ORPcalculated values are. The good correlation (r2 > 0.99) between the ORPmeasured and ORPcalculated values shown in Figure 7b,d,e indicate the effectiveness of measuring ORP and using it as a monitoring technique for selenium reduction. Moreover, this can be implemented long term, continuously, and in situ for large scale applications. Ioka et al. (2016) reached the same conclusion in their study when using measured values to monitor hot spring water quality. They used HS−/SO42− and S2−/SO42− redox couples, because the dominant redox-related species in the hot springs water was sulphur [41].
The offset between the ORPmeasured and ORPcalculated shown in Figure 7a,c,e was expected. As indicated earlier, the Nernst equation is non-specific, implying that it does not give precise values, but rather a trend of the ratios of the redox species of interest. Moreover, the Nernst equation has limitations which involve ion activity and ion concentration. Ion activity in dilute solutions can easily be expressed in terms of concentration. However, in solutions with very high concentrations, such as the ones used in this study, the ion concentration is not equal to the ion activity [42]. Therefore, in order to use the Nernst equation in such cases, experimental measurements had to be conducted in order to get the true activity of the ions of interest. Consequently, these differences have an impact on the ORP values, thus causing the observed offset.
2.6. Protein Assay
The viability of bacterial cells throughout the reduction of selenite was measured based on the cellular protein content [43] using Bradford protein assay. The principle of this assay is that the binding of protein molecules to Coomassie dye under acidic conditions results in a colour change from brown to blue. The method measures the presence of the basic amino acid residues, arginine, lysine and histidine, which contributes to formation of the protein-dye complex [44]. The binding of the dye to protein causes a change in the absorption maximum of the dye from 465 to 595 nm, and it is the increase in absorption at 595 nm which was monitored [45,46]. This assay is very reproducible; the dye binding process takes approximately 2 min, and good colour stability lasts for up to 1 h. Moreover, there is little or no interference either from cations such as sodium and potassium nor from carbohydrates such as sucrose [44].
The variation in protein followed a uniform trend across the three selenite concentrations. The protein concentrations were high at time 0 h, and this corresponded with the high absorbance values. Once selenite had been added, the absorbance increased proportionally to the selenite concentration added, before rapidly decreasing. This corresponding trend further validates the earlier assumption that Enterococcus spp. responds to the selenite concentrations it has been exposed to in order to rapidly detoxify its surrounding environment. However, once the selenite reduction had become constant (around 1.5 h), the protein concentration gradually stabilised. The decrease is likely due to proteins and/or other biomolecules playing a major role in both selenite reduction and controlling synthesis of the resultant SeNPs [43]. This assumption is in line with what was shown in a study by Zhang, X. et al. (2020), which indicated that EPS secreted by bacteria can participate in metal bioremediation [30]. These variations in the protein concentration are depicted in Figure 8.
3. Materials and Methods
3.1. Growth Media
Tryptone Soya Agar (TSA) and Tryptone Soya Broth (TSB) (Oxoid Ltd., Basingstoke, Hants, UK) were prepared by dissolving 40 g and 30 g respectively in 1 L of distilled water. Thereafter, they were sterilised via autoclaving (121 °C, 15 min).
3.2. Mineral Salt Medium (MSM)
The glucose supplemented mineral salt medium at pH ≥ 7 was made up of the following constituents: 5 g·L−1 salinity, 30 mM NH4Cl, 0.8 mM Na2SO4, 0.2 mM MgSO4, 50 nM CaCl2 (Sigma-Aldrich, St. Louis, MO, USA), 25 nM FeSO4, 0.1 nM ZnCl2, 0.2 nM CuCl2, 0.1 nM NaBr, 0.05 nM Na2MoO2, 0.1 nM MnCl2, 0.1 nM KI, 0.2 nM H3BO3, 0.1 nM CoCl2, and 0.1 nM NiCl2. All chemicals were sourced from Merck (Merck, Darmstadt, Germany) unless otherwise specified. The media was also sterilised via autoclaving (121 °C, 15 min).
3.3. SeO32− Stock Solution
A 100 mM stock solution of selenite was prepared for use during the minimum inhibitory concentration (MIC) and selenite reduction experiments. This stock solution was prepared by dissolving 17.293 g of 99% Na2O3Se (Sigma-Aldrich, St. Louis, MO, USA) in 1 L of distilled and autoclaved water. To add, an appropriate volume of 150 mM NaOH was added in order to stabilise the solution.
3.4. Culture Isolation, Identification, Cultivation and Storage
The source of the Enterococcus spp. was due to an accidental contamination in the laboratory where the bacteria were found to be growing in selenium laden medium. The bacteria were streaked on agar plates before being sent to Inqaba Biotechnical Industries (Pty) Ltd. (Pretoria, South Africa) for analysis.
The cultivation and storage procedure entailed cultivating the Enterococcus spp. in Tryptone Soy Broth (TSB) for 24 h at 28 °C on a rotary shaker at 120 rpm (FSIM-SPO8, Labcon, Johannesburg, South Africa). After 24 h, 0.8 mL of the TSB containing the bacteria was placed in sterilised 2 mL vials before adding 0.2 mL of 50% glycerol solution. Thereafter, the vials were placed in the −70 °C storage chamber. To revive the strain, the frozen vials were taken from the −70 °C storage chamber and loops were used to streak contents of the vials onto agar plates. The bacteria were left to grow for 24 h before either being stored at 0 °C for future use or inoculated into fresh TSB for growth. For the reduction experiments, the bacteria inoculated in fresh TSB grew for 24 h to its stationary phase. Thereafter, it was harvested and concentrated via centrifugation and the resultant pellet added to the flasks for selenite reduction.
Genomic DNA was extracted from the cultures using a Quick-DNA™ Fungal/Bacterial Miniprep Kit (Zymo Research, Catalogue No. D6005, Irvine, CA, USA). The 16S target region was amplified using OneTaq® Quick-Load® 2X Master Mix (NEB, Catalogue No. M0486, Ipswich, MA, USA) with primers presented in Table 2 below.
The PCR products were run on a gel and gel extracted with a Zymocleam™ Gel DNA Recovery Kit (Zymo Research, Catalogue No. D4001, Irvine, CA, USA). The extracted fragments were sequenced in the forward and reverse direction and purified. The purified fragments were analysed on an ABI 3500XL Genetic Analyzer (Applied Biosystems, Thermofisher Scientific, Waltham, MA, USA) for each reaction for every sample. CLC Bio Main Workbench v7.6 was used to analyse the ab1 files generated by the ABI 3500XL Genetic Analyzer, and results were obtained using a BLAST search (NCBI) [47].
3.5. SeO32− and Se0 Measurement
The SeO32− concentrations were determined using a 940 Professional IC Vario ion chromatograph (Metrohm, Herisau, Switzerland) with separation column Metrosep C 6-250/4.0 (Metrohm, Switzerland) and C 6 eluent 8 mM oxalic acid (Metrohm, Herisau, Switzerland).
Se0 was quantified as total selenium using a Varian AA–1275 Series Flame AAS (Perkin Elmar, Varian, Palo Alto, CA, USA) at 196.03 nm wavelength equipped with a 290 mA selenium lamp. The pellet obtained from the centrifugation process comprised of both Se0 and the biomass. It is this combined pellet that was initially acidified with 2 mL of both 70% HNO3 and 32% HCl before digestion in a thermoreactor (60 min, 100 °C) for re-oxidisation before AA analysis.
3.6. pH and ORP Measurement
The pH and the oxidation reduction potential (ORP) were measured using pH and ORP probes (PL700AL, Pacific Sensor Technologies, Neutron Place Rowville, Victoria, Australia), which were dipped into the supernatant and the values left to stabilise.
3.7. Glucose Measurement
The amount of glucose that had not yet been used up was measured in the supernatant using a CONTOUR®PLUS blood glucose monitoring system (CP BGMS, Bayer, Ascensia Diabetes Care, Basel, Switzerland), which proved to be accurate. A study by Dunne et al. (2015) concluded that the CP BGMS had a lower mean difference from the reference value than comparable systems tested across various glucose ranges [43].
3.8. Protein Assay
The Bradford protein assay is a protein determination method in which protein molecules are bound to Coomassie dye under acidic conditions resulting in a colour change from brown to blue [44]. The binding of the dye to protein causes a change in the absorption maximum of the dye from 465 to 595 nm, and it is the increase in absorption at 595 nm which is monitored [45,46]. In this study, 0.05 mL of each standard or unknown sample were pipetted into appropriately labelled cuvettes. Thereafter, 1.5 mL of the Coomassie Plus Reagent was added to each cuvette and mixed well. The cuvettes were then incubated for 10 min at room temperature for consistent results. The spectrophotometer (WPA, Light Wave II, Labotech, South Africa) was then set to 595 nm, zeroed on a cuvette filled only with water, and subsequently, the absorbance of all the samples was measured.
3.9. TEM Analysis
The bacterial cultures grown in both the control (without selenite) and in the presence of 5 mM selenite were collected after 24 h of incubation at 35 ± 2 °C. The cells were harvested using centrifugation (6000 rpm, 5 min) and fixed with 2.5% glutaraldehyde in 1.5 M phosphate buffer for 30 min. The cells then underwent post-fixation treatment in 1% osmium tetroxide (OsO4) for 30 min. The samples were subsequently processed using standard procedures and mounted on copper grids. The analysis was conducted at 200 kV FE (Field Emission) with a FEGTEM: Jeol 2100 (Peabody, MA, USA) transmission electron microscope (TEM).
4. Conclusions
This study established that the Enterococcus spp. were capable of rapidly reducing selenite (in less than 4 h) with a very high recovery of elemental selenium. This establishes selenium bioremediation as a potential resource for SeNPs. Results from the protein and glucose measurements indicated that the bacterial biomass likely secreted protein containing metabolites into the medium and also utilised glucose for selenite reduction. Of note was the reduction of proteins as the reaction proceeds, which could also be an indication that these proteins participate in selenite reduction. Further investigation will have to be conducted in order to analyse the nature of the proteins or metabolites secreted by Enterococcus spp. to establish how they participate in selenite reduction. Moreover, characterisation of the formed SeNPs is imperative as this will assist in verifying suitable applications.
Supplementary Materials
The following are available online at www.mdpi.com/article/10.3390/catal11091024/s1, Figure S1: Phylogenetic tree for the microbial culture results, Figure S2: SEM micrographs depicting the morphology of Enterococcus spp. and the 16S report from Inqaba Biotechnical Industries (Pty) Ltd. (outsourced analysis).
Author Contributions
Conceptualisation, J.T.T. and H.G.B.; methodology, J.T.T.; investigation, J.T.T.; resources, H.G.B. and E.M.N.C.; data curation, J.T.T.; writing—original draft preparation, J.T.T.; writing—review and editing, J.T.T., H.G.B. and E.M.N.C.; supervision, H.G.B. and E.M.N.C.; funding acquisition, H.G.B. and E.M.N.C. All authors have read and agreed to the published version of the manuscript.
Funding
This work is based on the research supported in part by the National Research Foundation of South Africa (Grant Numbers 120321, IFR170214222643). The authors would like to recognise the support of the Rand Water Research Chair in Water Utilisation Engineering.
Data Availability Statement
The data presented in this study are openly available in the University of Pretoria Research Data Repository at doi:10.25403/UPresearchdata.16418871.
Acknowledgments
The authors would like to thank Erna van Wilpe (Specialist Analytical Scientist/Laboratory Manager Life Sciences, Ultrastructural Pathology & Morphology, University of Pretoria) for assistance with TEM analysis.
Conflicts of Interest
The authors declare no conflict of interest.
References
- Nancharaiah, Y.V.; Lens, P.N.L. Ecology and Biotechnology of Selenium-Respiring Bacteria. Microbiol. Mol. Biol. Rev. 2015, 79, 61–80. [Google Scholar] [CrossRef] [Green Version]
- Dungan, R.S.; Frankenberger, W.T. Reduction of Selenite to Elemental Selenium by Enterobacter cloacae SLD1a-1. J. Environ. Qual. 1998, 27, 1301–1306. [Google Scholar] [CrossRef]
- Stewart, A.R.; Grosell, M.; Buchwalter, D.B.; Fisher, N.S.; Luoma, S.N.; Mathews, T.; Orr, P.L.; Wang, W.-X. Bioaccumulation and Trophic Transfer of Selenium. In Ecological Assessment of Selenium in the Aquatic Environment; SETAC Press: Pensacola, FL, USA, 2010; pp. 93–139. [Google Scholar]
- Kuroda, M.; Notaguchi, E.; Sato, A.; Yoshioka, M.; Hasegawa, A.; Kagami, T.; Narita, T.; Yamashita, M.; Sei, K.; Soda, S.; et al. Characterization of Pseudomonas stutzeri NT-I capable of removing soluble selenium from the aqueous phase under aerobic conditions. J. Biosci. Bioeng. 2011, 112, 259–264. [Google Scholar] [CrossRef] [PubMed]
- Frankenberger, W.T.; Engberg, R.A. Environmental Chemistry of Selenium. Environ. Chem. Selenium 1998, 736. [Google Scholar] [CrossRef]
- Ečimović, S.; Velki, M.; Vuković, R.; Čamagajevac, I.Š.; Petek, A.; Bošnjaković, R.; Grgić, M.; Engelmann, P.; Bodó, K.; Filipović-Marijić, V.; et al. Acute toxicity of selenate and selenite and their impacts on oxidative status, efflux pump activity, cellular and genetic parameters in earthworm Eisenia andrei. Chemosphere 2018, 212, 307–318. [Google Scholar] [CrossRef] [PubMed]
- Garousi, F. The toxicity of different selenium forms and compounds—Review. Acta Agrar. Debreceniensis 2015, 64, 33–38. [Google Scholar] [CrossRef]
- Hunter, W.J.; Manter, D.K. Reduction of Selenite to Elemental Red Selenium by Pseudomonas sp. Strain CA5. Curr. Microbiol. 2009, 58, 493–498. [Google Scholar] [CrossRef]
- Tendenedzai, J.T.; Brink, H.G. The Effect of Nitrogen on the Reduction of Selenite to Elemental Selenium by Pseudomonas stutzeri NT-I. Chemical Engineering Transanctions. CET 2019, 74, 529–534. [Google Scholar] [CrossRef]
- Shoeibi, S.; Mashreghi, M. Biosynthesis of selenium nanoparticles using Enterococcus faecalis and evaluation of their antibacterial activities. J. Trace Elements Med. Biol. 2017, 39, 135–139. [Google Scholar] [CrossRef]
- Oremland, R.S.; Herbel, M.J.; Blum, J.S.; Langley, S.; Beveridge, T.J.; Ajayan, P.M.; Sutto, T.; Ellis, A.; Curran, S. Structural and Spectral Features of Selenium Nanospheres Produced by Se-Respiring Bacteria. Appl. Environ. Microbiol. 2004, 70, 52–60. [Google Scholar] [CrossRef] [Green Version]
- Cremonini, E.; Zonaro, E.; Donini, M.; Lampis, S.; Boaretti, M.; Dusi, S.; Melotti, P.; Lleo, M.M.; Vallini, G. Biogenic selenium nanoparticles: Characterization, antimicrobial activity and effects on human dendritic cells and fibroblasts. Microb. Biotechnol. 2016, 9, 758–771. [Google Scholar] [CrossRef] [PubMed]
- Kessi, J.; Ramuz, M.; Wehrli, E.; Spycher, M.; Bachofen, R. Reduction of selenite and detoxification of elemental selenium by the phototrophic bacterium Rhodospirillum rubrum. Appl. Environ. Microbiol. 1999, 65, 4734–4740. [Google Scholar] [CrossRef] [Green Version]
- Painter, E.P. The Chemistry and Toxicity of Selenium Compounds, with Special Reference to the Selenium Problem. Chem. Rev. 1941, 28, 179–213. [Google Scholar] [CrossRef]
- Cortese, M.; Paszczynski, A.; Lewis, T.A.; Sebat, J.; Borek, V.; Crawford, R.L. Metal chelating properties of pyridine-2,6-bis(thiocarboxylic acid) produced by Pseudomonas spp. and the biological activities of the formed complexes. BioMetals 2002, 15, 103–120. [Google Scholar] [CrossRef]
- Zawadzka, A.M.; Crawford, R.L.; Paszczynski, A.J. Pyridine-2,6-Bis(Thiocarboxylic Acid) Produced by Pseudomonas stutzeri KC Reduces and Precipitates Selenium and Tellurium Oxyanions. Appl. Environ. Microbiol. 2006, 72, 3119–3129. [Google Scholar] [CrossRef] [Green Version]
- Harrison, J.; Ceri, H.; Turner, R.J. Multimetal resistance and tolerance in microbial biofilms. Nat. Rev. Genet. 2007, 5, 928–938. [Google Scholar] [CrossRef]
- Li, D.-B.; Cheng, Y.-Y.; Wu, C.; Li, W.-W.; Li, N.; Yang, Z.-C.; Tong, Z.-H.; Yu, H.-Q. Selenite reduction by Shewanella oneidensis MR-1 is mediated by fumarate reductase in periplasm. Sci. Rep. 2014, 4, 3735. [Google Scholar] [CrossRef]
- Ji, Y.; Wang, Y.-T. Selenium Reduction by Batch Cultures of Escherichia coli Strain EWB32213. J. Environ. Eng. 2017, 143, 04017009. [Google Scholar] [CrossRef]
- Rutkowski, T.; Conroy, K.; Gusek, J. Past, present and future for treating selenium-impacted water. In Tailings and Mine Waste ’08; Informa UK Limited: London, UK, 2008; pp. 281–290. [Google Scholar]
- Hanchi, H.; Mottawea, W.; Sebei, K.; Hammami, R. The Genus Enterococcus: Between Probiotic Potential and Safety Concerns—An Update. Front. Microbiol. 2018, 9, 1791. [Google Scholar] [CrossRef] [PubMed]
- Fisher, K.; Phillips, C. The ecology, epidemiology and virulence of Enterococcus. Microbiology 2009, 155, 1749–1757. [Google Scholar] [CrossRef] [PubMed] [Green Version]
- Ramos, S.; Silva, V.; Dapkevicius, M.; Igrejas, G.; Poeta, P. Enterococci, from Harmless Bacteria to a Pathogen. Microorganisms 2020, 8, 1118. [Google Scholar] [CrossRef] [PubMed]
- Meade, E.; Slattery, M.A.; Garvey, M. Bacteriocins, Potent Antimicrobial Peptides and the Fight against Multi Drug Resistant Species: Resistance Is Futile? Antibiotics 2020, 9, 32. [Google Scholar] [CrossRef] [PubMed] [Green Version]
- Vandera, E.; Lianou, A.; Kakouri, A.; Feng, J.; Koukkou, A.-I.; Samelis, J. Enhanced Control of Listeria monocytogenes by Enterococcus faecium KE82, a Multiple Enterocin–Producing Strain, in Different Milk Environments. J. Food Prot. 2016, 80, 74–85. [Google Scholar] [CrossRef] [PubMed]
- Henning, C.; Gautam, D.; Muriana, P. Identification of Multiple Bacteriocins in Enterococcus spp. Using an Enterococcus-Specific Bacteriocin PCR Array. Microorganisms 2015, 3, 1–16. [Google Scholar] [CrossRef] [Green Version]
- Goncalves, O.; Legrand, J. (Eds.) 2—Spoilage of Egg Products. In Alteration of Ovoproducts; Elsevier: Philadelphia, PA, USA, 2018; pp. 51–156. [Google Scholar]
- Pal, A.; Paul, A.K. Microbial extracellular polymeric substances: Central elements in heavy metal bioremediation. Indian J. Microbiol. 2008, 48, 49–64. [Google Scholar] [CrossRef] [PubMed] [Green Version]
- Jan, A.T. Outer Membrane Vesicles (OMVs) of Gram-negative Bacteria: A Perspective Update. Front. Microbiol. 2017, 8, 1053. [Google Scholar] [CrossRef]
- Zhang, X.; Fan, W.-Y.; Yao, M.-C.; Yang, C.-W.; Sheng, G.-P. Redox state of microbial extracellular polymeric substances regulates reduction of selenite to elemental selenium accompanying with enhancing microbial detoxification in aquatic environments. Water Res. 2020, 172, 115538. [Google Scholar] [CrossRef]
- Hörstmann, C.; Brink, H.G.; Chirwa, E.M. Pb(II) Bio-Removal, Viability, and Population Distribution of an Industrial Microbial Consortium: The Effect of Pb(II) and Nutrient Concentrations. Sustainability 2020, 12, 2511. [Google Scholar] [CrossRef] [Green Version]
- Lampis, S.; Zonaro, E.; Bertolini, C.; Cecconi, D.; Monti, F.; Micaroni, M.; Turner, R.J.; Butler, C.S.; Vallini, G. Selenite biotransformation and detoxification by Stenotrophomonas maltophilia SeITE02: Novel clues on the route to bacterial biogenesis of selenium nanoparticles. J. Hazard. Mater. 2017, 324, 3–14. [Google Scholar] [CrossRef]
- Fresneda, M.A.R.; Martín, J.D.; Bolívar, J.G.; Cantos, M.V.F.; Bosch-Estévez, G.; Moreno, M.F.M.; Merroun, M.L. Green synthesis and biotransformation of amorphous Se nanospheres to trigonal 1D Se nanostructures: Impact on Se mobility within the concept of radioactive waste disposal. Environ. Sci. Nano 2018, 5, 2103–2116. [Google Scholar] [CrossRef] [Green Version]
- Dwivedi, S.; Al-Khedhairy, A.; Ahamed, M.; Musarrat, J. Biomimetic Synthesis of Selenium Nanospheres by Bacterial Strain JS-11 and Its Role as a Biosensor for Nanotoxicity Assessment: A Novel Se-Bioassay. PLoS ONE 2013, 8, e57404. [Google Scholar] [CrossRef]
- Zheng, S.; Su, J.; Wang, L.; Yao, R.; Wang, D.; Deng, Y.; Wang, R.; Wang, G.; Rensing, C. Selenite reduction by the obligate aerobic bacterium Comamonas testosteroni S44 isolated from a metal-contaminated soil. BMC Microbiol. 2014, 14, 204. [Google Scholar] [CrossRef]
- Kagami, T.; Narita, T.; Kuroda, M.; Notaguchi, E.; Yamashita, M.; Sei, K.; Soda, S.; Ike, M. Effective selenium volatilization under aerobic conditions and recovery from the aqueous phase by Pseudomonas stutzeri NT-I. Water Res. 2013, 47, 1361–1368. [Google Scholar] [CrossRef] [PubMed]
- Siefert, K.S.; Lampert, K.E. ORP for Chemical Dosage Control in Metal Precipitation; Nalco Chemical Company: Naperville, IL, USA, 2002. [Google Scholar]
- Aigberua, A.; Tarawou, J.; Abasi, C. Effect of Oxidation-Reduction Fluctuations on Metal Mobility of Speciated Metals and Arsenic in Bottom Sediments of Middleton River, Bayelsa State, Nigeria. J. Appl. Sci. Environ. Manag. 2018, 22, 1511. [Google Scholar] [CrossRef] [Green Version]
- Doi, R. Determination of the selenium (VI)/(IV) standard redox potential by cyclic voltammetry. J. Nucl. Sci. Technol. 2013, 51, 56–63. [Google Scholar] [CrossRef] [Green Version]
- Schafer, F.Q.; Buettner, G. Redox environment of the cell as viewed through the redox state of the glutathione disulfide/glutathione couple. Free. Radic. Biol. Med. 2001, 30, 1191–1212. [Google Scholar] [CrossRef]
- Ioka, S.; Muraoka, H.; Matsuyama, K.; Tomita, K. In situ redox potential measurements as a monitoring technique for hot spring water quality. Sustain. Water Resour. Manag. 2016, 2, 353–358. [Google Scholar] [CrossRef] [Green Version]
- Nernst Equation. 2020. Available online: https://byjus.com/jee/nernst-equation/#:~:text=Limitations%20of%20Nernst%20Equation,equal%20to%20the%20ion%20activity (accessed on 14 September 2020).
- Dunne, N.; Viggiani, M.T.; Pardo, S.; Robinson, C.; Parkes, J.L. Accuracy Evaluation of CONTOUR®PLUS Compared with Four Blood Glucose Monitoring Systems. Diabetes Ther. 2015, 6, 377–388. [Google Scholar] [CrossRef] [PubMed]
- Bradford, M.M. A rapid and sensitive method for the quantitation of microgram quantities of protein utilizing the principle of protein-Dye binding. Anal. Biochem. 1976, 72, 248–254. [Google Scholar] [CrossRef]
- He, F. Bradford Protein Assay. Bio-Protocol 2011, 1, 45. [Google Scholar] [CrossRef]
- Becker, J.M.; Caldwell, G.A.; Zachgo, E.A. Exercise 13—Protein Assays. In Biotechnology, 2nd ed.; Becker, J.M., Caldwell, G.A., Zachgo, E.A., Eds.; Academic Press: San Diego, CA, USA, 1996; pp. 119–124. [Google Scholar]
- Altschul, S.F.; Madden, T.L.; Schäffer, A.A.; Zhang, J.; Zhang, Z.; Miller, W.; Lipman, D.J. Gapped BLAST and PSI-BLAST: A new generation of protein database search programs. Nucleic Acids Res. 1997, 25, 3389–3402. [Google Scholar] [CrossRef] [PubMed] [Green Version]
Figure 1.
The effect of increasing selenite concentration on bacterial growth.

Figure 2.
The growth of Enterococcus spp. colonies in (a) the absence and (b) the presence of 100 mM SeO32− after 24 h.
Figure 2.
The growth of Enterococcus spp. colonies in (a) the absence and (b) the presence of 100 mM SeO32− after 24 h.

Figure 3.
Colour variations in SeO32− reduction at the start (0 h) and the end (3.5 h).

Figure 4.
Time courses showing SeO32− reduction, Se0 formation and glucose utilisation for (a) 1 mM, (b) 3 mM and (c) 5 mM concentrations, respectively.
Figure 4.
Time courses showing SeO32− reduction, Se0 formation and glucose utilisation for (a) 1 mM, (b) 3 mM and (c) 5 mM concentrations, respectively.

Figure 5.
TEM images for Enterococcus spp. grown in the (a) absence of selenite and (b) presence of 5 mM selenite after 24 h.
Figure 5.
TEM images for Enterococcus spp. grown in the (a) absence of selenite and (b) presence of 5 mM selenite after 24 h.

Figure 6.
The time courses across the 1, 3 and 5 mM SeO32− concentrations for ORP and pH variation.

Figure 7.
Plots depicting for 1 mM: (a) ORPmeasured and ORPcalculated vs. time and (b) correlation for ORPmeasured vs. ORPcalculated; for 3 mM: (c) ORPmeasured and ORPcalculated vs. time and (d) correlation for ORPmeasured vs. ORPcalculated; and for 5 mM: (e) ORPmeasured and ORPcalculated vs. time and (f) correlation for ORPmeasured vs. ORPcalculated.

Figure 8.
Protein variation across the 1, 3 and 5 mM SeO32− concentrations.


Table 1.
Comparison of MICs between Enterococcus spp. and other selenite-reducing bacteria.
| Bacteria | SeO32− MIC (mM) | Reference |
|---|---|---|
| Enterococcus spp. | >100 | This study |
| Pseudomonas aeruginosa JS-11 | ≤100 | [34] |
| Comamonas testosteroni S44 | ≤100 | [35] |
| Stenotrophomonas bentonitica BII-R7 | >100 | [33] |
Table 2.
16S primers sequences.
| Name of Primer | Target | Sequence (5′ to 3′) |
|---|---|---|
| 16S-27F | 16S rDNA sequence | AGAGTTTGATCMTGGCTCAG |
| 16S-1492R | 16S rDNA sequence | CGGTTACCTTGTTACGACTT |
Publisher’s Note: MDPI stays neutral with regard to jurisdictional claims in published maps and institutional affiliations. |
© 2021 by the authors. Licensee MDPI, Basel, Switzerland. This article is an open access article distributed under the terms and conditions of the Creative Commons Attribution (CC BY) license (https://creativecommons.org/licenses/by/4.0/).
Share and Cite
MDPI and ACS Style
Tendenedzai, J.T.; Chirwa, E.M.N.; Brink, H.G. Performance Evaluation of Selenite (SeO32−) Reduction by Enterococcus spp. Catalysts 2021, 11, 1024. https://0-doi-org.brum.beds.ac.uk/10.3390/catal11091024
AMA Style
Tendenedzai JT, Chirwa EMN, Brink HG. Performance Evaluation of Selenite (SeO32−) Reduction by Enterococcus spp. Catalysts. 2021; 11(9):1024. https://0-doi-org.brum.beds.ac.uk/10.3390/catal11091024
Chicago/Turabian StyleTendenedzai, Job T., Evans M. N. Chirwa, and Hendrik G. Brink. 2021. "Performance Evaluation of Selenite (SeO32−) Reduction by Enterococcus spp." Catalysts 11, no. 9: 1024. https://0-doi-org.brum.beds.ac.uk/10.3390/catal11091024
Note that from the first issue of 2016, this journal uses article numbers instead of page numbers. See further details here.