Article

Addition of Different Biochars as Catalysts during the Mesophilic Anaerobic Digestion of Mixed Wastewater Sludge

1
DIATI (Department of Engineering for Environment, Land and Infrastructures), Politecnico di Torino, Corso Duca degli Abruzzi 24, 10129 Torino, Italy
2
Department of Chemical and Biochemical Engineering, Faculty of Engineering, Institute for Chemicals and Fuels from Alternative Resources (ICFAR), Western University, London, ON N6A 5B9, Canada
3
UK Biochar Research Centre (UKBRC), School of GeoSciences, University of Edinburgh, King’s Buildings, Edinburgh EH9 3JN, UK
*
Author to whom correspondence should be addressed.
Submission received: 16 July 2021 / Revised: 31 August 2021 / Accepted: 8 September 2021 / Published: 10 September 2021

Abstract

:
Biochar (BC) recently gained attention as an additive for anaerobic digestion (AD). This work aims at a critical analysis of the effect of six BCs, with different physical and chemical properties, on the AD of mixed wastewater sludge at 37 °C, comparing their influence on methane production and AD kinetics. AD batch tests were performed at the laboratory scale operating 48 reactors (0.25 L working volume) for 28 days with the addition of 10 g L−1 of BC. Most reactors supplemented with BCs exhibited higher (up to 22%) methane yields than the control reactors (0.15 Nm3 kgVS−1). The modified Gompertz model provided maximum methane production rate values, and in all reactors the lag-phase was equal to zero days, indicating a good adaptation of the inoculum to the substrate. The potential correlations between BCs’ properties and AD performance were assessed using principal component analysis (PCA). The PCA results showed a reasonable correlation between methane production and the BCs’ O–C and H–C molar ratios, and volatile matter, and between biogas production and BCs’ pore volume, specific surface area, and fixed and total carbon. In conclusion, the physic-chemical properties of BC (specifically, hydrophobicity and morphology) showed a key role in improving the AD of mixed wastewater sludge.

1. Introduction

Wastewater treatment plants (WWTPs) generate large amounts of sludge, whose management can account for up to the 30% of the capital costs and 50% of the total operating costs of a WWTP [1], and up to 40% of the total greenhouse gas emissions [2]. Nowadays, wastewater sludge is considered a resource for the recovery of materials [3,4] and energy [5]. Anerobic digestion (AD) is an established technology used for the stabilization of wastewater sludge and its energy recovery in the form of biogas. The optimization of biogas production from the AD of sludge can decisively contribute to achieving the carbon neutrality and the energy self-sufficiency of a WWTP [6,7]. Generally, WWTPs produce two main sludge streams; primary sludge (PS) from the primary settler, which is readily bio-degradable, and waste activated sludge (WAS) after the biological section, characterized by slower hydrolysis and lower methane yields compared to PS [8]. PS and WAS can be managed separately in WWTPs or, more frequently, together as mixed sludge (MS). To increase the methane yields from the AD of sludge, which can affect its economic feasibility, many solutions have been proposed, e.g., physical, chemical, and biological pre-treatments [9,10] or co-digestion with other substrates [11,12]. However, the implementation of these solutions requires additional capital investments and retrofitting of existing facilities [13].
Recently, the supplementation of carbon-based additives (e.g., biochar, activated carbon, graphite, etc.) has been widely explored in the literature to improve the AD of many substrates [14,15,16]. Among them, biochar (BC) is considered a low-cost and eco-friendly sorbent material. The cost of BC could range from USD 0.05 to 0.5 per kg compared to USD 0.6–20 per kg of granular activated carbon [17]. Moreover, as solid residue obtained from the thermo-chemical conversion of any biomass, BC can be designed with specific physic-chemical properties by the proper control of feedstock, production operating parameters, and activation process [17], becoming highly attractive for a wide range of applications [18,19].
From 2015, numerous studies [13,20,21,22,23,24,25,26,27,28,29,30] have investigated BC supplementation to enhance methane production during the AD of wastewater sludge, sometimes with controversial results. In most studies, the addition of BCs improved methane yields and production rates to different extents, due to mechanisms such as biomass immobilization, enhanced interspecies electron transfer, mitigation of ammonia inhibition, increased AD buffering capacity, and carbon dioxide sequestration [17]. However, additional inhibitory effects on AD were observed in the case of excessive doses of BCs [21,23,24,27,30]. The variability of these results may derive from the extensive variation in BC physic-chemical properties. For example, redox-active BCs, rich in superficial functionalities, are typically obtained from low temperature (300 °C) pyrolysis [13,25], whereas BCs with large surface areas, ash content, and hydrophobicity are the result of gasification at high temperature (800 °C) [20,23,24]. On the other hand, activated and modified BCs [21,31] may be produced from a broad variety of feedstocks and as a result of different physical or chemical treatments. Any comparison of the cited studies can be difficult due to the wide variability of AD testing conditions, and only a few studies [24,30,31] have analyzed the effect of BCs having different physic-chemical properties under the same AD operating conditions. To our knowledge, a critical analysis of the role of BC as an additive towards the AD of MS, with direct comparison of the physic-chemical features of different BC materials under the same experimental conditions, is still missing in the literature. Therefore, this study aims to compare the effects of six BCs with different physic-chemical properties on the mesophilic AD of MS. Different waste feedstocks (rice husk, sewage sludge, and soft wood pellets) were pyrolyzed into BC materials; an aliquot of each was further subjected to physical activation to enhance the physical properties. BCs and activated BCs were supplemented to the AD of MS at 37 °C in batch mode, comparing their effects on methane production and AD kinetics, and on the digestate properties. Finally, the potential correlations between BCs properties and AD performance were assessed using principal component analysis (PCA).

2. Results and Discussion

2.1. Characteristics of Materials

The characteristics of the MS and the inoculum used in AD batch tests are shown in Table 1. The features of MS were in the typical range for PS and WAS [32,33], with pH 6.1, total solids (TS) around 3%, and volatile solids–total solids ratio (VS/TS) equal to 65%. The inoculum consisted of mesophilic anaerobic digestate, with pH 7.3 and VS/TS of 54%.
The physic-chemical characteristics of the three BCs and three activated BCs from rice husk (RH), sewage sludge (SS), and soft wood (SW) pellets used in the present study are reported in Table 2. The significant variation in the BCs characteristics depended on the variable composition of their biomass precursors, and then being subjected to the same operating conditions during pyrolysis and activation. The specific surface area (SA) and total pore volume (PV) were, respectively, in the order 1 of 5.7–25.9 m2 g−1 and 0.01–0.03 cm3 g−1 for the BCs, and 109.2–605.1 m2 g−1 and 0.17–0.42 cm3 g−1 for the activated BCs. These are typical values for BCs, with the SA varying in the range 100–102 m2 g−1 depending on the feedstock and temperature of pyrolysis, and for activated BCs with SA values up to over 103 m2 g−1 [17]. The SA and PV of SW-derived BCs were larger than those of RH and SS BCs, due to their higher ash content blocking and filling of the micropores during pyrolysis [34]. Furthermore, the activation process reduced the average pore diameter of the BCs in the micropores range. The fixed and total C, oxygen, and hydrogen contents were higher for SW BCs compared to RH and SS BCs. Conversely, RH- and SS-derived BCs had higher ash contents than SW. The greatest volatile matter and nutrients (N, P) contents were found in SS BCs. These differences can be linked to the variation in chemical composition of the respective biomass precursors. While wood is mainly composed of cellulose, hemicellulose, lignin, and some inorganic compounds [35], rice husk presents a similar chemical composition much richer in ashes, where the predominant fraction is silica [36,37]. On the other hand, sewage sludge is a complex heterogeneous mixture of microorganisms, organics (including proteins, polysaccharides, lipids, and humic substances), inorganic ash, and moisture [38,39]. During pyrolysis, cellulose, hemicellulose, and lignin are reduced to carbon in BCs, whereas mineral constituents tend to accumulate in ashes. The most abundant elements in the ash fraction of BCs were Si, Al, Ca, Cl, and K; Si and K were higher in RH BCs, while Al, Ca, S, and Cl in SS BCs, were in good agreement with other studies [40,41]. The pH of BCs was alkaline, higher for RH BCs (9.7) than for BCs from the other precursors (7.9–8.2), due to the presence of alkali and alkaline earth metals (AAEMs) in ashes and the lack of acidic functional groups [40,42]. The electrical conductivity (EC) of SS BCs was higher than in other BCs because of the higher ash content [43]. In general, the atomic ratios of H–C and O–C of BCs produced at 550 °C may suggest a relatively low abundance of hydroxyl and carboxylic functional groups [42]. Furthermore, the ratios of H–C and O–C of RH-derived BCs were lower than those of SS and SW BCs, suggesting a larger degree of aromatization and hydrophobicity [35].

2.2. Anaerobic Digestion Tests

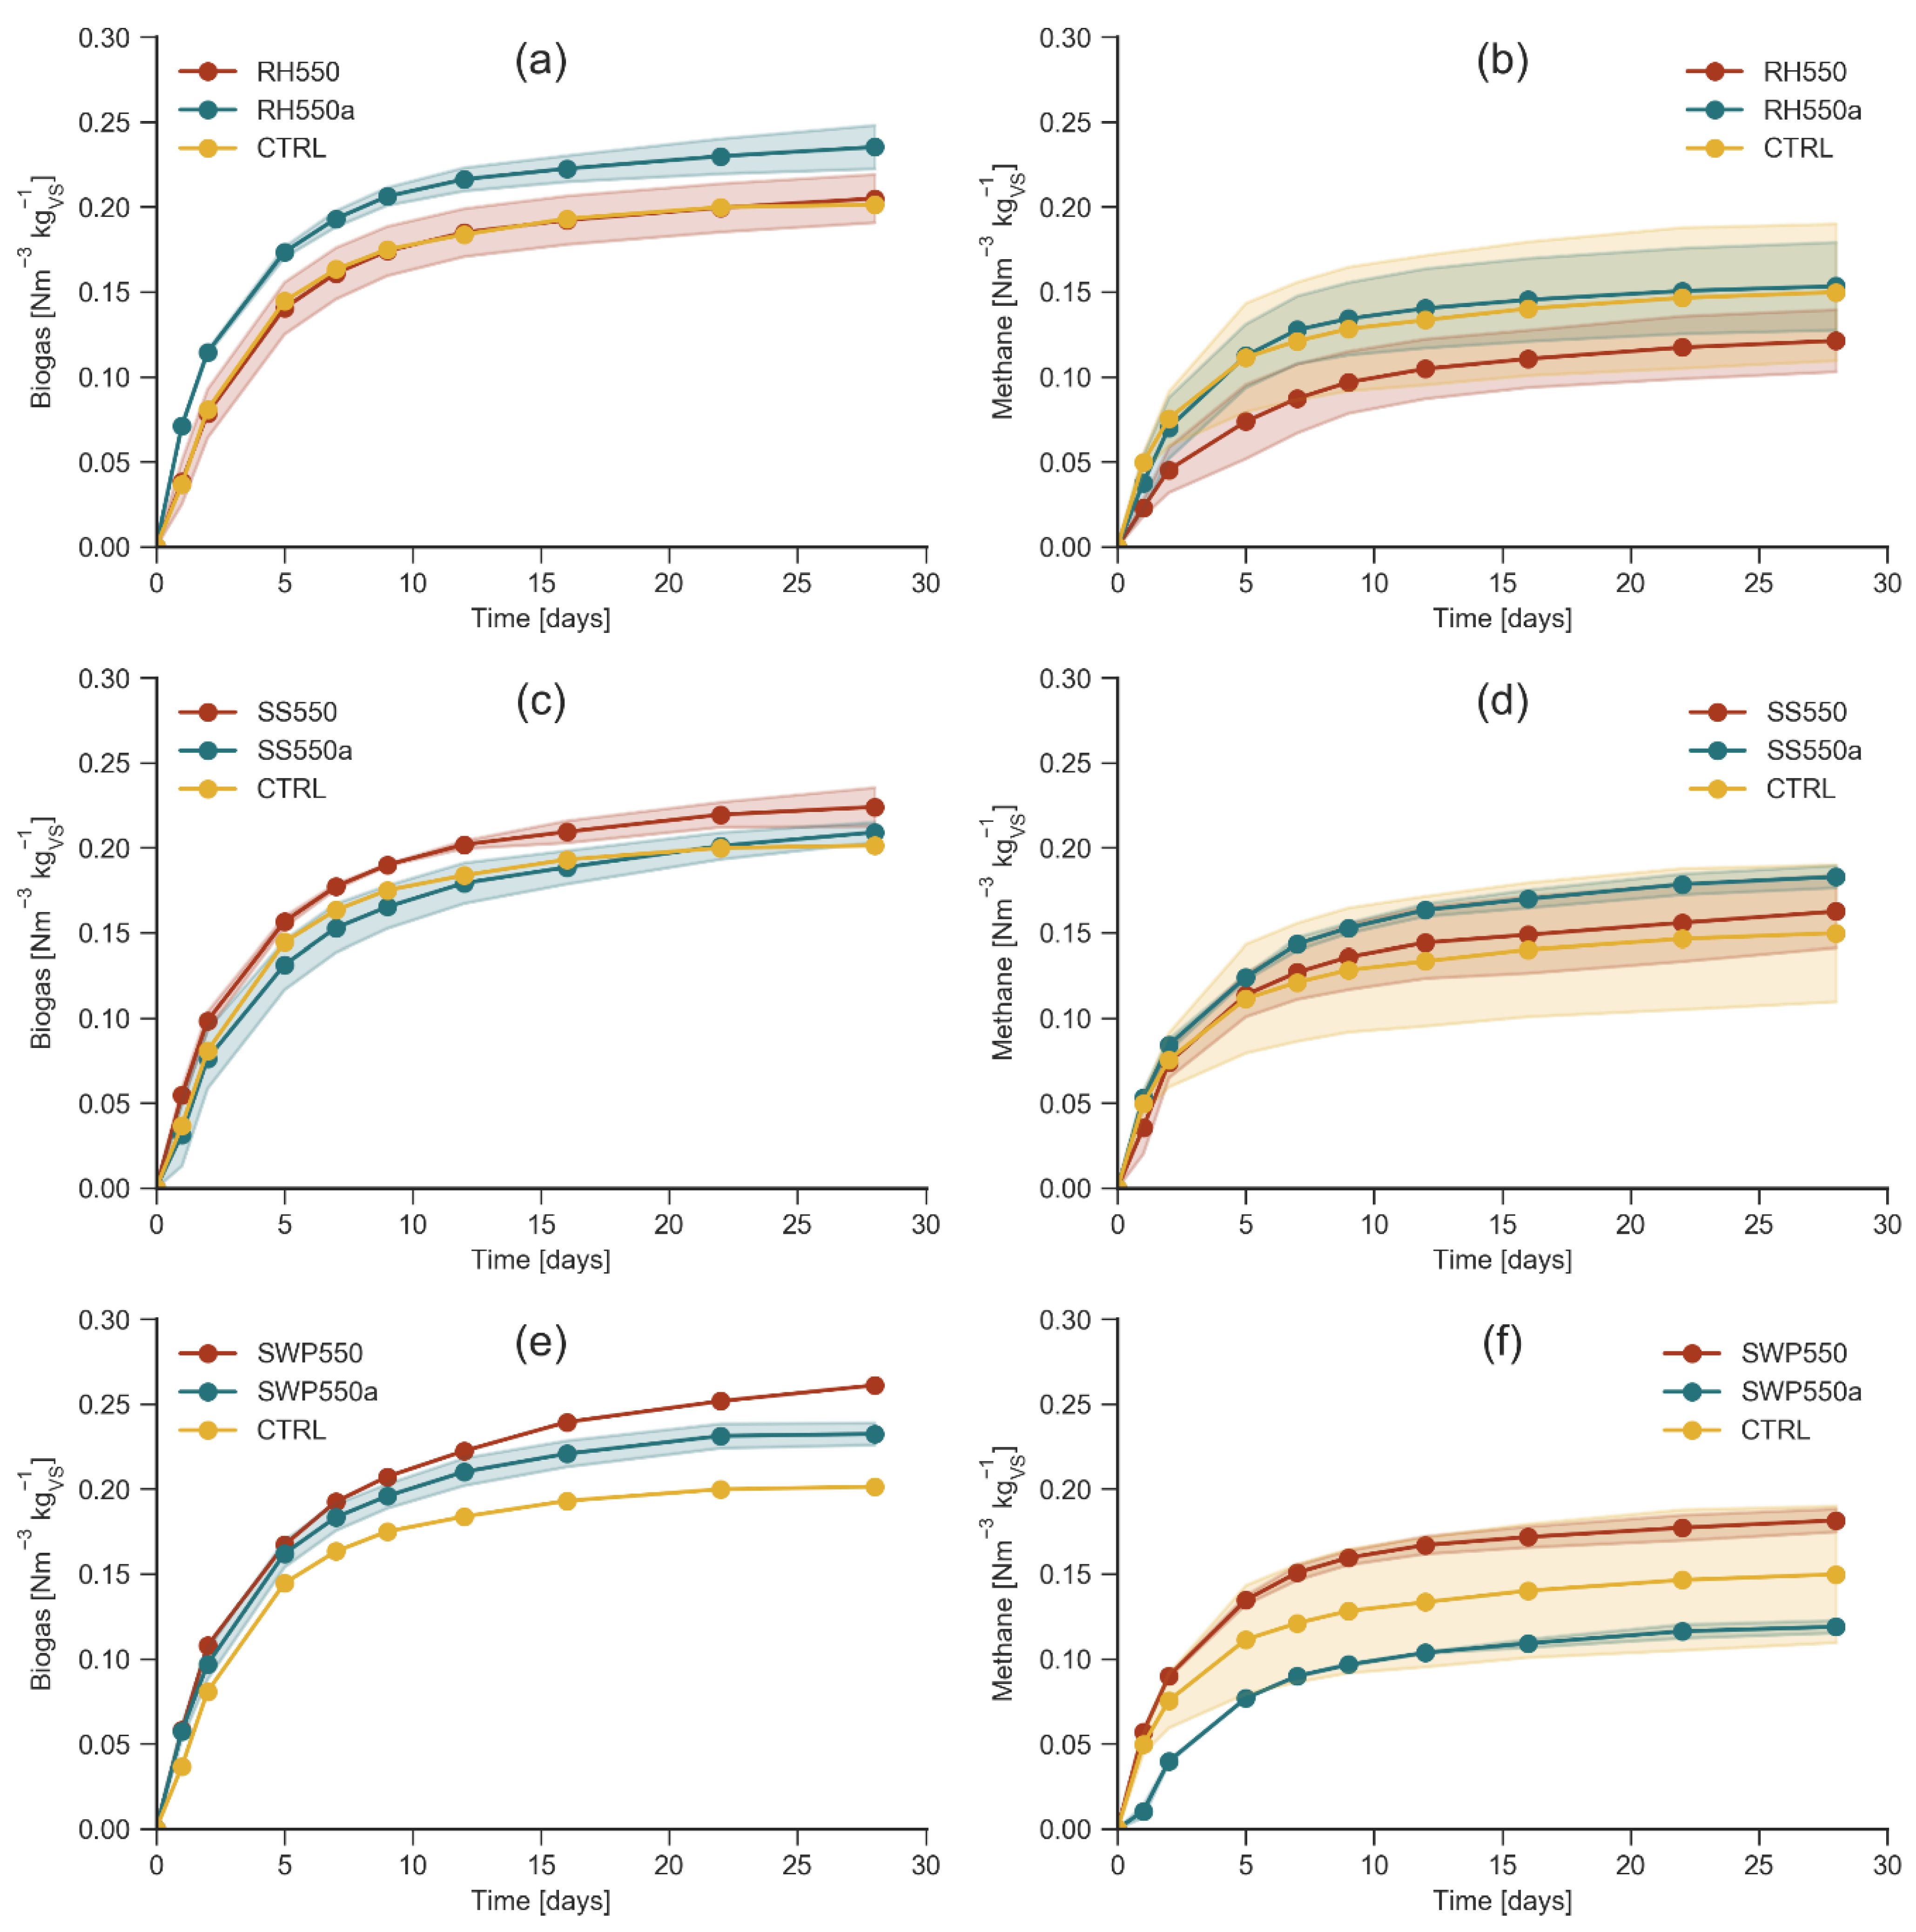
2.2.1. Biogas and Methane Production

The AD batch tests at 37 °C were conducted in the reactors supplemented with the six BCs and in CTRL reactors for 28 days monitoring of biogas and methane production. Figure 1 shows the cumulative specific biogas and methane production for each activated and non-activated BC compared with the CTRL reactors. The cumulative biogas production for each BC and activated BC compared to CTRL are reported in Figure 1a,c,e for RH, SS, and SWP BCs, respectively. In all cases, the trends over time were similar, where the daily biogas productions were significant during the first 7–8 days, with peaks at around days 3 and 4, slowing down until the end of the test. The final biogas yields from MS were in the range 0.20–0.26 Nm3 kgVS−1. Overall, in most cases, positive effects of BCs’ supplementation on biogas production from MS were observed, with final biogas yields in the order of SWP550 (+30%), RH550a (+17%), SWP550a (+15%), and SS550 (+11%), compared to CTRL (0.20 Nm3 kgVS−1), and comparable results for SS550a and RH550. In the cases of SS and SWP BCs (Figure 1c,e), the biogas yield in the presence of the activated BCs was lower than that of the non-activated BCs, and, just in the case of RH BC, it was higher (Figure 1a). Interestingly, SWP550 and SWP550a exhibited the first and the third highest performances.
The cumulative methane productions from the BCs and the activated BCs are shown in Figure 1b,d,f, in comparison with CTRL reactors. The results presented diverse effects of BCs from different feedstocks on the methane production from MS, with final yields ranging from 0.12 to 0.18 Nm3 kgVS−1. Most BCs exhibited larger methane yields than CTRL (0.15 Nm3 kgVS−1), in the order of SS550a (+22%), SWP550 (+21%), SS550 (+8%), and RH550a (+2%). However, reduced methane yields were found for RH550 (−19%) and SWP550a (−21%) compared to CTRL. A lower methane yield for the activated BC than the respective non-activated BC was found in the case of RH BC (Figure 1b) and SW BC (Figure 1f), while it was larger for SS BC (Figure 1d). Therefore, overall, the apparently larger SA and PV of the activated BCs did not correspond to larger biogas and methane yields. In a previous study [31], we investigated the impacts of the three activated BCs RH550a, SS550a, and SWP550a on the mesophilic AD of WAS. We observed lower methane yields for WAS (0.04–0.14 Nm3 kgVS−1) than for MS in the present study due to the lower methane potential of WAS compared to MS [8,43]. Overall, SS550a was found to enhance methane yield for MS (+22%) and WAS (+17%), and RH550a for just WAS (+105%). Furthermore, an inhibitory effect of SWP550a on methane yields from MS (−21%) and WAS (−46%) was observed in both studies. Thereby, a dose of 10 g L−1 of the different BCs had positive or inhibitory effects on methane production under the same experimental conditions, depending on the physic-chemical properties of the BCs. A previous study [30] also reported diverse positive effects of BCs with different properties from three feedstocks (corn straw, coconut shell, and sewage sludge), on methane production from wastewater sludge. In addition, they found that an appropriate dose of BC was beneficial for an enhanced methane production, but an excess could inhibit the AD process. Likewise, another study [23] found promoting or inhibitory effects of BCs on methane productions during the AD of primary sludge, depending on BC dose and origin (pine BC or white oak BC).

2.2.2. Determination of Kinetic Parameters

The cumulative methane production curves were fitted by the modified Gompertz model (Equation (1)) to quantify the effect of the six BCs on the kinetics of the AD process (Table 3). In general, the model fitting of methane curves was reasonably good, with coefficients of determination (R2) larger than 0.9 in all cases. The methane maximum production rate (Rmax) was enhanced with respect to CTRL by just SWP550, which was found to determine the largest methane potential (P) together with SS550a (see Section 2.2.1). Rmax values of other BCs were in the range of that of CTRL, except RH550 and SWP550a, which had lower values. These BCs could inhibit methane production according to the adopted dose (see Section 2.2.1). In all BCs and CTRL, the lag-phase (λ) was equal to 0 days, indicating a good adaptation of the inoculum to the substrate. This wasn’t surprising since both the anaerobic digestate used as inoculum and the MS were derived from the same WWTP. In other studies [29,44,45], BCs shortened λ and enhanced Rmax compared to CTRL during mono- or co-digestion of sludge when the inoculum wasn’t yet well adapted to the substrate.

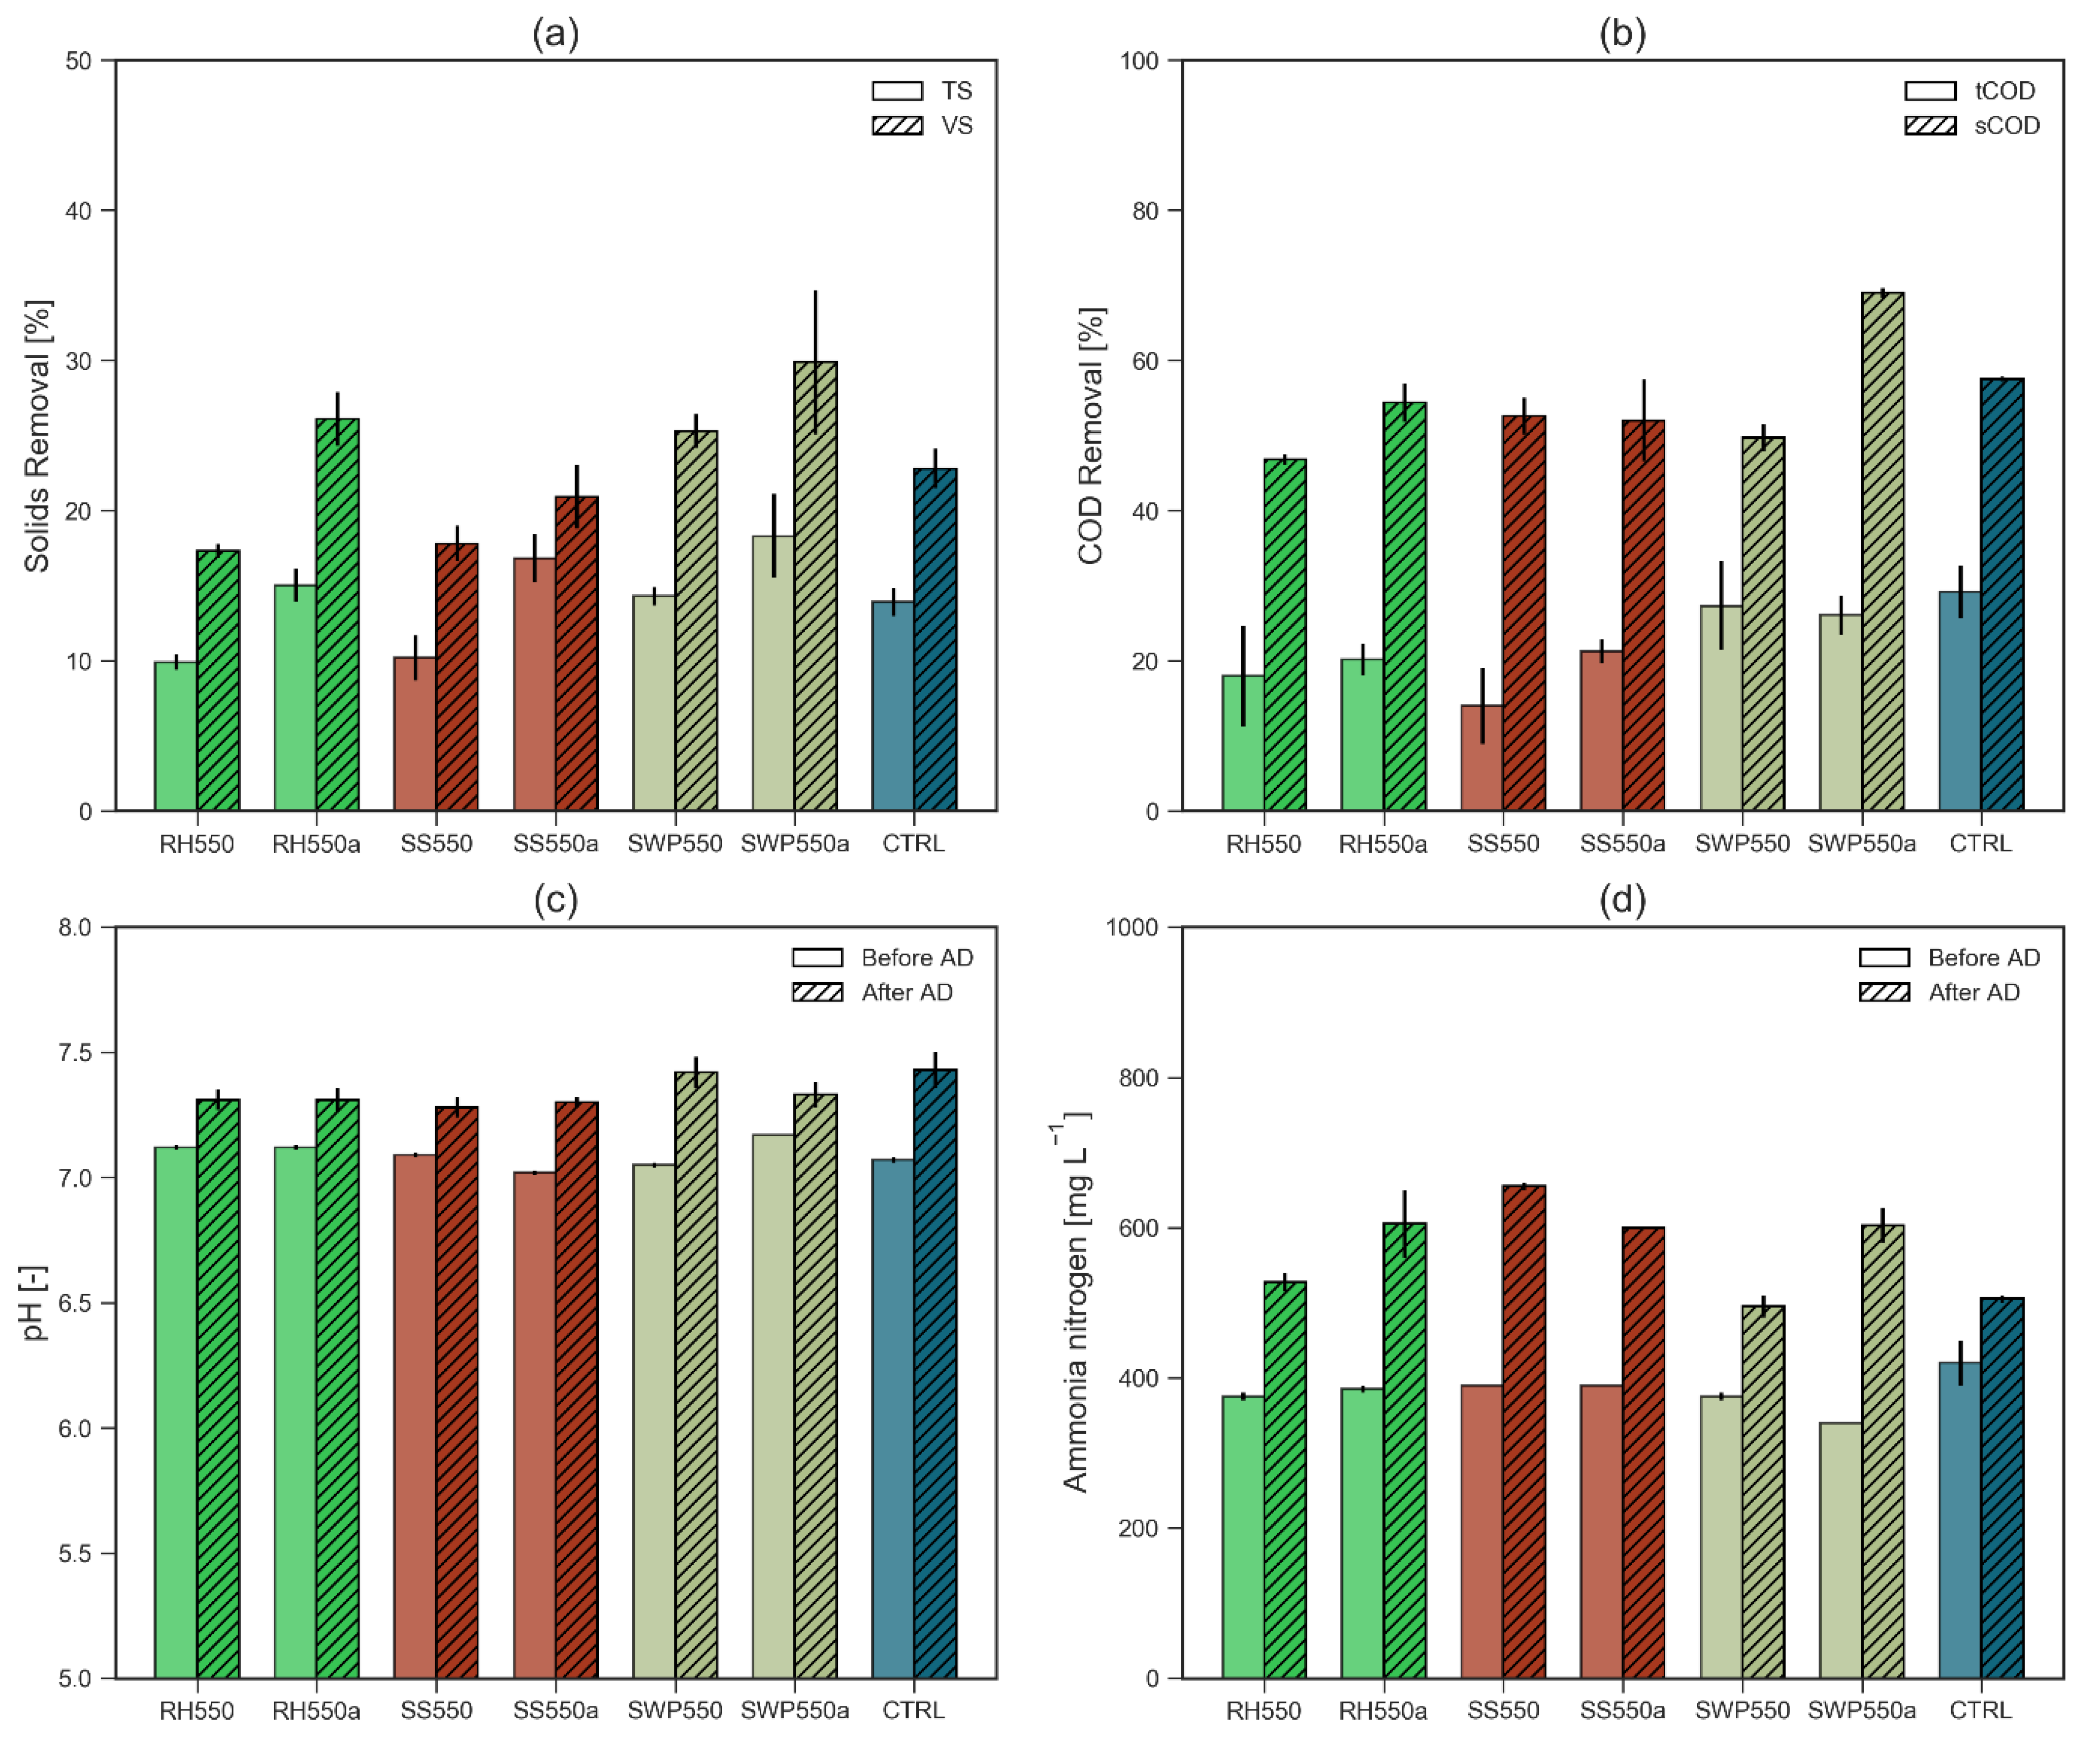
2.2.3. Sludge Properties

Sludge samples before and after AD were characterized in all tested conditions (Figure 2). Obviously, with respect to CTRL, TS was enhanced by around 10 g L−1 after BCs addition. Due to the diverse ash content of the BCs (Table 2), the initial VS were increased to different extents, in the order SW > RH > SS > CTRL. In all cases, TS and vs decreased at the end of AD. In all experimental conditions, the removal was determined as the difference between the initial and final concentration of the tested condition normalized by the initial concentration of CTRL. Overall, TS and vs removals (Figure 2a) were in the ranges 10–18% and 17–30%, respectively. TS removals were in the order SWP550a > SS550a > RH550a > SWP550 > CTRL > SS550 > RH550, similar to biogas production. VS removals were larger for SWP550a, RH550a, and SWP550 than CTRL, and lower for the other BCs.
The initial total and soluble chemical oxygen demand (tCOD and sCOD) were also affected by BCs’ supplementation. As for VS, initial tCOD was enhanced to different extents by BCs (25.5–35.2 g L−1) compared to CTRL (25.3 ± 0.8 g L−1). The initial sCOD decreased by 15% and 20% for RH550 and RH550a, respectively, compared to CTRL (787 ± 1 mg L−1), by 18% for both SS550 and SS550a, and by 8% for SWP550. These BCs could remove some soluble degradable compounds, such as organic acids, as suggested in a previous study [31], especially SS and RH BCs, characterized by a large ash content with significant amounts of AAEMs (see Section 2.1). Surprisingly, the initial sCOD of SWP550a was larger (+7%) than CTRL. At the end of AD, tCOD and sCOD were reduced, respectively, in a range of 14–29% and 47–69% in all tested conditions (Figure 2b). However, the removals of tCOD and sCOD were not enhanced by BCs’ addition compared to CTRL.
In all cases, initial pH values were between 7.0 and 7.2 (Figure 2c), in the optimal range for methanogens. Despite the alkaline nature of the considered BCs (Table 2), especially RH550 and RH550a, the 10 g L−1 dose wasn’t sufficient to significantly affect the initial pH value. Other studies [20,23] have described an increase in initial pH reactors with BCs’ addition, due to much higher doses compared to the present study. As expected, at the end of AD the pH was slightly alkaline (7.3–7.4), indicating good AD process stability.
Finally, initial ammonia nitrogen (Figure 2d) in BCs reactors was lower than CTRL (420 ± 30 mg L−1), in the order: SWP550a (−19%), RH550 (−11%), SWP550 (−11%), RH550a (−8%), SS550 (−7%), and SS550a (−7%). SWP550a could remove more ammonia nitrogen than other BCs, due to the larger SA and PV (physical sorption), and the higher presence of acidic functional groups (ion exchange) [46]. At the end of AD, ammonia nitrogen was enhanced, caused by mineralization reactions, ranging from 495 to 655 mg L−1; lower than inhibitory concentrations for AD [46,47]. CTRL, SWP550, and RH550 exhibited the lowest increments of ammonia nitrogen during AD; SS550 and SWP550a presented the largest increments, despite the initial removal. These results were in contrast with a previous study [31] where we observed lower increments of ammonia nitrogen during AD for RH550a, SS550a, and SWP550a compared with CTRL.

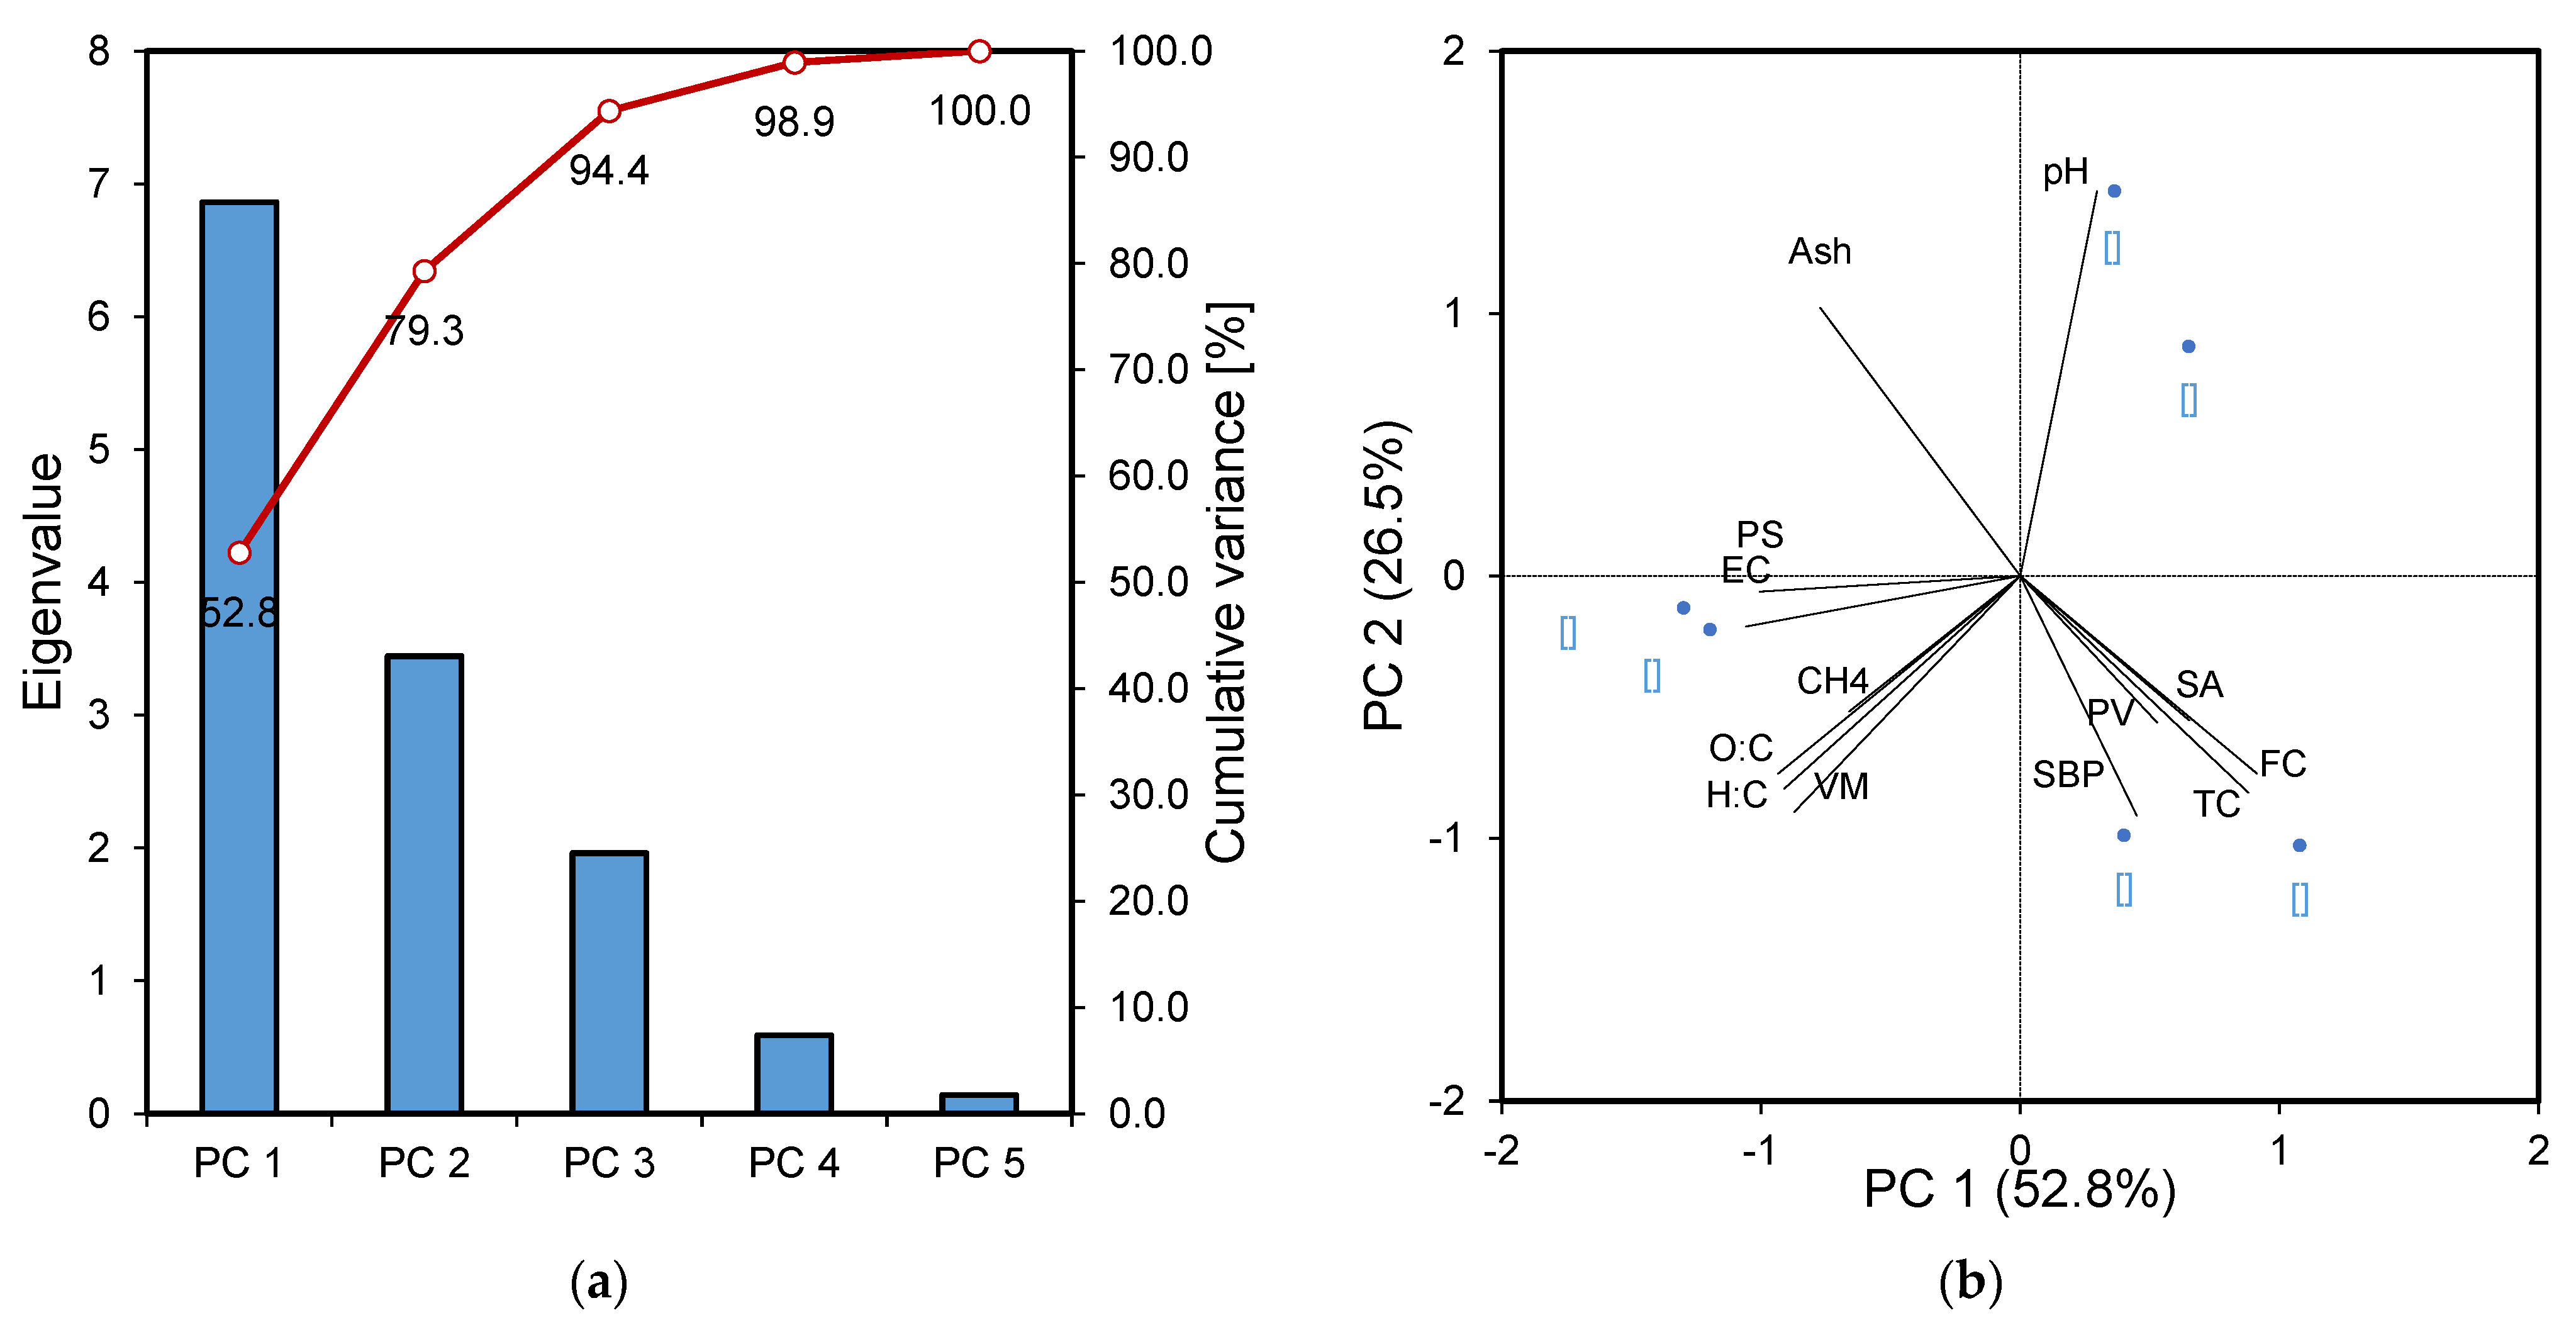
2.2.4. Principal Component Analysis

The selected 11 key properties of the BCs (see Section 3.5) were processed together with biogas and methane productions by principal component analysis (PCA) to identify potential correlations. The main results of PCA analysis are shown in Figure 3. The scree plot (Figure 3a) shows the eigenvalues and the cumulative variance associated with the first five principal components (PCs). Only the first three PCs presented eigenvalues larger than 1, satisfying Kaiser’s criteria. In detail, PC1 expressed 52.8% of total variance, followed by PC2 (26.5%) and PC3 (15.1%). Therefore, only PC1, PC2, and PC3 were considered for further analysis, accounting for 94.4% of the total variance.
The biplot of the loadings of the variables and the scores of samples in the dimensions PC1 and PC2 are shown in Figure 3b. Here, the angle between the two vector variables expressed their correlation. Therefore, methane production (CH4) was shown to reasonably correlate with O–C and H–C molar ratios, and volatile matter (VM) of BCs, which almost overlapped. The correlation between CH4 and H–C and O–C molar ratios may be related to the BC capability of accelerating electron transfer mechanisms and methanation. BCs can promote electron transfer between syntrophic bacteria and methanogens, through their redox-active functional groups (such as hydroquinone and quinone) or through direct electron transfer by their condensed aromatic structures [48,49]. H–C and O–C molar ratios of BCs are related to the extent of carbon matrices or functional groups contributions to electron transfer [25,50], where high H–C and O–C ratios suggest the predominance of electron transfer mediated by the functional groups, while lower ratios indicate the dominance of direct electron transfer by carbon matrices of BCs. Surprisingly, CH4 seemed to be unrelated to biogas production (SBP). Diverse biogas and methane productions may be influenced by different factors. For instance, Shen et al. (2015) [20] observed a reduced biogas production and enhanced methane production in BCs amended reactors compared to CTRL during the AD of sewage sludge, suggesting the removal of CO2 by BC through adsorption and mineralization. Another reason may be a major conversion of CO2 to CH4 by aceticlastic methanogens through electron transfer mechanisms mediated by BC [31]. By contrast, a partial inhibition of methanogenesis by BC could seriously affect methane production and. to a lesser extent. The overall biogas production. SBP was reasonably correlated with pore volume (PV), surface area (SA), fixed carbon (FC), and total carbon (TC) but negatively correlated to ash content (ash). A proper pore structure and SA can favor microbial attachment and growth on BC. It is possible that the reduced distance between syntrophic microbial populations may accelerate the exchanges of metabolites between microbial partners [17], potentially enhancing the different steps of AD and biogas production. The distribution of sample scores in the subspace PC1 × PC2 is also shown in Figure 3b. As observed in Section 2.1, the heterogeneity of BCs due to their pyrolysis precursors was also evident from the distribution of scores. SS550 and SS550a were closed to PC1 axis, related to pore size (PS) and electrical conductivity (EC), and quite close to CH4 group. RH550 and RH550a were isolated, explained by pH. Finally, SWP550 and SWP550a were clustered with SBP, and strongly related to PV, SA, FC, and TC.

3. Materials and Methods

3.1. Materials

Three standard BC samples were produced at the UK Biochar Research Centre (UKBRC, University of Edinburgh, Edinburgh, UK). The BCs from rice husk (RH550), sewage sludge (SS550), and soft wood pellets (SWP550) were produced in a pilot-scale pyrolysis unit at 550 °C. Then, aliquots of three BC samples were subjected to physical activation by CO2 (60 mL min−1, 900 °C, 2 h) at the Institute for Chemical and Fuels from Alternative Resources (ICFAR, Western University, London, OT, Canada), obtaining RH550a, SS550a, and SWP550a. They are named “550” referring to the pyrolysis temperature, and “a” when activated [31]. The six BC samples were characterized according to Section 3.3.
Mixed sludge (MS) and the inoculum were obtained from a WWTP, located in Italy, with a population equivalent of around 500,000. MS, made of PS and WAS, was stored at 4 °C prior to usage. Inoculum, consisting of anaerobic digestate from a mesophilic digester in the same WWTP, was degassed in water bath at 37 °C for one week [51].

3.2. Setup of Anaerobic Digestion Tests

The AD tests were conducted in batch mode using the experimental apparatus described in a previous study [31]. Each reactor consisted of a Duran glass bottle (0.25 L working volume), connected to a biogas or methane sampling apparatus (see Section 3.3). In total, 48 reactors were operated in parallel and divided into 8 groups; 6 groups supplemented with BCs (RH550, SS550, SWP550) and with activated BCs (RH550a, SS550a, SWP550a), a control group without any additive (CTRL), and a blank group with inoculum alone to measure the endogenous methane production from inoculum. In the BC groups, the reactors were supplemented with 10 g L−1 of BC [13,26]. In each group, 3 replicate reactors were used for biogas monitoring and 3 for methane measurement. The substrate to inoculum ratio was set to 1:1 as VS, and TS of substrate was adjusted to 3% wt by water addition. Reactors were operated in mesophilic conditions (37 ± 1 °C) through a thermostatic water bath. Manual mixing was provided twice a day. Before the start-up, the reactors were sparged with N2 gas for 30 s. The duration of AD tests was 28 days, until marginal methane production was below 1% [51]. Biogas and methane productions were monitored during AD test. Samples of sludge were taken for each group at the beginning and end of the AD test and characterized (Section 3.3).

3.3. Analytical Methods

The characterization of the BCs was conducted as described in a previous study [31].
Biogas and methane productions were measured by a volumetric method through water displacement. In brief, biogas was collected in a 2 L multi-layer foil gas bag (30238-U, Supelco, Bellefonte, PA, USA). A Drechsel washing bottle was used to periodically measure volume of biogas cumulated in each gas bag by water displacement. Instead, each reactor for CH4 monitoring was connected to a 0.1 L Duran glass bottle with a 3 N NaOH washing solution and thymolphthalein pH indicator for the chemical absorption of CO2 and H2S from biogas [52,53,54]. CO2 in biogas is physically absorbed to aqueous CO2 and reacts with NaOH to produce sodium carbonate (Na2CO3) [55,56]. Thymolphthalein was used to alert an eventual exhaustion of the washing solution. The volume of methane cumulated in the output gas bag was determined by water displacement as for biogas. Biogas and methane volumes were normalized to standard temperature and pressure (0 °C, 1 atm). In each case, biogas and methane production of inoculum (blank group) were subtracted. Specific biogas and methane productions were expressed as volume per mass of vs of the substrate supplied (Nm3 kgVS−1).
Samples of substrate, inoculum, and sludge from the reactors were characterized for the main physic-chemical AD parameters, as described elsewhere [31]. In brief, total solids (TS) and volatile solids (TS) were determined according to the methods in reference [57]. Total and soluble chemical oxygen demand (tCOD and sCOD, respectively), ammonia nitrogen, and organic acids were measured using commercial tube tests (Nanocolor, Macherey-Nagel, Düren, Germany) with a portable photometer (PF12Plus, Macherey-Nagel). pH was determined with a benchtop pH-meter (pH80 + DHS, XS Instruments, Carpi, Italy). All parameters were measured at least in duplicate. Mean values and standards errors were calculated, using error propagation in case of derived variables.

3.4. Determination of Kinetic Parameters

In order to determine the methanogenic kinetic parameters, the experimental cumulative methane productions were fitted by the modified Gompertz equation [58,59]
B(t) = P exp {−exp [(Rmax e)/P (λ−t) + 1]}
where B(t) is the cumulative methane production (Nm3 kgVS−1) at time t (d), P is the methane potential of the substrate (Nm3 kgVS−1), Rmax is the maximum methane production rate (Nm3 kgVS−1 d−1), e is the Euler’s number, and λ is the lag-phase (d). The model fitting was assessed through the coefficient of determination (R2). Non-linear regression with the least squares method was used to fit experimental data in Microsoft Excel 2016 [60].

3.5. Principal Component Analysis

The Principal Component Analysis (PCA) is a multivariate method used to reduce the dimensionality of a dataset. PCA was performed with statistiXL 2.0 software (Nedlands, Australia) to identify the potential correlations between the physic-chemical properties of BCs and biogas and methane productions (SBP and CH4, respectively). Eleven properties of BCs were considered, including surface area (SA), pore volume (PV), pore size (PS), pH, electrical conductivity (EC), ash, volatile matter (VM), fixed and total carbon (FC and TC, respectively), H–C and O–C ratios. A new set of uncorrelated variables, named principal components (PCs), was determined as linear combinations in the initial space of variables. The first PCs explain the most of the total variability in data: the first component (PC1) explains the maximum information, the second component (PC2) accounts for the maximum of the remaining information, and so on [61]. The number of PCs for a good explanation of the variation in the dataset was defined according to Kaiser’s criteria with eigenvalue >1 [62]. Therefore, the dataset was projected in the new subspace. The loading plots and scores plots were produced. A score is a projection of a sample on a certain PC. A scatter plot of any pair of scores allows to view the relative positions of samples [61] in any 2 PCs subspace. Each score plot corresponds to a loading plot. A loading is calculated as cosine angle between a vector variable and a PC [61], expressing how much they correlate to each other. In a loading plot, angles between vectors express correlations between associated variables: angles close to 0°, 180°, and 90° represent, respectively, positively and negatively correlated, and uncorrelated variables. Therefore, samples located in a certain part of a score plot can be correlated with vector variables in the same part of the corresponding loading plot [32].

4. Conclusions

This work investigated the impacts of six BCs with different physic-chemical properties on methane production and kinetics during the AD of MS. All BCs exhibited larger biogas yields (up to 30%) than the control group. Most BCs were beneficial for methane yields (up to 22%) compared to control (0.15 Nm3 kgVS−1), although detrimental effects were also observed. However, the addition of BCs did not significantly affect the maximum methane production rate and the lag-phase. The PCA identified a reasonable correlation between methane production and O–C and H–C molar ratios, and the volatile matter of the BCs, as well as between biogas production and pore volume, and specific surface area and fixed and total carbon. Therefore, the physic-chemical features of the BCs showed a crucial role in enhancing methane production from mixed sludge. However, further research is needed to better understand the correlations between AD performance and BCs’ features to identify their optimal range and produce BCs customized for this application.

Author Contributions

Conceptualization, M.C. and S.F.; methodology, S.F.; investigation, M.C. and F.C.; data curation, M.C. and F.C.; writing—original draft preparation, M.C.; writing—review and editing, S.F., F.B., O.M. and F.C.; supervision, S.F. All authors have read and agreed to the published version of the manuscript.

Funding

This research received no external funding.

Acknowledgments

The authors gratefully acknowledge CORDAR Biella Servizi SpA for providing the wastewater sludge and the digestate employed in the research.

Conflicts of Interest

The authors declare no conflict of interest.

References

  1. Gebreeyessus, G.; Jenicek, P. Thermophilic versus Mesophilic Anaerobic Digestion of Sewage Sludge: A Comparative Review. Bioengineering 2016, 3, 15. [Google Scholar] [CrossRef]
  2. Gherghel, A.; Teodosiu, C.; De Gisi, S. A review on wastewater sludge valorisation and its challenges in the context of circular economy. J. Clean. Prod. 2019, 228, 244–263. [Google Scholar] [CrossRef]
  3. Shaddel, S.; Bakhtiary-Davijany, H.; Kabbe, C.; Dadgar, F.; Østerhus, S. Sustainable Sewage Sludge Management: From Current Practices to Emerging Nutrient Recovery Technologies. Sustainability 2019, 11, 3435. [Google Scholar] [CrossRef] [Green Version]
  4. Raheem, A.; Sikarwar, V.S.; He, J.; Dastyar, W.; Dionysiou, D.D.; Wang, W.; Zhao, M. Opportunities and challenges in sustainable treatment and resource reuse of sewage sludge: A review. Chem. Eng. J. 2018, 337, 616–641. [Google Scholar] [CrossRef]
  5. Oladejo, J.; Shi, K.; Luo, X.; Yang, G.; Wu, T. A Review of Sludge-to-Energy Recovery Methods. Energies 2018, 12, 60. [Google Scholar] [CrossRef] [Green Version]
  6. Maktabifard, M.; Zaborowska, E.; Makinia, J. Achieving Energy Neutrality in Wastewater Treatment Plants Through Energy Savings and Enhancing Renewable Energy Production; Springer: Berlin/Heidelberg, Germany, 2018; Volume 17, ISBN 1115701894. [Google Scholar]
  7. Gu, Y.; Li, Y.; Li, X.; Luo, P.; Wang, H.; Robinson, Z.P.; Wang, X.; Wu, J.; Li, F. The feasibility and challenges of energy self-sufficient wastewater treatment plants. Appl. Energy 2017, 204, 1463–1475. [Google Scholar] [CrossRef] [Green Version]
  8. Bolzonella, D.; Pavan, P.; Battistoni, P.; Cecchi, F. Mesophilic anaerobic digestion of waste activated sludge: Influence of the solid retention time in the wastewater treatment process. Process. Biochem. 2005, 40, 1453–1460. [Google Scholar] [CrossRef]
  9. Khanh Nguyen, V.; Kumar Chaudhary, D.; Hari Dahal, R.; Hoang Trinh, N.; Kim, J.; Chang, S.W.; Hong, Y.; Duc La, D.; Nguyen, X.C.; Hao Ngo, H.; et al. Review on pretreatment techniques to improve anaerobic digestion of sewage sludge. Fuel 2021, 285, 119105. [Google Scholar] [CrossRef]
  10. Zhen, G.; Lu, X.; Kato, H.; Zhao, Y.; Li, Y.Y. Overview of pretreatment strategies for enhancing sewage sludge disintegration and subsequent anaerobic digestion: Current advances, full-scale application and future perspectives. Renew. Sustain. Energy Rev. 2017, 69, 559–577. [Google Scholar] [CrossRef]
  11. Chow, W.L.; Chong, S.; Lim, J.W.; Chan, Y.J.; Chong, M.F.; Tiong, T.J.; Chin, J.K.; Pan, G.-T. Anaerobic co-digestion of wastewater sludge: A review of potential co-substrates and operating factors for improved methane yield. Processes 2020, 8, 39. [Google Scholar] [CrossRef] [Green Version]
  12. Elalami, D.; Carrere, H.; Monlau, F.; Abdelouahdi, K.; Oukarroum, A.; Barakat, A. Pretreatment and co-digestion of wastewater sludge for biogas production: Recent research advances and trends. Renew. Sustain. Energy Rev. 2019, 114, 109287. [Google Scholar] [CrossRef]
  13. Lü, C.; Shen, Y.; Li, C.; Zhu, N.; Yuan, H. Redox-active biochar and conductive graphite stimulate methanogenic metabolism in anaerobic digestion of waste-activated sludge: Beyond direct interspecies electron transfer. ACS Sustain. Chem. Eng. 2020, 8, 12626–12636. [Google Scholar] [CrossRef]
  14. Lu, J.S.; Chang, J.S.; Lee, D.J. Adding carbon-based materials on anaerobic digestion performance: A mini-review. Bioresour. Technol. 2020, 300, 122696. [Google Scholar] [CrossRef] [PubMed]
  15. Zhang, J.; Zhao, W.; Zhang, H.; Wang, Z.; Fan, C.; Zang, L. Recent achievements in enhancing anaerobic digestion with carbon- based functional materials. Bioresour. Technol. 2018, 266, 555–567. [Google Scholar] [CrossRef]
  16. Wu, Y.; Wang, S.; Liang, D.; Li, N. Conductive materials in anaerobic digestion: From mechanism to application. Bioresour. Technol. 2020, 298. [Google Scholar] [CrossRef] [PubMed]
  17. Chiappero, M.; Norouzi, O.; Hu, M.; Demichelis, F.; Berruti, F.; Di Maria, F.; Mašek, O.; Fiore, S. Review of biochar role as additive in anaerobic digestion processes. Renew. Sustain. Energy Rev. 2020, 131. [Google Scholar] [CrossRef]
  18. Bartoli, M.; Giorcelli, M.; Jagdale, P.; Rovere, M.; Tagliaferro, A. A Review of Non-Soil Biochar Applications. Materials 2020, 13, 261. [Google Scholar] [CrossRef] [PubMed] [Green Version]
  19. Zhang, Z.; Zhu, Z.; Shen, B.; Liu, L. Insights into biochar and hydrochar production and applications: A review. Energy 2019, 171, 581–598. [Google Scholar] [CrossRef]
  20. Shen, Y.; Linville, J.L.; Urgun-Demirtas, M.; Schoene, R.P.; Snyder, S.W. Producing pipeline-quality biomethane via anaerobic digestion of sludge amended with corn stover biochar with in-situ CO2 removal. Appl. Energy 2015, 158, 300–309. [Google Scholar] [CrossRef] [Green Version]
  21. Zhang, M.; Wang, Y. Effects of Fe-Mn-modified biochar addition on anaerobic digestion of sewage sludge: Biomethane production, heavy metal speciation and performance stability. Bioresour. Technol. 2020, 313. [Google Scholar] [CrossRef]
  22. Zhou, H.; Brown, R.C.; Wen, Z. Biochar as an additive in anaerobic digestion of municipal sludge: Biochar properties and their effects on the digestion performance. ACS Sustain. Chem. Eng. 2020, 8, 6391–6401. [Google Scholar] [CrossRef]
  23. Shen, Y.; Linville, J.L.; Ignacio-de Leon, P.A.A.; Schoene, R.P.; Urgun-Demirtas, M. Towards a sustainable paradigm of waste-to-energy process: Enhanced anaerobic digestion of sludge with woody biochar. J. Clean. Prod. 2016, 135, 1054–1064. [Google Scholar] [CrossRef] [Green Version]
  24. Shen, Y.; Forrester, S.; Koval, J.; Urgun-Demirtas, M. Yearlong semi-continuous operation of thermophilic two-stage anaerobic digesters amended with biochar for enhanced biomethane production. J. Clean. Prod. 2017, 167, 863–874. [Google Scholar] [CrossRef]
  25. Shen, Y.; Yu, Y.; Zhang, Y.; Urgun-Demirtas, M.; Yuan, H.; Zhu, N.; Dai, X. Role of redox-active biochar with distinctive electrochemical properties to promote methane production in anaerobic digestion of waste activated sludge. J. Clean. Prod. 2021, 278. [Google Scholar] [CrossRef]
  26. Wang, P.; Peng, H.; Adhikari, S.; Higgins, B.; Roy, P.; Dai, W.; Shi, X. Enhancement of biogas production from wastewater sludge via anaerobic digestion assisted with biochar amendment. Bioresour. Technol. 2020, 309. [Google Scholar] [CrossRef]
  27. Wei, W.; Guo, W.; Ngo, H.H.; Mannina, G.; Wang, D.; Chen, X.; Liu, Y.; Peng, L.; Ni, B.-J. Enhanced high-quality biomethane production from anaerobic digestion of primary sludge by corn stover biochar. Bioresour. Technol. 2020, 306. [Google Scholar] [CrossRef] [PubMed]
  28. Wu, B.; Yang, Q.; Yao, F.; Chen, S.; He, L.; Hou, K.; Pi, Z.; Yin, H.; Fu, J.; Wang, D.; et al. Evaluating the effect of biochar on mesophilic anaerobic digestion of waste activated sludge and microbial diversity. Bioresour. Technol. 2019, 294. [Google Scholar] [CrossRef]
  29. Yin, C.; Shen, Y.; Yuan, R.; Zhu, N.; Yuan, H.; Lou, Z. Sludge-based biochar-assisted thermophilic anaerobic digestion of waste-activated sludge in microbial electrolysis cell for methane production. Bioresour. Technol. 2019, 284, 315–324. [Google Scholar] [CrossRef] [PubMed]
  30. Zhang, M.; Li, J.; Wang, Y.; Yang, C. Impacts of different biochar types on the anaerobic digestion of sewage sludge. RSC Adv. 2019, 9, 42375–42386. [Google Scholar] [CrossRef] [Green Version]
  31. Chiappero, M.; Berruti, F.; Mašek, O.; Fiore, S. Analysis of the influence of activated biochar properties on methane production from anaerobic digestion of waste activated sludge. Biomass Bioenergy 2021, 150, 106129. [Google Scholar] [CrossRef]
  32. El Achkar, J.H.; Lendormi, T.; Hobaika, Z.; Salameh, D.; Louka, N.; Maroun, R.G.; Lanoisellé, J.L. Anaerobic digestion of nine varieties of grape pomace: Correlation between biochemical composition and methane production. Biomass Bioenergy 2017, 107, 335–344. [Google Scholar] [CrossRef]
  33. Metcalf & Eddy; Tchobanoglous, G.; Stensel, H.D.; Tsuchihashi, R.; Burton, F. Wastewater Engineering: Treatment and Resource Recovery, 5th ed.; McGraw-Hill Education: New York, NY, USA, 2013; ISBN 9780073401188. [Google Scholar]
  34. Jindo, K.; Mizumoto, H.; Sawada, Y.; Sanchez-Monedero, M.A.; Sonoki, T. Physical and chemical characterization of biochars derived from different agricultural residues. Biogeosciences 2014, 11, 6613–6621. [Google Scholar] [CrossRef] [Green Version]
  35. Qambrani, N.A.; Rahman, M.M.; Won, S.; Shim, S.; Ra, C. Biochar properties and eco-friendly applications for climate change mitigation, waste management, and wastewater treatment: A review. Renew. Sustain. Energy Rev. 2017, 79, 255–273. [Google Scholar] [CrossRef]
  36. Johar, N.; Ahmad, I.; Dufresne, A. Extraction, preparation and characterization of cellulose fibres and nanocrystals from rice husk. Ind. Crop. Prod. 2012, 37, 93–99. [Google Scholar] [CrossRef]
  37. Zhang, Y.; Ma, Z.; Zhang, Q.; Wang, J.; Ma, Q.; Yang, Y.; Luo, X.; Zhang, W. Comparison of the physicochemical characteristics of bio-char pyrolyzed from moso bamboo and rice husk with different pyrolysis temperatures. BioResources 2017, 12, 4652–4669. [Google Scholar] [CrossRef] [Green Version]
  38. Wang, L.; Chang, Y.; Li, A. Hydrothermal carbonization for energy-efficient processing of sewage sludge: A review. Renew. Sustain. Energy Rev. 2019, 108, 423–440. [Google Scholar] [CrossRef]
  39. Fonts, I.; Gea, G.; Azuara, M.; Ábrego, J.; Arauzo, J. Sewage sludge pyrolysis for liquid production: A review. Renew. Sustain. Energy Rev. 2012, 16, 2781–2805. [Google Scholar] [CrossRef]
  40. Prakongkep, N.; Gilkes, R.J.; Wiriyakitnateekul, W.; Duangchan, A. The effects of pyrolysis conditions on the chemical and physical properties of rice husk biochar. Int. J. Mater. Sci. 2013, 3, 97–103. [Google Scholar]
  41. Zhang, J.; Lü, F.; Zhang, H.; Shao, L.; Chen, D.; He, P. Multiscale visualization of the structural and characteristic changes of sewage sludge biochar oriented towards potential agronomic and environmental implication. Sci. Rep. 2015, 5, 1–8. [Google Scholar] [CrossRef] [Green Version]
  42. Li, H.; Dong, X.; da Silva, E.B.; de Oliveira, L.M.; Chen, Y.; Ma, L.Q. Mechanisms of metal sorption by biochars: Biochar characteristics and modifications. Chemosphere 2017, 178, 466–478. [Google Scholar] [CrossRef]
  43. Rehrah, D.; Reddy, M.R.; Novak, J.M.; Bansode, R.R.; Schimmel, K.A.; Yu, J.; Watts, D.W.; Ahmedna, M. Production and characterization of biochars from agricultural by-products for use in soil quality enhancement. J. Anal. Appl. Pyrolysis 2014, 108, 301–309. [Google Scholar] [CrossRef]
  44. Speece, R.E. A survey of municipal anaerobic sludge digesters and diagnostic activity assays. Water Res. 1988, 22, 365–372. [Google Scholar] [CrossRef]
  45. Wang, G.; Li, Q.; Li, Y.; Xing, Y.; Yao, G.; Liu, Y.; Chen, R.; Wang, X.C. Redox-active biochar facilitates potential electron tranfer between syntrophic partners to enhance anaerobic digestion under high organic loading rate. Bioresour. Technol. 2020, 298. [Google Scholar] [CrossRef] [PubMed]
  46. Yin, Q.; Zhang, B.; Wang, R.; Zhao, Z. Biochar as an adsorbent for inorganic nitrogen and phosphorus removal from water: A review. Environ. Sci. Pollut. Res. 2017, 24, 26297–26309. [Google Scholar] [CrossRef] [PubMed]
  47. Chen, Y.; Cheng, J.J.; Creamer, K.S. Inhibition of anaerobic digestion process: A review. Bioresour. Technol. 2008, 99, 4044–4064. [Google Scholar] [CrossRef]
  48. Yenigün, O.; Demirel, B. Ammonia inhibition in anaerobic digestion: A review. Process. Biochem. 2013, 48, 901–911. [Google Scholar] [CrossRef]
  49. Zhao, W.; Yang, H.; He, S.; Zhao, Q.; Wei, L. A review of biochar in anaerobic digestion to improve biogas production: Performances, mechanisms and economic assessments. Bioresour. Technol. 2021, 341, 125797. [Google Scholar] [CrossRef]
  50. Sun, T.; Levin, B.D.A.; Guzman, J.J.L.; Enders, A.; Muller, D.A.; Angenent, L.T.; Lehmann, J. Rapid electron transfer by the carbon matrix in natural pyrogenic carbon. Nat. Commun. 2017, 1–12. [Google Scholar] [CrossRef] [Green Version]
  51. Holliger, C.; Alves, M.; Andrade, D.; Angelidaki, I.; Astals, S.; Baier, U.; Bougrier, C.; Buffière, P.; Carballa, M.; de Wilde, V.; et al. Towards a standardization of biomethane potential tests. Water Sci. Technol. 2016, 74, 2515–2522. [Google Scholar] [CrossRef]
  52. Qin, Y.; Wang, H.; Li, X.; Cheng, J.J.; Wu, W. Improving methane yield from organic fraction of municipal solid waste (OFMSW) with magnetic rice-straw biochar. Bioresour. Technol. 2017, 245, 1058–1066. [Google Scholar] [CrossRef]
  53. Esposito, G. Bio-Methane Potential Tests to Measure The Biogas Production from The Digestion and Co-Digestion of Complex Organic Substrates. Open Environ. Eng. J. 2012, 5, 1–8. [Google Scholar] [CrossRef]
  54. McEniry, J.; Allen, E.; Murphy, J.D.; O’Kiely, P. Grass for biogas production: The impact of silage fermentation characteristics on methane yield in two contrasting biomethane potential test systems. Renew. Energy 2014, 63, 524–530. [Google Scholar] [CrossRef]
  55. Yoo, M.; Han, S.J.; Wee, J.H. Carbon dioxide capture capacity of sodium hydroxide aqueous solution. J. Environ. Manag. 2013, 114, 512–519. [Google Scholar] [CrossRef]
  56. Pham, C.H.; Triolo, J.M.; Cu, T.T.T.; Pedersen, L.; Sommer, S.G. Validation and recommendation of methods to measure biogas production potential of animal manure. Asian-Australas. J. Anim. Sci. 2013, 26, 864–873. [Google Scholar] [CrossRef] [PubMed] [Green Version]
  57. APHA-AWWA-WEF. Standard Methods for the Examination of Water and Wastewater, 22nd ed.; American Public Health Association, American Water Works Association, and Water Environment Federation: Washington, DC, USA, 2012. [Google Scholar]
  58. Zwietering, M.H.; Jongenburger, I.; Rombouts, F.M.; van’t Riet, K. Modeling of the Bacterial Growth Curve. Appl. Environ. Microbiol. 1990, 56, 1875–1881. [Google Scholar] [CrossRef] [PubMed] [Green Version]
  59. Veluchamy, C.; Kalamdhad, A.S. Enhanced methane production and its kinetics model of thermally pretreated lignocellulose waste material. Bioresour. Technol. 2017, 241, 1–9. [Google Scholar] [CrossRef] [PubMed]
  60. Brown, A.M. A step-by-step guide to non-linear regression analysis of experimental data using a Microsoft Excel spreadsheet. Comput. Methods Programs Biomed. 2001, 65, 191–200. [Google Scholar] [CrossRef]
  61. Molinuevo-Salces, B.; Fernández-Varela, R.; Uellendahl, H. Key factors influencing the potential of catch crops for methane production. Environ. Technol. 2014, 35, 1685–1694. [Google Scholar] [CrossRef]
  62. Bayard, R.; Benbelkacem, H.; Gourdon, R.; Buffière, P. Characterization of selected municipal solid waste components to estimate their biodegradability. J. Environ. Manag. 2018, 216, 4–12. [Google Scholar] [CrossRef]
Figure 1. Cumulative biogas and methane productions from the AD of mixed sludge with BCs addition: (a) Biogas production of RH550, RH550a, and CTRL groups; (b) Methane production of RH550, RH550a, and CTRL groups; (c) Biogas of SS550, SS550a, and CTRL; (d) Methane of SS550, SS550a, and CTRL; (e) Biogas of SWP550, SWP550a, and CTRL; (f) Methane of SWP550, SWP550a, and CTRL.
Catalysts 11 01094 g001
Figure 2. Removal of organic matter during anaerobic digestion (AD) and sludge properties before and after AD: (a) Removals of total solids (TS) and volatile solids (VS) during AD; (b) Removals of total (tCOD) and soluble COD (sCOD) during AD; (c) pH before and after AD; (d) Ammonia nitrogen before and after AD.
Catalysts 11 01094 g002
Figure 3. Results of principal component analysis (PCA) between physic-chemical properties of the biochars, biogas and methane productions: (a) Scree plot of the first principal components (PCs); (b) Biplot with loadings and scores for PC1 and PC2.
Catalysts 11 01094 g003
Table 1. Characteristics of mixed sludge (substrate) and anaerobic digestate (inoculum) (standard errors between parentheses).
Parameter (Unit)Mixed SludgeInoculum
pH units6.14 (0.003)7.33 (0.003)
Total solids, TS (% wt)3.33 (0.01)2.51 (0.04)
Volatile solids, vs. (% wt)2.17 (0.01)1.36 (0.03)
VS/TS (%)65.1 (0.1)54.3 (0.1)
Total COD (g L−1)38.4 (0.9)21.0 (0.7)
Soluble COD (mg L−1)1123 (11)340 (35)
Table 2. Physic-chemical characteristics of the considered biochars (standard deviation in parentheses; ND: not detected).
Parameter (Unit)RH550SS550SWP550RH550aSS550aSWP550a
Specific surface area (m2 g−1)19.215.725.9263.4109.2605.1
Total pore volume (cm3 g−1)0.0120.0100.0270.2090.1690.416
Average pore diameter (nm)4.827.655.253.186.192.75
pH units9.71 (0.26)8.17 (0.64)7.91 (0.30)9.71 (0.26)8.17 (0.64)7.91 (0.30)
Electrical conductivity (dS m−1)0.48 (0.14)280.80 (15.3)0.09 (0.03)0.48 (0.14)280.80 (15.3)0.09 (0.03)
Moisture (% wt)1.54 (0.30)2.48 (0.08)1.52 (0.16)1.54 (0.30)2.48 (0.08)1.52 (0.16)
Ash (% wt)47.93 (5.43)58.89 (0.45)1.25 (0.42)47.93 (5.43)58.89 (0.45)1.25 (0.42)
Volatile matter (% wt)7.48 (1.22)21.37 (0.03)14.20 (0.81)7.48 (1.22)21.37 (0.03)14.20 (0.81)
Fixed C (% wt)43.05 (5.57)17.26 (0.46)83.03 (0.93)43.05 (5.57)17.26 (0.46)83.03 (0.93)
Total C (% wt)48.69 (2.37)29.53 (0.42)85.52 (1.22)48.69 (2.37)29.53 (0.42)85.52 (1.22)
H (% wt)1.24 (0.12)1.33 (0.07)2.77 (0.09)1.24 (0.12)1.33 (0.07)2.77 (0.09)
N (% wt)1.04 (0.09)3.75 (0.08)<0.101.04 (0.09)3.75 (0.08)<0.10
O (% wt)2.47 (0.37)6.50 (0.47)10.36 (1.19)2.47 (0.37)6.50 (0.47)10.36 (1.19)
P (% wt)0.10 (0.07)2.29 (0.05)0.06 (0.04)0.10 (0.07)2.29 (0.05)0.06 (0.04)
K (% wt)0.39 (0.17)0.34 (0.01)0.25 (0.07)0.39 (0.17)0.34 (0.01)0.25 (0.07)
H:C (molar ratio)0.28 (0.06)0.54 (0.03)0.39 (0.01)0.28 (0.06)0.54 (0.03)0.39 (0.01)
O:C (molar ratio)0.04 (0.01)0.17 (0.01)0.09 (0.01)0.04 (0.01)0.17 (0.01)0.09 (0.01)
Elements (mg kg−1)
Al211025,833 (58)1617 (12)ND28,967 (153)1520 (-)
AsND11 (2)ND0.2 (-)13 (2)ND
Ca1550 (36)14,567 (153)3157 (23)1737 (84)16,533 (58)2630 (20)
CdNDNDNDNDNDND
Cl1047 (12)555 (0)81.0 (0.7)744 (1)633 (5)60 (1)
Co11.0 (0.5)191 (6)0.77 (0.04)8.4 (0.8)201 (8)ND
Cr15 (1)265 (6)ND6.2 (0.6)299 (6)ND
Cu8.6 (0.4)81 (2)3.1 (0.1)11.3 (0.3)92.4 (0.6)3.0 (0.1)
HgNDNDNDNDNDND
MgNDNDNDNDNDND
NaNDNDNDNDNDND
Ni7.4 (0.2)12.1 (0.9)1.7 (0.1)5.8 (0.5)13 (1)1.2 (0.2)
PbND98.1NDND99ND
S179 (24)2187 (21)129 (1)114 (8)2457 (23)32 (8)
SeNDNDNDNDNDND
Si116,667 (1155)41,200 (0)717 (9)125,333 (577)48,833 (115)204 (3)
Zn28.4 (0.6)262 (3)11.8 (0.2)35.4 (0.2)296 (2)11.07 (0.06)
Table 3. Kinetic parameters of methane production based on the modified Gompertz model.
BiocharP (Nm3 kgVS−1)Rmax (Nm3 kgVS−1 d−1)λ (d)R2
RH5500.1210.0140.00.960
RH550a0.1530.0260.00.961
SS5500.1620.0240.00.940
SS550a0.1830.0270.00.926
SWP5500.1810.0340.00.936
SWP550a0.1190.0140.00.973
CTRL0.1500.0270.00.910
Publisher’s Note: MDPI stays neutral with regard to jurisdictional claims in published maps and institutional affiliations.

