
Biophotocatalytic Reduction of CO2 in Anaerobic Biogas Produced from Wastewater Treatment Using an Integrated System


Green Engineering and Sustainability Research Group, Department of Chemical Engineering, Faculty of Engineering and the Built Environment, Durban University of Technology, Durban 4001, South Africa
*
Author to whom correspondence should be addressed.
Catalysts 2022, 12(1), 76; https://0-doi-org.brum.beds.ac.uk/10.3390/catal12010076
Submission received: 19 December 2021
/
Revised: 5 January 2022
/
Accepted: 6 January 2022
/
Published: 11 January 2022
(This article belongs to the Special Issue Nanomaterials for Photocatalysis and Piezo-Photocatalysis)
Abstract
:This study presents the bio-photocatalytic upgrading of biogas utilising carbon dioxide (CO2) as a potential option for beginning fossil fuel depletion and the associated environmental risks in the pursuit of sustainable development. Herein, magnetite photocatalyst (Fe-TiO2) was employed with an integrated anaerobic-photomagnetic system for the decontamination of municipality wastewater for biogas production. The Fe-TiO2 photocatalyst used, manufactured via a co-precipitation technique, had a specific surface area of 62.73 m2/g, micropore volume of 0.017 cm3/g and pore size of 1.337 nm. The results showed that using the ultraviolet-visible (UV-Vis) photomagnetic system as a post-treatment to the anaerobic digestion (AD) process was very effective with over 85% reduction in colour, chemical oxygen demand (COD) and turbidity. With an organic loading rate (OLR) of 0.394 kg COD/L·d and hydraulic retention time (HTR) of 21 days, a 92% degradation of the organic content (1.64 kgCOD/L) was attained. This maximised the bioenergy production to 5.52 kWh/m3 with over 10% excess energy to offset the energy demand of the UV-Vis lamp. Assuming 33% of the bioenergy produced was used as electricity to power the UV-Vis lamp, the CO2 emission reduction was 1.74 kg CO2 e/m3, with good potential for environmental conservation.
1. Introduction
Wastewater continues to be a global problem especially in arid regions with scarce freshwater resources, which are being influenced by anthropogenic activities of industries, agriculture and human settlements [1,2]. Herein, emerging contaminations by refractory organic substances, such as pharmaceuticals and personal care products (PPCPs) as well as endocrine-disrupting chemicals (EDCs), are significantly affecting the sustainability of the water reuse economy [3,4,5]. The continuous burning of fossil fuel and industrial wastewater directly threaten both environmental and socio-economic sustainability [1,6]. The global energy-water insecurity is frightening and requires attention as climate change and wastewater threaten human health and the environment with imbalanced ecosystems [3,7,8]. Therefore, producing biogas from wastewater gives new options in regions where its resource has been disregarded.
Considering the water-energy nexus via the cradle-to-reuse treatment of wastewater as renewable energy resources for biogas production has been reported as a viable alternative to fossil fuels [1,3,9]. Biogas production has significantly increased in recent years, contributing to renewable energy generation and lowering negative environmental impacts such as carbon footprints and soil and water contamination [10,11,12]. Almost all wet organic feedstocks (excluding lignin) can be anaerobically digested to produce biogas [1,12]. Among these are animal waste and crop residues, energy crops, household food and garden waste, industrial wastewater, sewage sludge, as well as the organic fraction of municipal solid waste (MSW) [10,12,13].
Conventional wastewater treatment technologies are inefficient at mineralising or removing emerging pollutants (nanomaterials, antibiotics, pesticides, etc.) [2,14,15]. Therefore, achieving stringent water and biogas quality necessitates multi-barrier approaches (integrated systems). Conversely, refractory organics and inorganics from surface runoffs, landfills or industrial wastewater end route in AD processes can affect its efficacy and operational costs [12,13]. This necessitates an integrated process that includes feedstock supply and pre-treatment, gas production, post-gas treatment and digestate recovery and application [2,13].
In general, an integrated system combines a variety of treatment strategies, which may include both conventional and sophisticated technologies [12]. For example, a biological system followed by either a physical or chemical method, such as adsorption, membranes, advanced oxidation processes (AOPs), etc., seem to be very promising technologies, as reported by Ahmed, et al. [16]. Among them, the integrated AD-AOP is recognised as an attractive solution for treating effluents with a high organic content, consequently increasing bioenergy production in the form of methane [10,12,13,17]. However, different microbes undergo distinct phases (hydrolysis, fermentation and methanogenesis) in the AD process [9,18]. Moreover, variations in the AD process feedstock and environmental conditions can result in high complex sludge that is difficult to treat economically and environmentally [9,12,19]. On this basis, our previous work [17,20,21] and other researched studies [9,12,18,19,22,23,24] show that using a photocatalyst (Fe-TiO2) with magnetic properties has tremendous potential in wastewater settings. With this, and the need to meet future water demands, creating a cost-effective, user-friendly and reliable technology with a significant impact on energy production and recuperation in water settings is urgently needed [3,5,15,16].
On this premise, this study developed and investigated an integrated anaerobic-photomagnetic wastewater treatment system as a viable wastewater remediation technology with biogas production benefits. This integrated system provides a post-treatment solution to the AD process with additional energy to offset the AOP system energy required, whereas the Fe-TiO2 nanocomposite was recovered via an external magnetic filter.
2. Results and Discussion
2.1. The Preliminary Degradation Efficiency
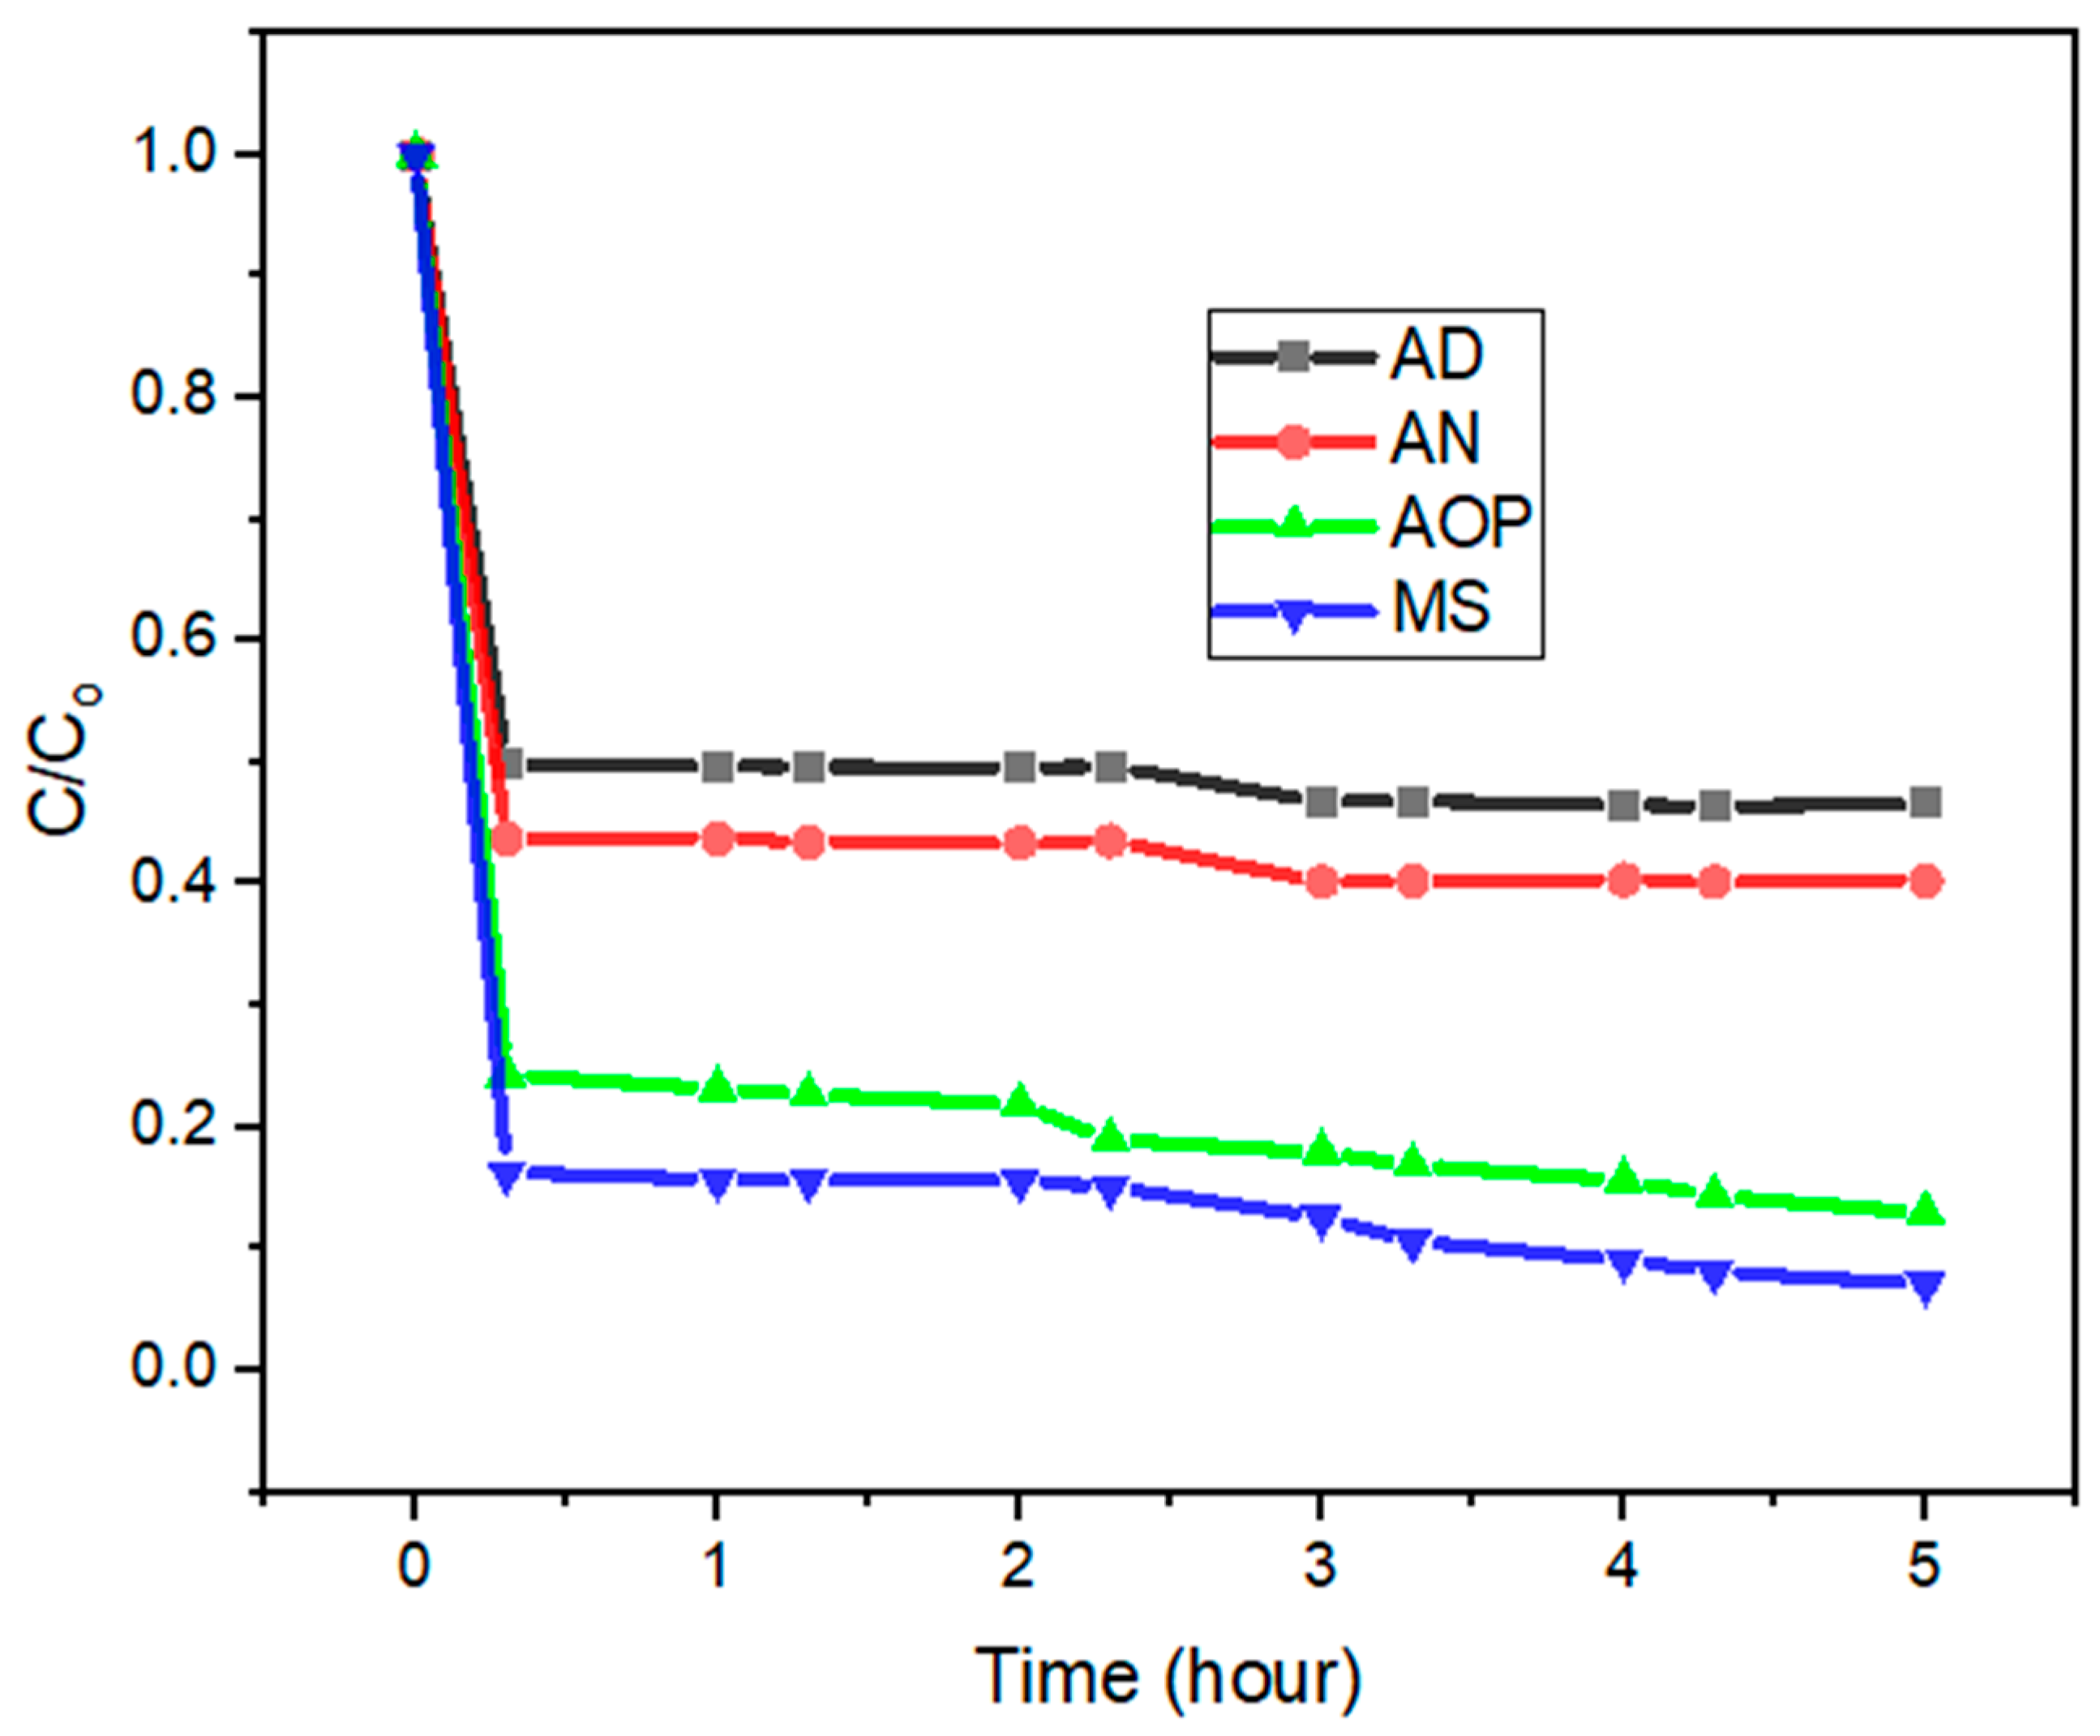
The integrated AD-AOP system assisted with the UV-vis radiation was firstly evaluated to ascertain its recyclability performance. Figure 1 depicts the COD degradation profile for each component of the integrated system over the radiation time of 5 h. The profile shows the system achieved rapid equilibrium, since over 50% conversion was achieved in the first 30 min, where the curves tend to gradually stabilise with the hourly stipulated recycling time. After 5 h of successful recycling, it was observed that the degradation efficiency of the integrated system components trend was AD < AN < AOP < MS corresponding to 55%, 59%, 87% and 93% COD removal. As observed (Figure 1), the trend of the AD-AN system was gradual, whereas that of the AOP-Ms was faster. This might be due to the AOP system assisted with the UV-vis radiation and preceding the Ms, which increased the decontamination [16,25].
Furthermore, when monitoring the recovered Fe-TiO2 by the Ms, it was observed that at the onset of the process, there were no black precipitates on the Ms walls. However, at the end, there were black precipitates on the Ms walls, which suggests the iron (Fe2+/Fe3+) of Fe-TiO2 might have precipitated other contaminants [26,27,28]. Likewise, the decomposition of TiO2 (Fe-TiO2) might have resulted in the formation of OH• radicals, which increased photocatalytic activity [28]. Obviously, the hydroxyl ions and Fe2+/Fe3+ species might have influenced the acid/base equilibrium of the wastewater [27]. This affirms other reported studies suggesting that the oxidative occurrence and reaction mechanism with organic substrates can occur in three phases [26,27]. This includes (a) hydrogen abstraction from aliphatic carbon atoms (1), (b) electrophilic addition to double bonds or aromatic rings (2) and (c) electron transfer reactions with a constant rate close to the circulation-controlled limit (3).
2.2. The Integrated System Decontamination Efficiency
From the preliminary studies (Figure 1), the HRTs of 7, 14 and 21 days were investigated under the UV-vis illumination of the AOP system, as the OLR (0.394 kg COD/L·d), catalyst dosage (4 g) and other operating conditions were kept constant in this study. The HRT was observed to influence AD stability and biogas production and treated effluent quality before the AOP post-treatment [13,29,30]. Table 1 presents the average characterised effluent obtained over an HRT of 21 days. It is observed that the AD-AN system, preceding the AOP system as a post-treatment process, improved the wastewater treatability efficiency, as the degree of methanogenic activities are being subjected to digested organics (COD) for biogas production [9,20,31]. In this case, the high COD reduction, as observed (Table 1) in the AD-AN process, increased the biogas production to 240, 820 and 1220 mL/gCOD·d, respectively, for the HRTs of 7, 14 and 21 days. This affirms studies by Apollo et al. [13] in which a post-treated effluent by AOP increased the water quality and biogas yield of the AD process.
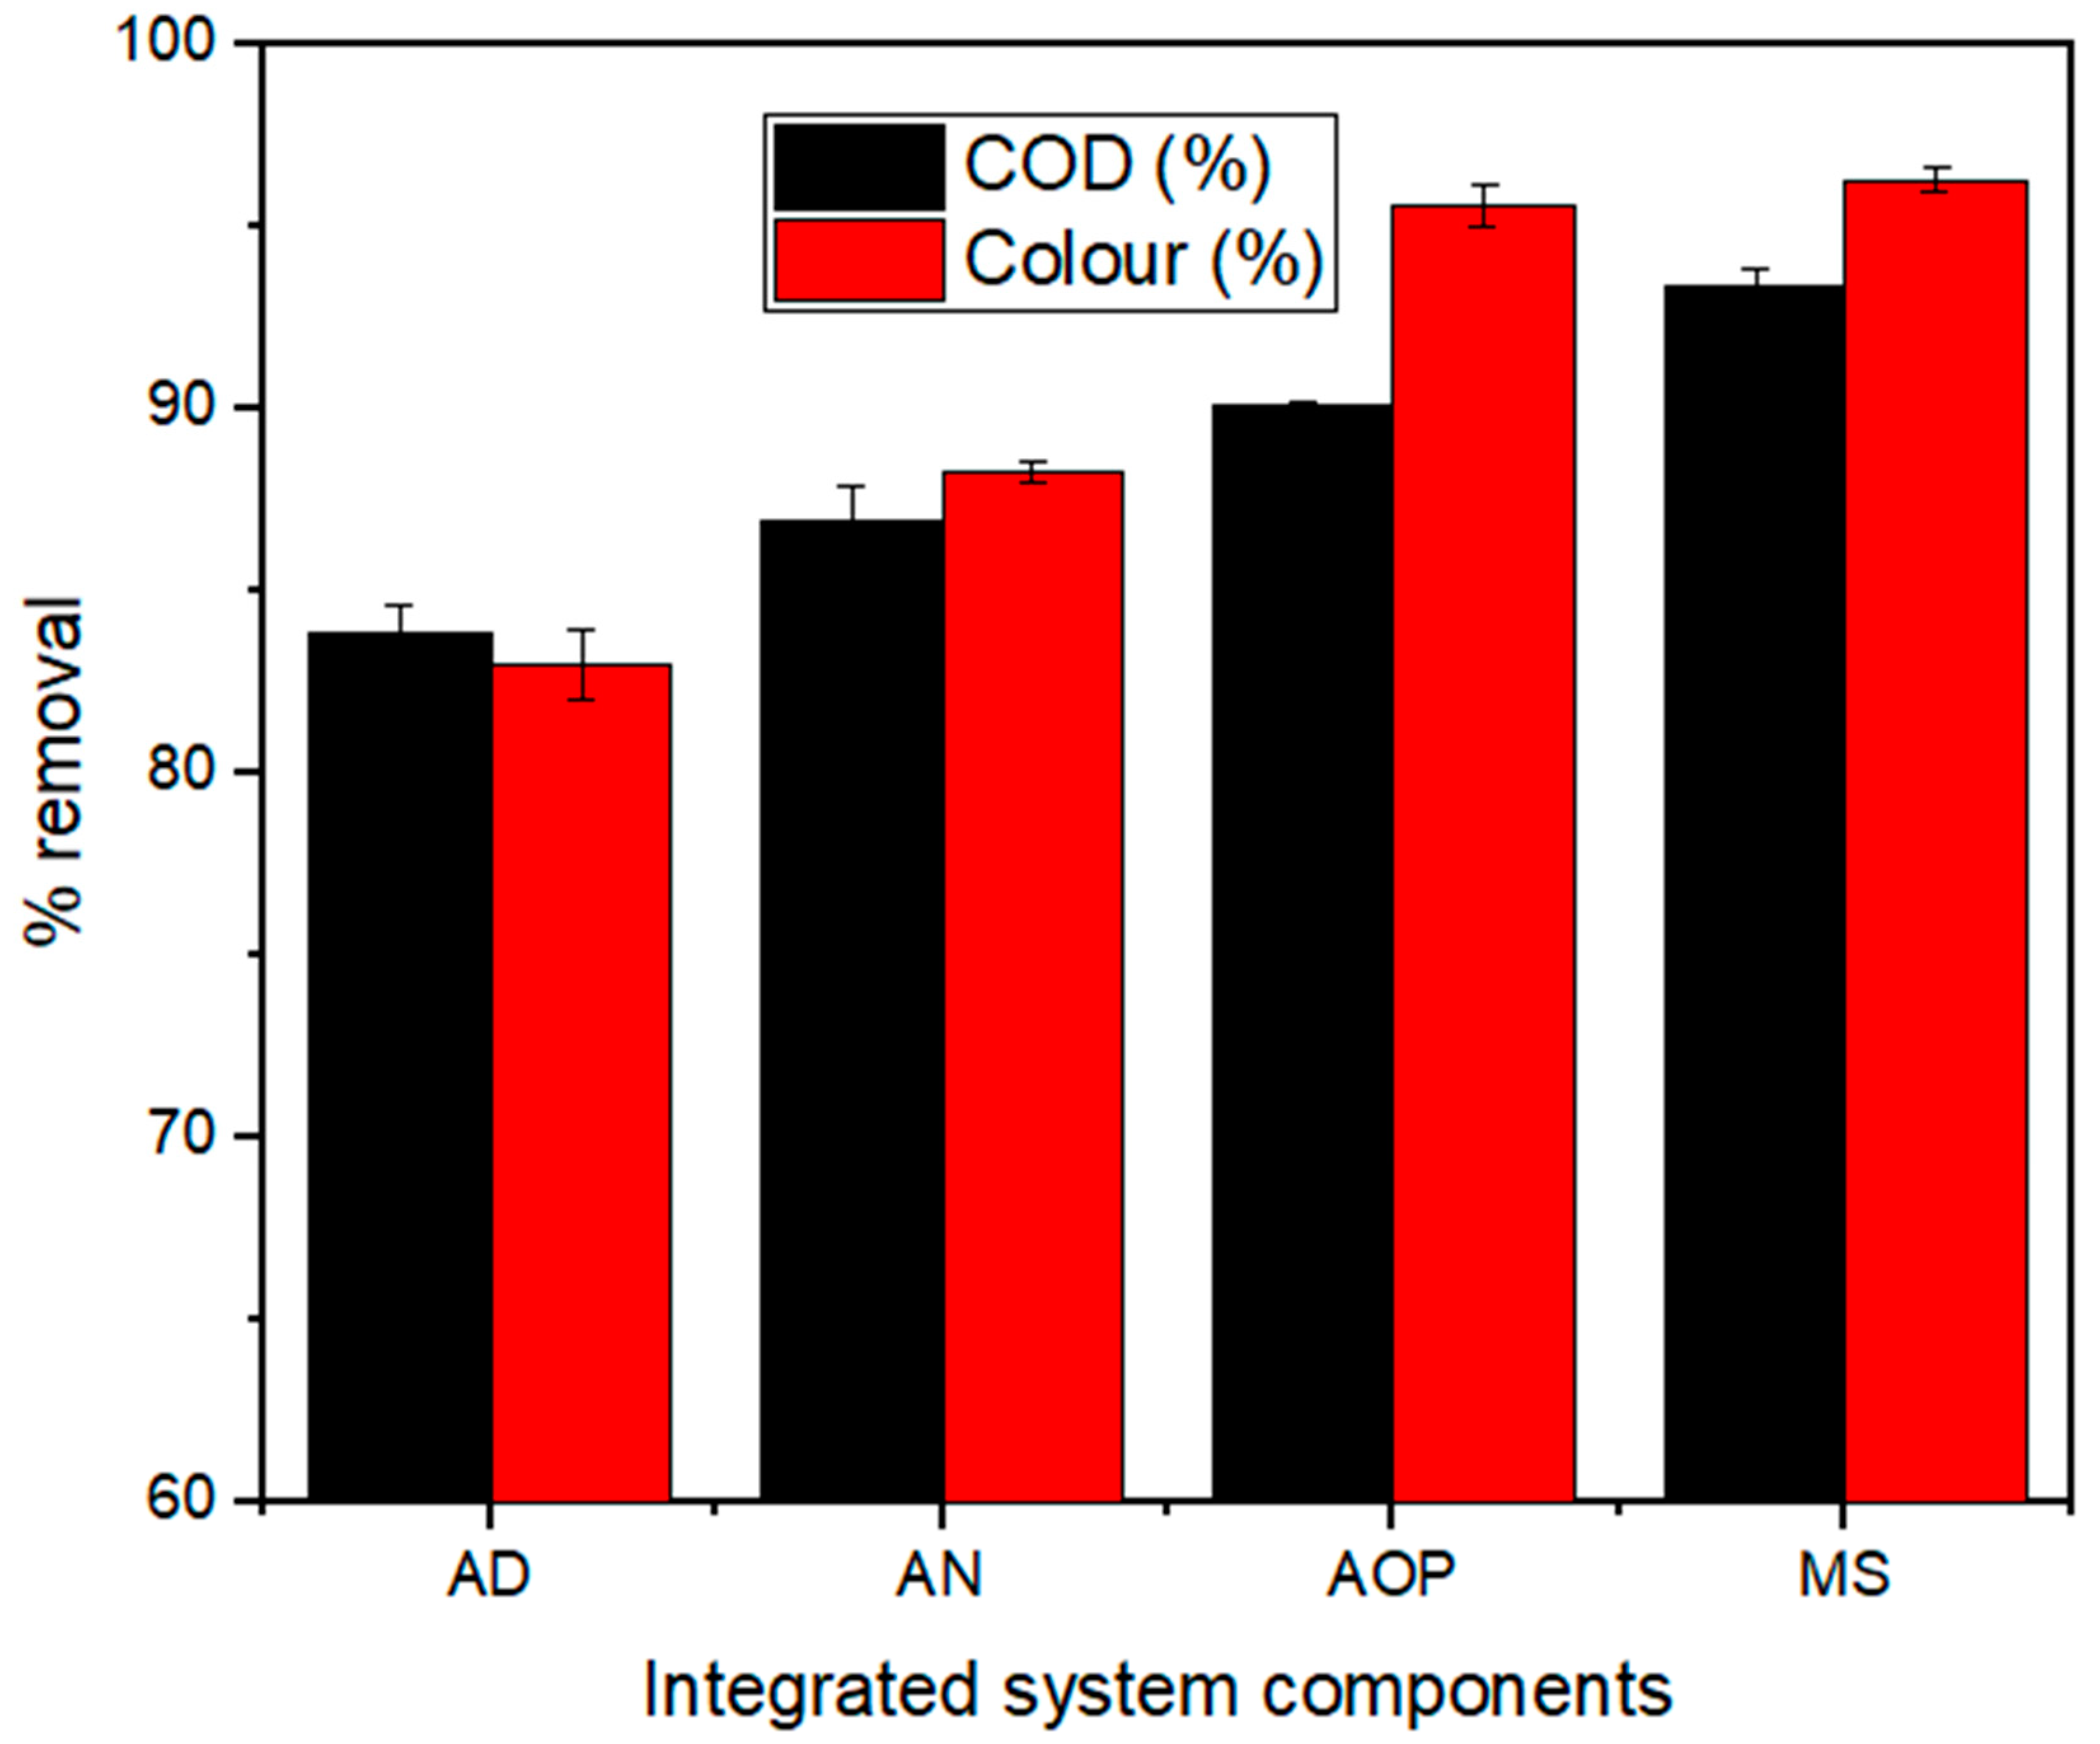
As shown in Figure 2, the COD and colour removal were within 80–95% for the integrated system (AD < AN < AOP < MS). Conversely, the degree of colour reduction in the AD-AN process was found to be not very efficient when compared to the AOP-MS system. Meanwhile, the post-treatment AOP-MS was able to increase the removal efficiency above 85–95%. Evidently, the degree of colour and COD reduction (Figure 2) by the AOP-MS suggests the overall performance of the integrated system (AD < AN < AOP < MS) was found to be feasible. This suggests that the photometric index of the effluent might be due to the degradation of the dissolved organic carbons (C-N, C=C), which might have produced NH3, TKN, NO3 and TN as they increased the colour intensity [32]. The COD reduction indeed suggests the degradation of C=C bonds, while NH3, TKN, NO3 and TN generation indicated the degradation of C-N bonds [13]. Herein, photodegradation (AOP) was found to be more effective in reducing colour than the organic content (COD). Conversely, AD was effective in reducing the organic content (COD) but not in reducing colour (Table 1). Therefore, integrating the AD-AOP system into wastewater treatment settings is highly appreciable [33].
2.3. The Integrated System Degradability Kinetics
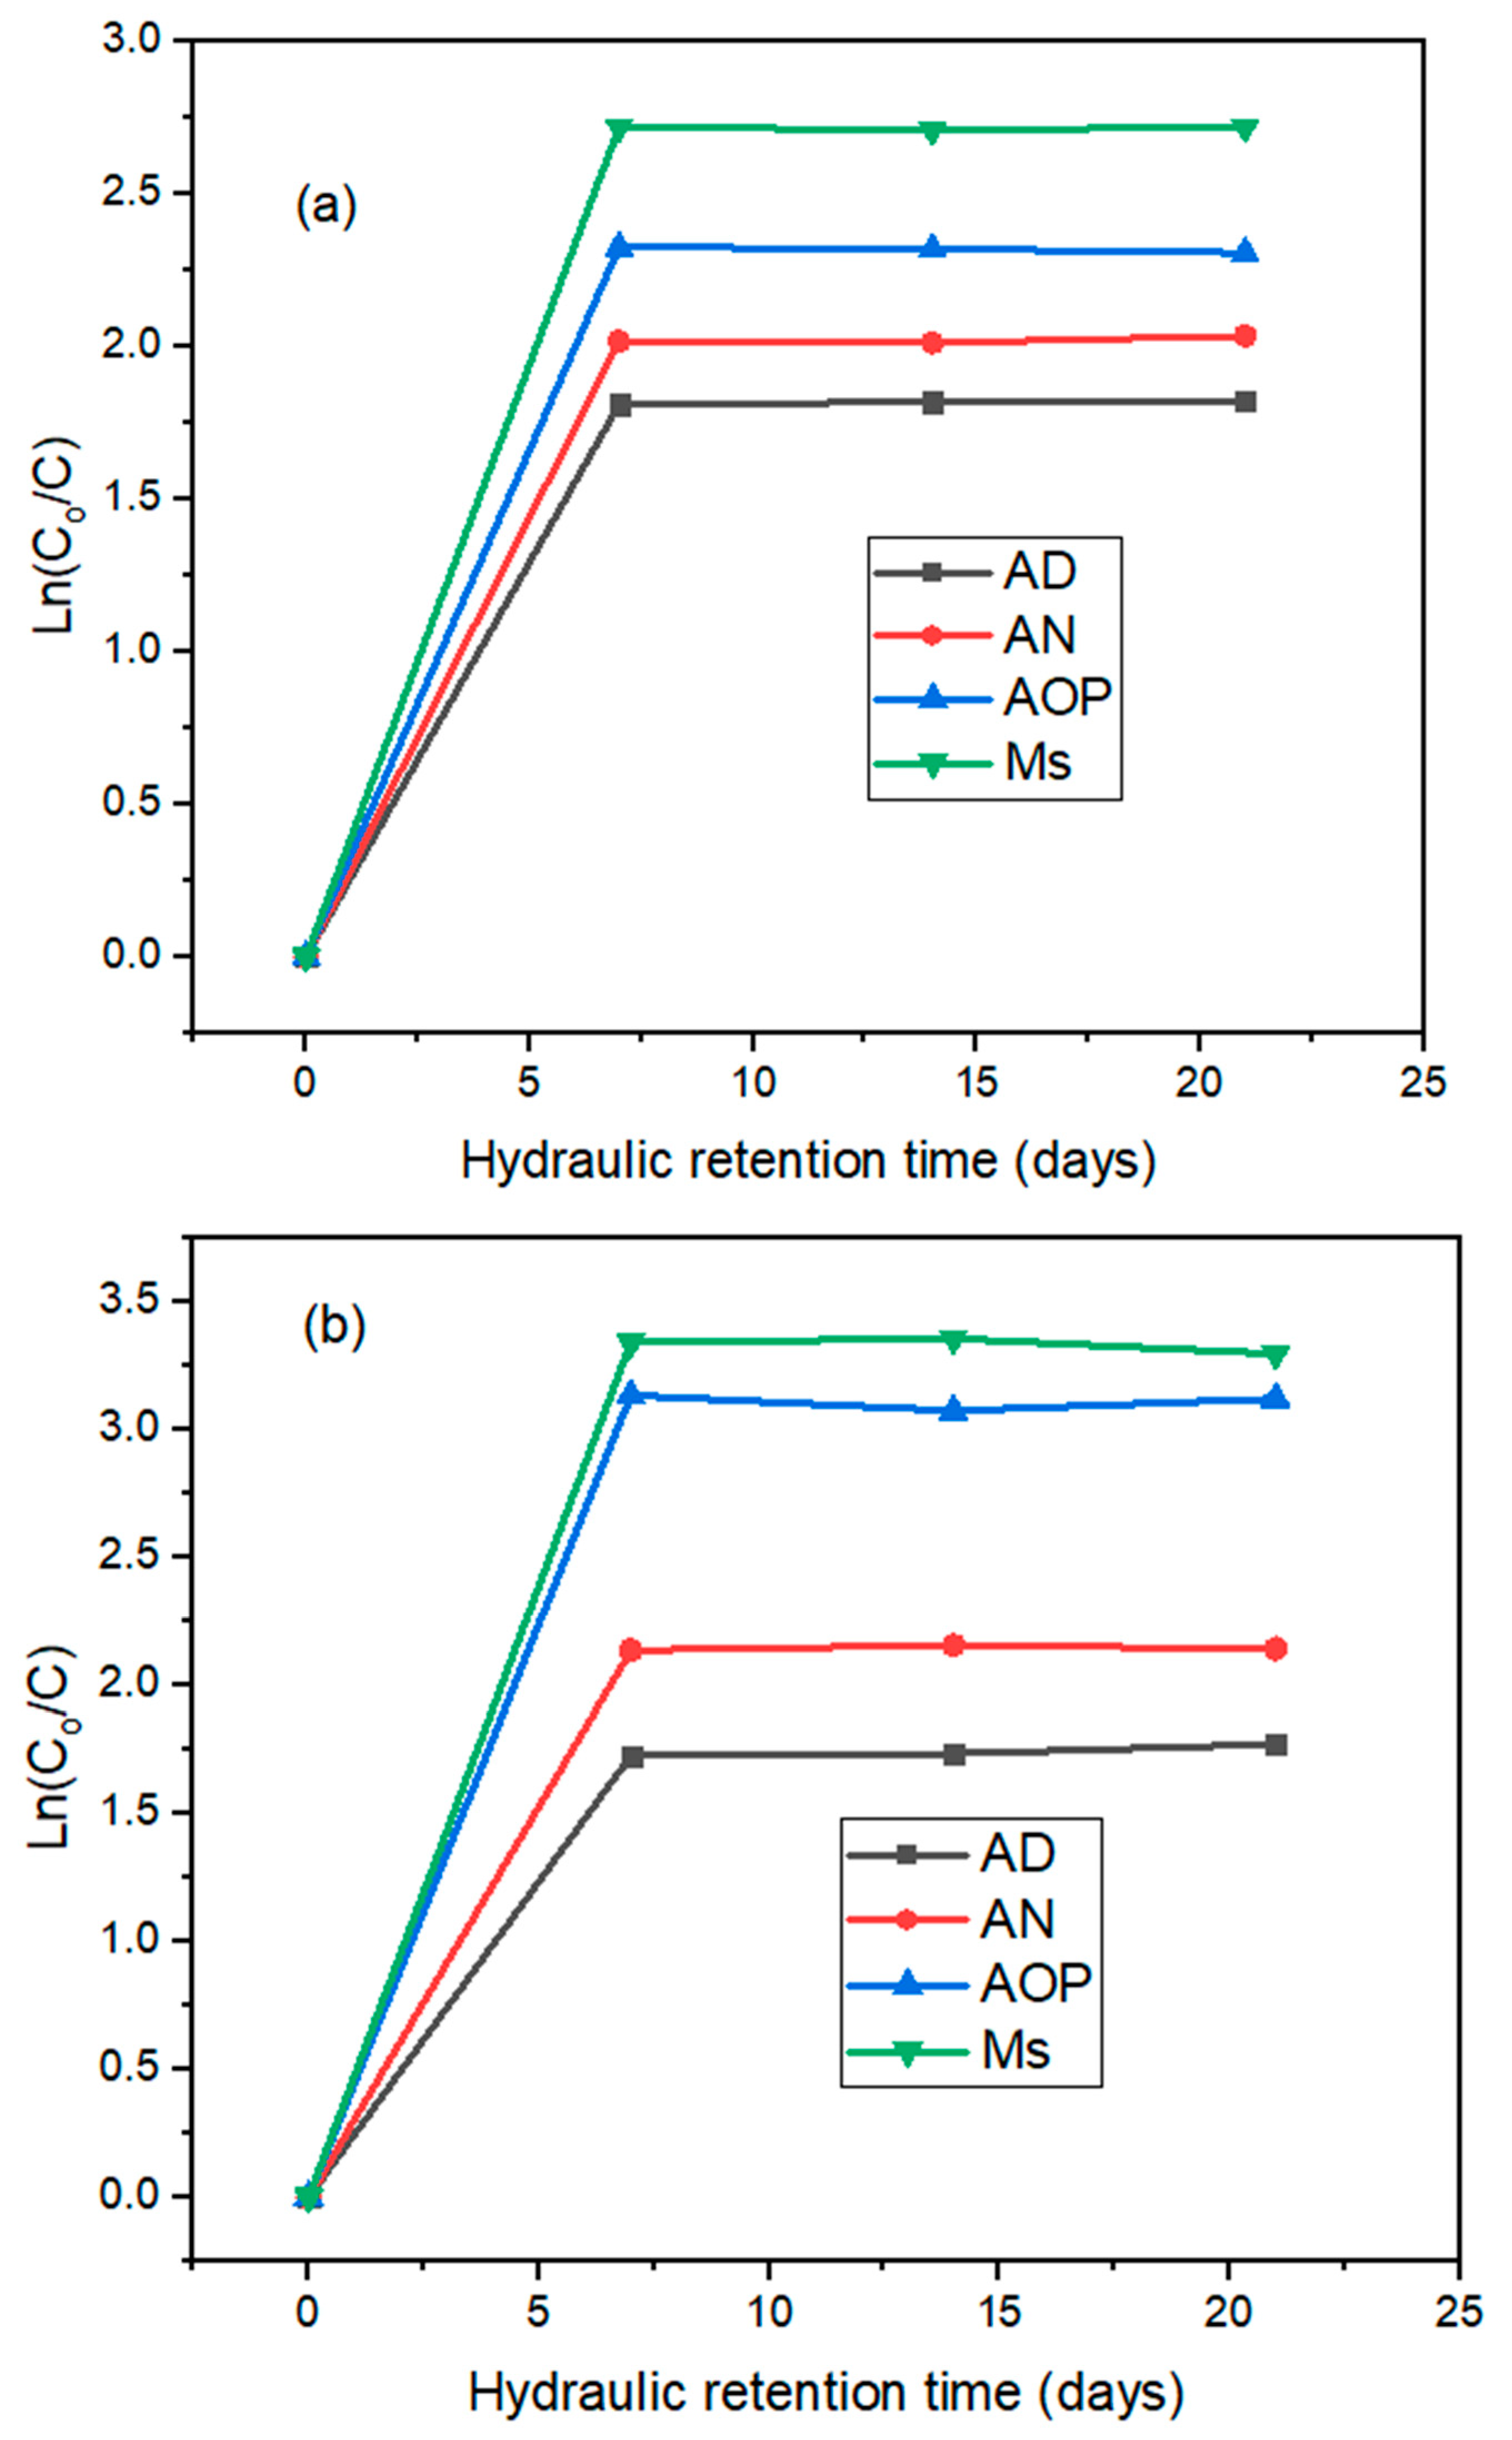
The first-order kinetic model was used to study the integrated system decolourisation (colour; Figure 3a) and degradability (COD; Figure 3b) with respect to an HRT of 21 days. Figure 3 shows the corresponding fitting results and Table 2 lists the reaction rate constants, which were obtained from each integrated system component. This infers an 85–95% removal of colour (Figure 3a) and COD (Figure 3b) for the AOP-Ms system, compared to 75–85% for the AD-AN system. Notwithstanding, prior to the stabilised degradation (Figure 3), there was rapid degradation for the first week (7 days). A good correlation was observed as the rate-limiting step was observed to be the chemical reaction between the Fe-TiO2 and wastewater. The reaction rate constant increased from the AD-Ms system, respectively, as 1.7–3.38 d−1 (colour; Figure 3a) and 1.8–2.7 d−1 (COD; Figure 3b). This explains their corresponding regression coefficients (R2) of 0.83–0.951 for colour and 0.965–0.986 for COD. The results suggest that the Fe-TiO2 under the UV-vis radiation enhanced the photocatalytic activity in the AOP system compared to the AD process [13].
2.4. Biogas Production and Energy Estimation
2.4.1. Biogas Production and Methane Composition
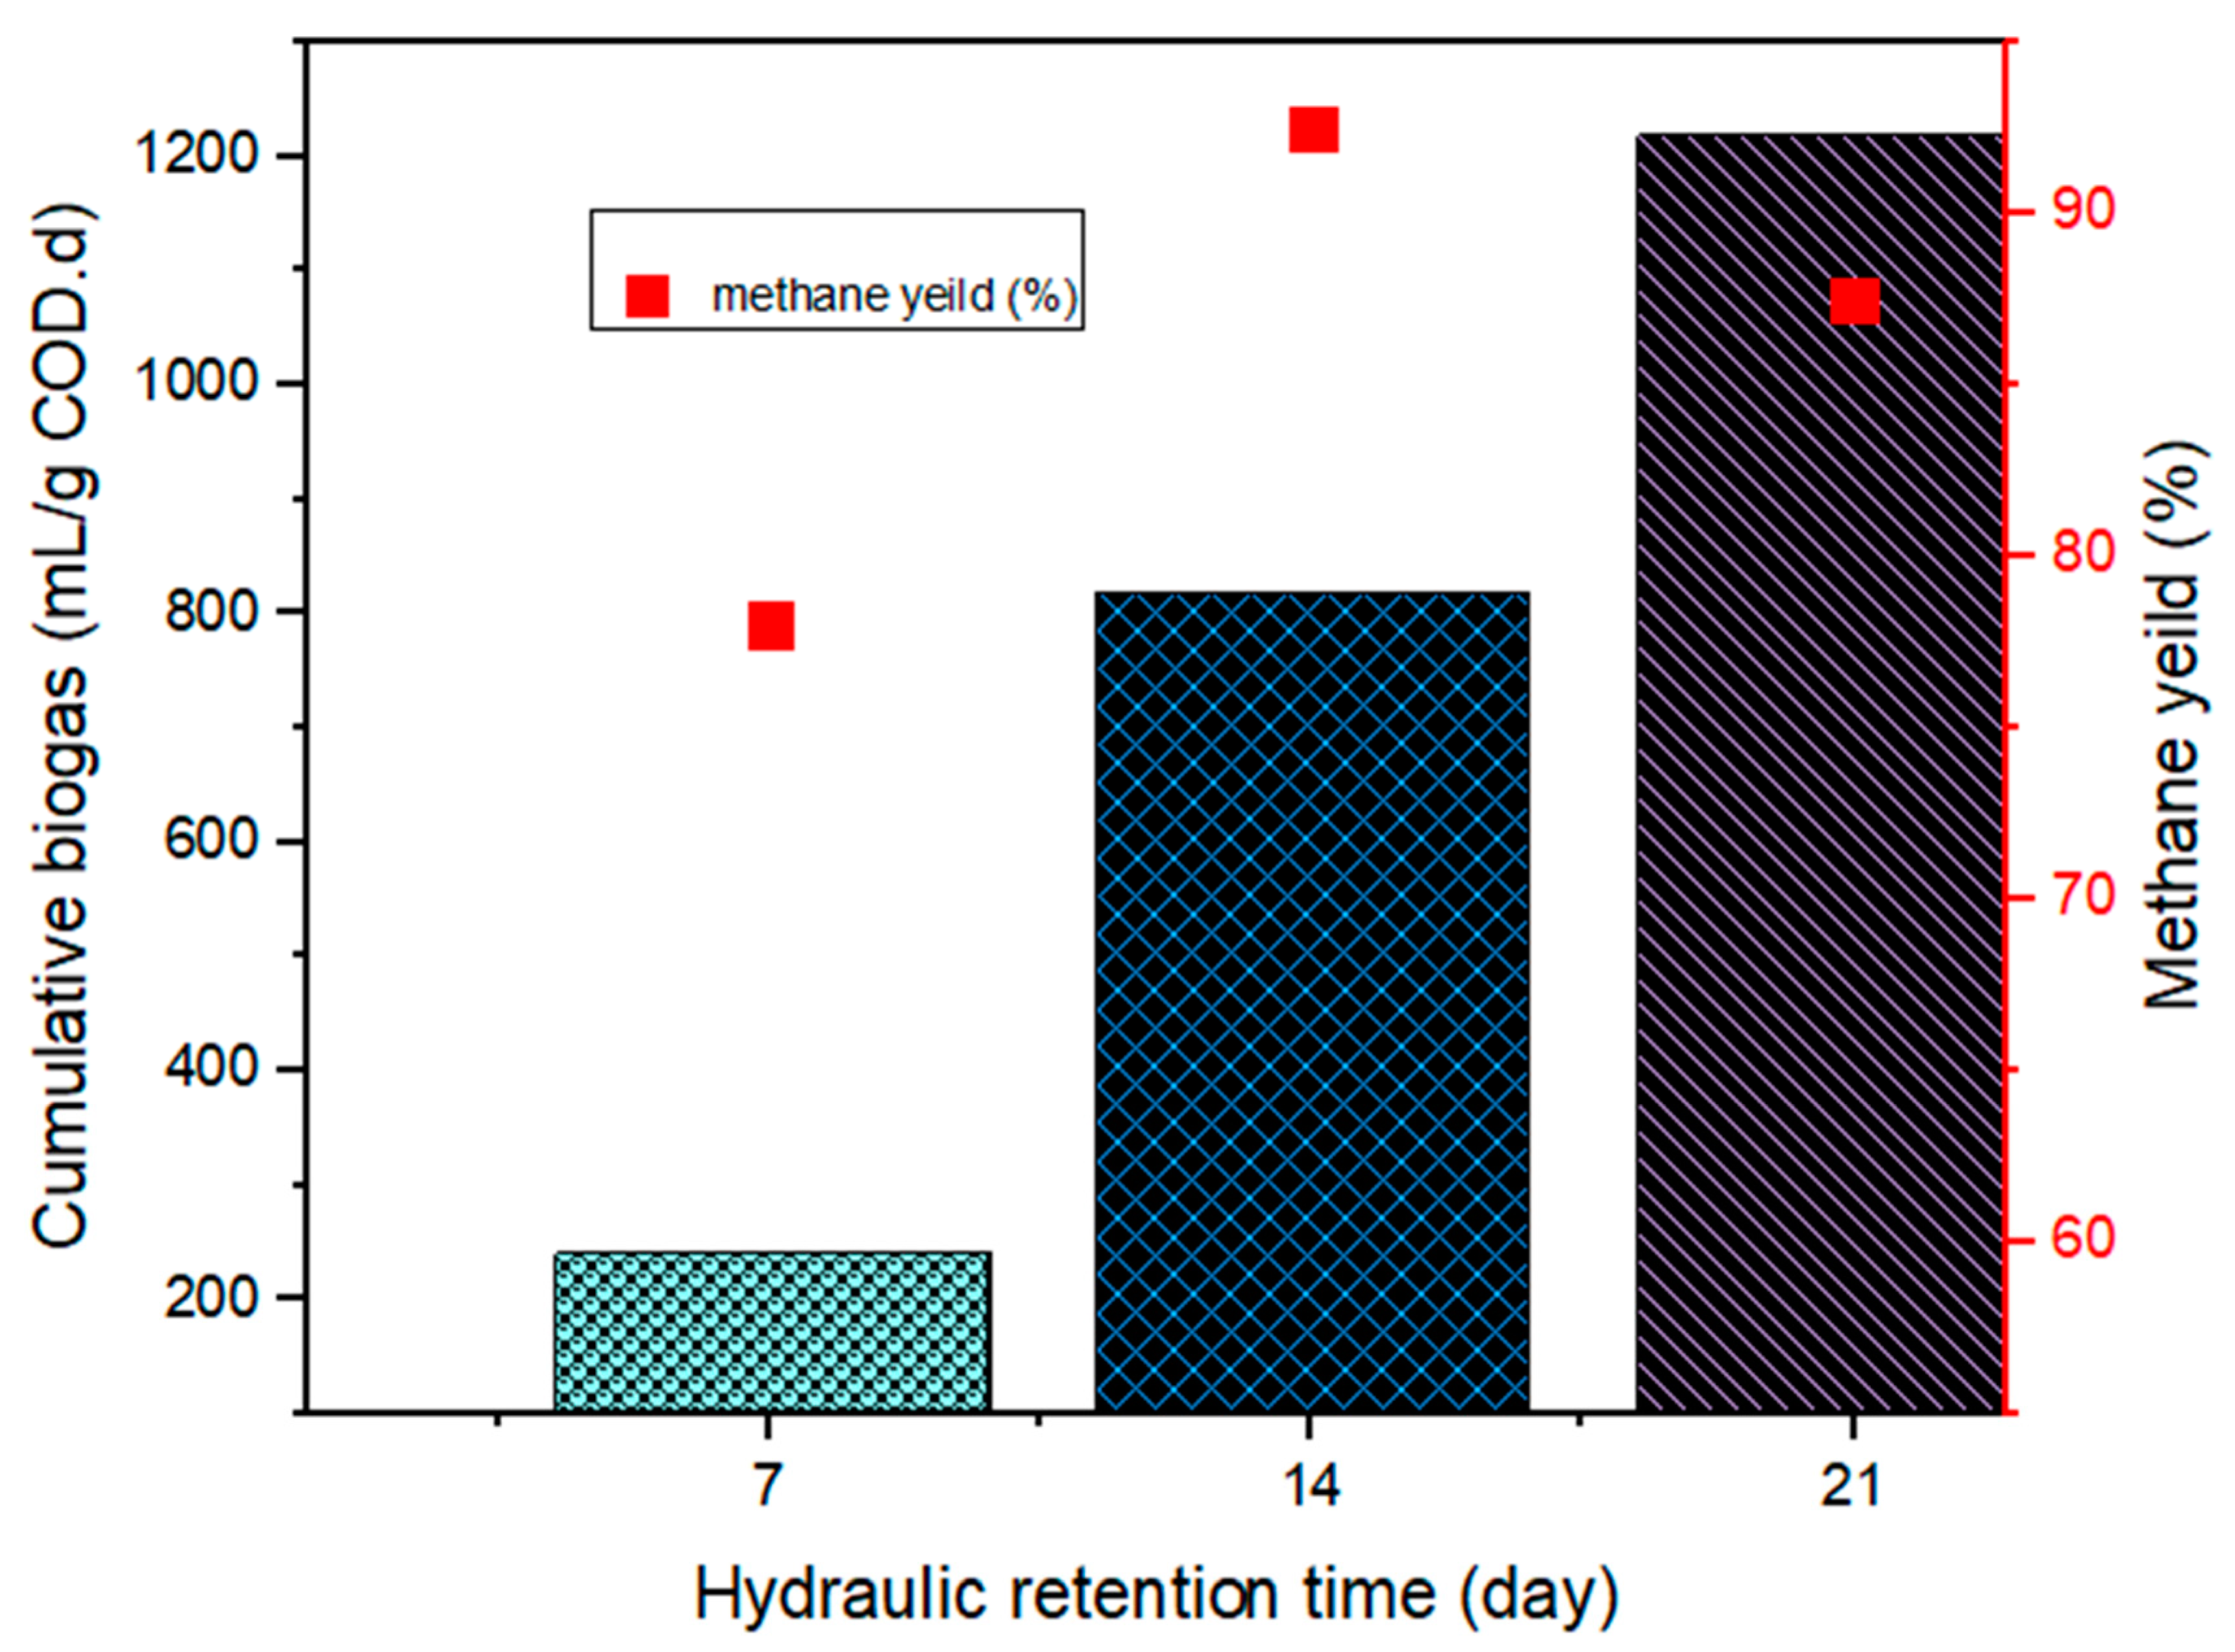
Figure 4 shows daily biogas production by the integrated system over an HRT of 21 days, as the anaerobic conversion of organic matter into biogas involves a series of mechanisms such as hydrolysis, acetogenesis, acidogenesis and methanogenesis [10,12]. Similarly, anabolic and catabolic activities occurred during the transformation of the wastewater into biogas by the integrated system [10,17]. There was a lag phase observed (Figure 4) within the first five days, after which there was a rising phase (5–17th day) where a high rise (80 mL/g COD·d) was noticed on the 16th day. In addition, the dead phase (17–21st day) noticed was associated with acetotrophic methanogen activity [9,18]. This instability can also be associated with a reduction in pH produced by the volatile fatty acids with other intermediates that dissociated during oxidative reactions [27]. Furthermore, methane, which is one of the key components of biogas, involves the conversion of acetate or the reduction of carbon dioxide (CO2) via hydrogeneration by either acetotrophic (4) or hydrogenotrophic (5) microorganisms [34]. Therefore, introducing the Fe-TiO2 in this study dissociated into reactive species (6–7), which enhanced the methanogens to increase the methane content. This explains Figure 5, showing that 78%, 93% and 88% of the cumulative biogas of 240, 820 and 1220 mL/gCOD·d were converted into methane, respectively, for the HRTs of 7, 14 and 21 days.
Fe2+ + H2O2 → Fe3+ + OH− + OH•
TiO2 → hv h+ + e−
2.4.2. Comparative Kinetic Study
The cumulative biogas obtained was fitted and compared using first-order (11) and modified Gompertz (12) kinetics models. Figure 6 depicts the cumulative biogas data (sum of daily production) plotted against an HRT of 21 days with their listed kinetic parameters in Table 3. It was found that the modified Gompertz with a high regression coefficient (>0.99) fitted very well with the data obtained. A kinetic rate of 0.17 d−1 for the degradability of wastewater was estimated. In addition, the integrated system maximised the degradability efficiency of 92% COD removal inferring 1220 mL/gCOD·d biogas production. The modified Gompertz lag phase of 11 days suggests that the microbial community was very adaptive to the environmental condition for biogas production [10,13,20]. Thus, the Fe-TiO2 in the AD process boosted the AD mechanism by consuming the initial hydrolysed monomers and subsequent volatile fatty acids by acidogenic and methanogenic bacteria [27].
2.5. Estimation of Energy and CO2 Emission Reduction
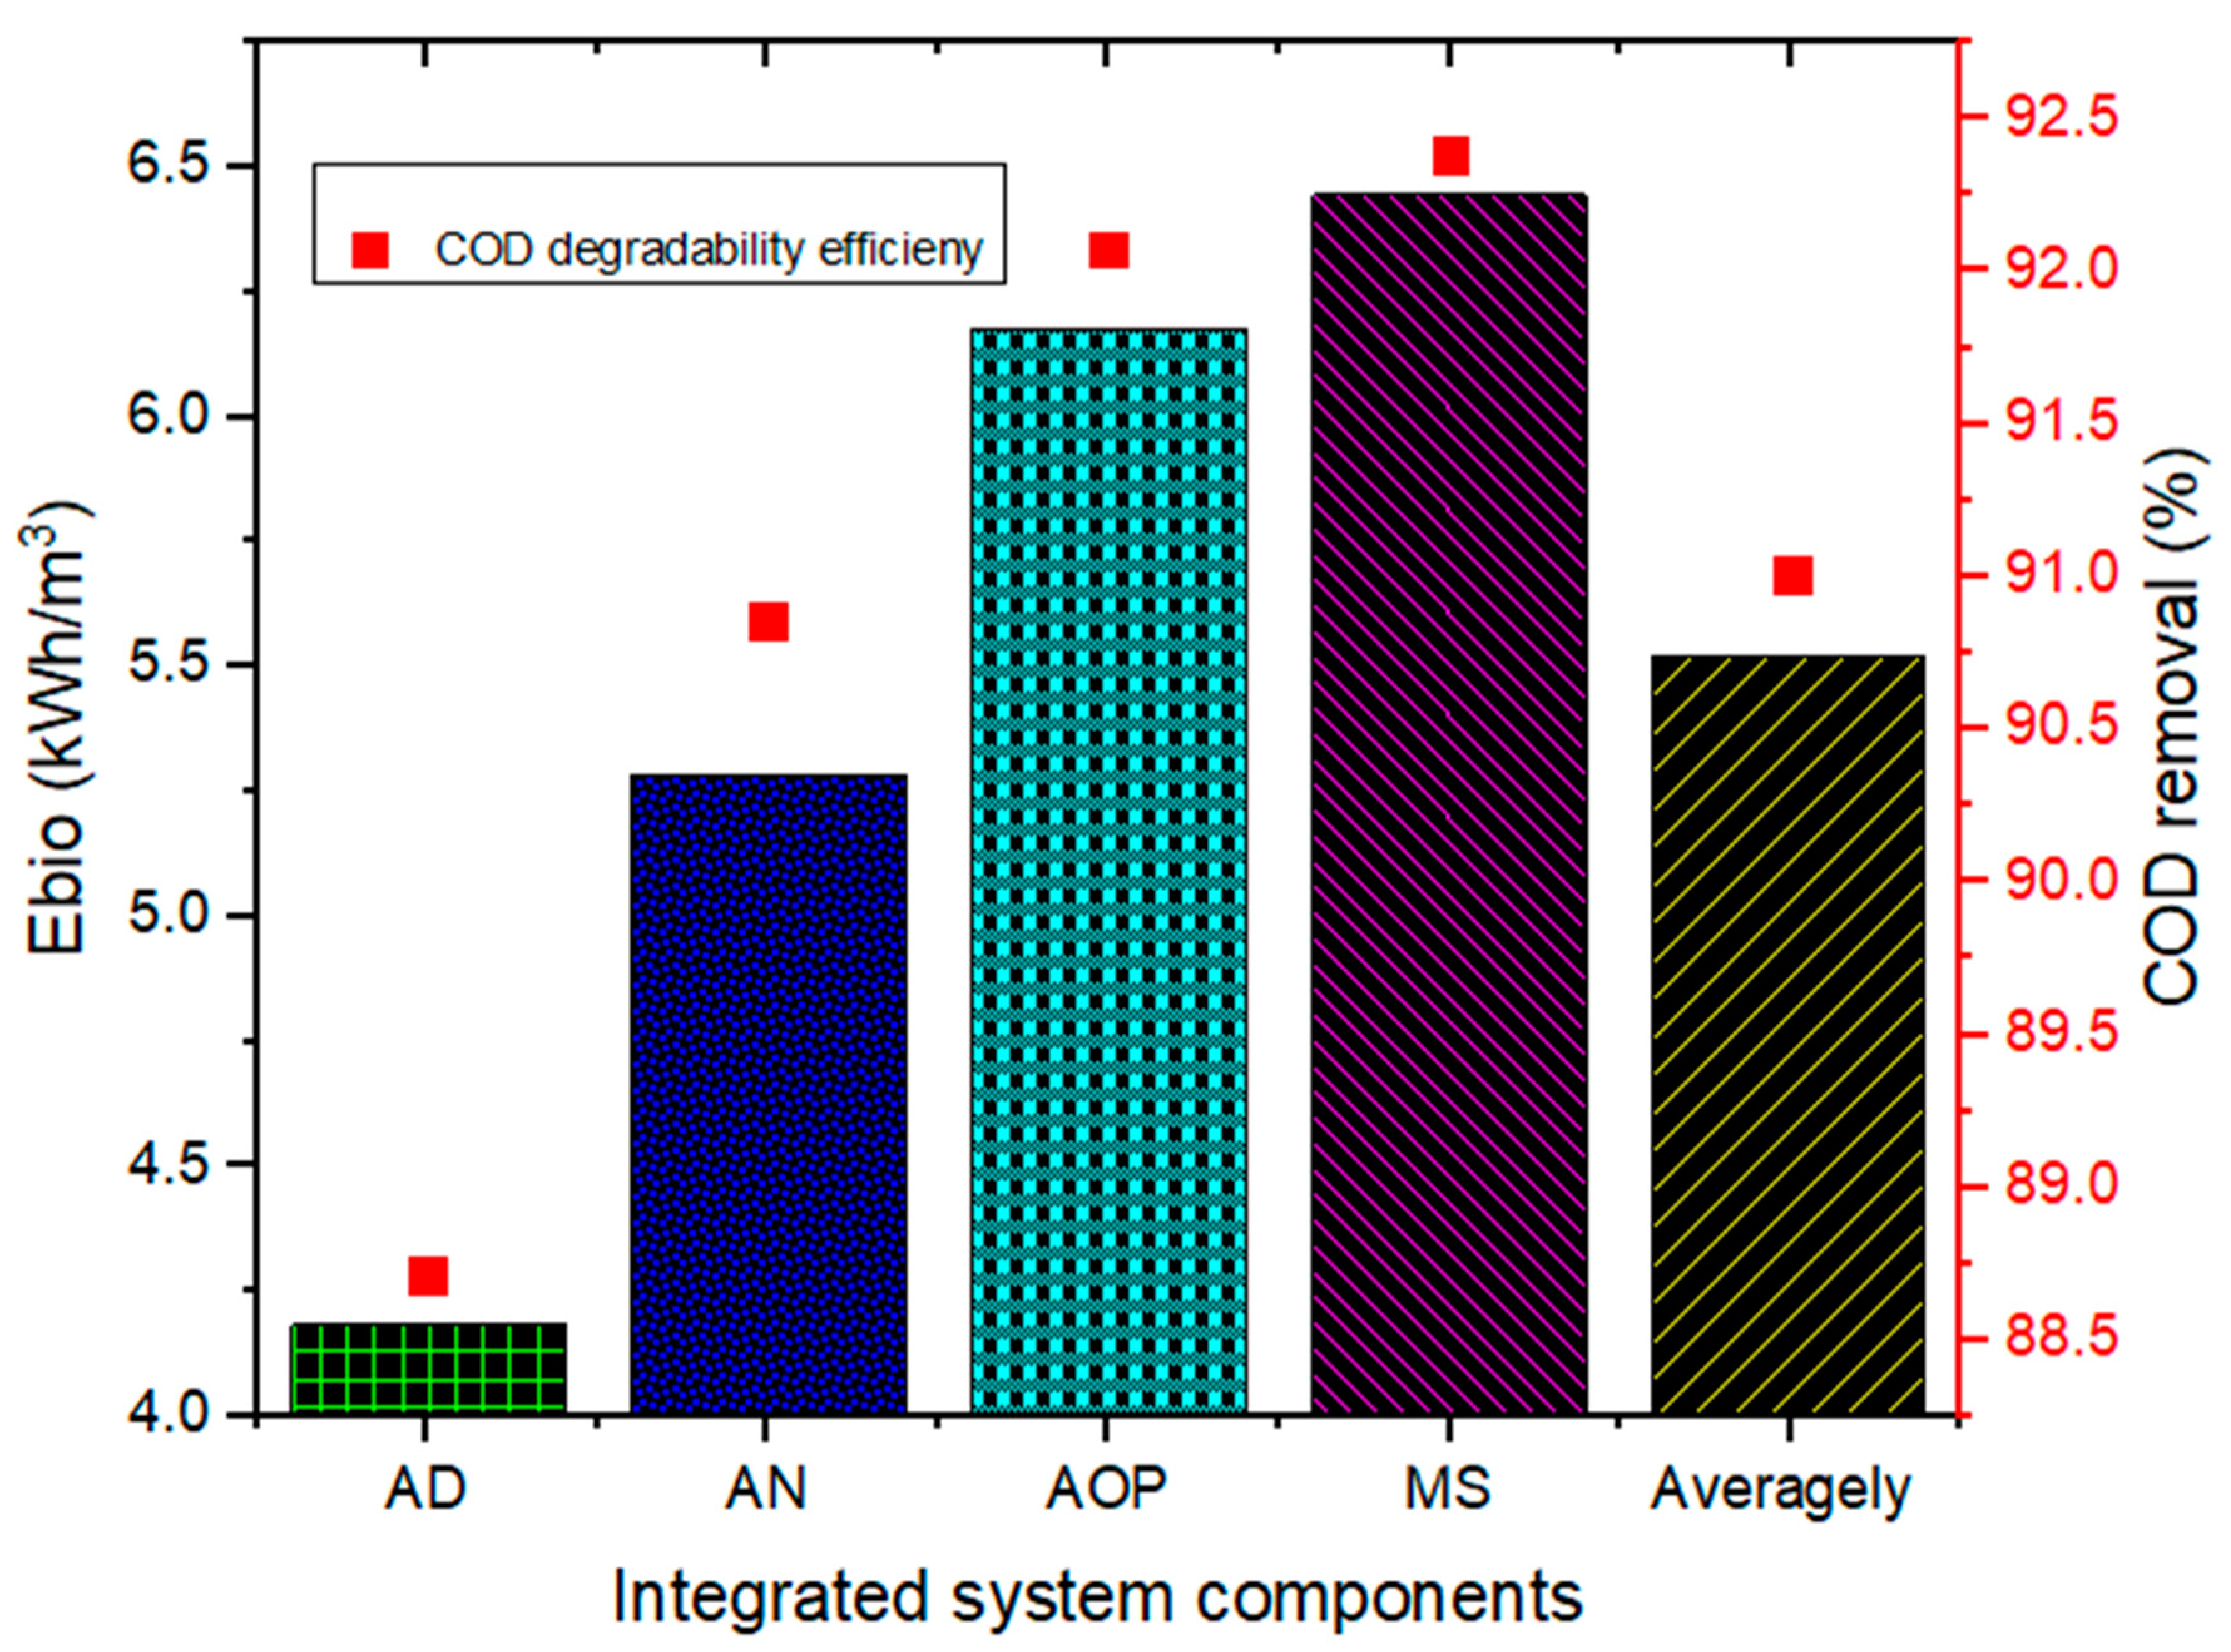
2.5.1. Bioenergy (Ebio) Produced
The efficiency of COD conversion to bioenergy produced (13) at an HRT of 21 days is presented in Figure 7. This was noted with an average of 91% COD degradation and 5.52 kWh/m3 bioenergy. The system efficiency increased along the component units as AD < AN < AOP < Ms. This infers 88% COD (4.18 kWh/m3), 91% COD (5.28 kWh/m3), 92% COD (6.18 kWh/m3) and 94% COD (6.44 kWh/m3) for AD, AN, AOP and Ms, respectively. However, the AD process, being operated at 21 days HRT, might have reduced the acidogenesis efficiency with the organic load (0.394 kg COD/L·d), which resulted in the low bioenergy (Figure 7) and biogas produced (Figure 4). In the case of the highest bioenergy recorded by the AOP-MS components as compared to the AD-AN systems, suggests the higher the degradability, the more energy the system can produce [10,13].
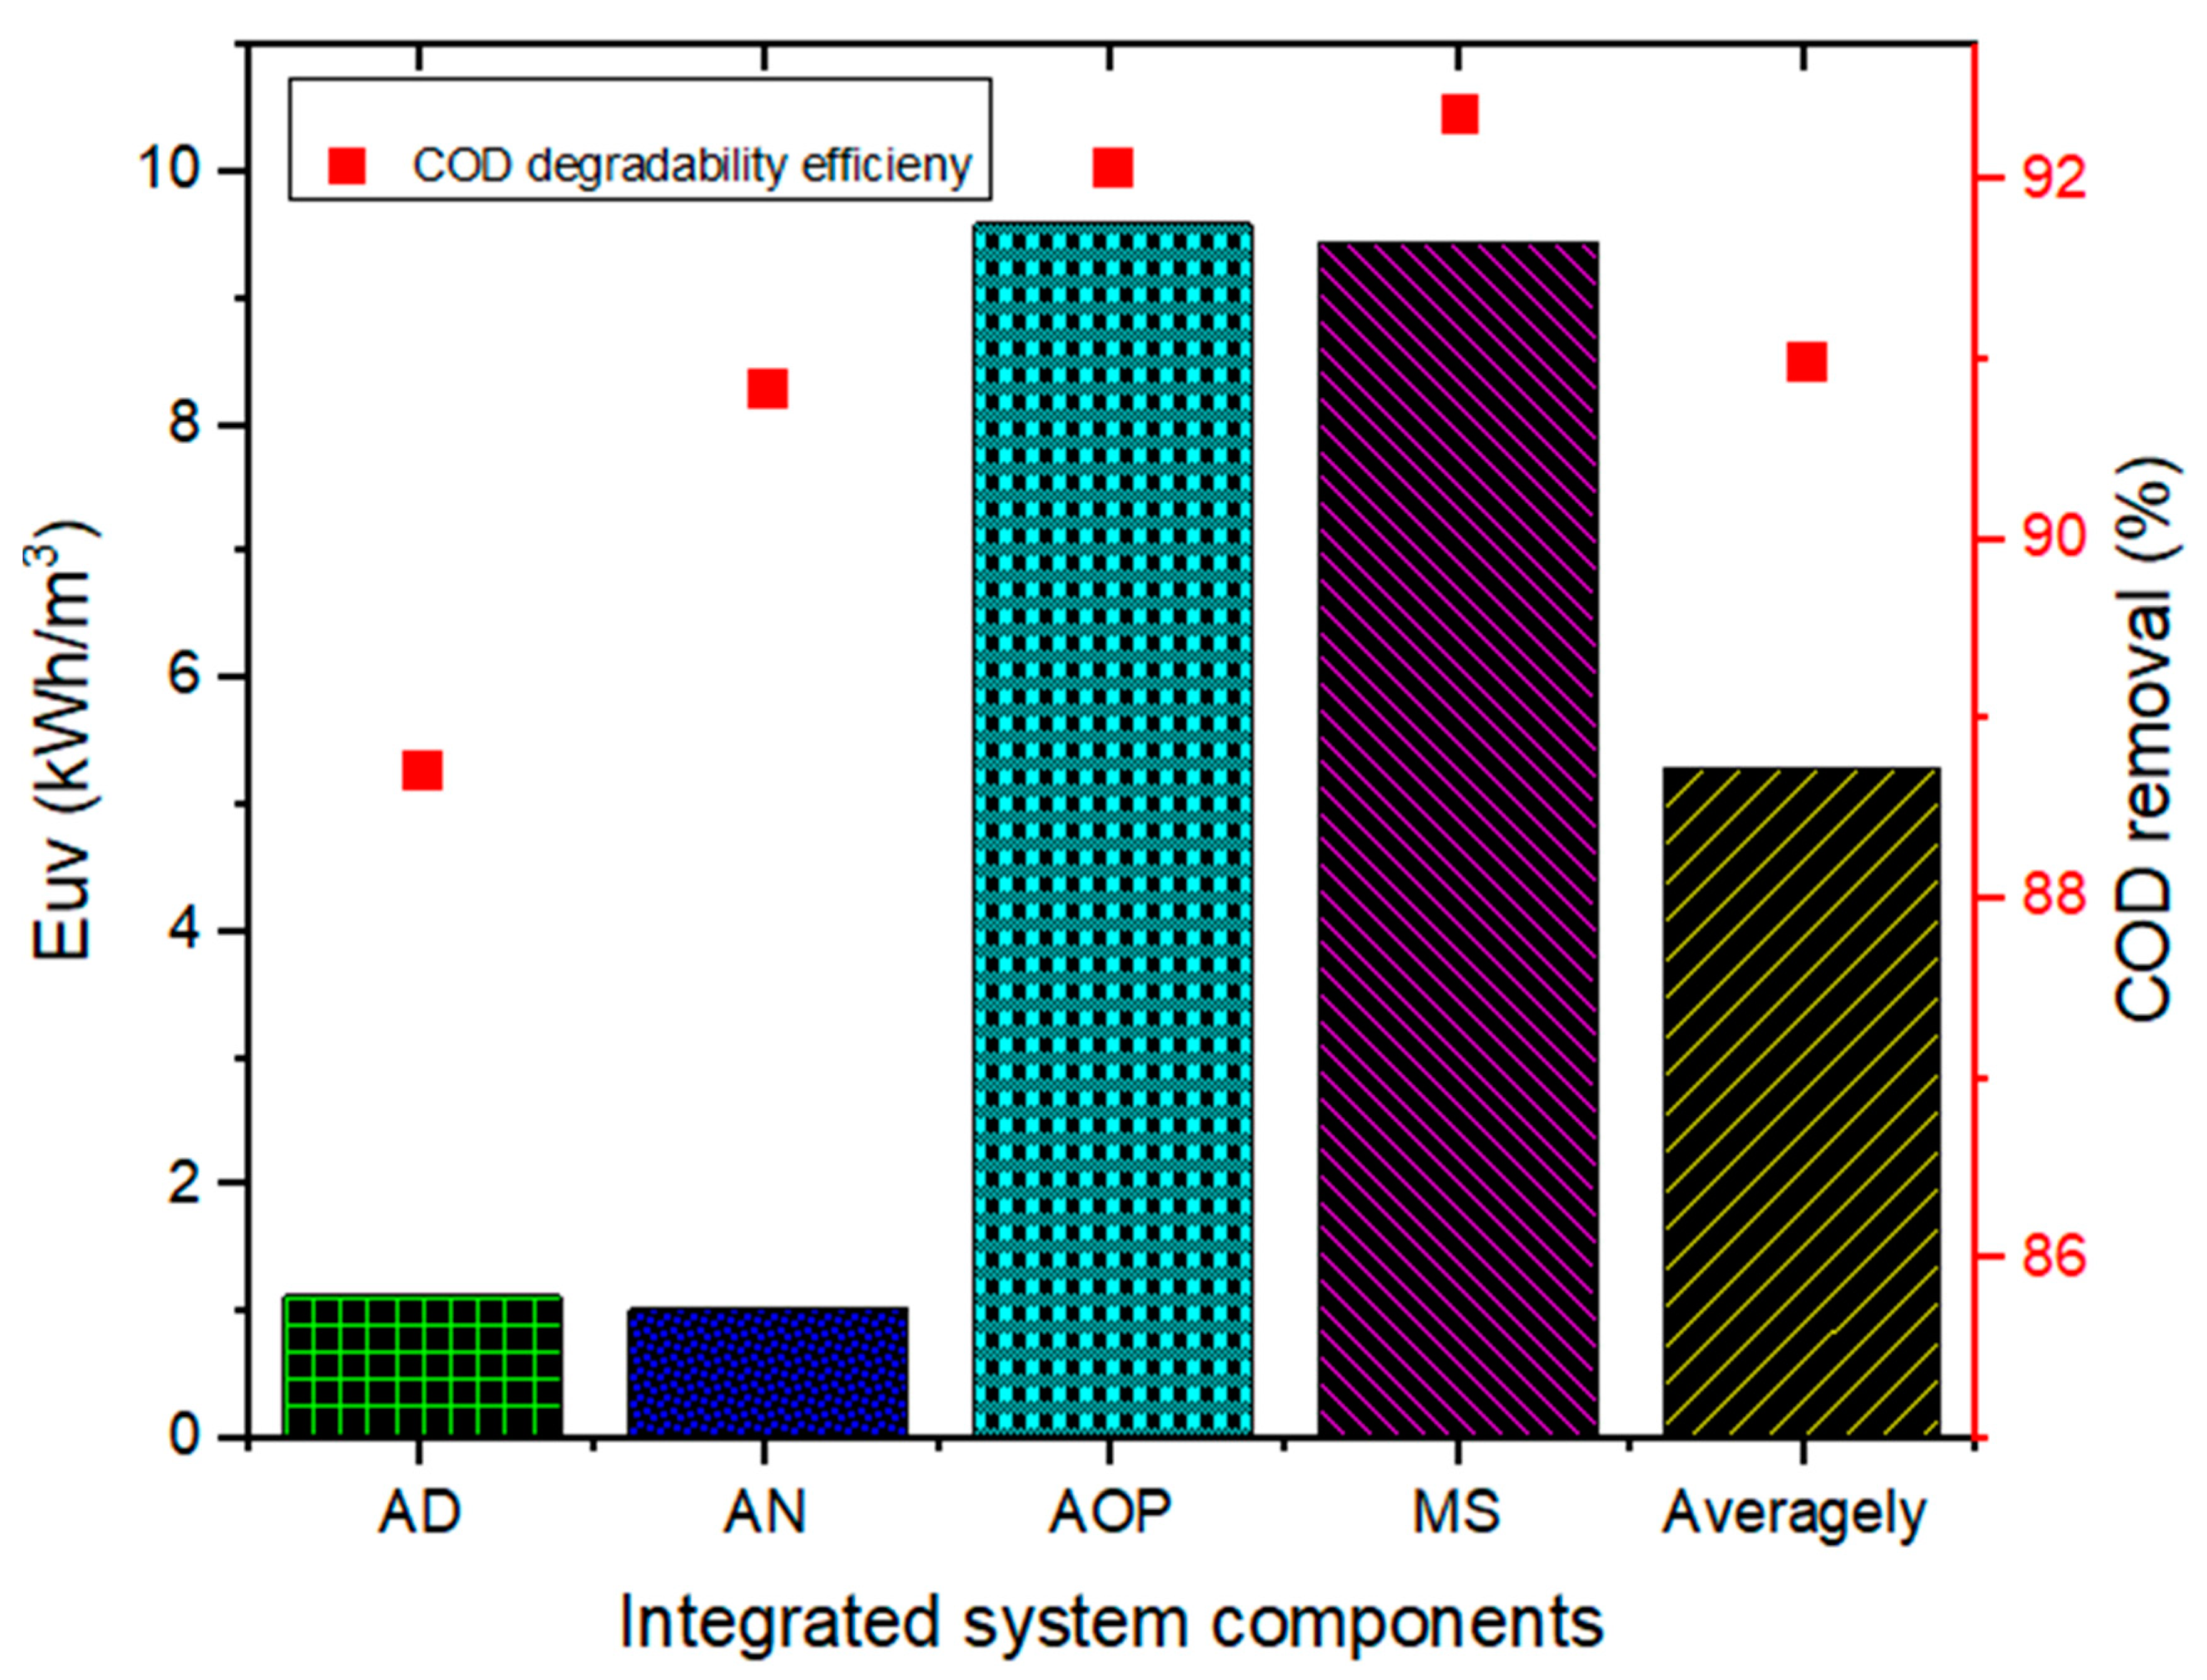
2.5.2. Energy Utilised (Euv)
Figure 8 shows the energy utilised (UV-vis or pump) by each component unit of the system for the degradation of COD. As observed, the average energy utilised (14) by the system was estimated as 5.302 kWh/m3 referring to 91% COD with a net energy gain of 0.218 kWh/m3. However, the AOP system had a significant effect on the energy utilised, estimated as 92% COD (9.614 kWh/m3), due to the UV-vis light, resulting in a net energy loss of 3.23 kWh/m3. Likewise, the Ms utilising 94% COD (9.47 kWh/m3) of the energy, denoted a loss of 3.44 kWh/m3. In addition, the biodegradability efficiency of the AD-AN, representing 88% COD (1.11 kWh/m3) and 91% COD (1.02 kWh/m3), resulted in net energy of 3.06 kWh/m3 and 4.26 kWh/m3, respectively. This elucidates that more energy was required by the post-treatment process (AOP-Ms) compared to the AD-AN system. This confirms other studies that show that the degradation of high-strength organic content (COD) corresponds to an increase in biogas production [13,33].
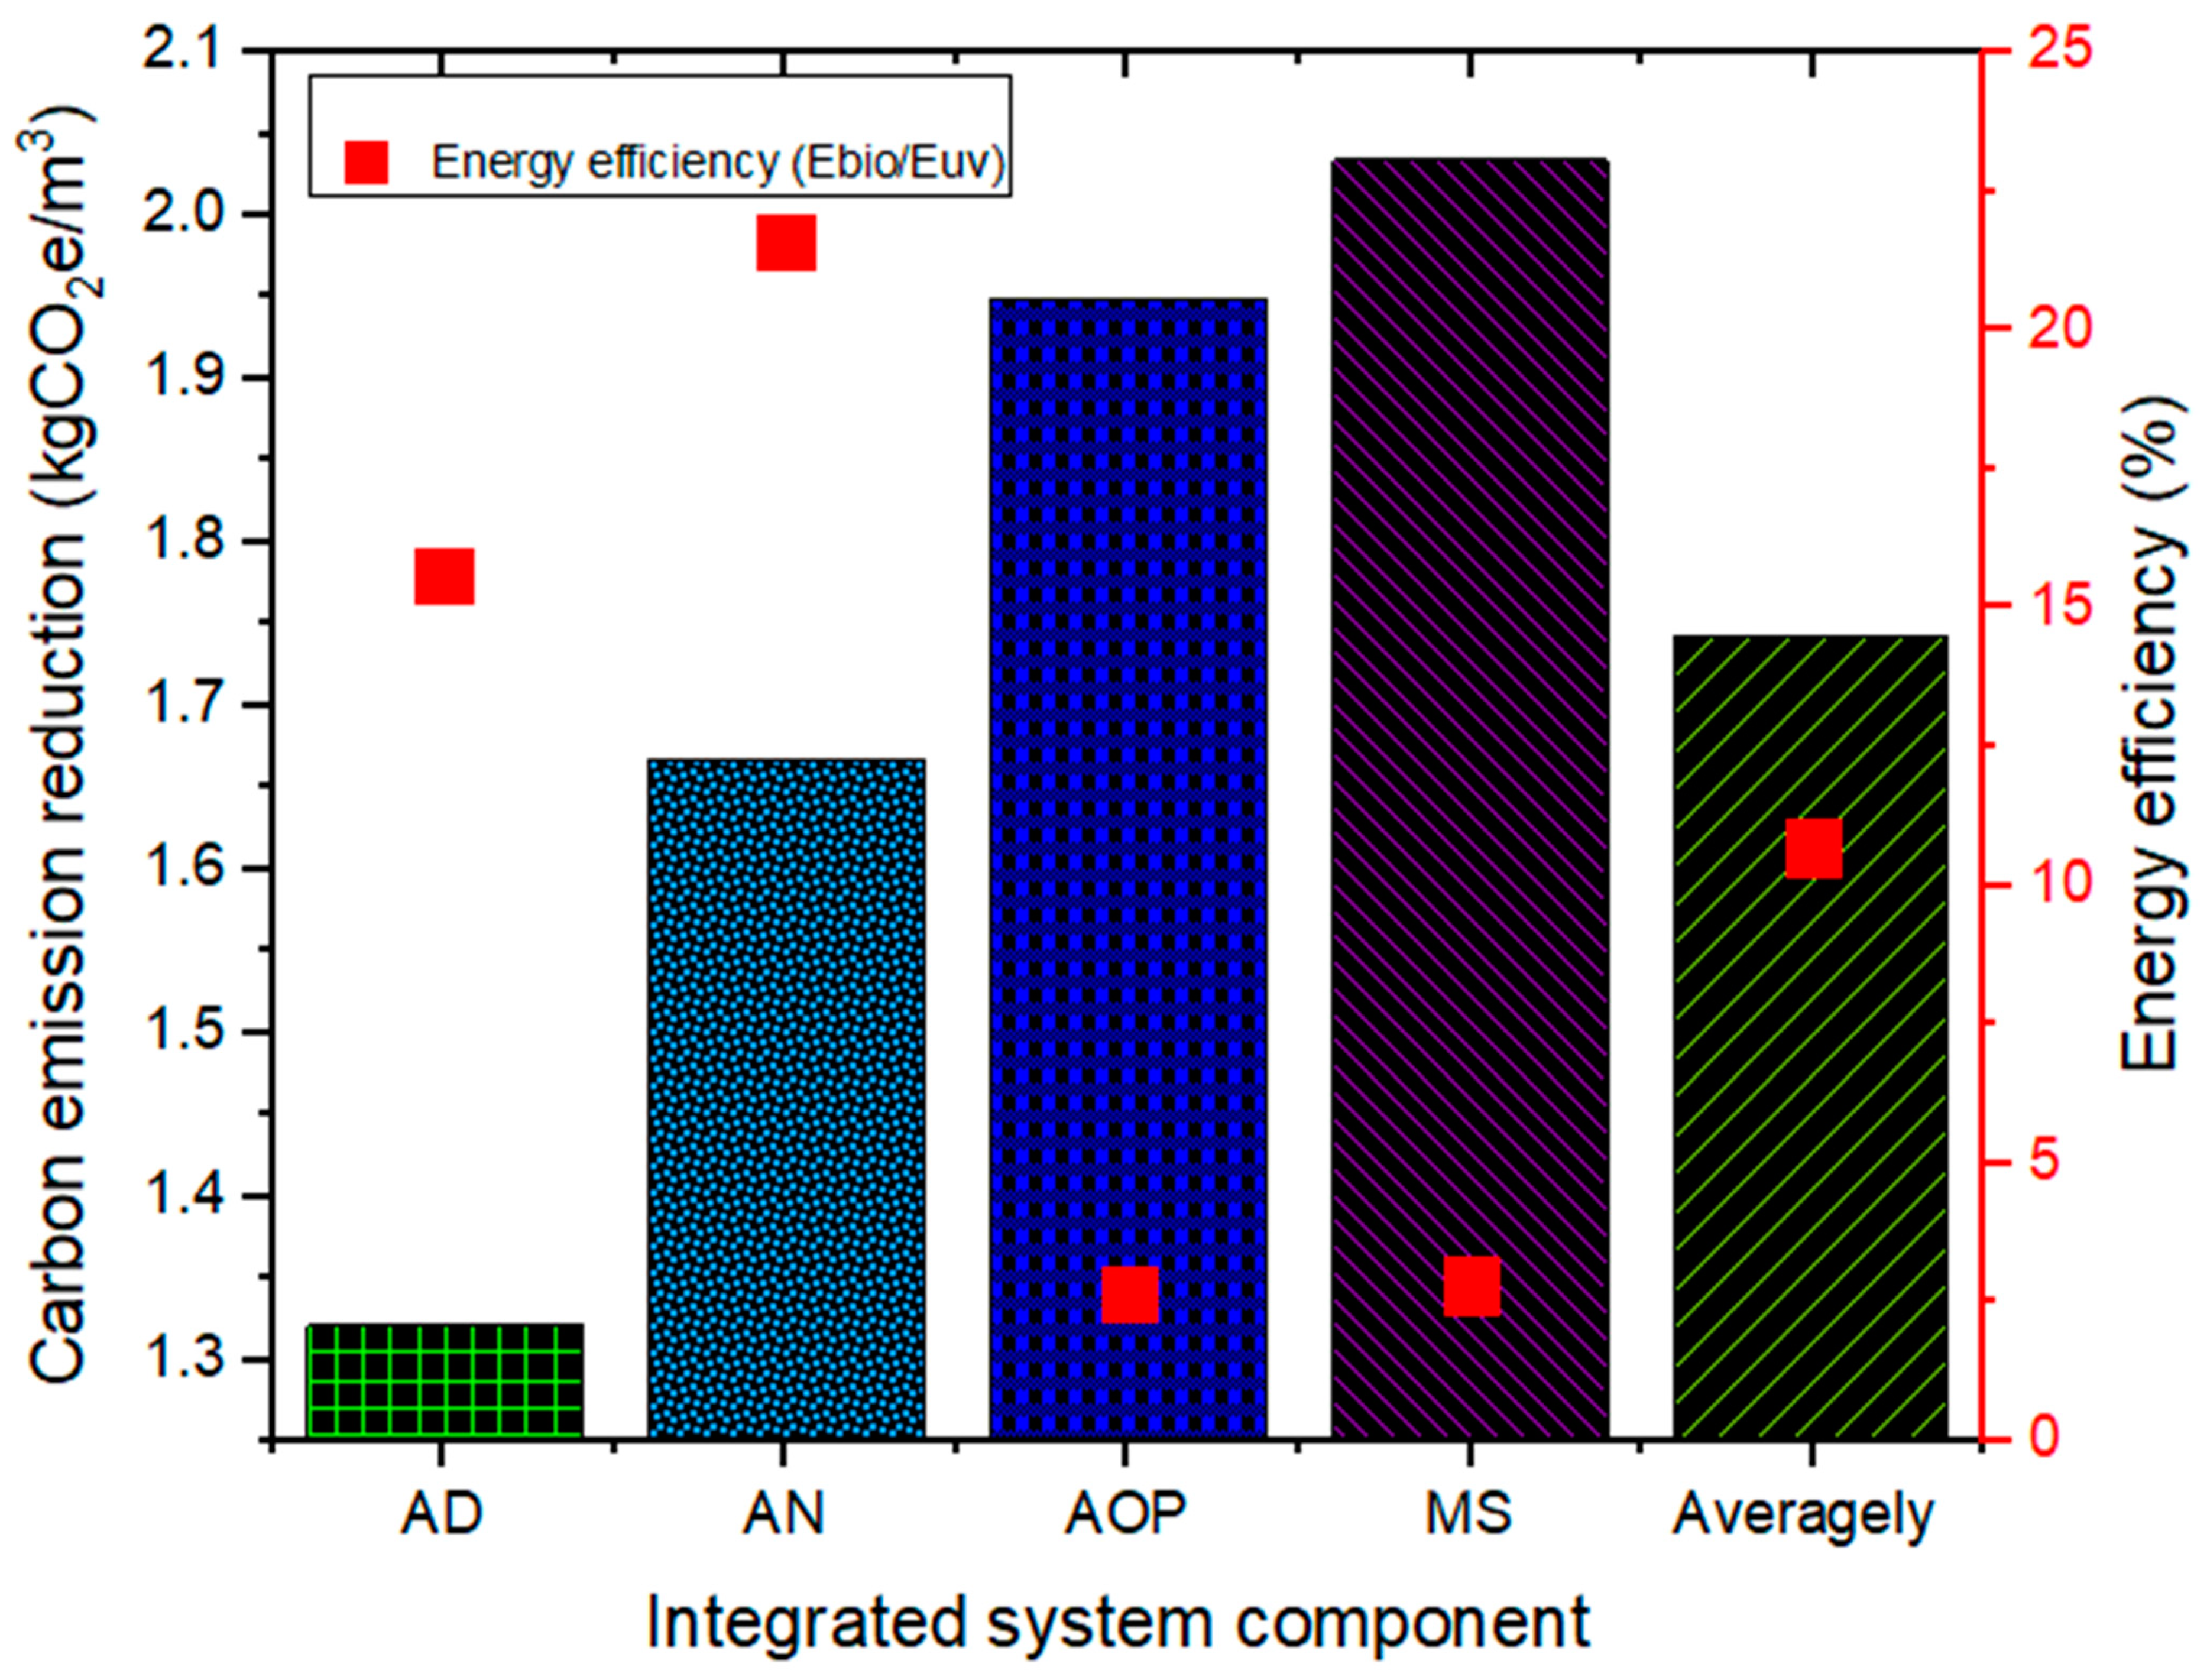
2.5.3. Energy Efficiency and Carbon Emission Reduction (CER)
The integrated process’ energy efficiency and CER (18) were examined using the bioenergy of individual component units. The CER was estimated using a bioenergy conversion efficiency of 45% heat and 33% power, with a base emission conversion ratio of 0.957 kg CO2/kWh produced [13]. Figure 9 illustrates the CER attained compared to the energy efficiency (15) by each integrated system component unit. With an average energy efficiency of 10.68%, the CER obtained was 1.74 kg CO2 e/m3. This infers an energy efficiency of 15.6% (1.3274 kg CO2 e/m3), 21.6% (1.67 kg CO2 e/m3), 2.68% (1.95 kg CO2 e/m3) and 2.84% (2.04 kg CO2 e/m3), respectively, for the AD-AN-AOP-Ms system. Generally, the energy produced by the AD process was equivalent or lower to the energy required by the UV-photodegradation (Figure 8). Notwithstanding, the bioenergy could be used to subvent the energy required by the UV lamp to photodegrade the OLR of 1.64 kgCOD/L for the 21 days HRT. This elucidates other researchers’ findings who also integrated AD and AOP for wastewater treatment and biogas production [9,32,35]. These findings give an insight into the production of bioenergy and CO2 emission reduction with the potency to lower the energy requirement for the photodegradation process while mitigating environmental pollutants in the wastewater settings [1,5,13,36].
2.5.4. Energy Economy
As photocatalysis is an energy intensive process responsible for about 80% of the total energy cost of operation, subsidising its energy utilisation (Figure 8) can improve the bioeconomy of the integrated system. Considering the electricity requirement of the UV lamp (Figure 8), the bioenergy (Figure 7) produced was at least able to compensate this energy required (Figure 10). Herein, by applying an electricity unit cost of R3.22 ($0.23) per kWh [21], from the bioenergy produced (Figure 7) and utilised (Figure 8), the net average energy of 0.216 kWh was priced R0.72 ($0.5). As illustrated in Figure 10, the component net energy of 3.065 kWh (AD); 4.26 kWh (AN); −3.44 kWh (AOP) and −3.02 kWh (Ms) corresponded to the price of R9.87 ($0.7); R13.73 ($0.98); −R11.07 (-$0.79) and −R9.73 (−$0.7). However, it is worth noting that the lowest energy of the integrated system was due to the biogas produced by the AD process (Figure 7), which subsidised the cost of the UV-vis lamp used for the photocatalysis. This suggests that the bioenergy economy via the use of the integrated system was found to be viable. This is agreeable with Apollo et al.’s [13] studies, as they integrated the AD-AOP system to improve water quality at low energy utilisation and operational costs. Therefore, incorporating wastewater bioenergy into the future low carbon global energy system will boost the wastewater circular economy.
3. Materials and Methods
3.1. Materials
The characterised distribution (Table 1) of the wastewater was outsourced from a local eThekwini municipal wastewater treatment plant in the KwaZulu-Natal province, South Africa. A magnetite-titanium photocatalyst (Fe-TiO2) synthesised via the co-precipitation technique reported in our previous works [21,37] was used. Additional characterisation with the Brunauer–Emmett–Teller theory (Micromeritics, TriStar II Plus, Norcross, GA, USA) recorded a BET surface area of 62.73 m2/g, pore volume of 0.017 cm3/g and particle size of 1.337 nm.
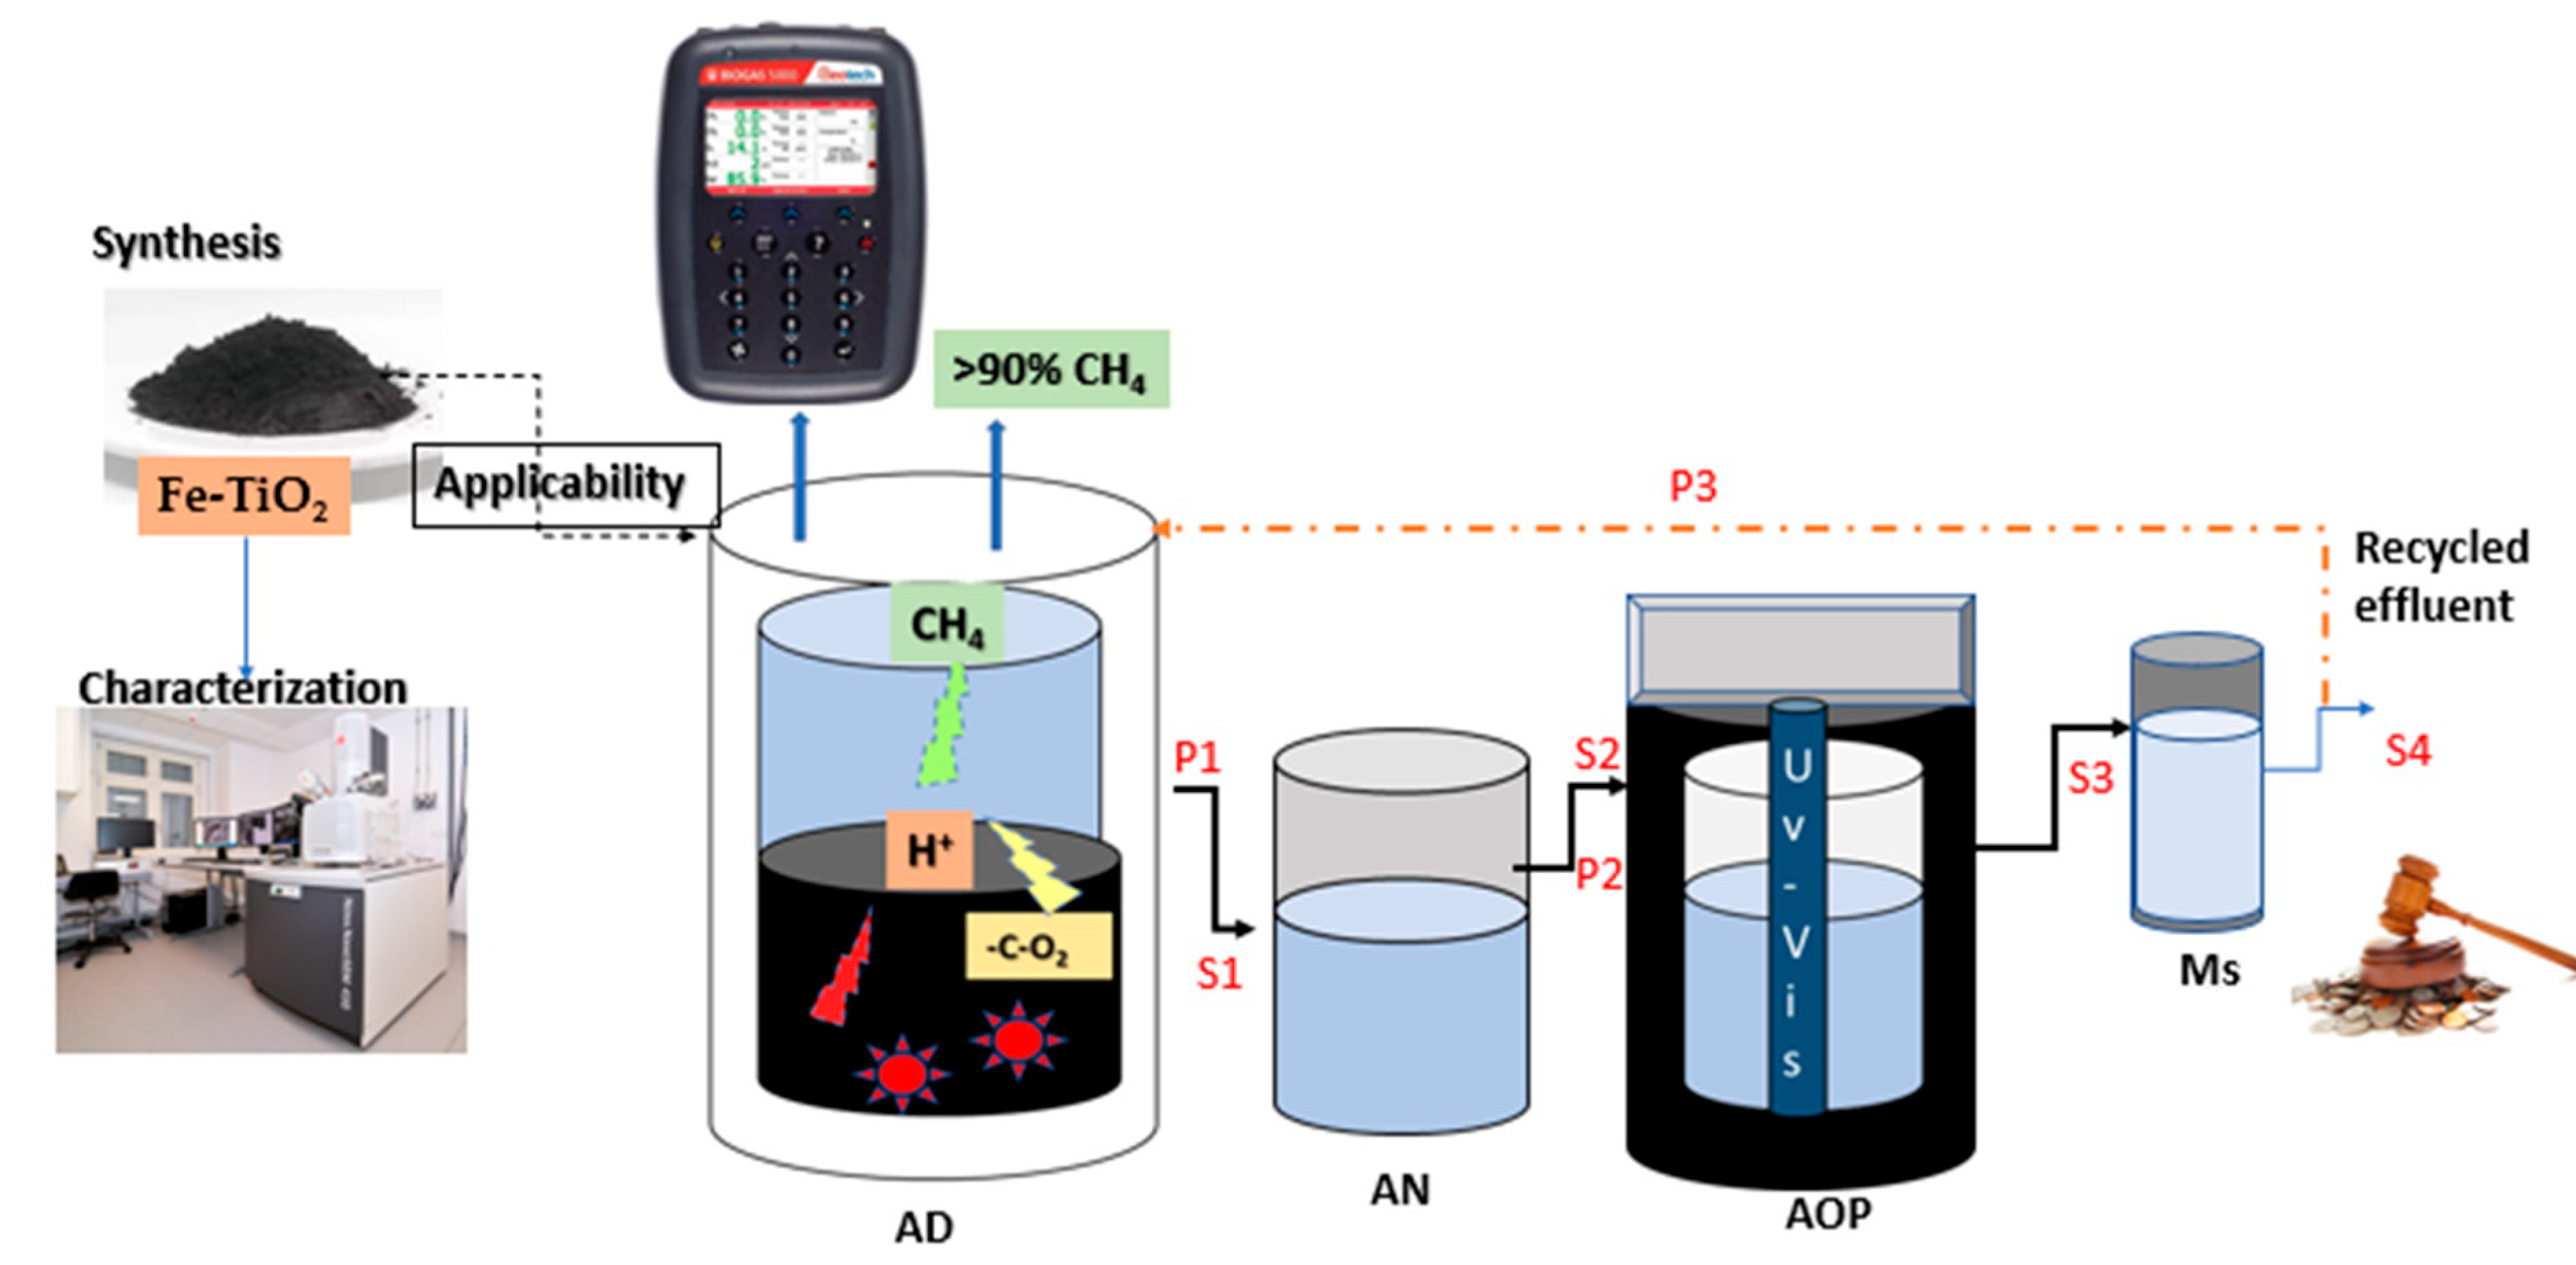
3.2. Experimental Setup Description and Procedure
Figure 11 shows the integrated AD-AOP magnetised system assembled as a semi-batch continuous process. The AD process was in a 5 L bioreactor with four ports. The AOP system coupled with the UV-vis light was supplied by LELESIL (Model: 1140—Alpha, Haryana, India). In addition, the Ms (0.5 L) was purchased from Eclipse (Micromag MM5, Sheffield, UK). Three pumps that operated at 35 mL/min, 33 mL/min and 26 mL/min for P1, P2 and P3, respectively, were used. The P1 and P2 were Blue-white A—100 N pumps (Flexflo, Weston, FL, USA), whereas the P2 was a Black stone pump (BL3, Simeria, Romania).
3.2.1. Feedstock
The municipality wastewater sampled from the biofiltration unit was used as a feedstock for the system. Prior to that, the AD and AN systems were first inoculated with activated sludge of 304.5 ± 23.6 mgTS/L and 229.5 ± 2.65 mgVS/L to aid biodegradability and promote microbial diversity inside the reactor. The amount of inoculum charged was 1.5 L and 2.5 L for the AD and AN reactors, respectively. As well as the AD and AN being topped with the wastewater sample to a working volume of 4.5 L, the overflow was fed into the AOP (0.45 L) and MS (0.5 L), which was then recycled back to the AD process. The purpose of recirculating was to enhance homogenisation of the feedstock inside the AD process.
3.2.2. Setup—Operation
Anaerobic conditions were established by purging the AD and AN system with nitrogen gas and leaving it to stand for 48 h at a mesophilic temperature of 37–45 °C. The AD and AOP systems were then charged with a catalyst load of 4 g Fe-TiO2 to investigate the hydraulic retention time of 7, 14 and 21 days at a constant organic load of 0.394 kg COD/L·d. With the UV-vis controller switched on, the system was run in an intermittent recycled continuous mode for 5 h and then switched to batch mode. Samples were taken at 30 min intervals from each unit sample point (AD-S1, AN-S2, AOP-S3 and Ms-S4), which were then characterised for COD degradation. Furthermore, based on the HRT design conditions (7, 14 and 21 days), system biogas production was monitored daily via download displacement measurement and its corresponding water quality was then characterised. A Portable Biogas Analyser (Geotech Biogas 5000, Leamington Spa, UK) was used to characterise the biogas composition weekly.
3.3. Data Collection and Response Analysis
The data obtained are reflections of the triplicated averaged results of the samples analysed. The treatability efficiency was estimated based on the water quality parameters (COD and colour), even though other parameters were monitored. The degree of degradation via the COD reduction and biogas production was used to estimate the bioenergy produced (Ebio), energy consumed (Euv), energy efficiency (β = Ebio/Euv) and CO2 emission reduction (CER) [13,32]. The decontamination efficiency was estimated with Equation (8).
where = contaminant initial concentration and = final concentration.
3.3.1. Biogas Production Kinetics
Anaerobic digestion kinetically depends on microorganism activity as functions of their growth and ability to digest and utilize the substrate available. The growth derivatives (9) and the decay (10) of the microorganisms are usually expressed based on Monod’s theory [19].
where = Microorganism concentration (mg VSS·L−1), = Substrate concentration (mg COD·L−1), Specific growth rate of organisms (d−1), = Maximum specific growth rate (d−1), Death rate constant (d−1), Monod constant (half saturation constant) (mg COD·L−1) and the indices , and stand for growth, utilisation and decay, respectively.
The breakdown of high organic strength requires long HRT to produce biogas and admirable water quality. To establish the rate of degradation, therefore, the cumulative biogas obtained was modelled and compared with the pseudo-first-order (11) and modified Gompertz (12) kinetic models.
where:
Y(t) is cumulative of specific biogas yield (mL/g COD);
Ym is maximum biogas production (mL/g COD);
λ is lag phase period or minimum time to produce biogas (days);
t is cumulative time for biogas production (days);
Rmax is the maximum specific substrate uptake rate (mL/g COD·day);
k is a first-order rate constant (1/d).
3.3.2. Energy Estimation
To estimate the energy produced by the AD process to offset the AOP electricity required for photodegradation, the energy production by the AD process was calculated using expression (13):
where is the AD energy production (kWh/m3), is the low heating value of methane, which is 10.55 kWh/m3 (10.55 × 10⁻³ kWh/L) [13], is the COD removal efficiency, is the feed concentration (kg COD/L) and is the methane production coefficient (L/kg COD removed). The energy consumption of the UV photodegradation process (EUV) was calculated using Equation (14) [13].
where P is the AOP lamp power consumption (kW), t is the irradiation time (hours), V is the volume (L) of water treated, and Ci and Cf are the initial and final concentrations of the target contaminant. Furthermore, the energy ratio (β), which is the efficiency indicator of the integrated system (AD-AOP) was calculated with Equation (15):
where EUV is the UV lamp energy consumption (kWh/L) and Ebio is the bioenergy production (kWh/L). The energy efficiency and environmental impact was estimated based on the conversion rate of biomethane into electricity. This was estimated based on the assumed 78% of energy produced, where 33% was electricity generated from the biogas and 45% was estimated as heat in a co-generation process [9,32]. Herein, the electricity potential can be expressed (16) as 33% of the total bioenergy generated per unit of effluent volume treated (kWh/m3). Furthermore, the energy utilised by the pumps was approximated using Equation (17).
where Ep is pump power (W), Q is the flow rate of the recycle stream (m3/s), ρ is fluid density (kg/m3), g is the gravitational acceleration (m/s2), h is the head (m) and ω is the pump efficiency, which was assumed to be 0.6 [13,33]. Generally, the bioconversion of carbon dioxide to methane of anthropogenic emissions from wastewater treatment plants and landfill gases can necessitate the reduction of global warming. Herein, the CO2 emission reduction (CER) expressed in equation (18) was therefore estimated as a function of the electricity produced to power the UV lamp of the photoreactor (AOP) with respect to the base line grid emission factor (GEF) of 0.957 kg CO2 e/kWh [9,32].
4. Conclusions
In this study, a magnetic ferrite-based titanium oxide (Fe-TiO2) nanocomposite exhibited an excellent catalytic activity for the degradation of organic content (1.64 kgCOD/L) of municipality wastewater by using an integrated anaerobic-photomagnetic (AD-AN-AOP-Ms) system. Additionally, Fe-TiO2 is demonstrated as being a promising photocatalyst for the degradation of wastewater in order to maximise biogas production. Upon successive recycling, the Fe-TiO2 with a BET surface area of 62.73 m2/g, pore volume of 0.017 cm3/g and pore size of 1.337 nm showed good recoverability with an external magnetic field for reuse. The bioenergy economy of the integrated system was found to be viable as the bioenergy produced was able to subsidise the energy required by the photocatalytic system assisted with the UV-vis lamp, leaving a net energy of 0.216 kWh priced at R0.72 ($0.5). The findings also give insight into reducing CO2 emissions in wastewater settings, as the integrated system energy efficiency of 10.68% resulted in a 1.74 kg CO2e/m3 reduction. Above all, with this integrated system development in progress, wastewater settings engineers will have a viable technology to mitigate wastewater challenges towards a circular economy with sustainable environmental benefits.
Author Contributions
Conceptualisation, methodology, investigation and writing of the original draft was carried out by E.K.T. Writing review and editing, project administration, funding acquisition and supervision by S.R. All authors have read and agreed to the published version of the manuscript.
Funding
This research was funded by the Water Research Commission of South Africa under project identification WRC Project: C2019/2020-00212.
Data Availability Statement
Not applicable.
Acknowledgments
The authors wish to thank the Durban University of Technology, Green Engineering and Sustainability Research Group, and the Water Research Commission of South Africa for their support on the project identification WRC Project: C2019/2020-00212. The corresponding author also wishes to thank the National Research Foundation for their research excellence award grant 138046.
Conflicts of Interest
The authors declare no conflict of interest and the funders had no role in the design of the study; in the collection, analyses, or interpretation of data; in the writing of the manuscript or in the decision to publish the results.
References
- Nguyen, T.K.L.; Ngo, H.H.; Guo, W.; Nguyen, T.L.H.; Chang, S.W.; Nguyen, D.D.; Varjani, S.; Lei, Z.; Deng, L. Environmental impacts and greenhouse gas emissions assessment for energy recovery and material recycle of the wastewater treatment plant. Sci. Total Environ. 2021, 784, 147135. [Google Scholar] [CrossRef]
- Tetteh, E.K.; Asante-Sackey, D.; Armah, E.K.; Rathilal, S. Tapping Wastewater Resource: Why and How? In Handbook of Biofuels; Elsevier: Amsterdam, The Netherlands, 2022; pp. 125–146. [Google Scholar]
- Kushwaha, J.P. A review on sugar industry wastewater: Sources, treatment technologies, and reuse. Desalination Water Treat. 2015, 53, 309–318. [Google Scholar] [CrossRef]
- Kweinor Tetteh, E.; Opoku Amankwa, M.; Armah, E.K.; Rathilal, S. Fate of COVID-19 Occurrences in Wastewater Systems: Emerging Detection and Treatment Technologies—A Review. Water 2020, 12, 2680. [Google Scholar] [CrossRef]
- Rout, P.R.; Zhang, T.C.; Bhunia, P.; Surampalli, R.Y. Treatment technologies for emerging contaminants in wastewater treatment plants: A review. Sci. Total Environ. 2021, 753, 141990. [Google Scholar] [CrossRef] [PubMed]
- Mahtab, M.S.; Farooqi, I.H.; Khursheed, A. Zero Fenton Sludge Discharge: A Review on Reuse Approach during Wastewater Treatment by the Advanced Oxidation Process. Int. J. Environ. Sci. Technol. 2021, 1–14. [Google Scholar] [CrossRef]
- Chai, W.S.; Cheun, J.Y.; Kumar, P.S.; Mubashir, M.; Majeed, Z.; Banat, F.; Ho, S.-H.; Show, P.L. A review on conventional and novel materials towards heavy metal adsorption in wastewater treatment application. J. Clean. Prod. 2021, 296, 126589. [Google Scholar] [CrossRef]
- Tetteh, E.K.; Naidoo, B.D.; Rathilal, S. Optimization of photo-catalytic degradation of oil refinery wastewater using Box-Behnken design. Environ. Eng. Res. 2019, 24, 711–717. [Google Scholar] [CrossRef]
- Bella, K.; Rao, P.V. Anaerobic Digestion of Dairy Wastewater: Effect of Different Parameters and Co-Digestion Options—A Review. Biomass Convers. Biorefinery 2021, 1–26. [Google Scholar] [CrossRef]
- Ángeles, R.; Vega-Quiel, M.J.; Batista, A.; Fernández-Ramos, O.; Lebrero, R.; Muñoz, R. Influence of biogas supply regime on photosynthetic biogas upgrading performance in an enclosed algal-bacterial photobioreactor. Algal Res. 2021, 57, 102350. [Google Scholar] [CrossRef]
- Fernández-Polanco, D.; Aagesen, E.; Fdz-Polanco, M.; Pérez-Elvira, S.I. Comparative analysis of the thermal hydrolysis integration within WWTPs as a pre-, inter- or post-treatment for anaerobic digestion of sludge. Energy 2021, 223, 120041. [Google Scholar] [CrossRef]
- Zhao, J.; Li, Y.; Dong, R. Recent progress towards in-situ biogas upgrading technologies. Sci. Total Environ. 2021, 800, 149667. [Google Scholar] [CrossRef]
- Apollo, S.; Onyango, M.S.; Ochieng, A. An integrated anaerobic digestion and UV photocatalytic treatment of distillery wastewater. J. Hazard. Mater. 2013, 261, 435–442. [Google Scholar] [CrossRef] [PubMed]
- Tetteh, E.K.; Rathilal, S. Application of Organic Coagulants in Water and Wastewater Treatment. Org. Polym. 2019. [Google Scholar] [CrossRef]
- Zhao, C.; Zhou, J.; Yan, Y.; Yang, L.; Xing, G.; Li, H.; Wu, P.; Wang, M.; Zheng, H. Application of coagulation/flocculation in oily wastewater treatment: A review. Sci. Total Environ. 2021, 765, 142795. [Google Scholar] [CrossRef]
- Ahmed, M.B.; Zhou, J.L.; Ngo, H.H.; Guo, W.; Thomaidis, N.S.; Xu, J. Progress in the biological and chemical treatment technologies for emerging contaminant removal from wastewater: A critical review. J. Hazard. Mater. 2017, 323, 274–298. [Google Scholar] [CrossRef] [PubMed]
- Kweinor Tetteh, E.; Rathilal, S. Biogas production from wastewater treatment-evaluating anaerobic and biomagnetic systems. Water-Energy Nexus 2021, 4, 165–173. [Google Scholar] [CrossRef]
- Ajay, C.; Mohan, S.; Dinesha, P.; Rosen, M.A. Review of impact of nanoparticle additives on anaerobic digestion and methane generation. Fuel 2020, 277, 118234. [Google Scholar] [CrossRef]
- Xie, S.; Hai, F.I.; Zhan, X.; Guo, W.; Ngo, H.H.; Price, W.E.; Nghiem, L.D. Anaerobic co-digestion: A critical review of mathematical modelling for performance optimization. Bioresour. Technol. 2016, 222, 498–512. [Google Scholar] [CrossRef] [PubMed]
- Kweinor Tetteh, E.; Rathilal, S. Kinetics and nanoparticle catalytic enhancement of biogas production from wastewater using a magnetized biochemical methane potential (Mbmp) system. Catalysts 2020, 10, 1200. [Google Scholar] [CrossRef]
- Tetteh, E.K.; Amo-Duodu, G.; Rathilal, S. Synergistic Effects of Magnetic Nanomaterials on Post-Digestate for Biogas Production. Molecules 2021, 26, 6434. [Google Scholar] [CrossRef]
- Ghofrani-Isfahani, P.; Baniamerian, H.; Tsapekos, P.; Alvarado-Morales, M.; Kasama, T.; Shahrokhi, M.; Vossoughi, M.; Angelidaki, I. Effect of metal oxide based TiO2 nanoparticles on anaerobic digestion process of lignocellulosic substrate. Energy 2020, 191, 116580. [Google Scholar] [CrossRef]
- Madondo, N.I.; Tetteh, E.K.; Rathilal, S.; Bakare, B.F. Synergistic Effect of Magnetite and Bioelectrochemical Systems on Anaerobic Digestion. Bioengineering 2021, 8, 198. [Google Scholar] [CrossRef]
- Rojo, E.; Carmona, A.; Soto, C.; Díaz, I.; Fernández-Polanco, M.; Palacio, L.; Muñoz, R.; Bolado, S. Environment and Material Science Technology for Anaerobic Digestion-Based Circular Bioeconomy. In Biomass, Biofuels, Biochemicals; Elsevier: Amsterdam, The Netherlands, 2021; pp. 25–55. [Google Scholar]
- Ge, M.; Hu, Z.; Wei, J.; He, Q.; He, Z. Recent advances in persulfate-assisted TiO2-based photocatalysis for wastewater treatment: Performances, mechanism and perspectives. J. Alloys Compd. 2021, 888, 161625. [Google Scholar] [CrossRef]
- Thakre, K.G.; Barai, D.P.; Bhanvase, B.A. A review of graphene-TiO2 and graphene-ZnO nanocomposite photocatalysts for wastewater treatment. Water Environ. Res. 2021, 93, 2414–2460. [Google Scholar] [CrossRef] [PubMed]
- El-Gendy, N.S.; Nassar, H.N. Biosynthesized magnetite nanoparticles as an environmental opulence and sustainable wastewater treatment. Sci. Total Environ. 2021, 774, 145610. [Google Scholar] [CrossRef] [PubMed]
- De Oliveira Guidolin, T.; Possolli, N.M.; Polla, M.B.; Wermuth, T.B.; de Oliveira, T.F.; Eller, S.; Montedo, O.R.K.; Arcaro, S.; Cechinel, M.A.P. Photocatalytic pathway on the degradation of methylene blue from aqueous solutions using magnetite nanoparticles. J. Clean. Prod. 2021, 318, 128556. [Google Scholar] [CrossRef]
- Qu, X.; Alvarez, P.J.; Li, Q. Applications of nanotechnology in water and wastewater treatment. Water Res. 2013, 47, 3931–3946. [Google Scholar] [CrossRef]
- Chong, M.N.; Jin, B.; Chow, C.W.; Saint, C. Recent developments in photocatalytic water treatment technology: A review. Water Res. 2010, 44, 2997–3027. [Google Scholar] [CrossRef]
- Hwang, J.Y.; Moon, G.-h.; Kim, B.; Tachikawa, T.; Majima, T.; Hong, S.; Cho, K.; Kim, W.; Choi, W. Crystal phase-dependent generation of mobile OH radicals on TiO2: Revisiting the photocatalytic oxidation mechanism of anatase and rutile. Appl. Catal. B Environ. 2021, 286, 119905. [Google Scholar] [CrossRef]
- Apollo, S.; Onyango, M.S.; Ochieng, A. Modelling energy efficiency of an integrated anaerobic digestion and photodegradation of distillery effluent using response surface methodology. Environ. Technol. 2016, 37, 2435–2446. [Google Scholar] [CrossRef]
- Durán, I.; Rubiera, F.; Pevida, C. Modeling a biogas upgrading PSA unit with a sustainable activated carbon derived from pine sawdust. Sensitivity analysis on the adsorption of CO2 and CH4 mixtures. Chem. Eng. J. 2021, 428, 132564. [Google Scholar] [CrossRef]
- Krzysztof, Z. Methane fermentation process as anaerobic digestion of biomass: Transformations, stages and microorganisms. Afr. J. Biotechnol. 2012, 11, 4127–4139. [Google Scholar] [CrossRef] [Green Version]
- Zulfiqar, M.; Samsudin, M.F.R.; Sufian, S. Modelling and optimization of photocatalytic degradation of phenol via TiO2 nanoparticles: An insight into response surface methodology and artificial neural network. J. Photochem. Photobiol. A Chem. 2019, 384, 112039. [Google Scholar] [CrossRef]
- De Andrade Guerra, J.B.S.O.; Berchin, I.I.; Garcia, J.; da Silva Neiva, S.; Jonck, A.V.; Faraco, R.A.; de Amorim, W.S.; Ribeiro, J.M.P. A literature-based study on the water-energy-food nexus for sustainable development. Stoch. Environ. Res. Risk Assess. 2021, 35, 95–116. [Google Scholar] [CrossRef]
- Amo-Duodu, G.; Tetteh, E.K.; Rathilal, S.; Armah, E.K.; Adedeji, J.; Chollom, M.N.; Chetty, M. Effect of Engineered Biomaterials and Magnetite on Wastewater Treatment: Biogas and Kinetic Evaluation. Polymers 2021, 13, 4323. [Google Scholar] [CrossRef] [PubMed]
Figure 1.
Recycling degradation of COD after 5 h by the integrated system components; AD—anaerobic digestion; AN—buffer system; AOP—advanced oxidation process; Ms—Magnetic filter system.
Figure 1.
Recycling degradation of COD after 5 h by the integrated system components; AD—anaerobic digestion; AN—buffer system; AOP—advanced oxidation process; Ms—Magnetic filter system.

Figure 2.
Removal of COD and colour by the integrated system component units; AD—anaerobic digestion; AN—buffer system; AOP—advanced oxidation process; Ms—Magnetic filter system.
Figure 2.
Removal of COD and colour by the integrated system component units; AD—anaerobic digestion; AN—buffer system; AOP—advanced oxidation process; Ms—Magnetic filter system.

Figure 3.
Pseudo-first-order kinetic plot of (a) colour and (b) COD removal by the integrated system components; AD—anaerobic digestion; AN—buffer system; AOP—advanced oxidation process; Ms—Magnetic filter system.
Figure 3.
Pseudo-first-order kinetic plot of (a) colour and (b) COD removal by the integrated system components; AD—anaerobic digestion; AN—buffer system; AOP—advanced oxidation process; Ms—Magnetic filter system.

Figure 4.
Daily biogas production of the integrated system over a hydraulic retention time of 21 days.
Figure 4.
Daily biogas production of the integrated system over a hydraulic retention time of 21 days.

Figure 5.
Cumulative biogas and methane content over a hydraulic retention time of 21 days.

Figure 6.
Cumulative biogas kinetic fitted models.

Figure 7.
Estimated bioenergy produced by the integrated system component units; AD—anaerobic digestion; AN—buffer system; AOP—advanced oxidation process; Ms—Magnetic filter system.
Figure 7.
Estimated bioenergy produced by the integrated system component units; AD—anaerobic digestion; AN—buffer system; AOP—advanced oxidation process; Ms—Magnetic filter system.

Figure 8.
Estimated energy utilised by the integrated system component units; AD—anaerobic digestion; AN—buffer system; AOP—advanced oxidation process; Ms—Magnetic filter system.
Figure 8.
Estimated energy utilised by the integrated system component units; AD—anaerobic digestion; AN—buffer system; AOP—advanced oxidation process; Ms—Magnetic filter system.

Figure 9.
Estimated CO2 emission reduction and energy efficiency by the integrated system component units; AD—anaerobic digestion; AN—buffer system; AOP—advanced oxidation process; Ms—Magnetic filter system.
Figure 9.
Estimated CO2 emission reduction and energy efficiency by the integrated system component units; AD—anaerobic digestion; AN—buffer system; AOP—advanced oxidation process; Ms—Magnetic filter system.

Figure 10.
Estimated energy cost by applying electricity unit cost of R3.22 ($0.23) per kWh; AD—anaerobic digestion; AN—buffer system; AOP—advanced oxidation process; Ms—Magnetic filter system.
Figure 10.
Estimated energy cost by applying electricity unit cost of R3.22 ($0.23) per kWh; AD—anaerobic digestion; AN—buffer system; AOP—advanced oxidation process; Ms—Magnetic filter system.

Figure 11.
Graphical representation of the integrated system in operation; AD—anaerobic digestion; AN—buffer system; AOP—advanced oxidation process; Ms—magnetic field.
Figure 11.
Graphical representation of the integrated system in operation; AD—anaerobic digestion; AN—buffer system; AOP—advanced oxidation process; Ms—magnetic field.


Table 1.
Treatability summary efficiency of the integrated system component units.
| Parameter | Feed | AD | AN | AOP | MS |
|---|---|---|---|---|---|
| pH | 7.8 ± 2.3 | 6.83 ± 0.23 | 6.86 ± 0.6 | 6.83 ± 0.2 | 6.9 ± 0.2 |
| Temp (℃) | 28.4 ± 3.6 | 27.88 ± 0.18 | 26.54 ± 0.126 | 26.54 ± 0.15 | 26.04 ± 1.3 |
| Colour (Pt.Co) | 1840 ± 45 | 319.25 ± 1.25 | 215.85 ± 5.23 | 83.17 ± 1.36 | 67.03 ± 2.4 |
| Turbidity (NTU) | 604 ± 13.6 | 102.85 ± 1.25 | 63.25 ± 2.6 | 32.62 ± 1.73 | 23.23 ± 1.73 |
| COD (mg/L) | 1640 ± 24.2 | 265.75 ± 7.24 | 215.75 ± 1.64 | 161.95 ± 1.85 | 108.78 ± 1.65 |
| NH3 (mg/L) | 5.47 ± 1.2 | 7 ± 2.4 | 5.5 ± 1.2 | 4.35 ± 1.3 | 3.5 ± 1.4 |
| TKN (mg/L) | 38.3 ± 1.7 | 8.47 | 7.615 | 5.62 | 3.24 |
| NO3 (mg/L) | 7.05 ± 2.3 | −7.24 | −6.84 | −5.03 | −2.94 |
| TN (mg/L) | 45.35 ± 8.7 | 1.23 | 0.778 | 0.587 | 0.295 |
AD—anaerobic digestion; AN—buffer system; AOP—advanced oxidation process; Ms—Magnetic filter system.
Table 2.
Kinetic regression coefficient of the integrated system components.
| Water Parameter | Colour | COD | ||
|---|---|---|---|---|
| Integrated system component | k (d−1) | R2 | k (d−1) | R2 |
| AD | 1.7 | 0.853 | 1.8 | 0.965 |
| AN | 2.14 | 0.865 | 2.02 | 0.873 |
| AOP | 3.12 | 0.896 | 2.33 | 0.965 |
| Ms | 3.38 | 0.951 | 2.717 | 0.986 |
AD—anaerobic digestion; AN—buffer system; AOP—advanced oxidation process; Ms—Magnetic filter system; k—kinetic constant.
Table 3.
Comparing first-order and modified Gompertz kinetics.
| Model Parameters | First-Order | Modified Gompertz |
|---|---|---|
| Y(t) (mL/gCOD) | 1220 | 1220 |
| Ym (mL/gCOD) | 1180.04 | 1210.74 |
| ʎ (days) | n/a | 10.50 |
| k (1/day) | 5.7 × 10⁻⁵ | 0.171 |
| R2 | 0.988 | 0.999 |
Publisher’s Note: MDPI stays neutral with regard to jurisdictional claims in published maps and institutional affiliations. |
© 2022 by the authors. Licensee MDPI, Basel, Switzerland. This article is an open access article distributed under the terms and conditions of the Creative Commons Attribution (CC BY) license (https://creativecommons.org/licenses/by/4.0/).
Share and Cite
MDPI and ACS Style
Tetteh, E.K.; Rathilal, S. Biophotocatalytic Reduction of CO2 in Anaerobic Biogas Produced from Wastewater Treatment Using an Integrated System. Catalysts 2022, 12, 76. https://0-doi-org.brum.beds.ac.uk/10.3390/catal12010076
AMA Style
Tetteh EK, Rathilal S. Biophotocatalytic Reduction of CO2 in Anaerobic Biogas Produced from Wastewater Treatment Using an Integrated System. Catalysts. 2022; 12(1):76. https://0-doi-org.brum.beds.ac.uk/10.3390/catal12010076
Chicago/Turabian StyleTetteh, Emmanuel Kweinor, and Sudesh Rathilal. 2022. "Biophotocatalytic Reduction of CO2 in Anaerobic Biogas Produced from Wastewater Treatment Using an Integrated System" Catalysts 12, no. 1: 76. https://0-doi-org.brum.beds.ac.uk/10.3390/catal12010076
Note that from the first issue of 2016, this journal uses article numbers instead of page numbers. See further details here.