Article

Evaluation of Ni-Doped Tricobalt Tetroxide with Reduced Graphene Oxide: Structural, Photocatalysis, and Antibacterial Response

by
João Otávio Donizette Malafatti
1,
Ailton José Moreira
2,
Elaine Cristina Paris
1,
Leydi Julieta Cardenas Flechas
3,4,
Otávio Augusto Poli Pereira
5 and
Miryam Rincón Joya
6,*
1
National Nanotechnology Laboratory for Agriculture (LNNA), EMBRAPA Instrumentação, XV de Novembro St., 1452, São Carlos, SP 13560-970, Brazil
2
Department of Chemistry, Federal University of São Carlos, Rod. Washington Luiz, KM 235, São Carlos, SP 13565-905, Brazil
3
Facultad de Ingeniería, Departamento de Ingeniería Mecánica y Mecatrónica, Universidad Nacional de Colombia-Sede Bogotá, Bogotá 111321, Colombia
4
Departamento de Ingeniería Mecánica y Mecatrónica, Fundación Universidad de América, Bogotá 111221, Colombia
5
Institute of Science and Technology, Federal University of Alfenas, Rod. José Aurelio Vilela, BR 267, KM 533, 11999, Poços de Caldas, MG 37715-400, Brazil
6
Departamento de Física, Facultad de Ciencias, Universidad Nacional de Colombia-Bogotá, Carrera 30 Calle 45-03, Bogotá 111321, Colombia
*
Author to whom correspondence should be addressed.
Submission received: 8 September 2022 / Revised: 2 October 2022 / Accepted: 6 October 2022 / Published: 9 October 2022
(This article belongs to the Special Issue Nanomaterials for Photocatalysis and Piezo-Photocatalysis)

Abstract

:
Cobalt oxide (Co3O4) nanoparticles were successfully prepared by sol–gel and hydrothermal methods for antibacterial and photocatalytic applications with the addition of 1%, 4% nickel (Ni), and reduced graphene oxide (rGO). The structural and morphological properties of the nanoparticles were obtained by XRD, TEM and FESEM techniques. Cobalt oxide showed typical crystallographic planes to cubic phase and particles with inferior diameter to 30 nm. The Ni-Co3O4 + rGO nanocrystals exhibit a band gap value of 2.0 eV. The bactericidal tests for S. aureus and E. coli revealed that the insertion rGO synthesized by the sol–gel method promoted the antimicrobial activity for both microorganisms. Afterward, the photocatalytic assay for the atrazine contaminant showed significant responses to pesticide removal attributed to the simultaneous adsorption and degradation process. In addition, the sol–gel process found a better response to Ni-Co3O4 in the presence of rGO, indicating a nanocomposite superior synergism.

1. Introduction

The affectation of the ecosystem and human health by pollution in the modern, technological and industrialized world is increasing worldwide. Researchers in different areas have made various efforts to apply pollution treatments in this context. However, the process still has many drawbacks that limit its practical applications [1,2,3,4,5,6,7,8,9,10]. In this way, new semiconductors of various types have been used with photocatalysts, attempting to solve the problem of environmental contamination.
Various studies of metal oxide semiconductors have attracted particular attention in different scientific areas, due to the variety of structural geometries with electronic properties that endow them with diverse physical and chemical properties [3,4,5,6]. In the literature, synthetic routes have been sought on a large economic scale, reproducibility, and environment respectfully. The sol–gel and hydrothermal techniques are evidenced in nanomaterial oxide synthesis for various physical and chemical processes [2,3].
Cobalt oxide (Co3O4) is an excellent candidate due to its significant electronic, optical, and magnetic properties in various applications, such as lithium-ion batteries, heterogeneous catalysis, and gas detection. In addition, Co3O4 has been shown as a friendly environment with low toxicity and a higher absorption in the solar spectrum. In the nanometric-scale Co3O4 nanoparticles has an indirect band gap of 1.5 eV. However, the Co3O4 photocatalytic efficiency is lower due to the rapid rate of photoelectrons and holes. An alternative is doping the oxide to elevate the photodegradation properties [1]. The material doping is favorable to increasing the number of surface effects in the samples, which may help shift the optical absorption towards the visible region. The literature [1] investigated Ag-doped Co3O4 for methyl orange (MO) degradation. In this study, the catalysts showed a better activity with 0.3% Ag, showing a higher photocatalyst activity of 96.4% degradation after 30 h in ultraviolet light irradiation.
Cobalt oxide (Co3O4) with Ni addition forms the pure spinel phase. The samples that conserved the pure phase, high surface area, and optical bactericidal properties were 4% Ni (mol mol−1). Therefore, the focus of the present work consists of this percentage. These materials were obtained by sol–gel and hydrothermal methods. Additionally, for comparison, reduced graphene oxide (rGO) was used. The typical rGO applications are due to excellent electrical conductivity, high specific surface area, efficient mechanical flexibility, and ultra-thin layer characteristic.
On the other hand, rGO is commonly used as a graphene-based material with an accessible and low-cost preparation method, and it can be mass-produced [3]. As a result, the specific surface area and conductivity of the Co3O4/rGO nanocomposite in nickel foam are dramatically increased, resulting in a significant performance concerning specific capacitance and cyclic stability [3,10].
Photocatalysis in heterogeneous systems is a cost-effective method for decomposing toxic contaminants into non-toxic products [11]. Therefore, developing ecological and sustainable methodologies for atrazine treatment is essential for the industrialized world. In some literature studies, organic pollutants have been completely mineralized into CO2 and H2O during the photocatalytic process [2].
Finally, the crystallinity, morphology, elemental composition, and optical/electrical properties of the synthesized materials were characterized by XRD, FE-SEM, TEM, and UV–Vis. The experimental parameters, including the initial atrazine concentration and the catalyst dose, were determined under favorable conditions for photocatalytic degradation. Maximum degradation of 88% was achieved for continuous irradiation up to 60 min. The experiment results showed that the implementation of Ni and rGO in pure Co3O4 enhanced its photocatalytic activity due to a lower rate of electron–hole recombination and an increase in the specific surface area of Ni-Co3O4 nanocrystals and Ni-Co3O4 + rGO. Regarding the bactericidal tests of the S. aureus and E. coli bacteria, the best responses were obtained for the samples sintered by the sol–gel method.

2. Results

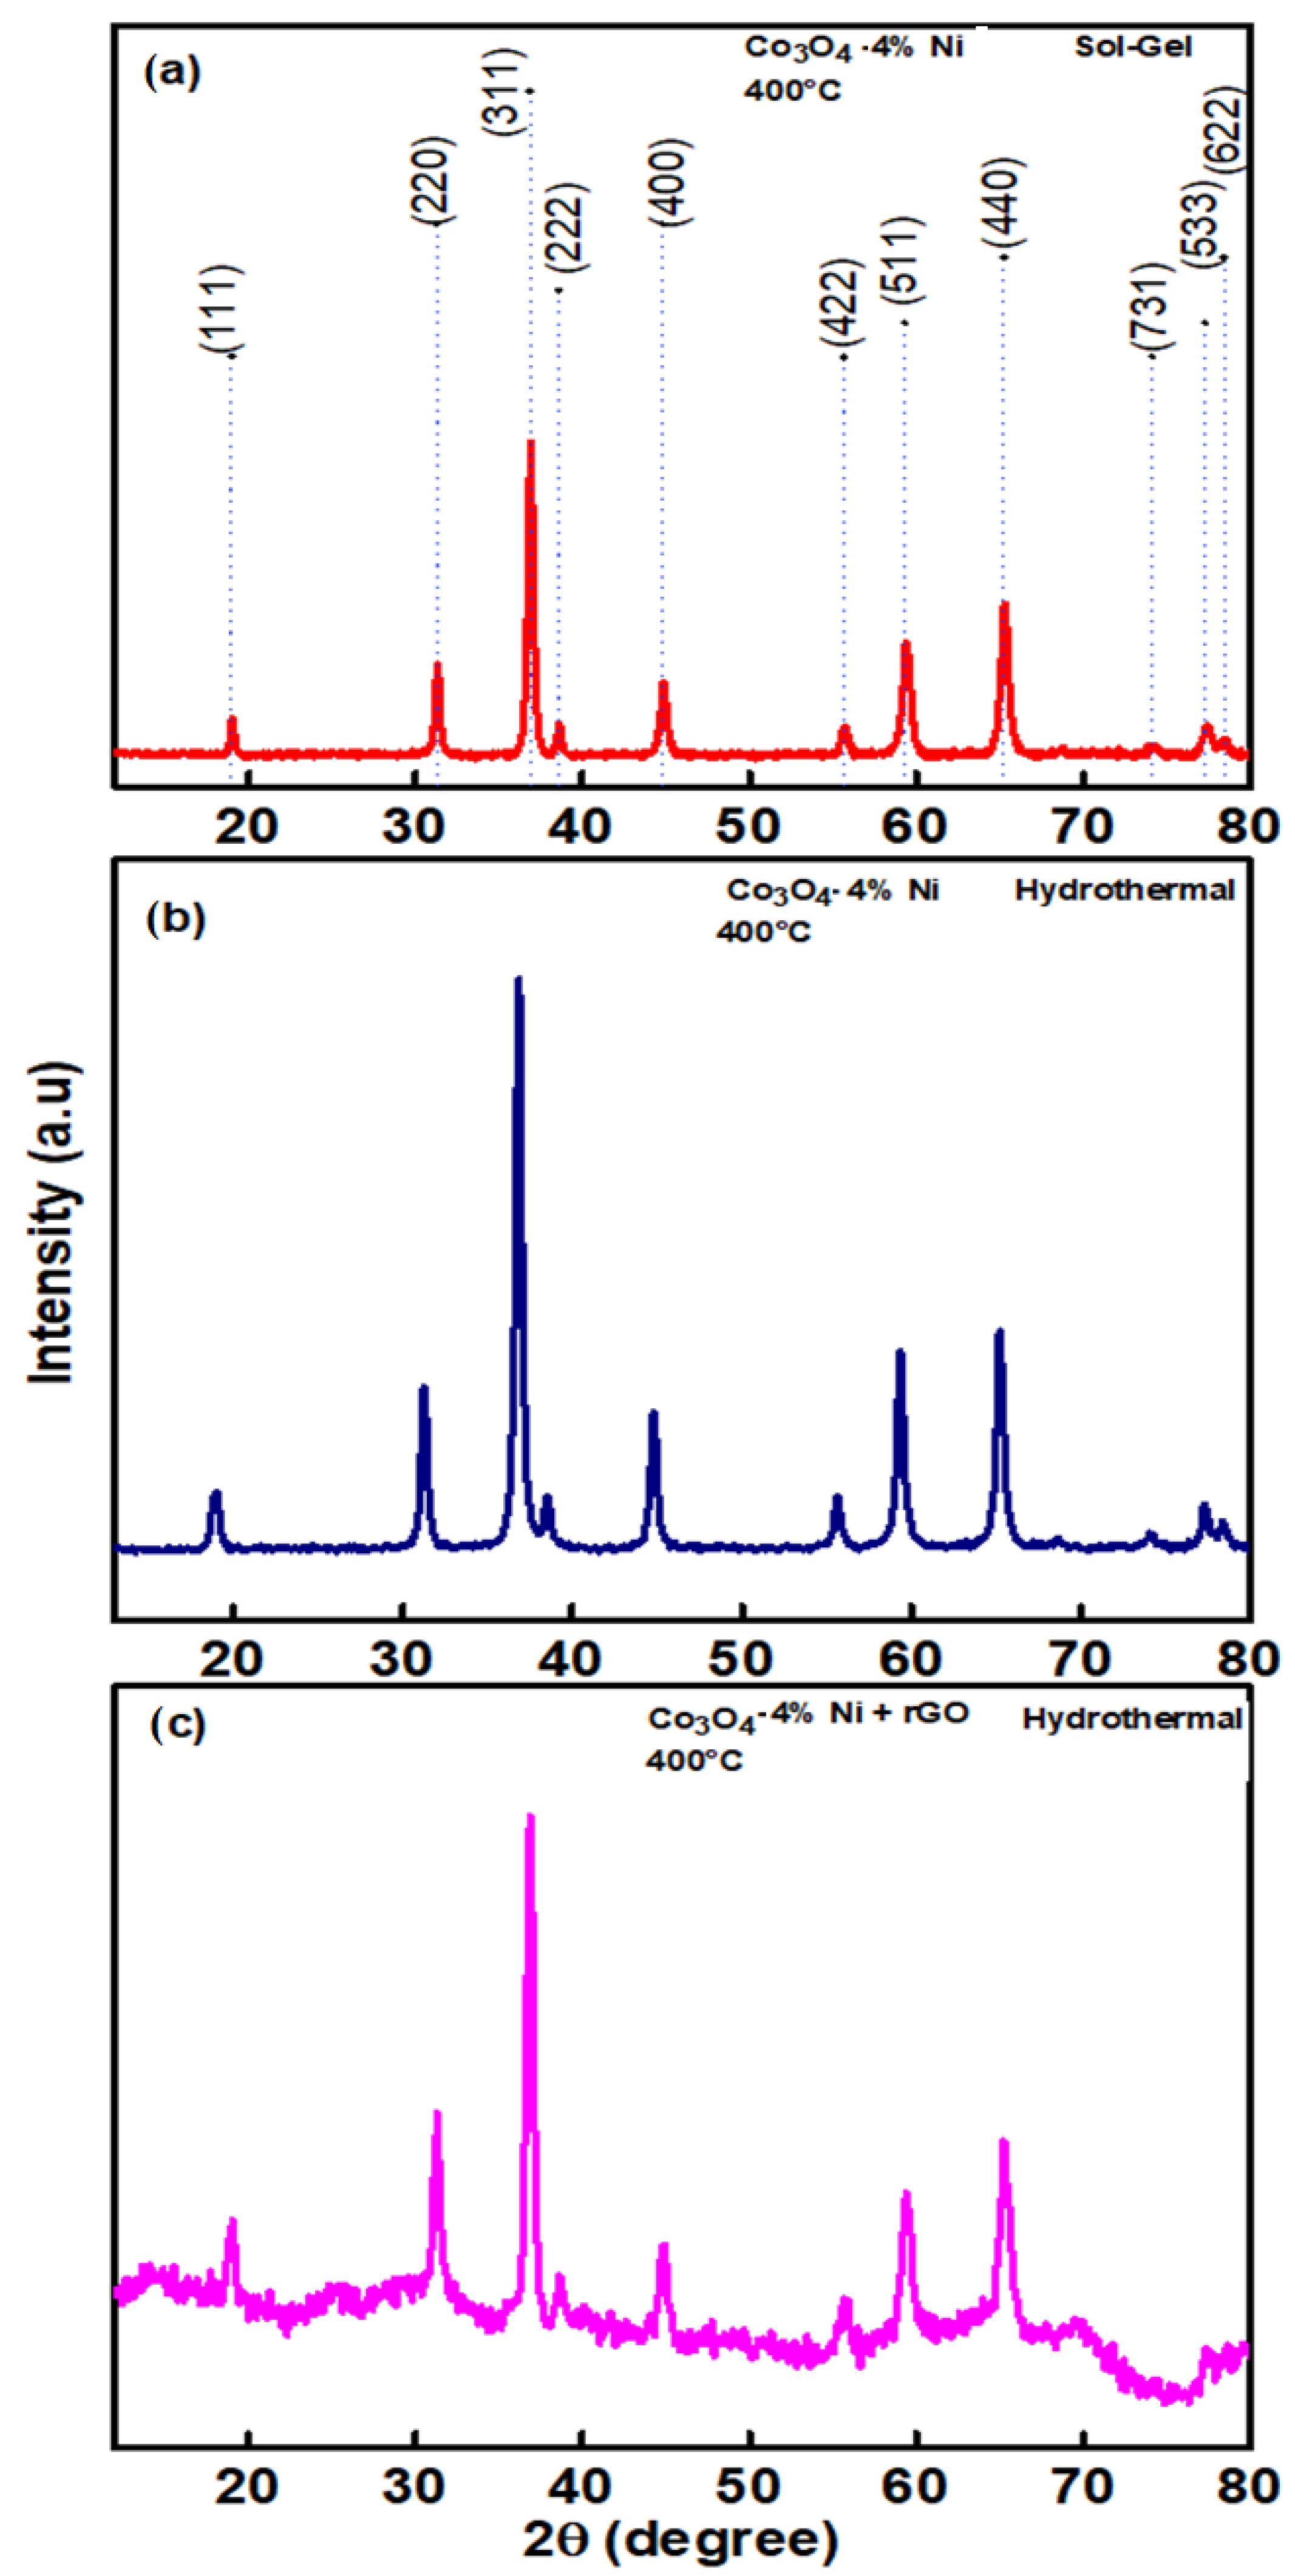
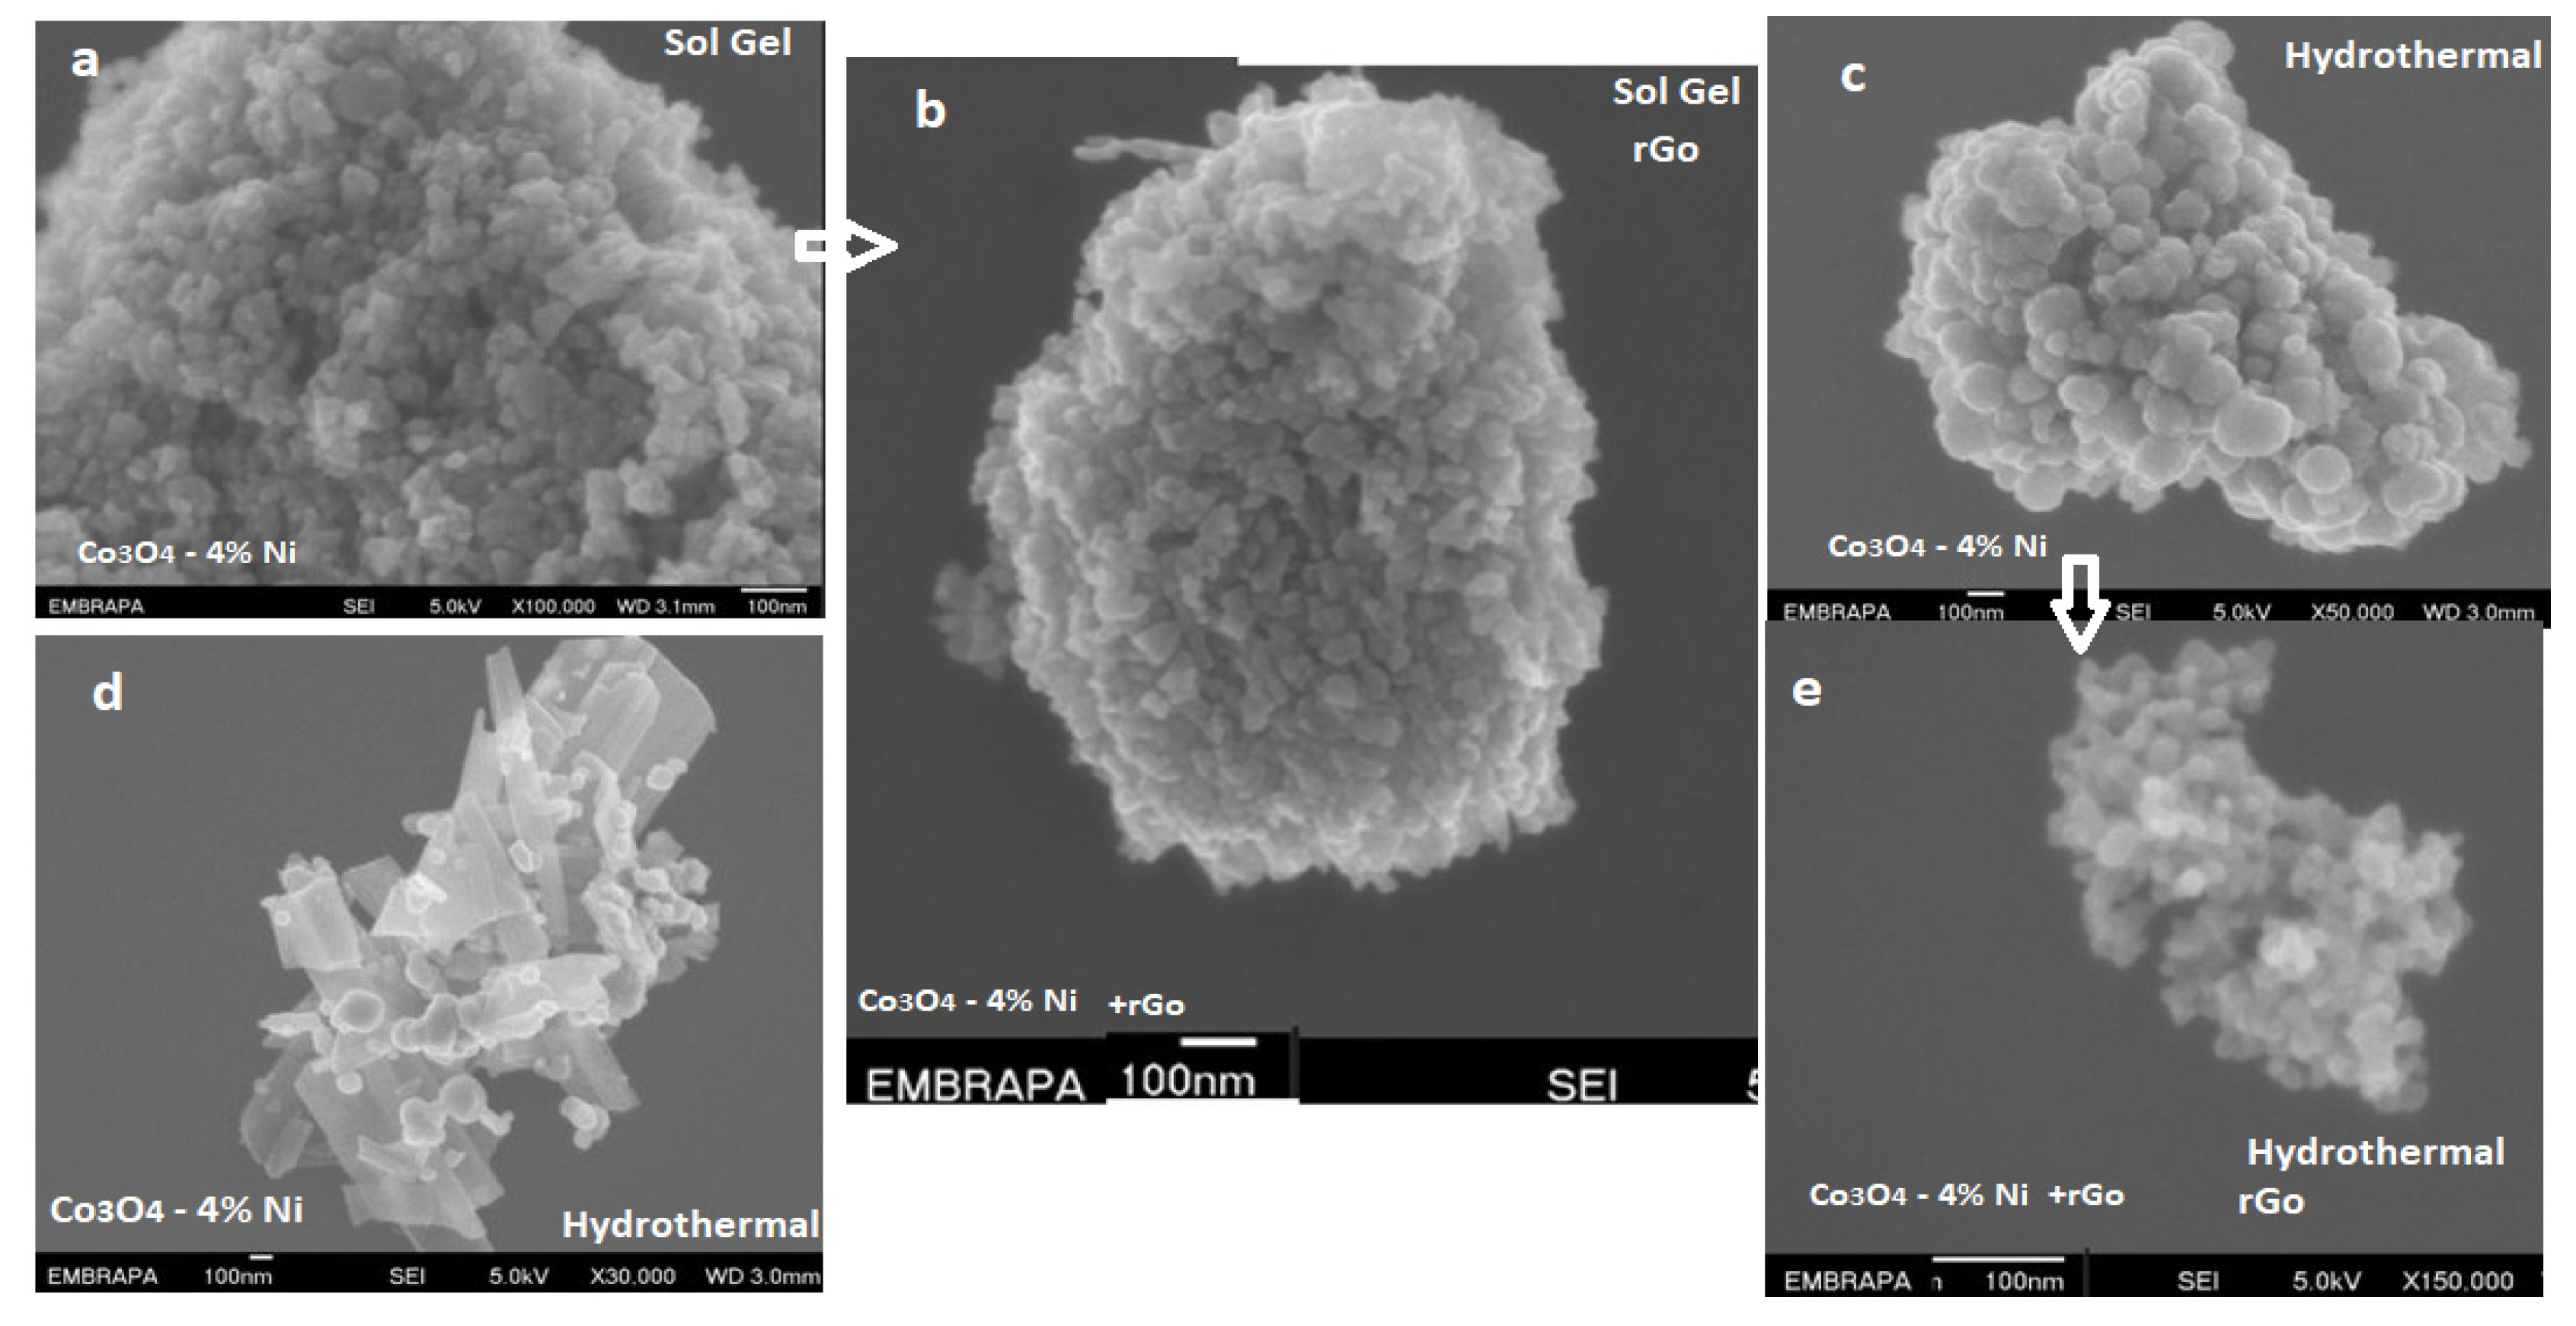
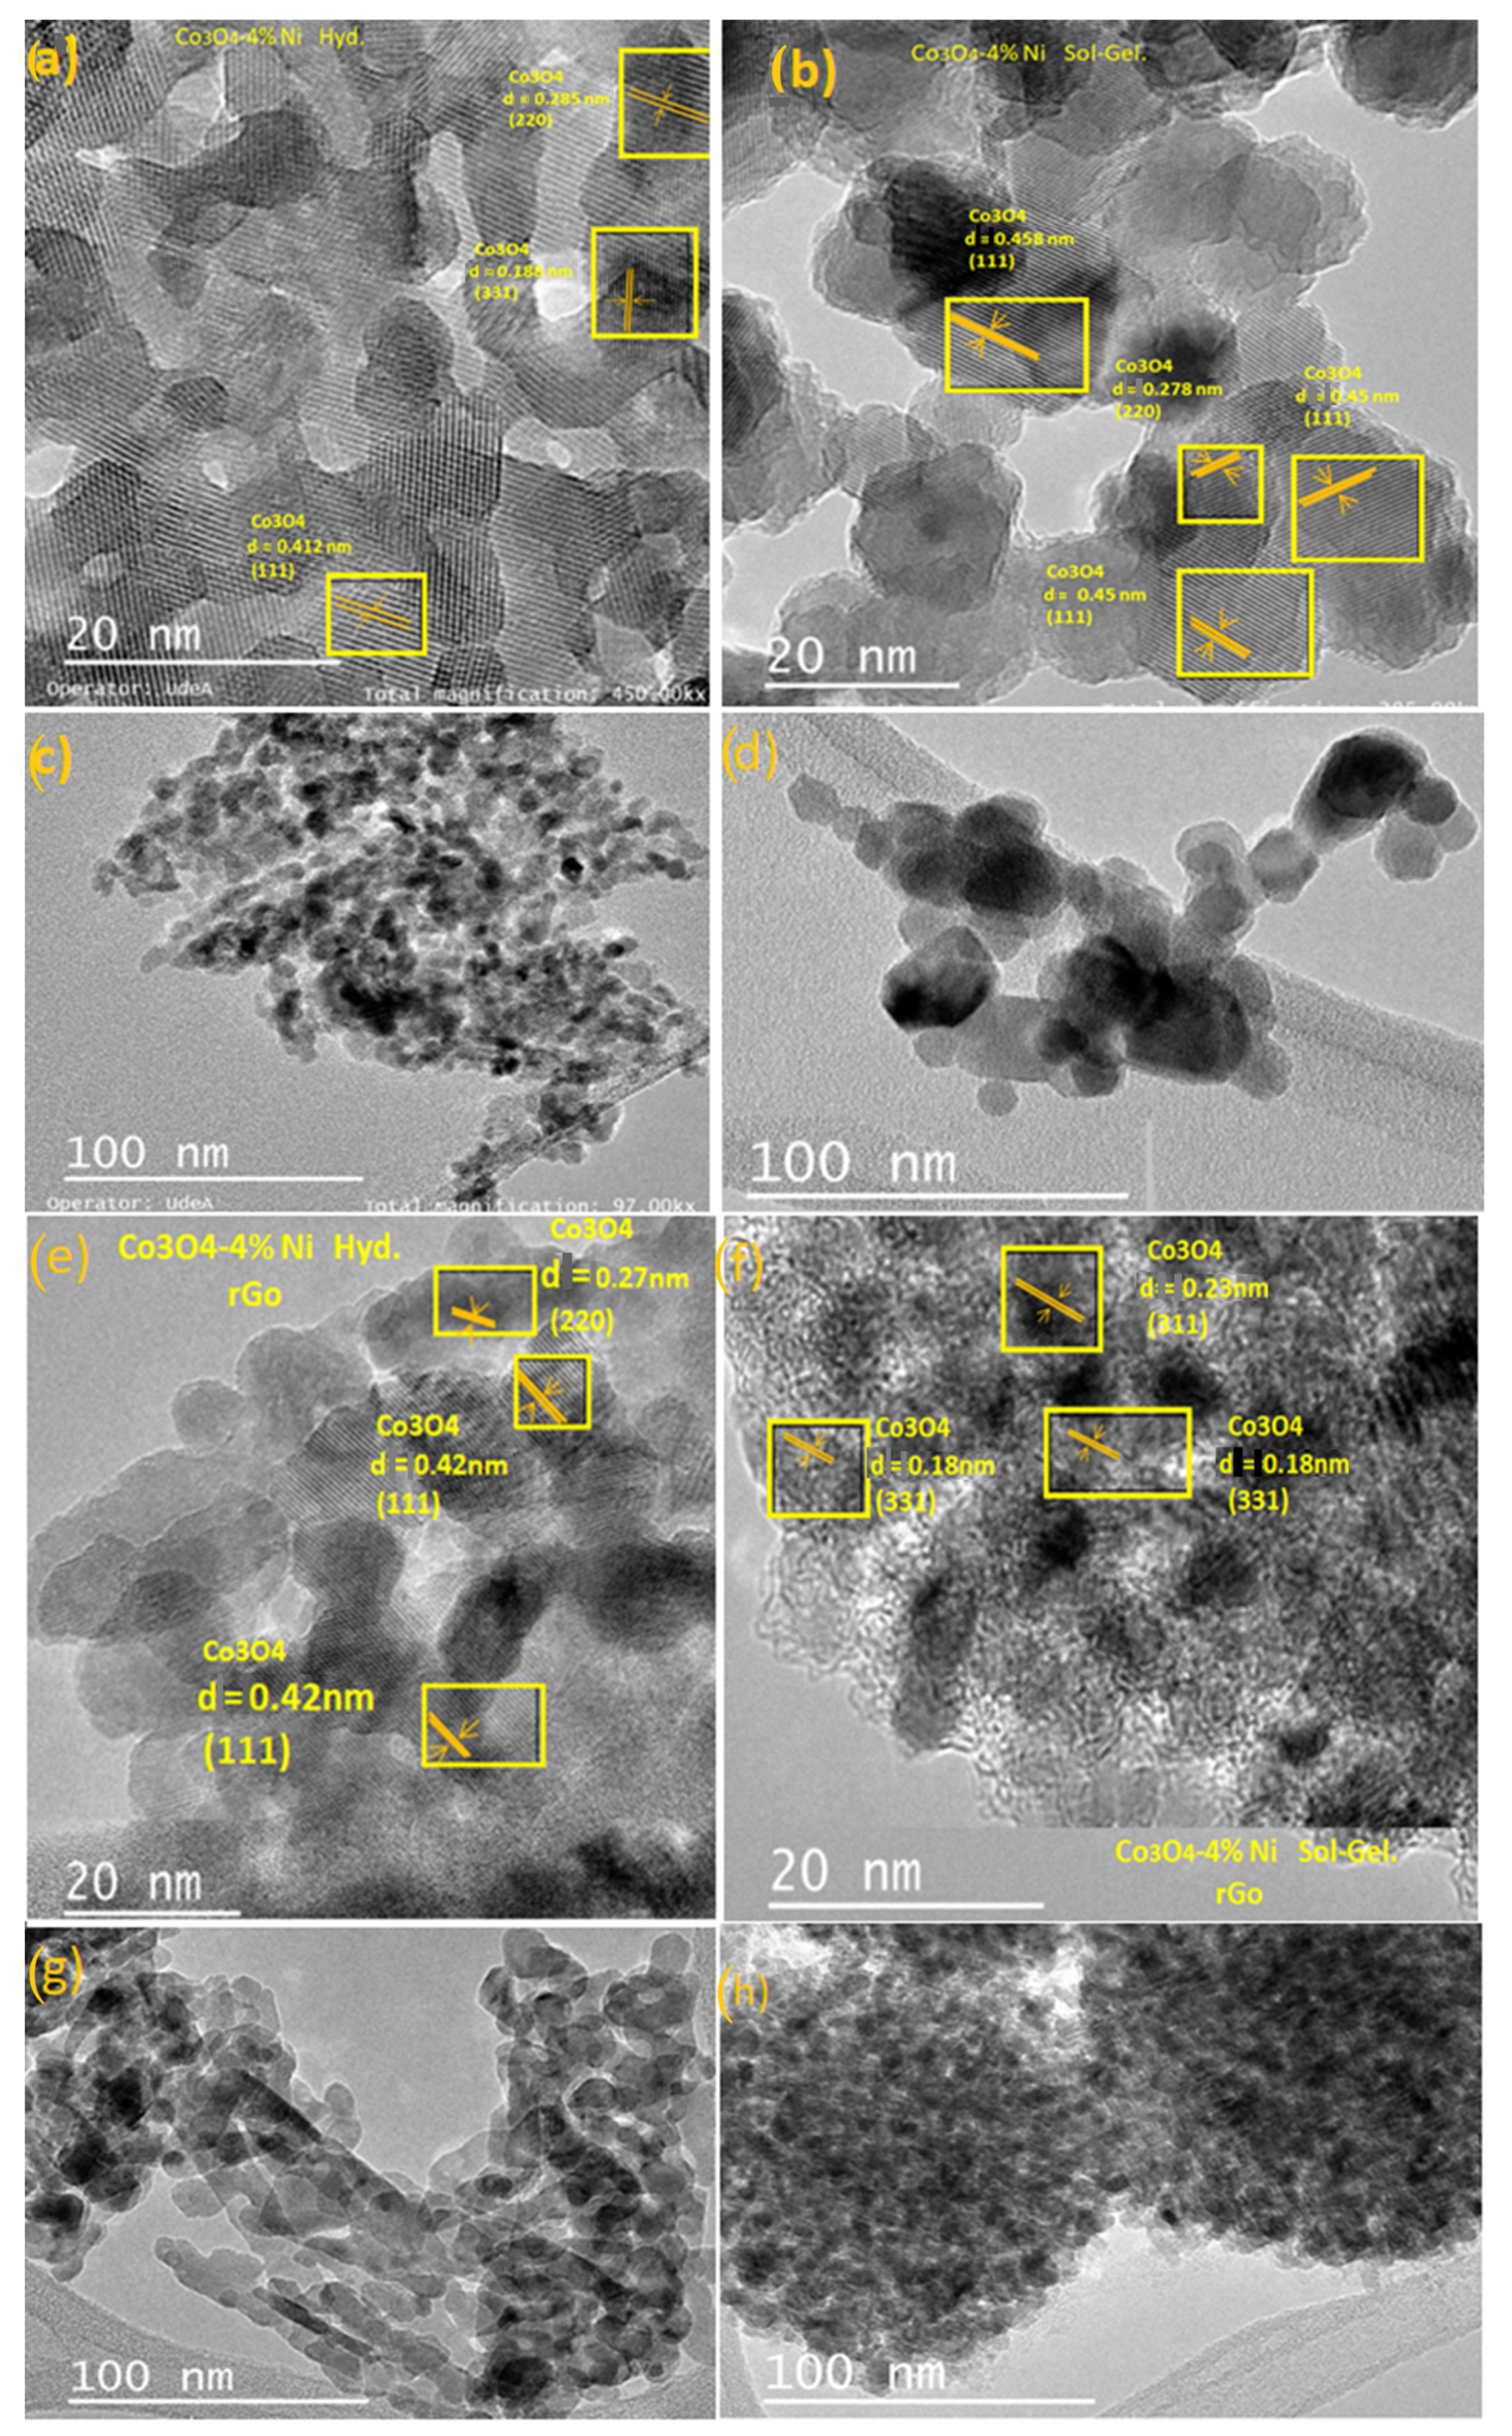
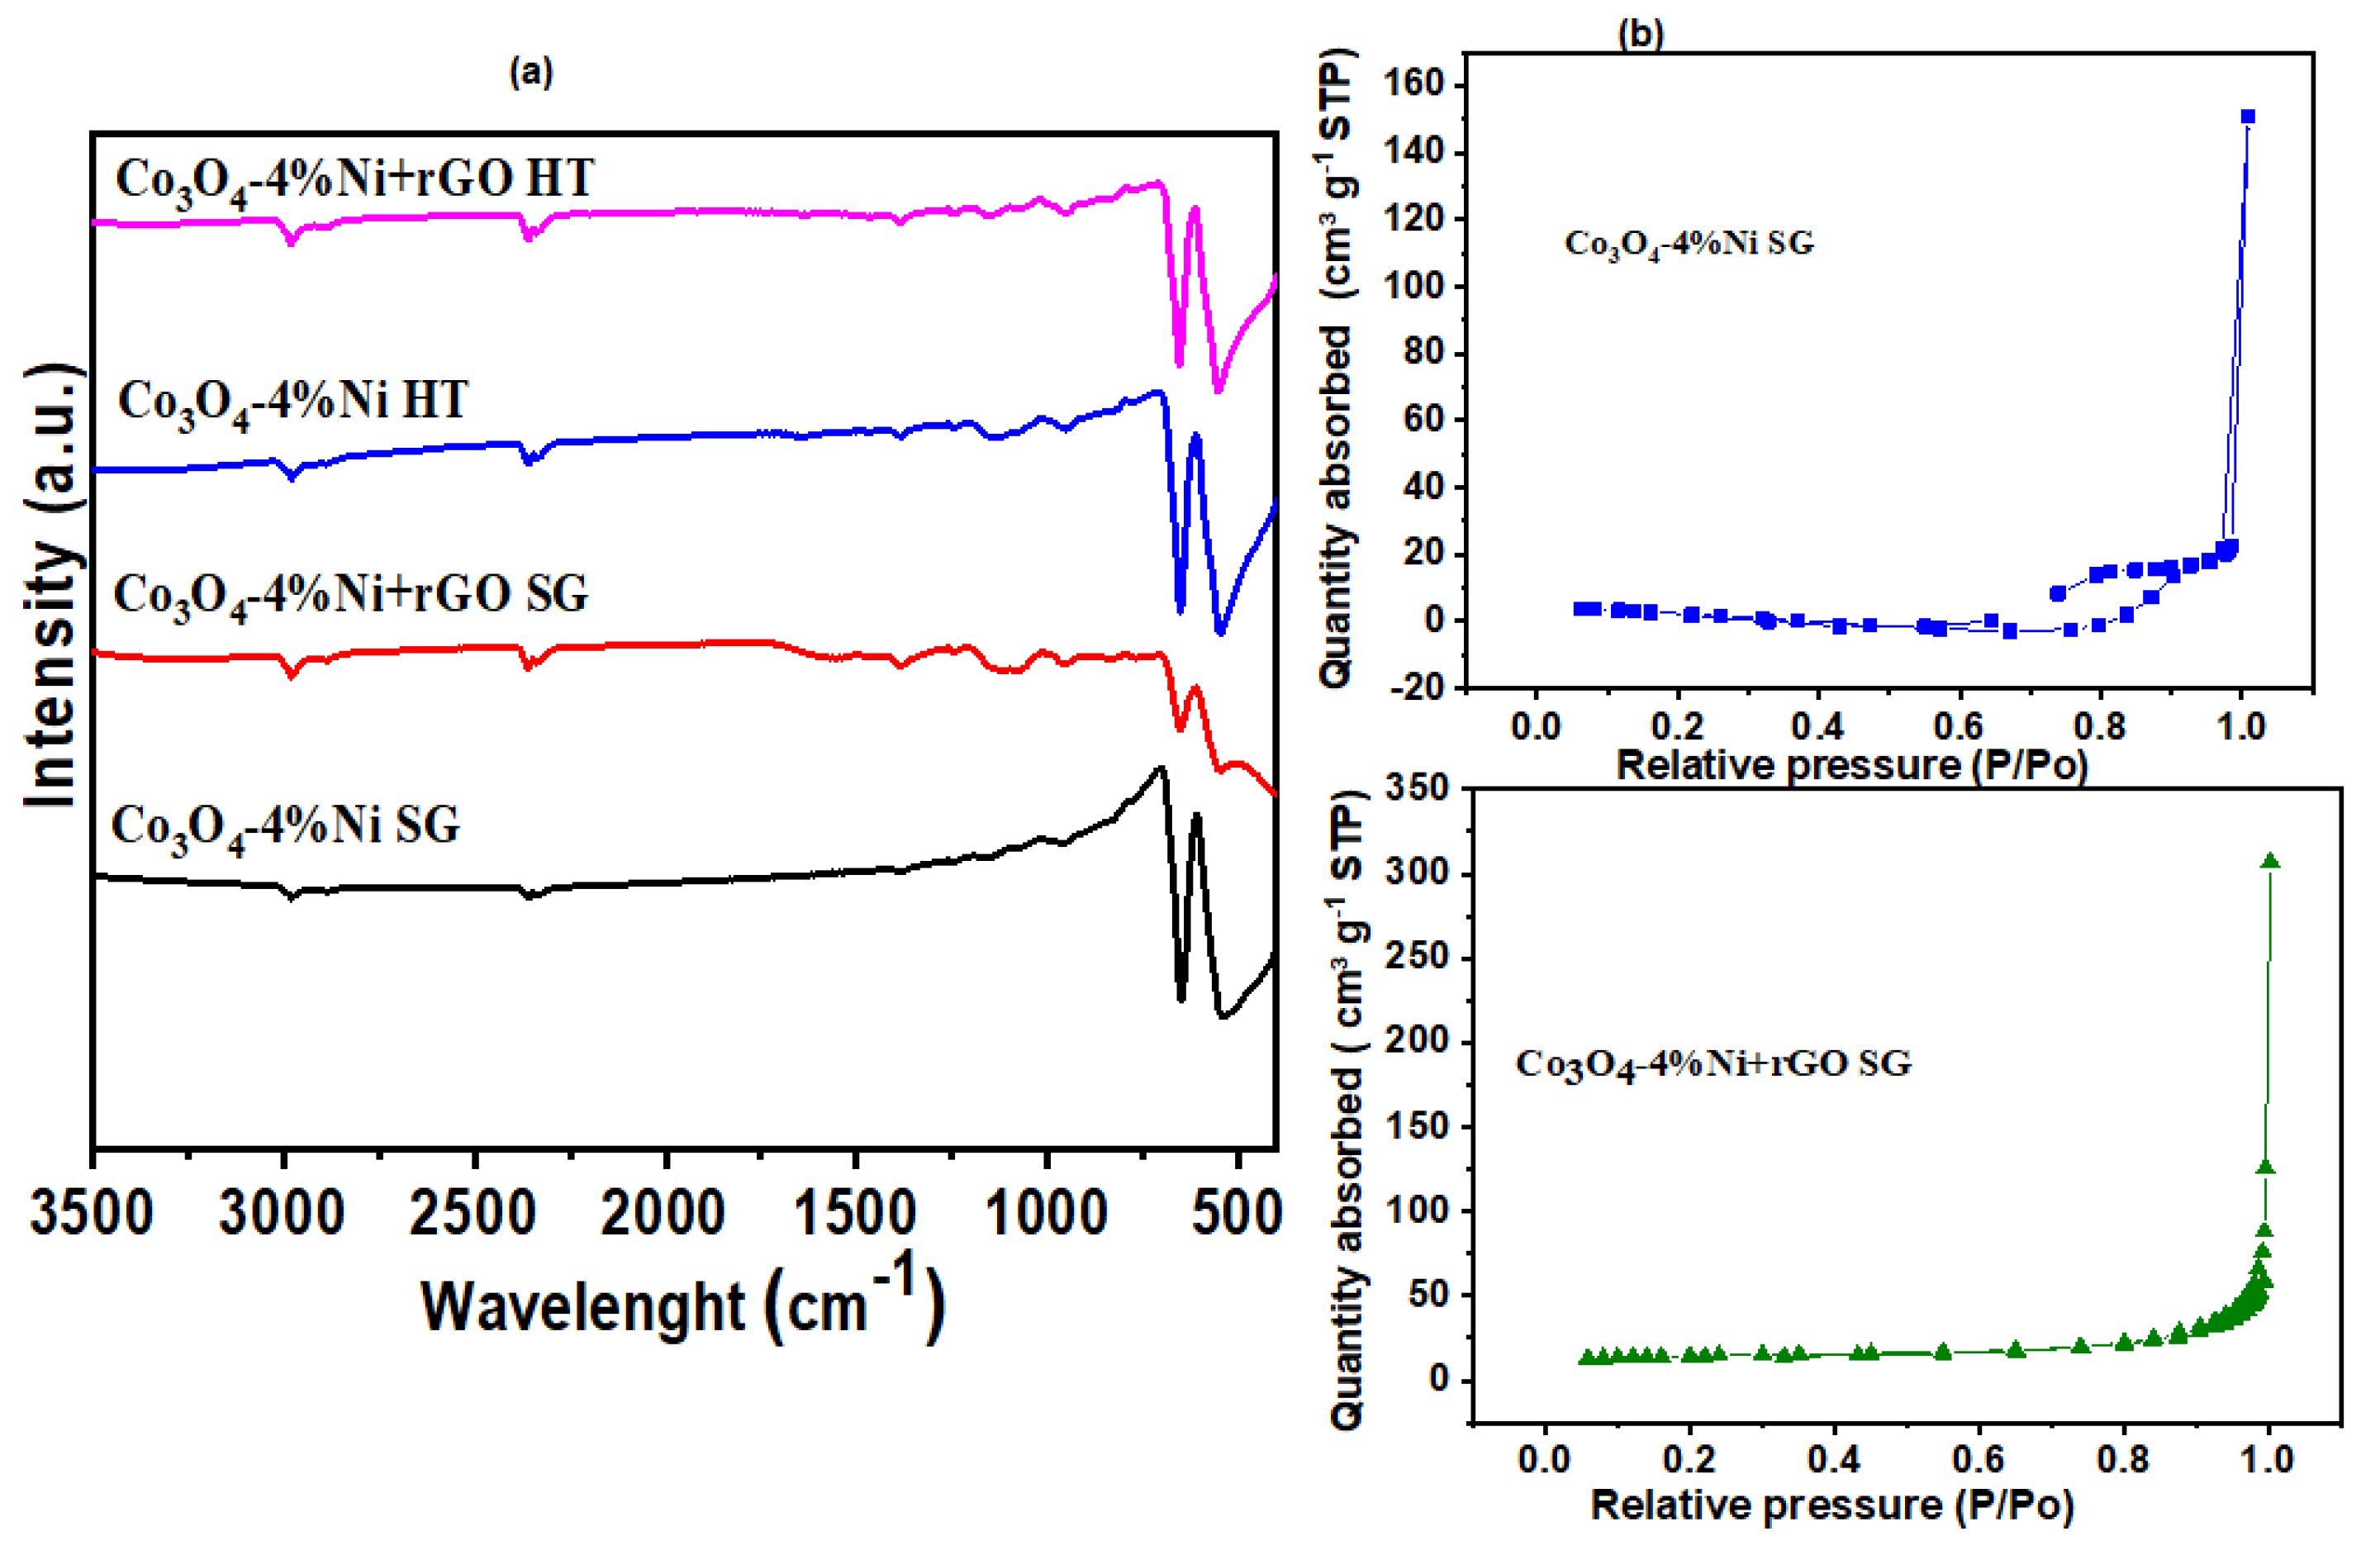
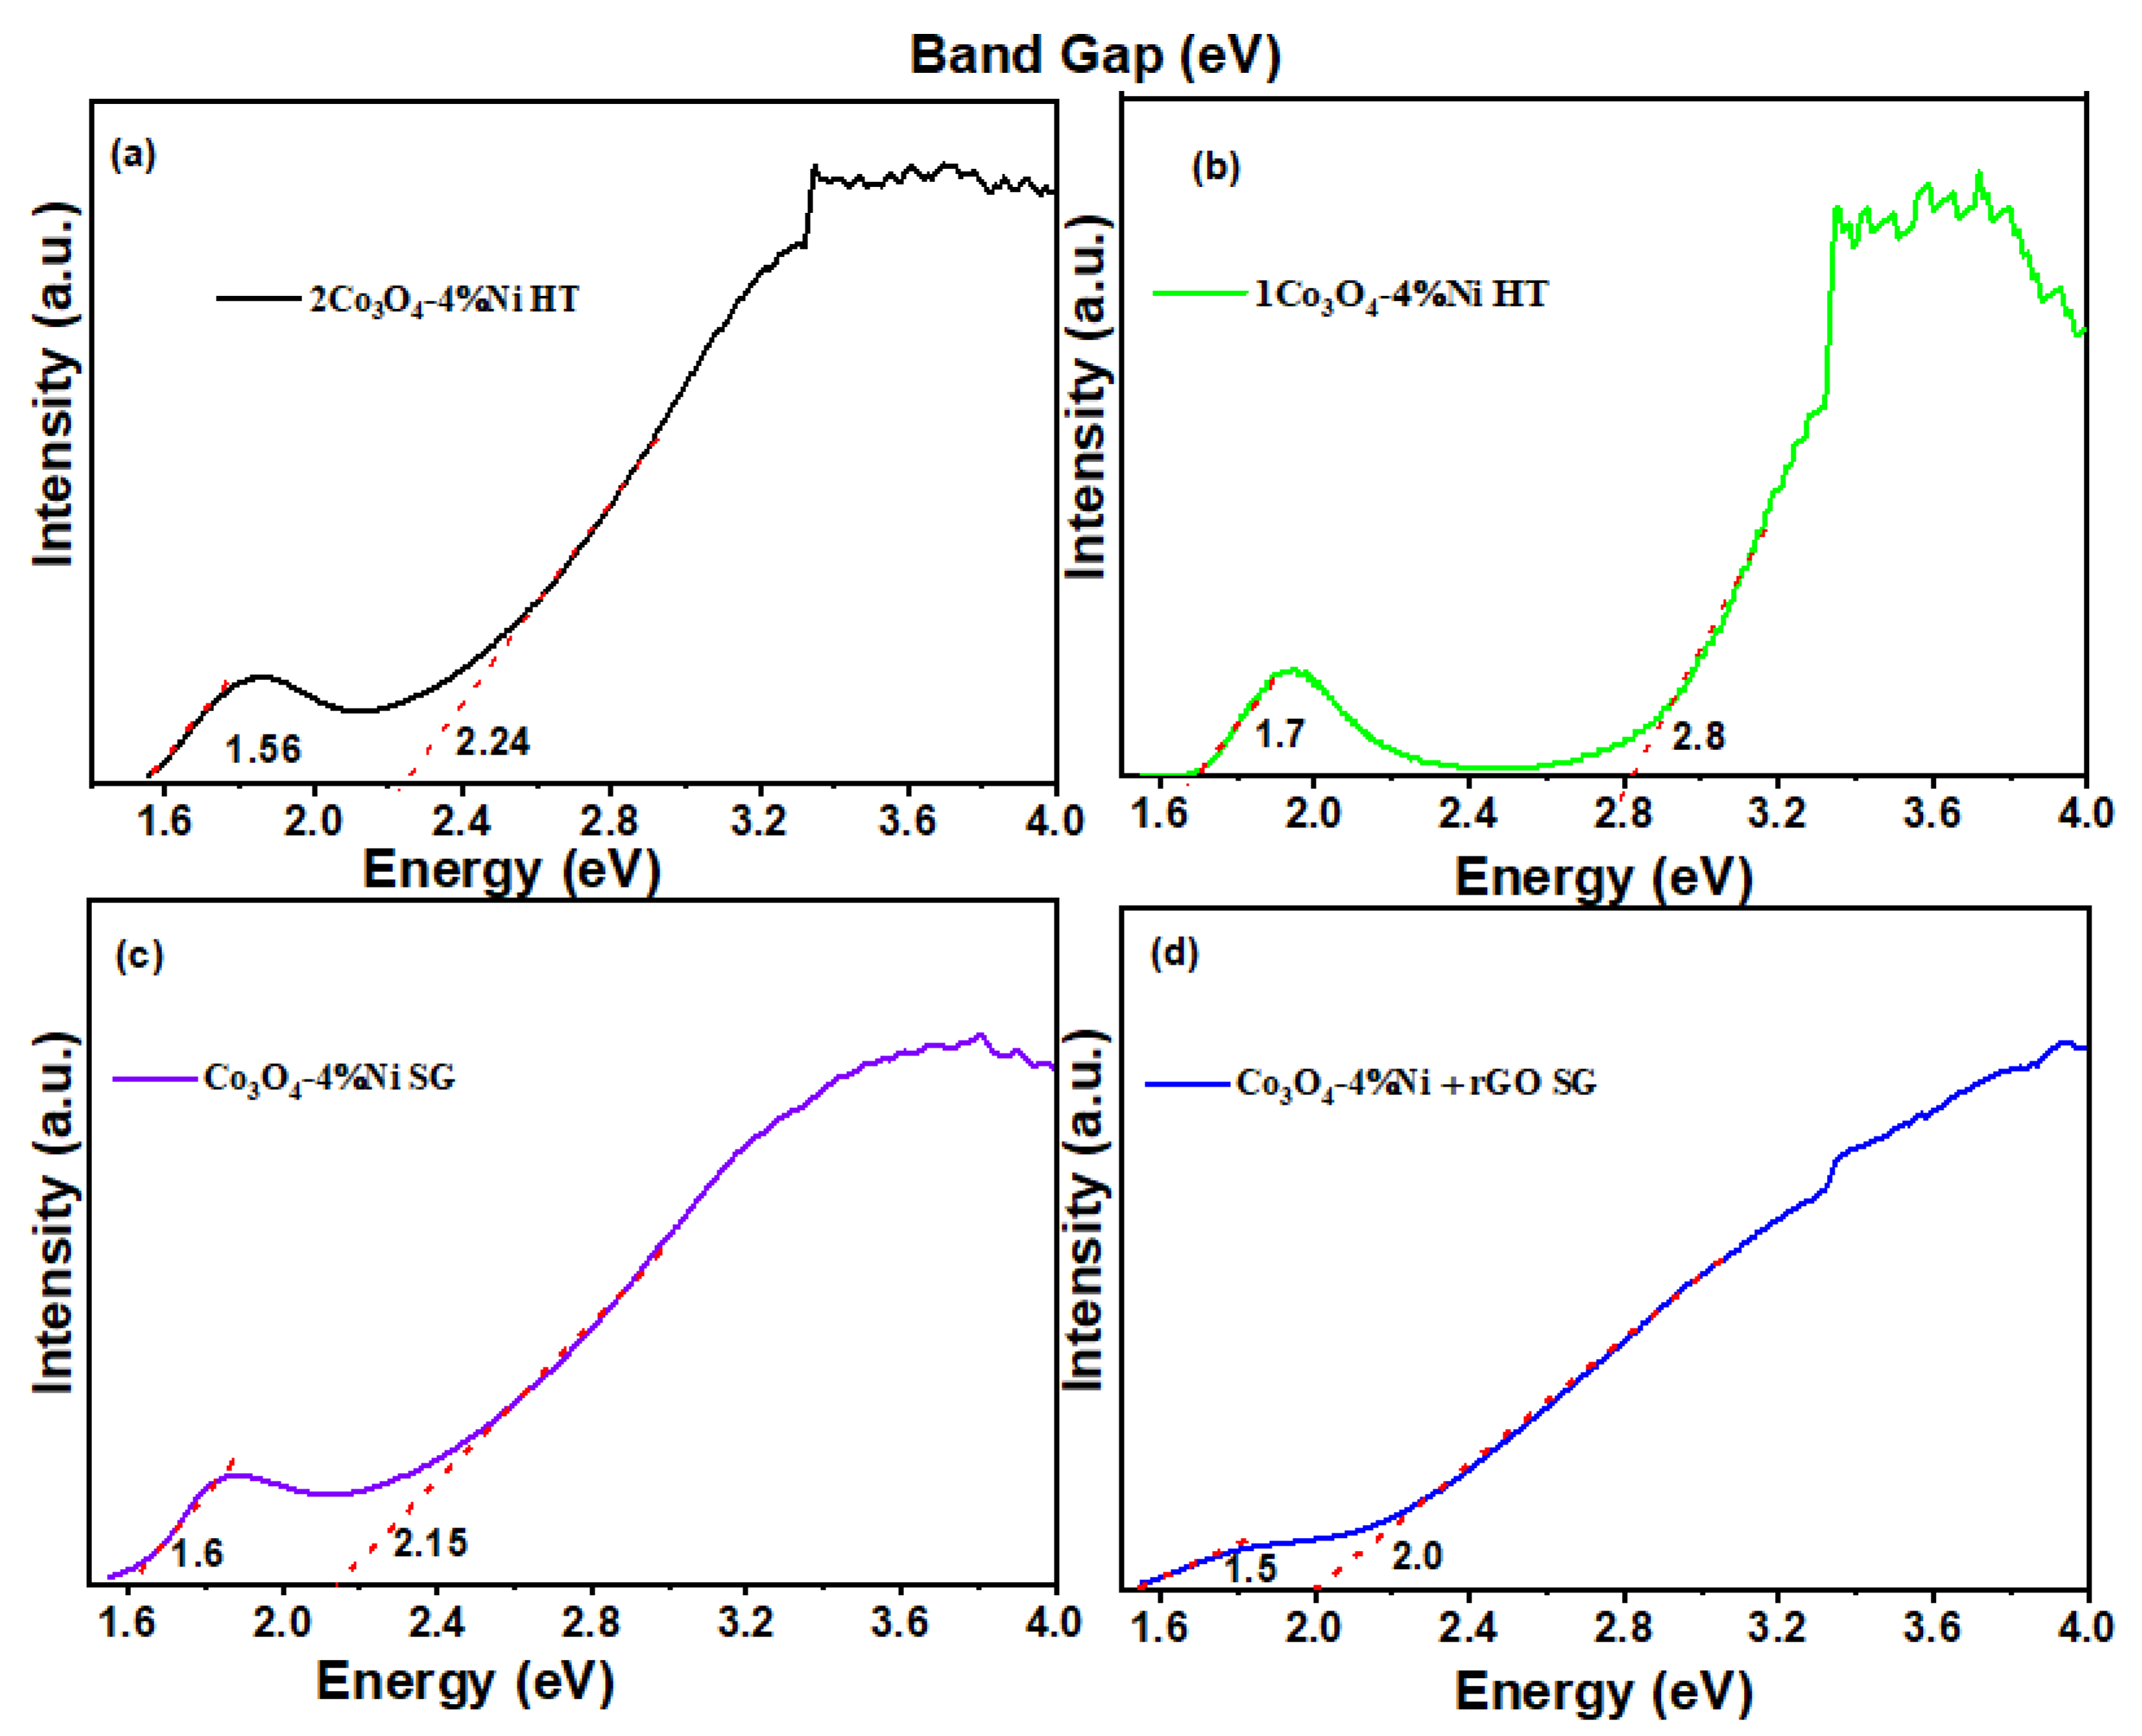
2.1. Characterization of the Samples

Two synthesis methods were carried out for this research: sol–gel and hydrothermal (two routes). The best samples were chosen for the application of catalyst and bactericide tests. The characterized samples were sintered by sol–gel (SG) and two variations in the hydrothermal synthesis route (HT). Here, the samples at 0%, 1%, and 4% nickel were characterized, plus the addition of reduced graphene oxide for the 4% samples, as shown in Figure 1.
A powder X-ray diffraction study was performed to investigate the structural and phase purity of Co3O4, Co3O4-4%Ni SG, Co3O4-4%Ni+rGO SG, Co3O4-1%Ni HT, 1-Co3O4-4%Ni HT, 2-Co3O4-4%Ni HT, and Co3O4-4%Ni+rGO HT nanocrystals. Strong Bragg diffraction peaks were recorded at 18.9°, 31.3°, 36°, 38°, 45°, 55°, 59°, and 65°, which can be assigned to (111) diffraction, (220), (311), (222), (400), (422), (511) and (440) planes, respectively. According to Card No. # 74-2120, these diffraction peaks reveal the pure cubic structural Co3O4 nanocrystals. Figure 2 shows the X-ray diffractograms for three samples as an example since they all maintain the same phase. The peaks of the diffractograms correspond to the pure spinel structure. Figure 2a shows the sample synthesized by the sol–gel method with 4% nickel addition. Figure 2b is the diffractogram for the Co3O4 sample with 4% nickel, and Figure 2c is the diffractogram of the Co3O4-4%Ni+rGO HT sample.
Figure 2 shows the X-ray diffraction patterns for Ni–Co3O4 prepared by hydrothermal and sol–gel routes followed by calcination at 400 °C. No secondary phases were observed in the diffraction pattern. However, with the addition of rGO, the planes are those of the pure spinel phase with a small broad baseline due to the addition of reduced graphene oxide, both for the sol–gel and hydrothermal methods, here it is presented as an example only the hydrothermal. The prominent XRD peak at 36° corresponds to the (311) plane, and the maximum intensity has decreased with the addition of rGO, decreasing the crystallinity.
We use the FESEM measurements in Figure 3 as a morphological tool to study the crystalline form, the growth, and the grain limit. In the sol–gel method, without and with the addition of rGO, no use (Figure 3a) Co3O4-4%Ni SG, and (Figure 3b) Co3O4-4%Ni+rGO SG, no significant changes are observed. However, a small agglomeration occurs in the nanoparticles. In (Figure 3c), Co3O4-4%Ni HT (Method 1), and (Figure 3e), Co3O4-4%Ni+rGO HT, we have the morphology of the nanoparticles, respectively, by the hydrothermal method with and without the addition of rGO, respectively. In (Figure 3c), without adding rGO, larger spherical-shaped particles are observed compared to the sol–gel method.
Nevertheless, for this sample with the addition of rGO, the particle size is similar to the sol–gel method. This indicates that adding rGO prevents agglomerates and agrees with the literature [3]. In (Figure 3d), Co3O4-4%Ni HT (Method 2), another sample is observed with the hydrothermal method 2; self-aggregating sticks with small spheres around them are observed. As can be seen, the morphological diversity changes depending on the synthesis process.
In the TEM measurements in Figure 4, it is observed that the nanoparticles are more agglomerated (Figure 4c,d) without adding rGO for the synthesis methods used in this investigation. However, in (Figure 4g,h), the addition of rGO plays an essential role in the dispersion of the agglutinated groups in many fine nanoparticles, avoiding excessive aggregation and volume expansion. This makes rGO favor a larger specific material area, providing more reactive sites. As a result, smaller nanoparticles are observed in the hydrothermal method (Figure 4c) compared to those obtained by the sol–gel method (Figure 4d). Figure 4g,h show the samples obtained by the hydrothermal and sol–gel methods with the rGO addition. However, as can be seen, the agglutination or particle size for the hydrothermal method did not change significantly (Figure 4g).
On the contrary, for the sol–gel method, the material agglutination decreased, observing smaller dispersed nanoparticles and forming a chrysanthemum-like flower. Herein, this form in the dispersion of the nanoparticles stimulates the increase in specific surface area. Due to the increased surface area, this structural arrangement and decreased agglutination of the nanoparticles is expected to be the most effective sample in bactericidal and photocatalytic applications. In addition, the TEM method is carried out to obtain a more detailed analysis of the microstructure and size of the Co3O4-4%Ni+rGO SG compound. The TEM compound images show that the Co3O4 nanoparticles were deposited on the rGO surface. Thus, it can be said that the rGO successfully combined with the Co3O4 system. These measures are in agreement with the FESEM results. Figure 4a,b,e,f show the lattice fringes of 0.285 nm, 0.458 nm, 0.230 nm, and 0.188 nm, corresponding to the Co3O4 crystal planes (220), (111), (311) and (331), respectively, which is consistent with the XRD results [10].
The FTIR analysis (Figure 5a) shows in all spectrums the stretching vibrations of the metal–oxygen bond. The spinel Co3O4 formation oxide is verified by two typical vibrations referred to as Co3+ in the octahedral hole (652 cm−1) and Co2+ vibration localized in tetrahedral position (538 cm−1) [12]. The rGO presence was more evidenced only in the sol–gel method assigned to the vibration localized between 1148 and 1068 cm−1, and attributed to the Co-O bonds [13]. From the BET measurements (Figure 5b), the surface area of the samples was obtained by the 4% Ni sol–gel method, with and without rGO, thus giving values of (6.5 ± 0.9) m2/g for the Co3O4-4%Ni SG sample and (50.5 ± 0.9) m2/g for the Co3O4-4%Ni+rGO SG sample. These results indicate that the addition of rGO to the samples increases their surface area [14].
Figure 6 shows the bandgap energy of samples Figure 6a, Co3O4-4%Ni HT, Figure 6b, 1Co3O4-4%Ni HT, Figure 6c, Co3O4-4%Ni SG, and Figure 6d, Co3O4-4%Ni+rGO SG, from the linear part extrapolation. The spinel structure of Co3O4 is known to be a direct bandgap material. Optical absorption studies show two direct band gaps in Co3O4, the main and the sub-band energy gap. On the other hand, the two direct Co3O4 optical bands are attributed to the Co excitation in its two valence states, 2+ and 3+. The valence band has a strong O(2p) character, while the main contribution to the conduction band comes from the Co2+ 3d orbital. The presence of Co3+ cations gives rise to a sub-band inside the energy gap [15].
The first band gap corresponds to O2− to Co3+; therefore, the second band gap is the energy gap corresponding to the transitions between bands [15]. In Figure 6, the values obtained from the first band gap energy or sub-band are 1.56 eV,1.7 eV,1.6 eV and 1.5 eV, respectively. The second or true band gap energy values obtained from the samples are 2.24 eV, 2.8 eV, 2.15 eV, and 2.0 eV. Figure 6a,b correspond to the two routes of hydrothermal synthesis, thus obtaining a band gap energy lower for the sample 2Co3O4-4%Ni HT. However, for the sol–gel method, the forbidden energy gap decreases even more compared to the previous samples, being much lower for the sol–gel sample with the rGO addition (Co3O4-4%Ni+rGO SG).
The higher band gap is assigned to the O2– → Co2+ charge transfer process, basic optical band gap energy (valence-to-conduction band excitation). The lower band gap is ascribed to the O2− → Co3+ charge transfer process (located below the conduction band). The presence of Co3+ centers in Co3O4 produces a sub-band located inside the energy gap. According to the literature [16,17,18] the band edge positions of the photocatalysts can be calculated according to the Mulliken electronegativity. The conduction band (CB) and valence band (VB) potentials of the samples can be calculated using the following equations:
EVB = X − Ec + ½ Eg
ECB = EVB − Eg
Here, Ec is the energy of free electrons on the hydrogen scale (~4.5 eV), Eg is the band gap energy of the photocatalyst (2.24, 2.8, 2.15 and 2.0 eV), X is ~5.903 eV for Co3O4 is defined as the geometric mean of the absolute electronegativity of the constituent atom. The VB and CB values were calculated from the energy Eg (Figure 6) and electronegativity as ~5.903 eV, being 2.40 eV and 0.40 eV, respectively (Table 1).

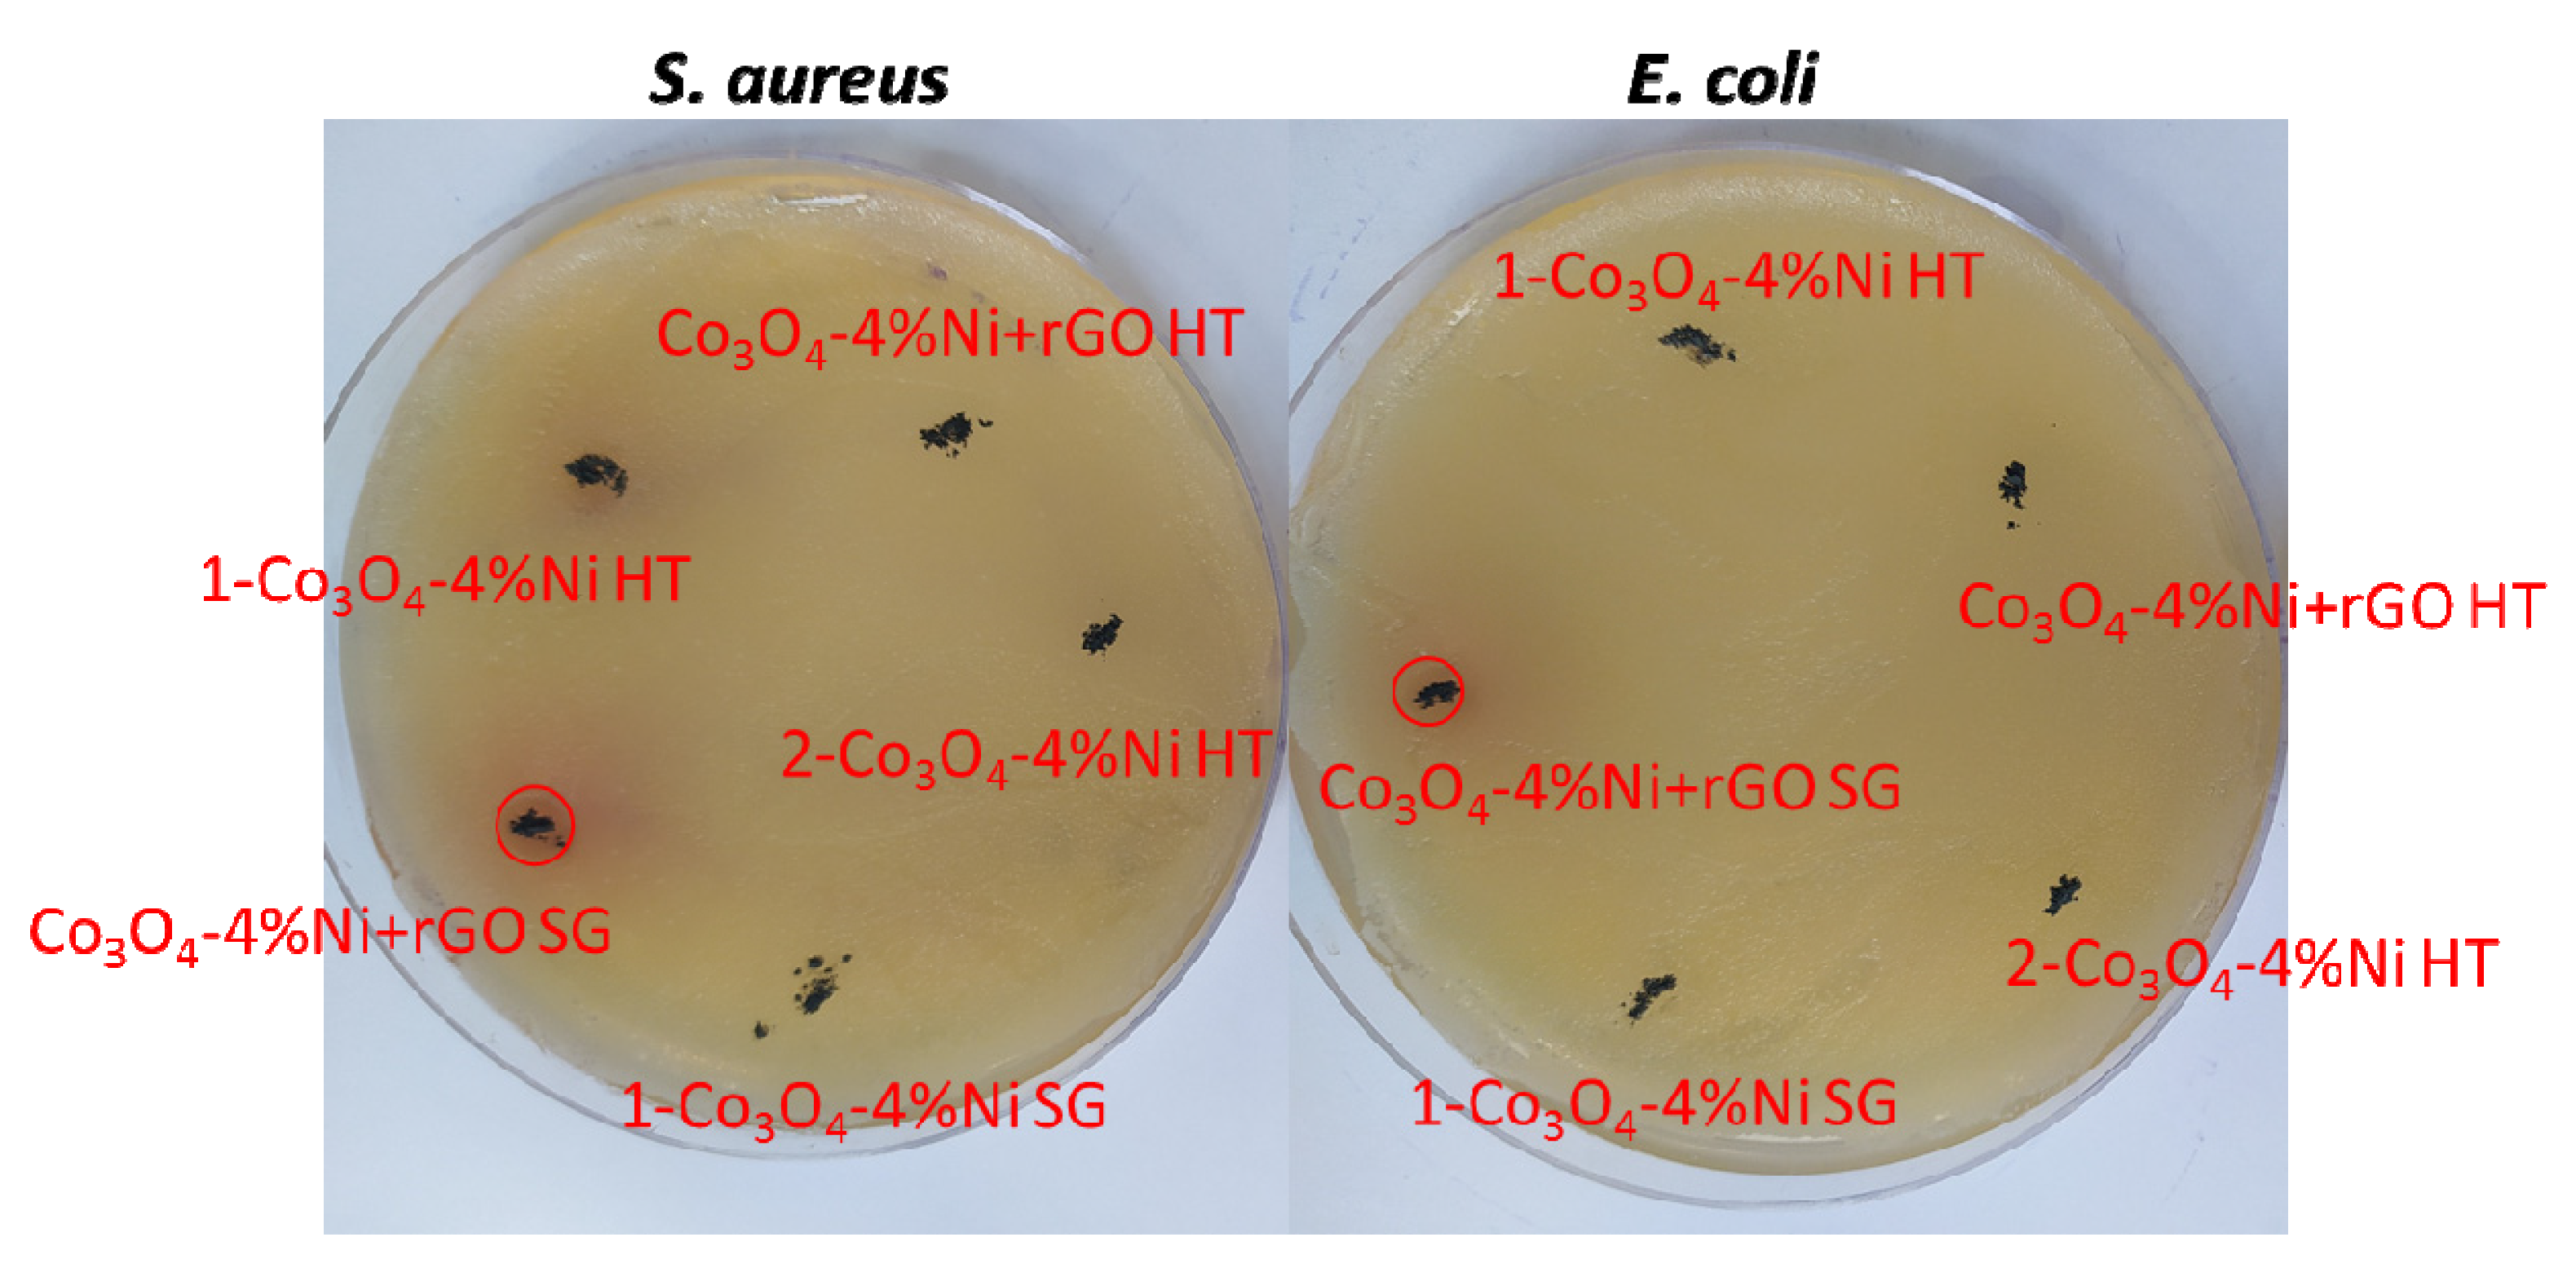
2.2. Antibacterial Activity

Antimicrobial activity was verified from the inhibitory halo appearance, as shown in Figure 7. From the images, it is possible to confirm that only the nanocomposite Ni-doped Co3O4 in the rGO presence obtained by the sol–gel method (Co3O4-4%Ni+rGO SG) showed inhibition capacity for both microorganisms. However, Co3O4-4%Ni+rGO SG showed more excellent antimicrobial activity for the microorganism S. aureus (Gram-positive), with an inhibition halo value of 0.72 mm (Table 2), higher than that observed for E. coli (Gram-negative), 0.47 mm, see Table 2. This better performance is attributed to structural differences in the S. aureus cell membrane, which has a thicker peptidoglycan layer without an external cell wall that reduces the permeability of the antimicrobial into the [19] bacterium. In addition, recent studies have demonstrated that the rGO presence in composites with oxides allowed the gain or increase in the intensity of the antimicrobial properties [20].
Such effects can be attributed to the more excellent stability of the particles, minimizing their aggregation, and the more excellent diffusion [21]. The antimicrobial activity of rGO has been attributed to two main factors: the possibility of oxidative stress and the changes in membrane properties. In this way, it favors the loss of vital activities for cellular structures, leading to death [22].

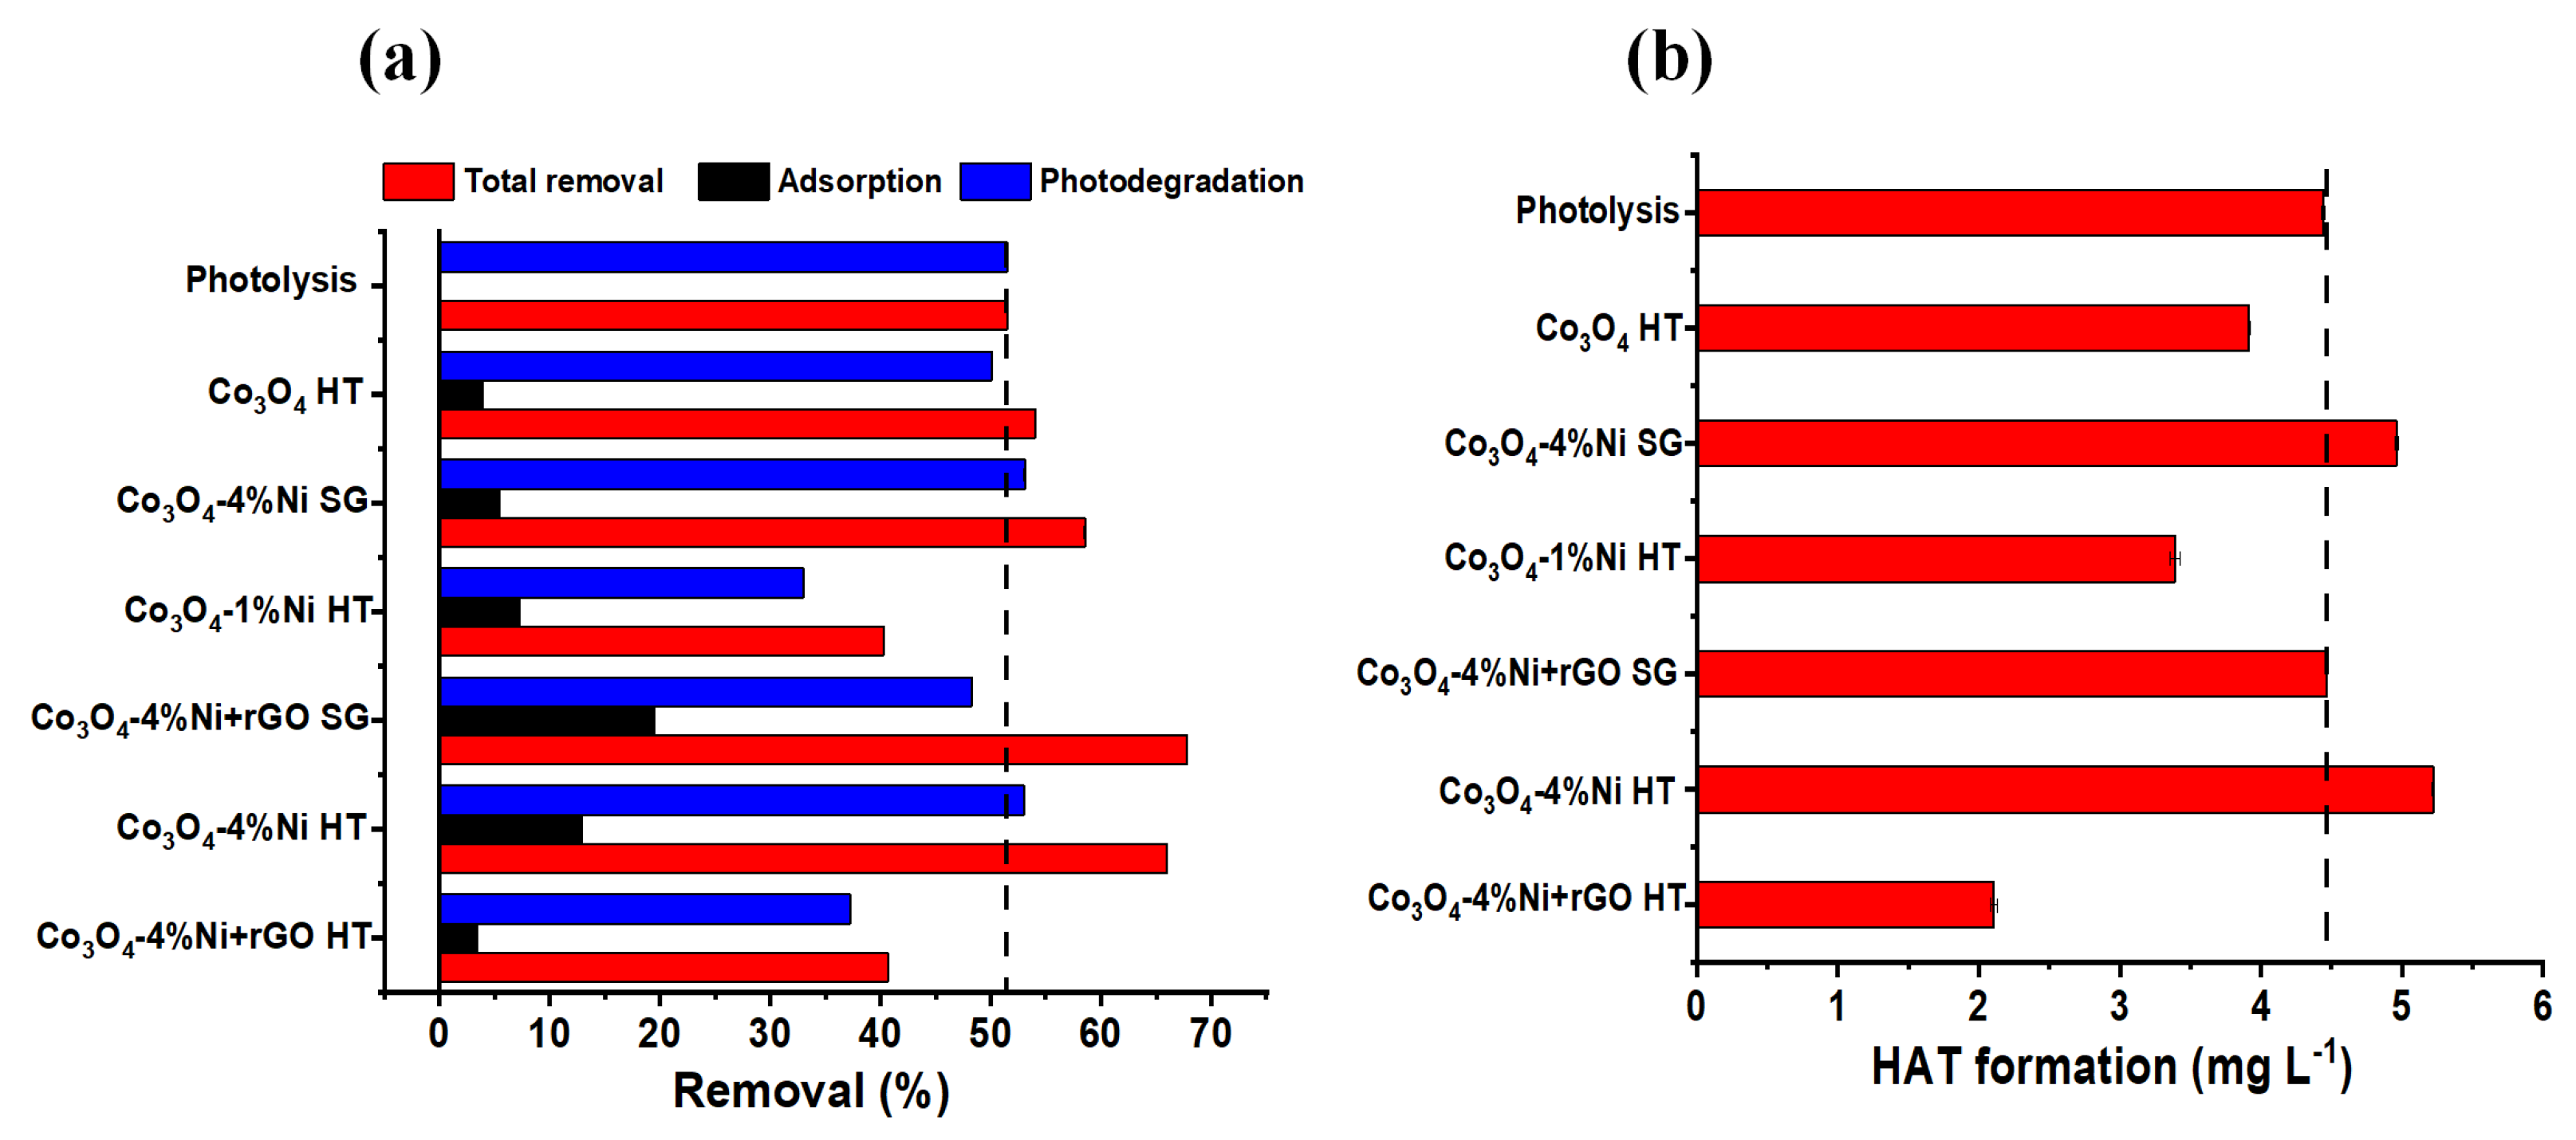
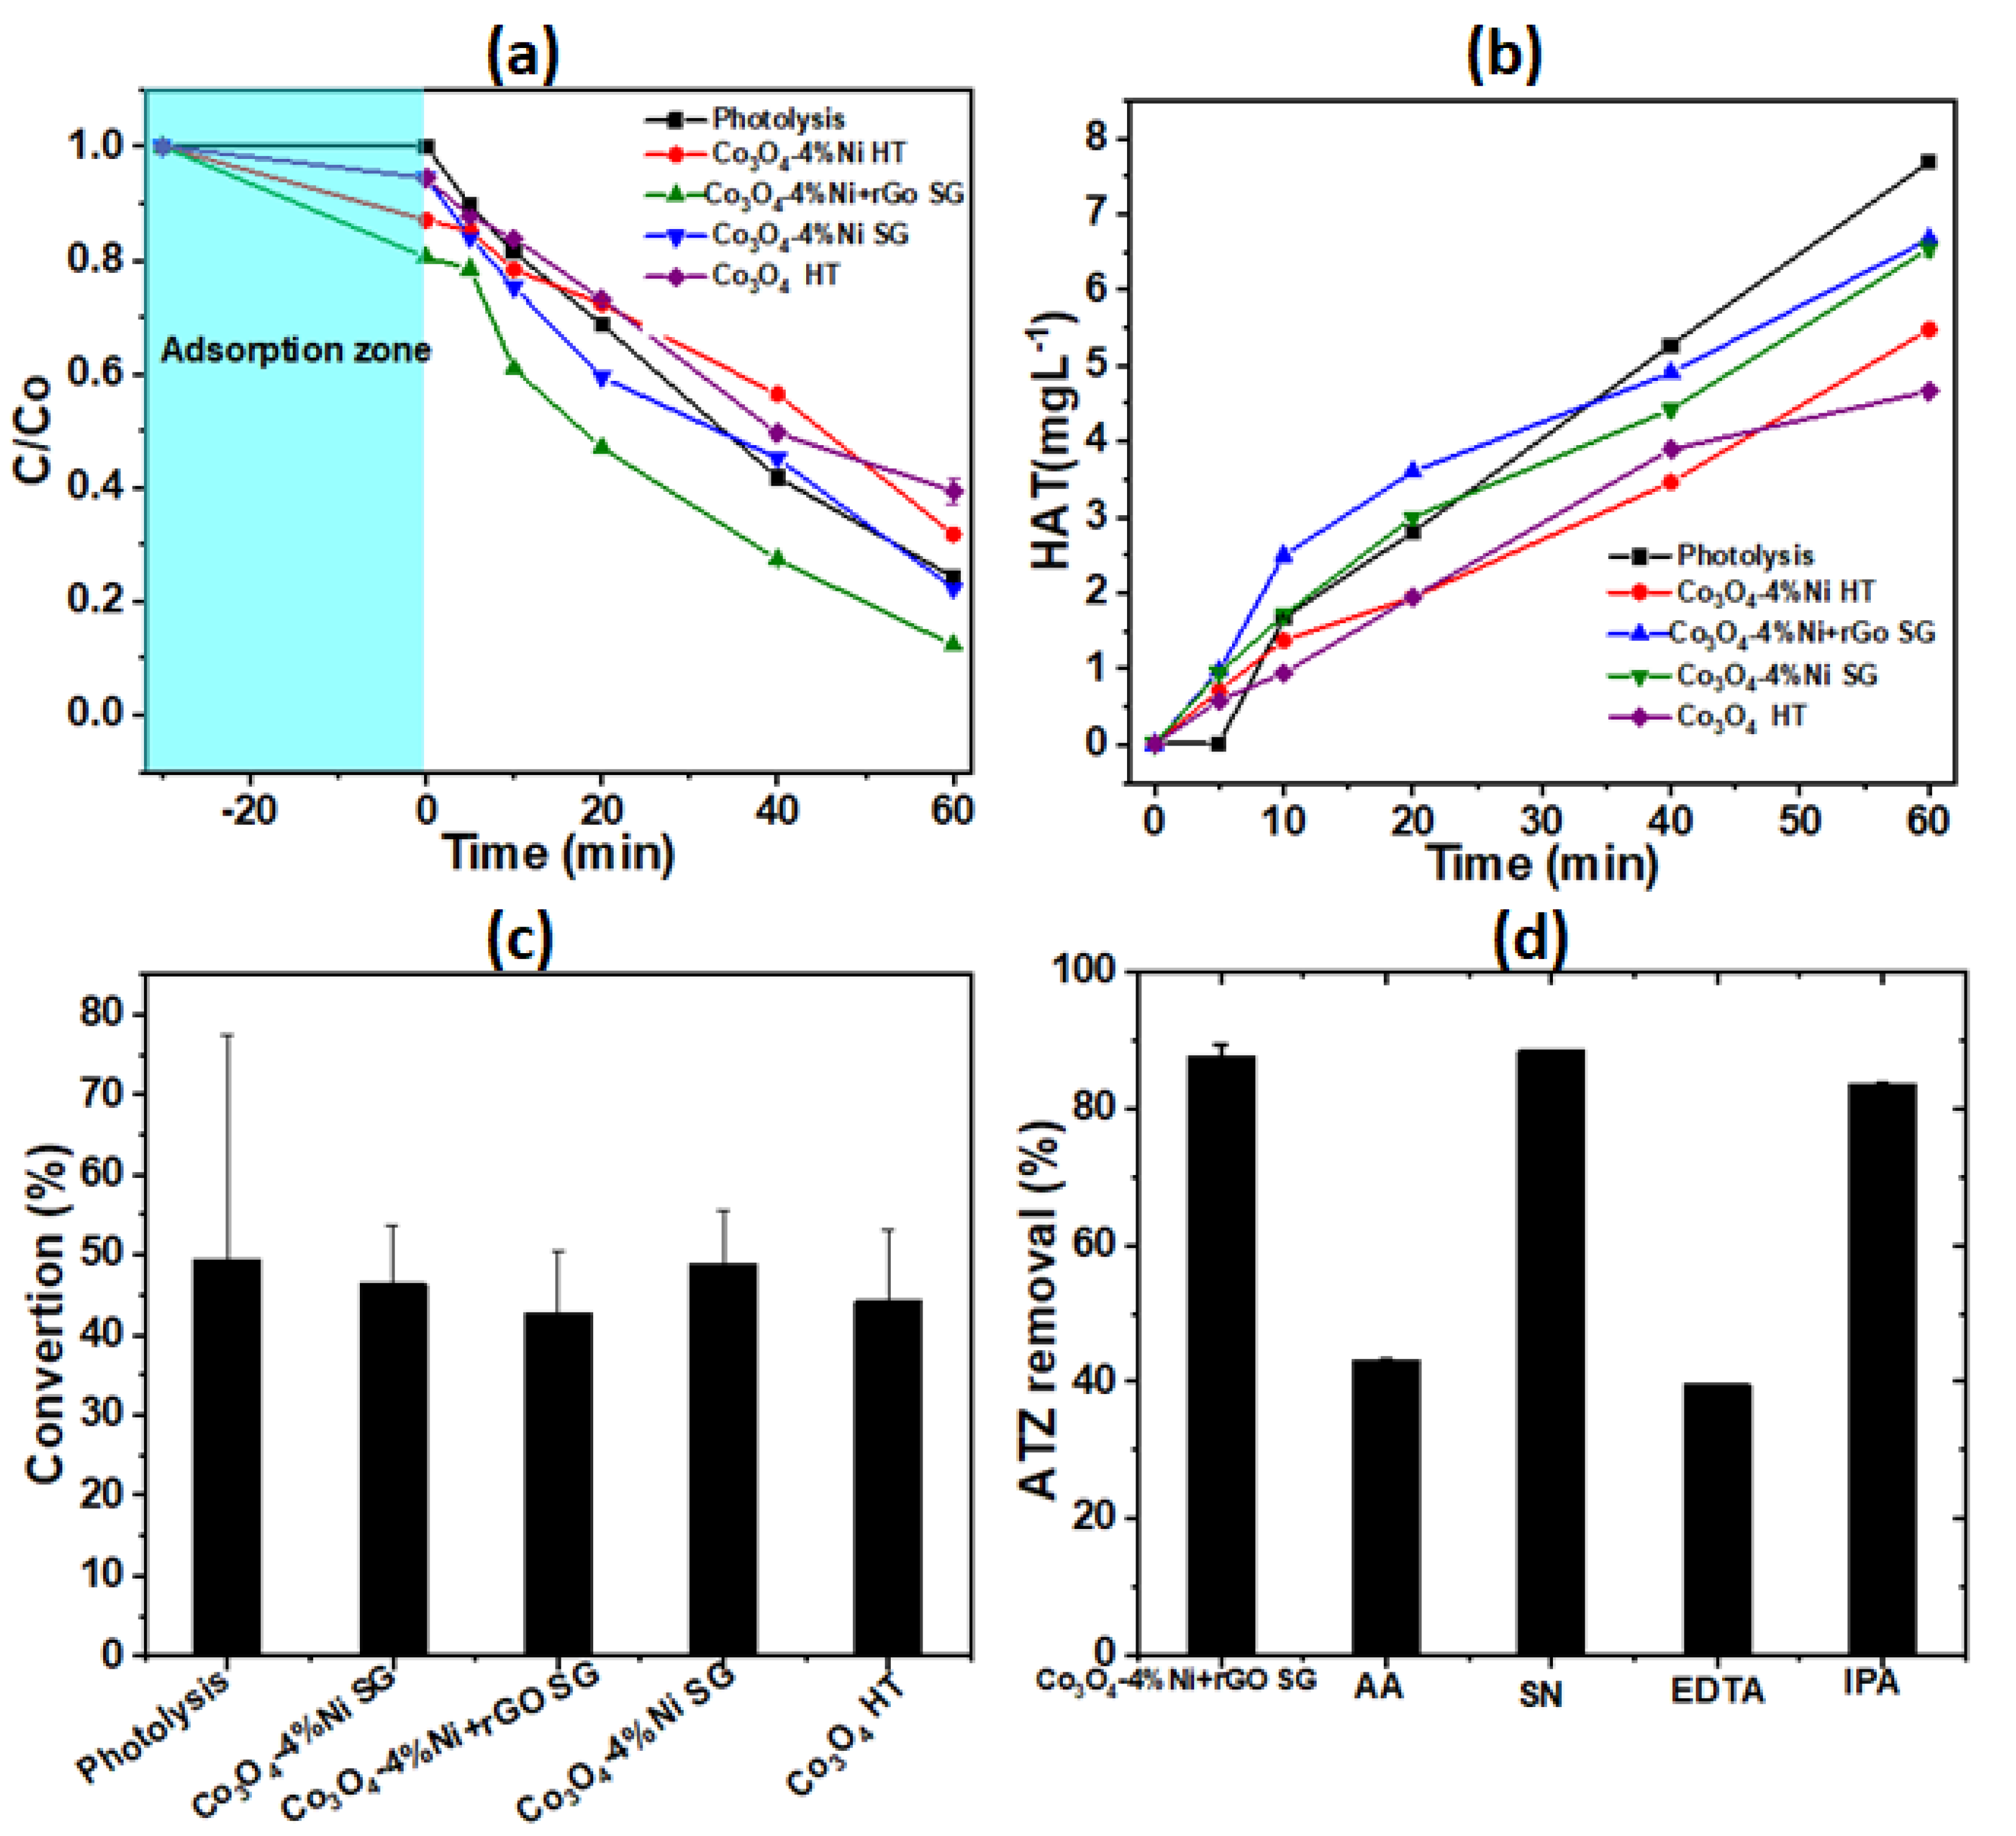
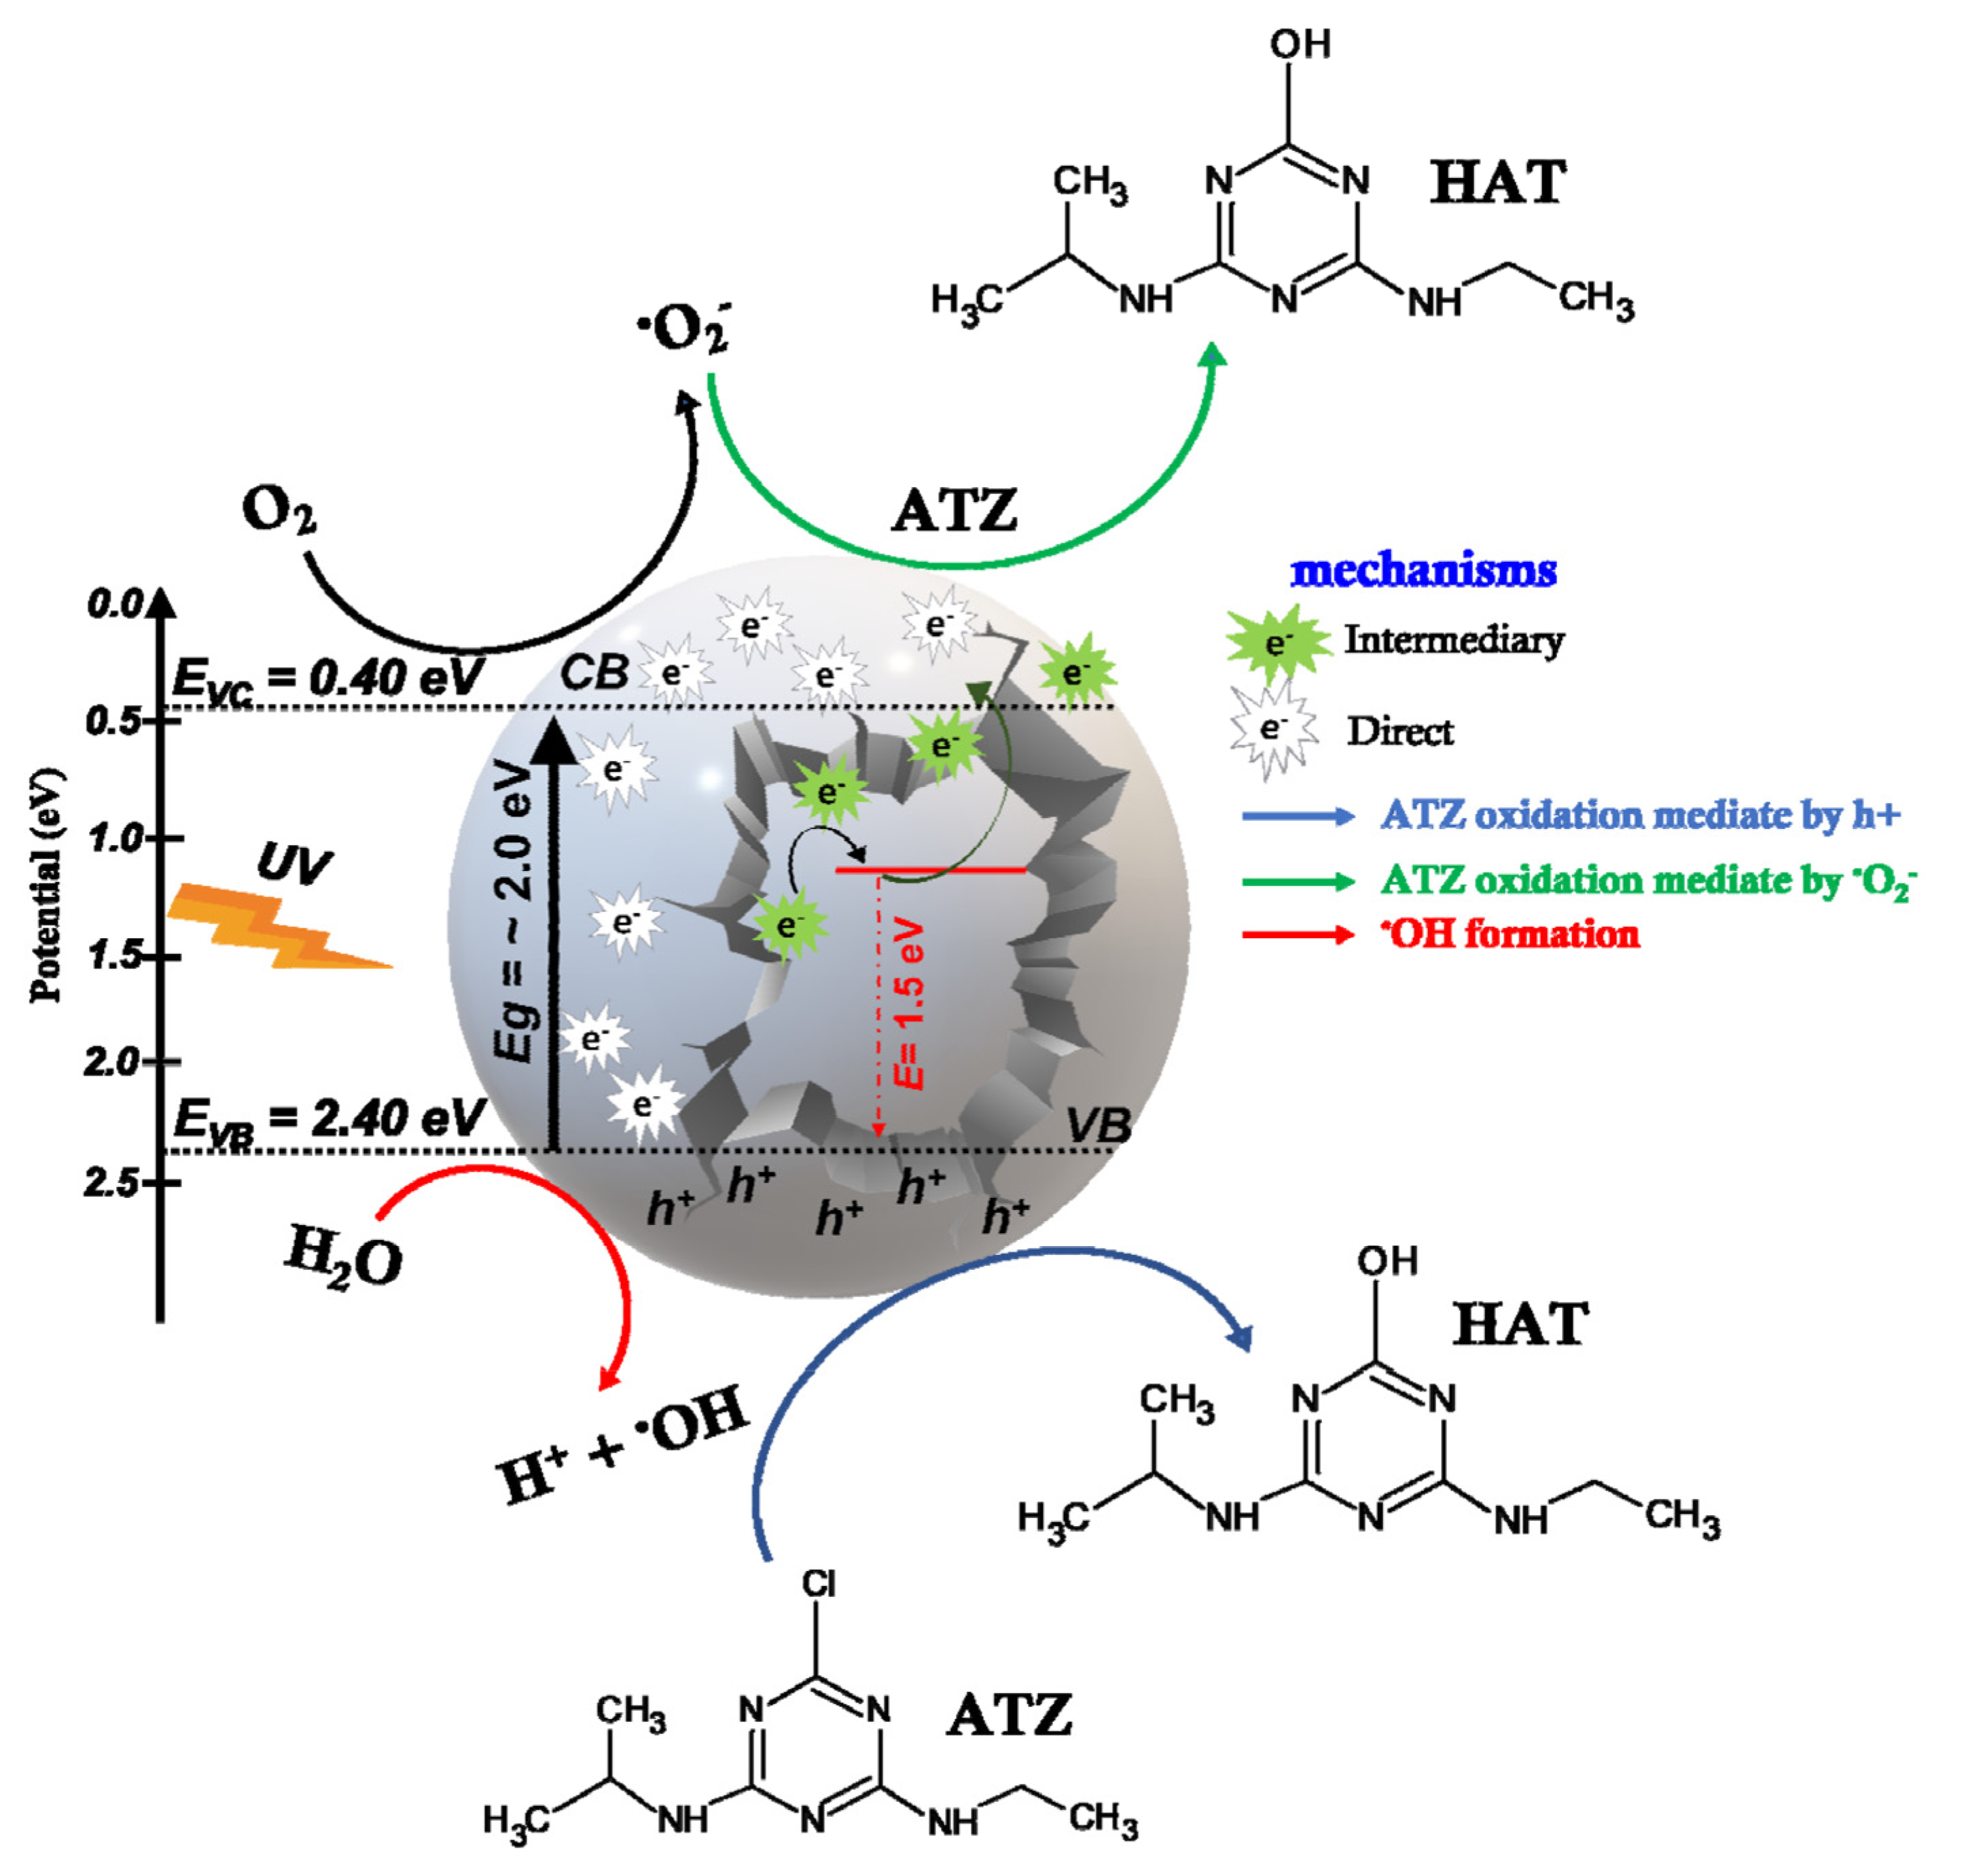
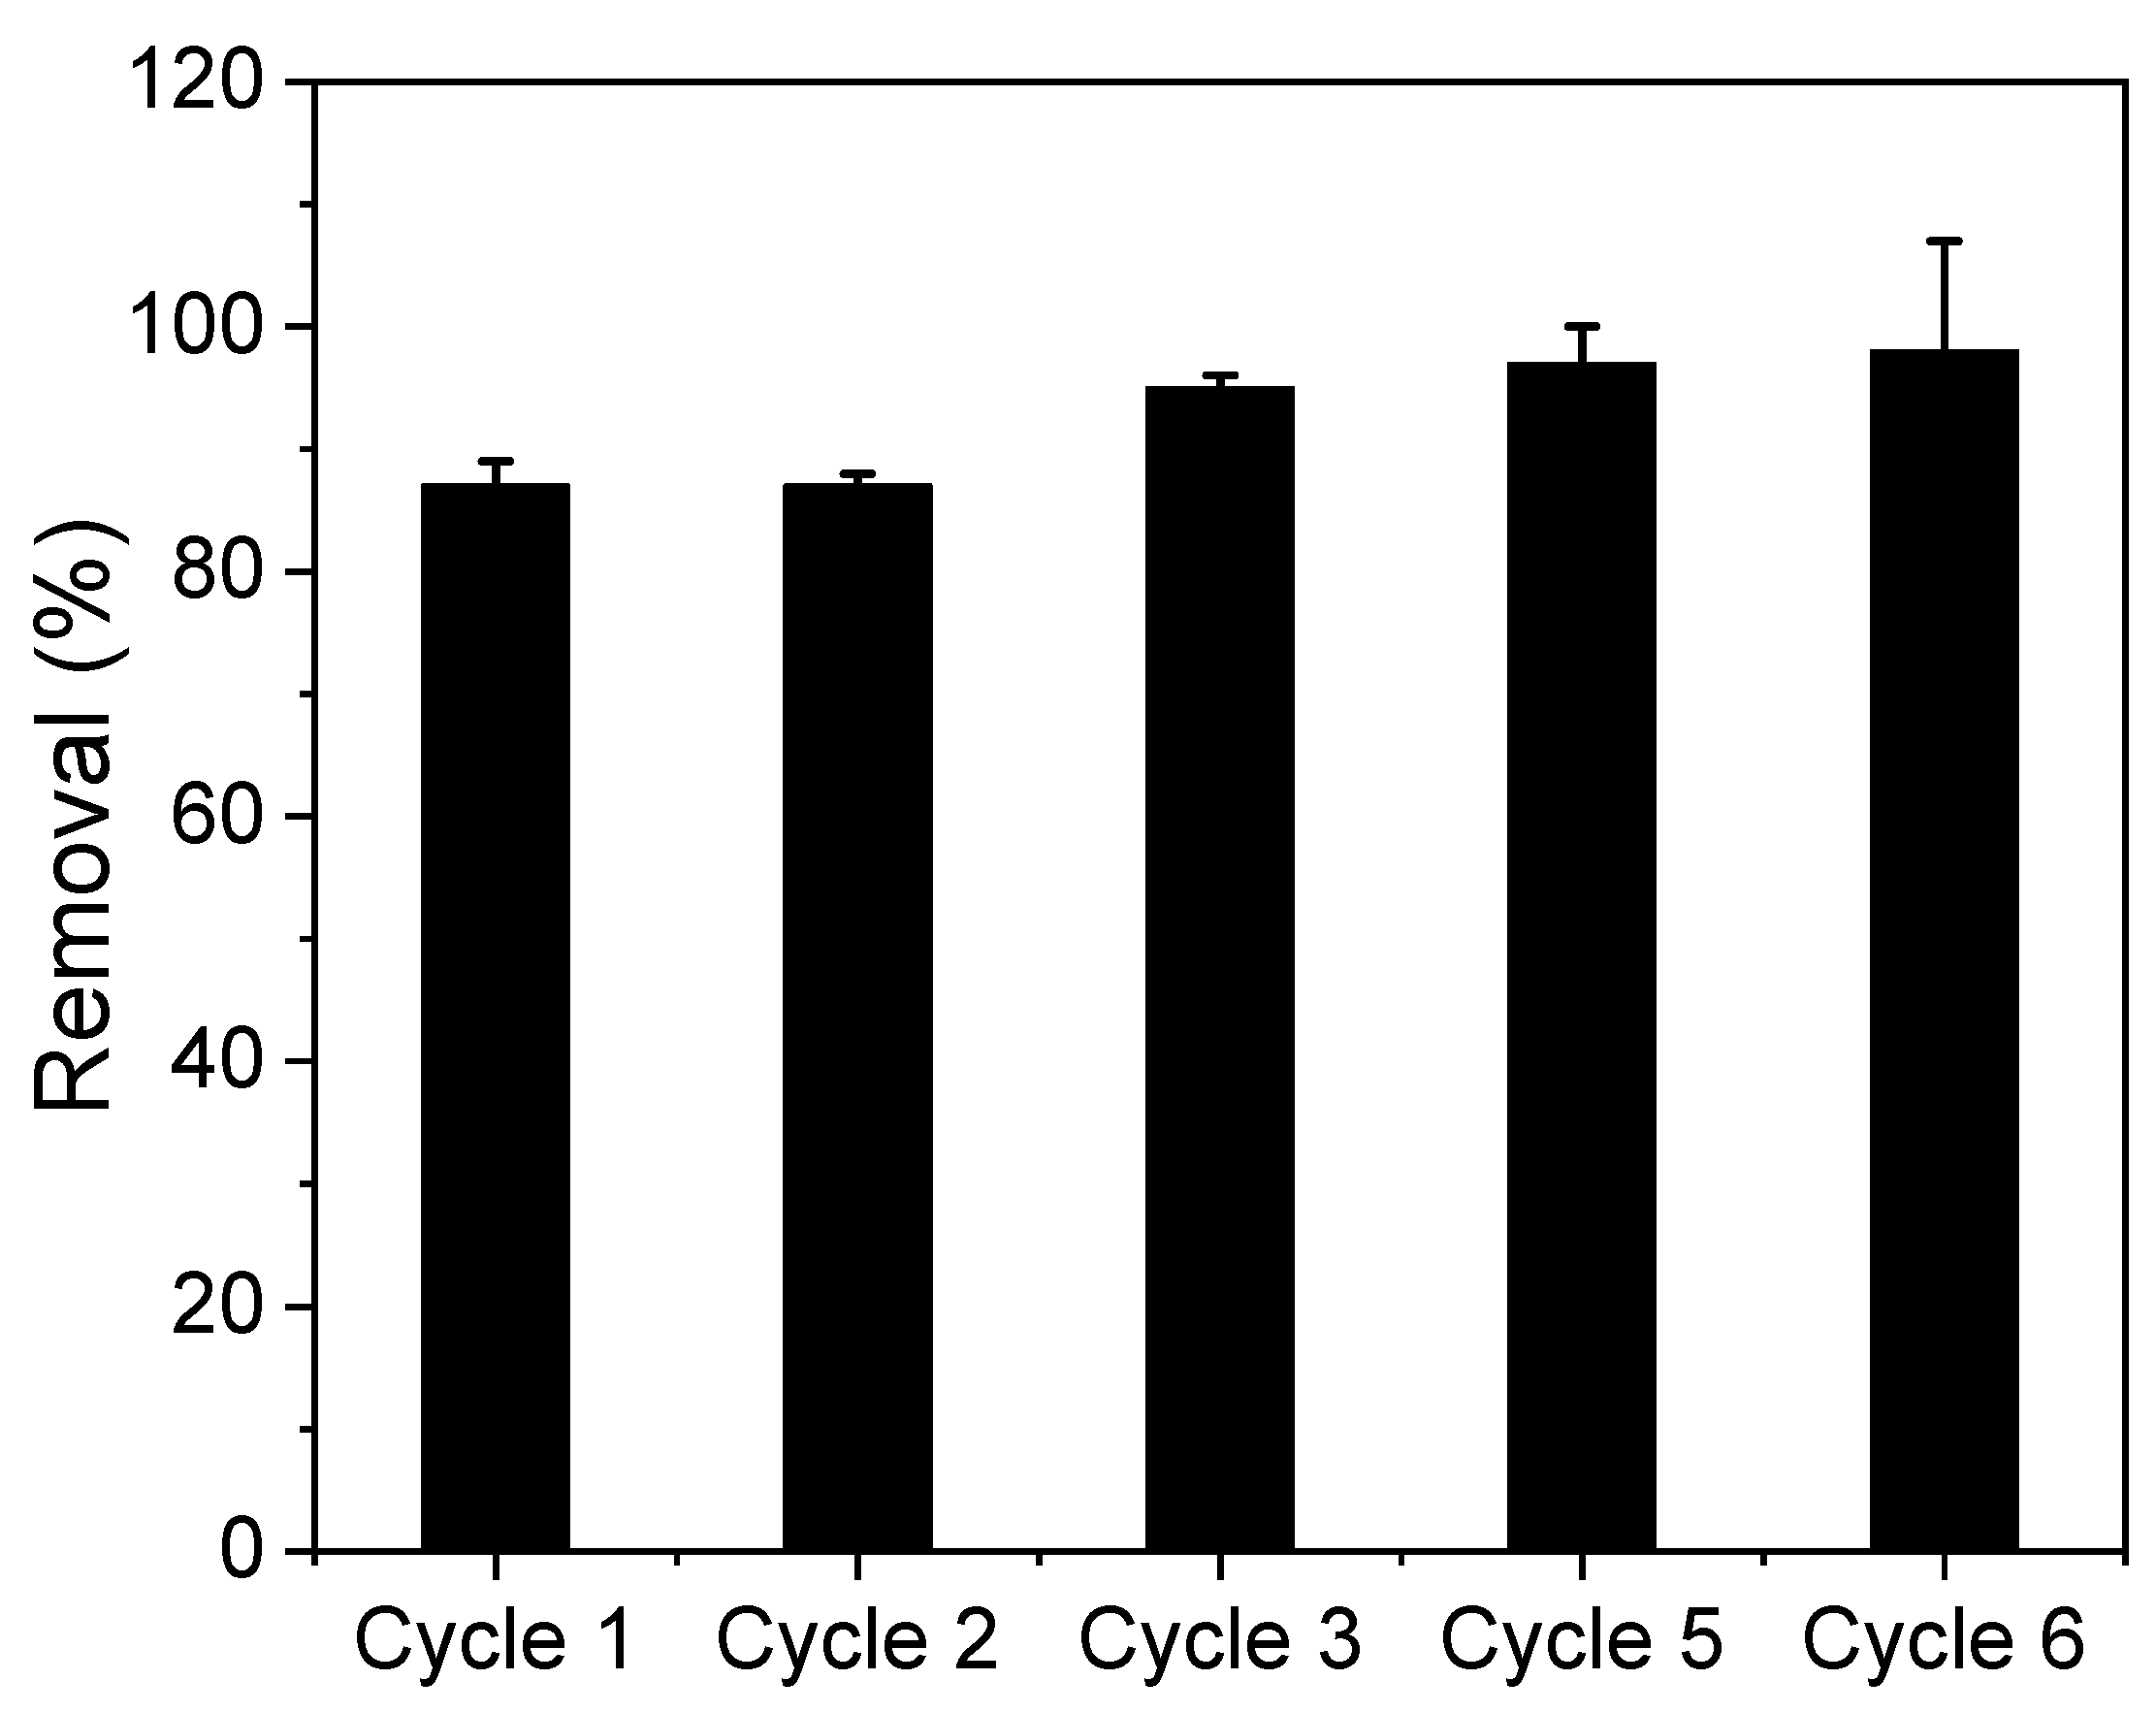
2.3. Photocatalytic Activity

Preliminarily, all the materials were tested from the photocatalytic degradation of the atrazine emerging pollutant under UV light irradiation. Figure 8a shows the contribution of adsorption and photodegradation processes in fixed times of 30 min each. Co3O4-4%Ni SG, Co3O4-4%Ni HT, and Co3O4-4%Ni+rGO SG achieved a total ATZ removal of 58, 66, and 68%, respectively, which represents an improvement of up to 17% compared to the 51% removal observed for photolysis in 30 min. When separating the adsorption contribution, the photocatalytic degradation reached the highest values for Co3O4-4%Ni SG and Co3O4-4%Ni HT (~53% for both), showing that adsorption represents an essential contribution to the ATZ removal as can be verified for other emerging contaminants [23,24], due to more molecule–catalyst interactions near the surface of the material. Figure 8b shows the concentration of the byproduct HAT formed by dehalogenation followed by hydroxylation of the ATZ halogenated carbon [25]. As HAT was the only by-product formed from ATZ degradation, the highest concentrations of HAT observed in the presence of Co3O4-4%Ni SG and Co3O4-4%Ni HT corroborated the highest rate of ATZ degradation. However, the concentration of HAT found in the presence of Co3O4-4%Ni+rGO SG was equivalent to the concentration observed for photolysis, suggesting that the adsorbed ATZ on the catalyst was degraded to form the same amount of HAT in both processes. Furthermore, the HAT concentration obtained in Co3O4-4%Ni+rGO SG presence was 13% higher than that obtained in Co3O4 HT presence, even the latest reaching a higher ATZ photodegradation obtained for Co3O4-4%Ni+rGO SG. These results confirm that Co3O4-4%Ni+rGO SG achieves a higher total removal of ATZ due to the synergistic contribution of adsorption and photocatalysis processes to promote ATZ degradation and HAT formation efficiently.
Based on preliminary studies and the major rate of ATZ removal, the photocatalysts Co3O4 HT, Co3O4-4%Ni SG, Co3O4-4%Ni HT, and Co3O4-4%Ni+rGO SG were chosen for the kinetic studies of ATZ degradation in up to 60 min. Figure 9a shows that removal of ATZ from different materials was more efficient for photocatalysis mediated by Co3O4-4%Ni+rGO SG, reaching a removal of 88% compared to the 76% removal verified for photolysis. The kinetic constant values (k = min−1) and their respective linear correlation coefficients (R2) were k = 2.38 × 10⁻² min−1/R2 = 0.992 for photolysis, k = 1.73 × 10⁻² min−1/R2 = 0.933 for CoNi_4_400, k = 3.22 × 10⁻² min−1/R2 = 0.989 for Co3O4-4%Ni+rGO SG, k = 2.29 × 10⁻² min−1/R2 = 0.959 for Co3O4-4%Ni SG and k = 1.53 × 10⁻² min−1/R2 = 0.987 for Co3O4 HT. As can be observed, the ATZ degradation kinetic constant for Co3O4-4%Ni+rGO SG was 26% higher than the constant calculated for the photolysis, reinforcing the effectiveness of the photocatalyst in the ATZ degradation process. (Figure 9b) shows the concentration of HAT formed at each ATZ degradation time, proving that all photocatalytic processes can promote the conversion of ATZ to HAT in the first 5 min of reaction. However, this formation is not observed for the photolytic process, which requires a minimum time of 10 min to convert ATZ to HAT. These results show that the conversion of ATZ into HAT is due to hydrolysis of ATZ, which, in the presence of the materials, is catalyzed from the first time of degradation (5 min). The average conversion rates of ATZ in HAT were calculated for all degradation times, where the error values represent the variation of all values in the respective time. As can be observed in Figure 9c, the average conversion values of ATZ in HAT did not show significant differences between the different processes. However, the higher error bar found for the photolytic process is due to the low conversion of ATZ in HAT, and this process presents the first degradation times (up to 10 min). On the other hand, the minor errors found for the photocatalytic processes show that all the materials follow a similar ATZ degradation mechanism, resulting in conversion values of ATZ to HAT, with little variation throughout the process.
The ATZ degradation mechanisms also were investigated in the presence of scavengers for reactive oxygen species formed in the photocatalytic degradation stage. As shown in (Figure 9d), the presence of AA and EDTA prejudice the ATZ degradation. As AA is a scavenger for O2 and EDTA for h+, the ATZ degradation mechanism occurs by the formation of h+ in BV due to the excitation of e- for BC, which reacts with O2 nascent to form superoxide radicals. Additionally, the ATZ degradation in the presence was 4% lower than in the absence of IPA. This result shows that although it is not the main ATZ mechanism degradation, the OH formation in the system also partially contributes to the better efficiency of the photocatalytic process. In this way, the set of reactions 1 to 6 and Figure 10 present a proposal for the photocatalytic degradation mechanism of ATZ in the Co3O4-4%Ni+rGO SG presence.
Co3O4-4%Ni+rGO SG + hv → h+(VB) + e(CB)
e(CB) + O2O2
O2 + ATZ → HAT
h+(VB) + ATZ → HAT (main mechanism)
h+(VB) + H2O → H+ + e + OH [HAT (secondary mechanism)]
OH + ATZ → HAT
The stability of the materials against the photodegradation efficiency of ATZ for up to six application cycles of 60 min was shown in Figure 11. After six cycles, that is, 360 h of use, the Co3O4-4%Ni+rGO SG catalyst maintains its photoactivity to efficiently degrade ATZ. Therefore, in addition to being an efficient photocatalyst for ATZ degradation, recyclability highlights the sustainable use of the material in water treatment processes.

3. Materials and Methods
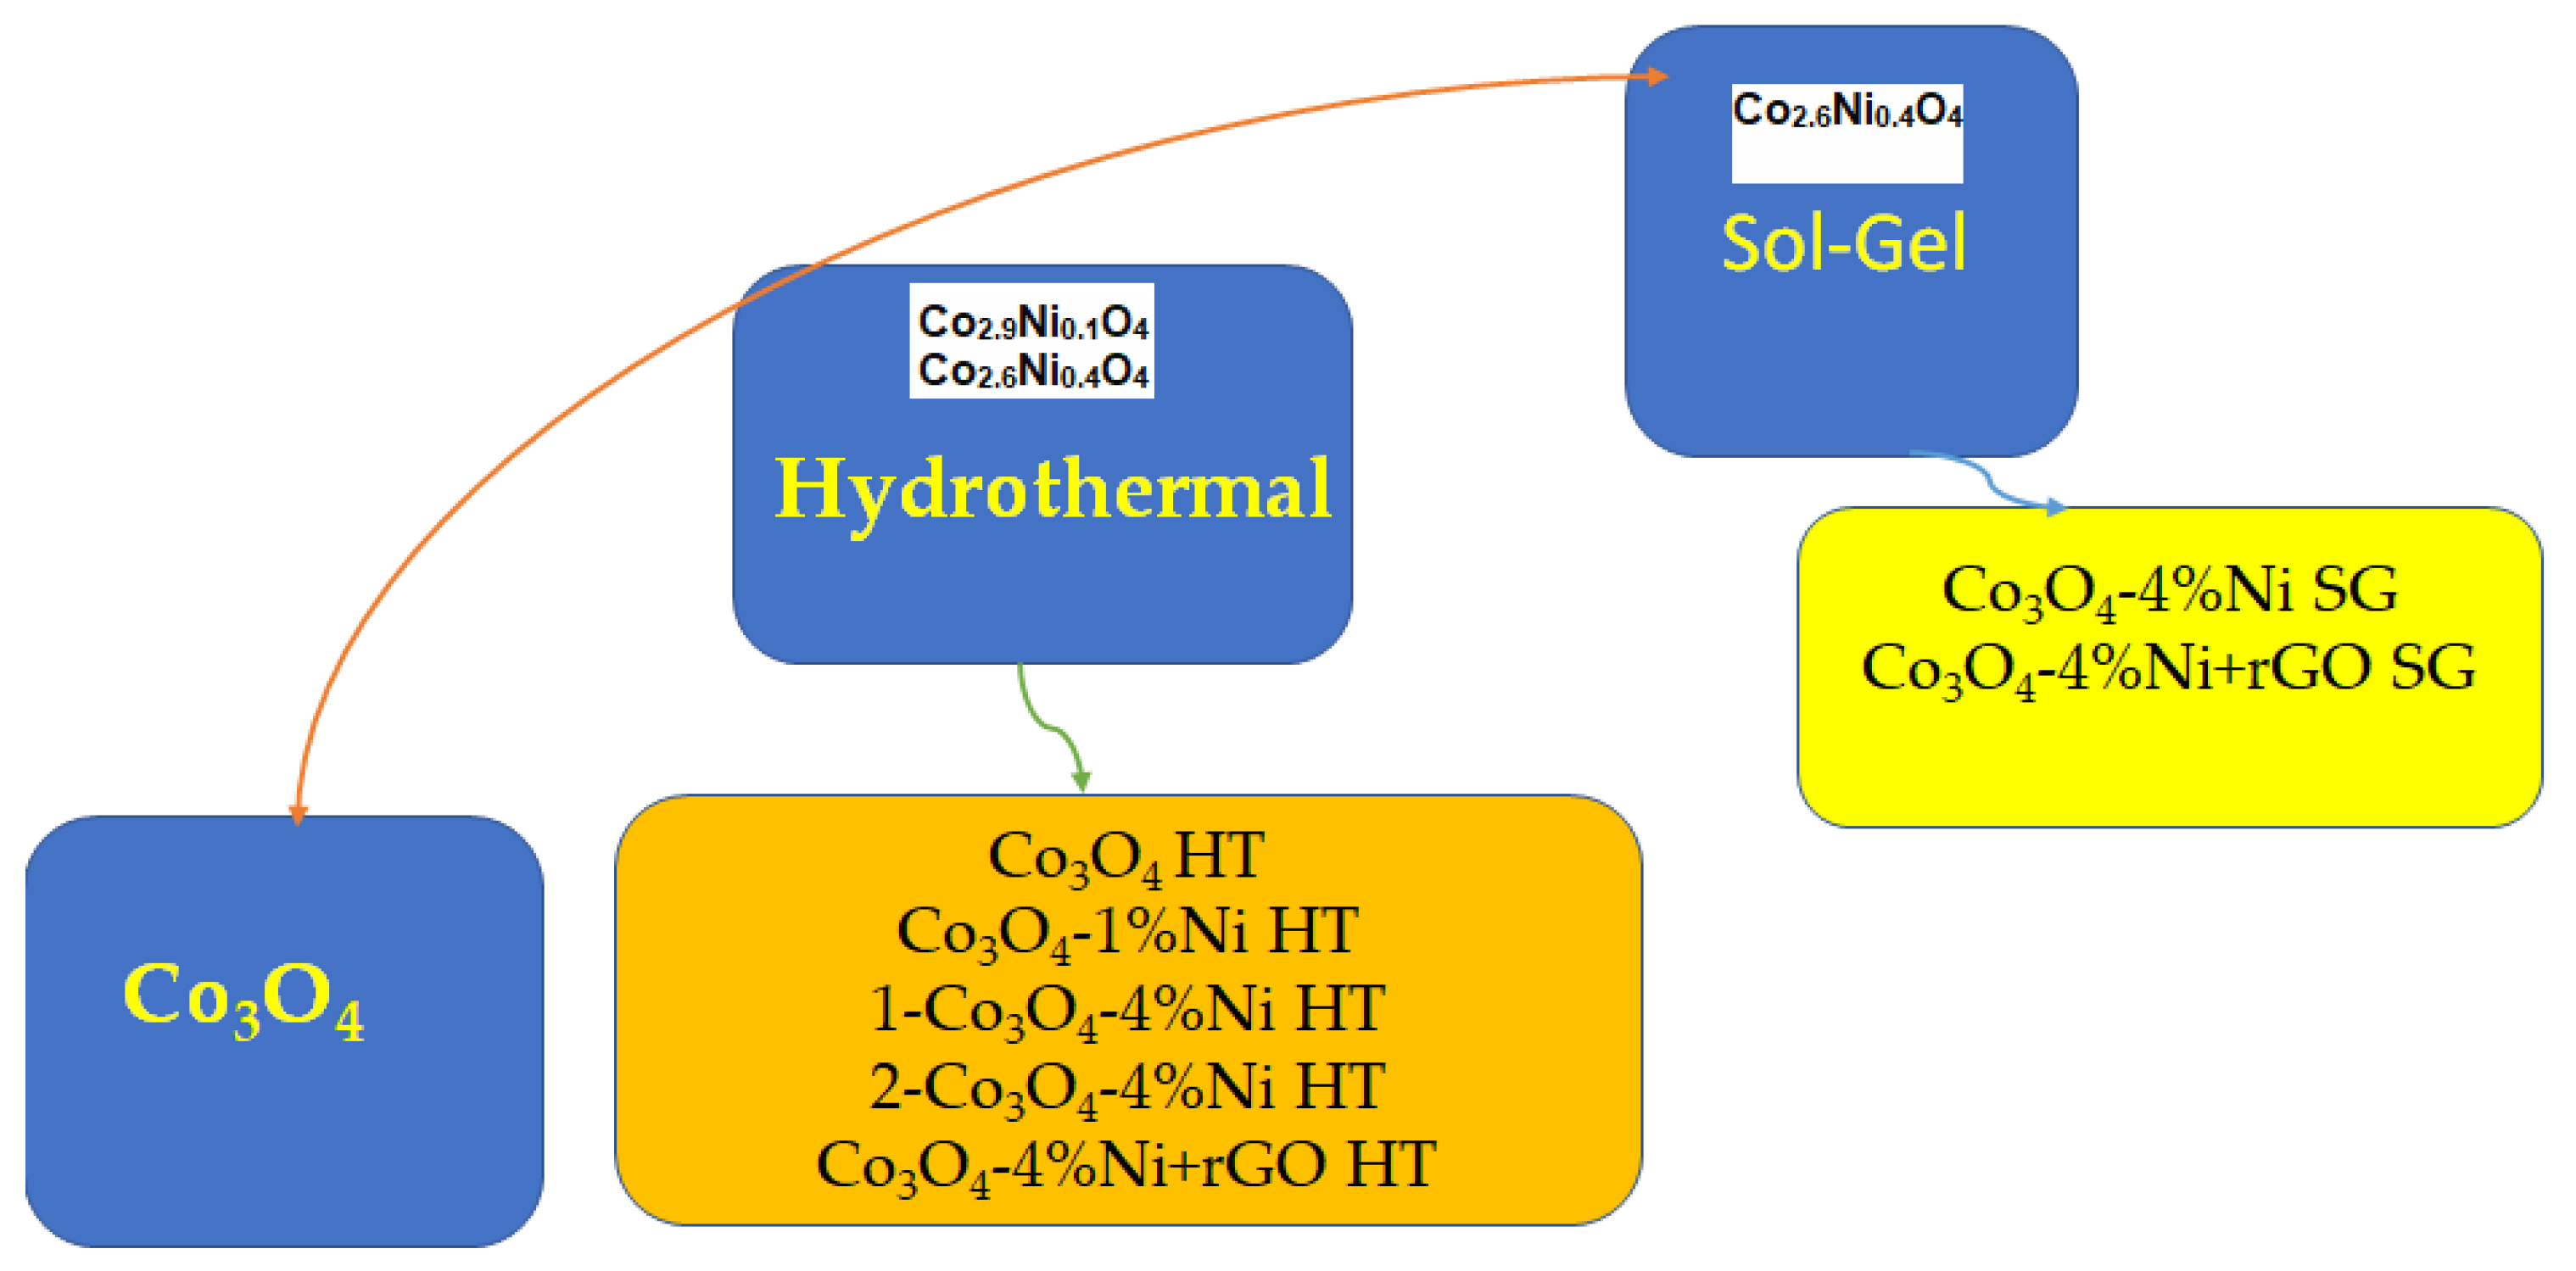
3.1. Synthesis

Synthesis by the sol–gel method of Co3O4-4%Ni SG and Co3O4-4%Ni+rGO SG was carried out using as precursors cobalt nitrate hexahydrate (Co (NO3)2·6H2O; Acros, Geel, Belgium) with citric acid monohydrate (C6H8O7; Scharlau, Barcelona, Spain) in distilled water as solvent. The mixture was stirred for 4 h, at 50 °C, and then nickel nitrate hexahydrate (Ni (NO3)2·6H2O; Acros) was added at 4%. The samples obtained were dried for 10 h in an oven for dehydration. The dry product was subjected to sintering heat treatment in a muffle furnace, at 400 °C, for 3 h. Doping with reduced graphene oxide (rGO) was carried out using the same precursors with the addition of 0.050 g of rGO with a mixture stirred for 4 h, at 50 °C.
The hydrothermal method 1 of Co3-XNiXO4+rGO used cobalt acetate hexahydrate CoC4H6O4·4H2O and nickel sulfate hexahydrate NiSO4·6H2O, urea CH4N2O, reduced graphene oxide (rGO) (0.050 g) and distilled water as precursors. First, stirring is started at 350 rpm and 100 °C for 3 h, grinding the reduced graphene oxide to guarantee the dispersion of the compound. Then, the solution was entered into a hermetically sealed autoclave and heated at 160 °C for 16 h. Finally, the powders were pre-calcined in the air at 300 °C for 3 h, and then at 400 °C for 3 h. Samples of this method are: 1-Co3O4-4%Ni HT, Co3O4-4%Ni+rGO HT.
Hydrothermal synthesis 2-Co3O4-4%Ni HT, Co3O4, Co3O4-1%Ni HT; the hydrothermal synthesis of 4% (mol mol−1) Ni-doped Co3O4 was performed by a procedure adapted to Cardenas et al. [26] and Jin, L et al. [27]. Initially, the precursor cobalt acetate was solubilized in deionized water with nickel sulfate as the source of the doping agent. Then, 2 mL urea and the 45 mL ammonia mineralizer were added in the sequence. After homogenization, the solution was transferred to a hydrothermal reactor and heated at 180 °C for 24 h. The gray precipitate was water washed and centrifuged at 8.000 rpm, for 10 min, at 10 °C temperature. Posteriorly, the particulate was dried at 80 °C for 24 h and submitted to calcination at 300 °C for 3 h.

3.1.1. Bactericidal Test: Agar Diffusion

The antimicrobial assay was realized against bacteria S. aureus (INCQS 15 ATCC 25923) and E. coli (INCQS 33 ATCC 25922) as Gram-positive and Gram-negative, respectively. Initially, bacteria were inoculated in Müller–Hinton broth medium (brand Kasvi), incubating at 37 ± 0.5 °C for 24 h. Then, the concentration of bacteria colonies was adjusted to 105 log CFU mL−1 by turbidity method at 600 nm using the spectroscopy equipment in the visible ultraviolet (UV–Vis) (Shimadzu model UV-1650). In sequence, a 100 μL bacterial aliquot was used to seed on Müller–Hinton agar and incubated at 37 ± 0.5 °C for 24 h. Finally, the antimicrobial activity was verified by measuring the inhibition halos.

3.1.2. Photocatalytic Tests

For the preliminary photocatalytic tests, 10 mL of an ATZ solution (10 mg L−1) was transferred to a 50 mL glass beaker to which 5 mg of catalyst was added. The mixture was kept under agitation for 30 min, in the dark, to reach the adsorption equilibrium, and then a UV (254 nm) light source was switched on and maintained for a fixed time of 30 min. After the adsorption and irradiation times, the samples were filtered in a 0.45 μm PTFE membrane, followed by the analysis of the ATZ and by-products by high-performance liquid chromatography (HPLC) according to the methodology described in the literature [18]. The materials with the best performance in the preliminary photocatalytic tests were selected for the kinetic study, varying the degradation time from 5 to 60 min.
To investigate the degradation mechanisms, Isopropanol (IPA, Sigma Aldrich, St. Louis, MI, USA, 99%), ascorbic acid (AA, Sigma Aldrich, 99%), ethylenediaminetetraacetic acid (EDTA, Sigma Aldrich, 99%), and silver nitrate (SN, Synth, 98%) were used as scavengers for hydroxyl radicals (OH), superoxide radicals (O2), holes (h+) and electrons (e), respectively. Each 10 mL of ATZ solution (10 mg L−1) was added separately, with 3 mg of SN, 3 mg of EDTA, 3 mg of AA, and 3 mL of IPA. The solutions were irradiated with UV light for 60 min, filtered, and analyzed by HPLC. The recyclability of the material was investigated for up to 6 cycles of the application under UV irradiation by applying 5mg of the material and 10 mL of ATZ (10 mg L-1) solution at a time of 60 min for each cycle.

3.2. Characterizations

The material crystallinity was investigated by X-ray diffraction (XRD), and measurements were carried out on the PANalytical X’Pert PRO MPD, Bellaterra, Spain θ/θ Bragg–Brentano powder diffractometer with Cu Kα radiation (λ = 1.5418 Å), a working power of 45 kV–40 mA, and a secondary graphite flat crystal monochromator with X’Celerator. The morphology of the samples was characterized with the help of the field-emission scanning electron microscope (FESEM, Nijmegen, The Netherlands) technique (FESEM-JEDL J-7100). Structural details were analyzed by transmission electron microscopy (TEM), high-resolution TEM (HR-TEM), and selected area electron diffraction (SAED), using a Tecnai F20 Super-Twin TMP operating at an accelerating voltage of 200 kV. The samples were dispersed in absolute ethanol and deposited on copper grids with Lacey/Carbon 200 Mesh carbon membranes. Diffuse reflectance spectra (DRS) in the ultraviolet-visible (UV–Vis) region were recorded, at room temperature, between 200 and 1200 nm using a spectrometer (Shimadzu, Kyoto, Japan). Diffuse reflectance UV–Vis spectra were obtained. ATZ photolytic degradation in the UV region was carried out in a wooden reactor.

4. Conclusions

The samples obtain by the sol–gel route and the two hydrothermal processes resulted in the pure spinel phase in a nanometric scale. The morphological results show that the size of the nanoparticles is smaller for the sol–gel method, grouping together with the rGO presence. As consequence, the nanoparticles with rGO increased the surface area from 6.50 ± 0.9 to 50.5 ± 0.9 cm3 g−1. The addition of Ni and rGo in the samples decreased the band gap energy, obtaining 2.0 eV for the Co3O4-4%Ni+rGO SG sample, which is the possible reason for a better bactericidal and photocatalytic response. Antimicrobial activity was verified from the appearance of the inhibitory halo, confirming that only the nanocomposite Ni-doped Co3O4 in the presence of rGO obtained by the sol–gel method (Co3O4-4%Ni+rGO SG) showed inhibition capacity for both microorganisms. The antimicrobial activity was excellent for the microorganism S. aureus (Gram-positive), with an inhibition halo value of 0.72 mm, higher than that observed for E. coli (Gram-negative), 0.47 mm. For the photocatalytic process, it was confirmed that Co3O4-4%Ni+rGO SG is activated by UV light. The reactive species h+ and O2 are the main ones responsible for the ATZ photocatalytic degradation and HAT formation. The Co3O4-4%Ni+rGO SG catalyst maintains its photoactivity to efficiently degrade ATZ, after six cycles of reuse.

Author Contributions

Conceptualization. M.R.J., E.C.P. and J.O.D.M.; methodology, A.J.M., O.A.P.P., L.J.C.F. and J.O.D.M.; formal analysis, A.J.M., M.R.J. and J.O.D.M.; investigation, A.J.M. and J.O.D.M.; original draft preparation, M.R.J.; writing—review and editing E.C.P.; supervision, M.R.J. All authors have read and agreed to the published version of the manuscript.

Funding

Artistic Creation and Innovation of the Universidad Nacional de Colombia-Bogotá-2020, Code: 51055, QUIPU and Internationalization project Universidad Nacional Colombia Bogotá and Embrapa Brasil 2022.

Data Availability Statement

Not applicable.

Acknowledgments

The authors thank Universidad Nacional de Colombia—Campus Bogotá in Colombia, Federal University of São Carlos, FAPESP (grant-number 2021/14992-1), EMBRAPA Instrumentação, and the Federal University of Alfenas in Brazil.

Conflicts of Interest

The authors declare no conflict of interest.

References

  1. Chen, H.; Xue, C.; Cui, D.; Liu, M.; Chen, Y.; Li, Y.; Zhang, W. Co3O4–Ag photocatalysts for the efficient degradation of methyl orange. RSC Adv. 2020, 10, 15245–15251. [Google Scholar] [CrossRef] [PubMed] [Green Version]
  2. Sanakousar, M.F.; Jiménez-Pérez, V.M.; Shridhar, A.H. Mechanistic insight into the photocatalytic degradation of organic pollutants and electrochemical behavior of modified MWCNTs/Cu–Co3O4 nanocomposites. React. Chem. Eng. 2022, 7, 1847–1872. [Google Scholar] [CrossRef]
  3. Wang, X.; Lu, S.; Xu, W. Synthesis of Needle-like Nanostructure Composite Electrode of Co3O4/rGO/NF for High-Performance Symmetric Supercapacitor. Crystals 2022, 12, 664. [Google Scholar] [CrossRef]
  4. Chun, L.; Shuai, M.; Mingxing, S.; Fengyun, W.; Mingzhu, X.; Qun, C.; Xuehai, J. Peroxymonosulfate activation through 2D/2D Z-scheme CoAl-LDH/BiOBr photocatalyst under visible light for ciprofloxacin degradation. J. Hazard. Mater. 2021, 420, 126613. [Google Scholar] [CrossRef]
  5. Chun, L.; Shuai, M.; Mingxing, S.; Xianyong, H.; Dongting, W.; Fengyun, W.; Mingzhu, X.; Qun, C. Enhanced photocatalytic degradation performance of BiVO4/BiOBr through combining Fermi level alteration and oxygen defect engineering. Chem. Eng. J. 2022, 449, 137757. [Google Scholar] [CrossRef]
  6. Awais, A.; Safia, K.; Sadaf, T.; Rafael, L.; Francis, V. Self-sacrifice MOFs for heterogeneous catalysis: Synthesis mechanisms and future perspectives. Mater. Today 2022, 55, 137–169. [Google Scholar] [CrossRef]
  7. Madhura, T.R.; Kumar, G.G.; Ramaraj, R. Reduced graphene oxide-supported Co3O4 nanocomposite bifunctional electrocatalysts for glucose–oxygen fuel cells. Energy Fuels 2020, 34, 12984–12994. [Google Scholar] [CrossRef]
  8. Cardenas-Flechas, L.J.; Freire, P.T.C.; Paris, E.C.; Moreno, L.C.; Joya, M.R. Temperature-induced structural phase transformation in samples of Co3O4 and Co3-xNixO4 for CoO. Materialia 2021, 18, 101155. [Google Scholar] [CrossRef]
  9. Rehman, A.U.; Fayaz, M.; Lv, H.; Liu, Y.; Zhang, J.; Wang, Y.; Shi, K. Controllable Synthesis of a Porous PEI-Functionalized Co3O4/rGO Nanocomposite as an Electrochemical Sensor for Simultaneous as Well as Individual Detection of Heavy Metal Ions. ACS Omega 2022, 7, 5870–5882. [Google Scholar] [CrossRef]
  10. Mussa, Y.; Ahmed, F.; Abuhimd, H.; Arsalan, M.; Alsharaeh, E. Enhanced Electrochemical performance at high temperature of Cobalt Oxide/Reduced Graphene Oxide Nanocomposites and its application in lithium-ion batteries. Sci. Rep. 2019, 9, 44. [Google Scholar] [CrossRef]
  11. Elaine, C.P.; João, O.D.M.; Ailton, J.M.; Lílian, C.S.; Camila, R.S.; Alessandra, Z.; Márcia, T.E.; Valmor, R.M.; Miryam, R.J. CuO nanoparticles decorated on hydroxyapatite/ferrite magnetic support: Photocatalysis, cytotoxicity, and antimicrobial response. Environ. Sci. Pollut. Res. 2021, 29, 41505–41519. [Google Scholar] [CrossRef]
  12. Ozkaya, T.; Baykal, A.; Toprak, M.S.; Koseoğlu, Y.; Durmuş, Z. Reflux synthesis of Co3O4 nanoparticles and its magnetic characterization. J. Magn. Magn. Mater. 2009, 321, 2145–2149. [Google Scholar] [CrossRef]
  13. Manoratne, C.H.; Rosa, S.; Kottegoda, I.R.M. XRD-HTA, UV visible, FTIR and SEM interpretation of reduced graphene oxide synthesized from high purity vein graphite. Mater. Sci. Res. India 2017, 14, 19–30. [Google Scholar] [CrossRef]
  14. Aluiz, A.M.A.D.; da Silva, K.S.; Araújo, M.K.S.; Sales, D.C.S.; Ferreira, M.C.; de Araújo, A.C.V.; de Azevedo, W.M.; Falcão, E.H.L. Thermal synthesis of rGO and rGO-Co3O4 and their application as adsorbents for anionic dye removal. Colloids Surf. A Physicochem. Eng. Asp. 2020, 599, 124837. [Google Scholar] [CrossRef]
  15. Thota, S.; Kumar, A.; Kumar, J. Optical, electrical and magnetic properties of Co3O4 nanocrystallites obtained by thermal decomposition of sol–gel derived oxalates. J. Mater. Sci. Eng. B 2009, 164, 30–37. [Google Scholar] [CrossRef]
  16. Jiang, Y.L.; Dan, W.; Min, W.; Dejia, K.; Yi, Z.; Jian-Feng, C.; Liming, D. Two-Dimensional Co3O4 Porous Sheets: Facile Synthesis and Enhanced Photocatalytic Performance. Chem. Eng. Technol. 2016, 39, 891–898. [Google Scholar] [CrossRef]
  17. Shi, H.; Chen, G.; Zhang, C.; Zou, Z. Polymeric g-C3N4 Coupled with NaNbO3 Nanowires toward Enhanced Photocatalytic Reduction of CO2 into Renewable Fuel. ACS Catal. 2014, 4, 3637–3643. [Google Scholar] [CrossRef]
  18. Angela, M.R.-P.; João, O.D.M.; Carlos, A.P.V.; Elaine, C.P.; Miryam, R.J. Structural evolution, optical properties, and photocatalytic performance of copper and tungsten heterostructure materials. Mater. Today Commun. 2021, 26, 101886. [Google Scholar] [CrossRef]
  19. Alsharaeh, E.; Mussa, Y.; Ahmed, F.; Aldawsari, Y.; Al-Hindawi, M.; Sing, G.K. Novel route for the preparation of cobalt oxide nanoparticles/reduced graphene oxide nanocomposites and their antibacterial activities. Ceram. Int. 2016, 42, 3407–3410. [Google Scholar] [CrossRef]
  20. Gnanamoorthy, G.; Priya, P.; Ali, D.; Lakshmi, M.; Yadav, V.K.; Varghese, R. A new CuZr2S4/rGO and their reduced graphene oxide nanocomposities enhanced photocatalytic and antimicrobial activities. Chem. Phys. Lett. 2021, 781, 139011. [Google Scholar] [CrossRef]
  21. Elbasuney, S.; El-Sayyad, G.S.; Tantawy, H.; Hashem, A.H. Promising antimicrobial and antibiofilm activities of reduced graphene oxide-metal oxide (RGO-NiO, RGO-AgO, and RGO-ZnO) nanocomposites. RSC Adv. 2021, 11, 25961–25975. [Google Scholar] [CrossRef] [PubMed]
  22. Alayande, A.B.; Obaid, M.; Kim, I.S. Antimicrobial mechanism of reduced graphene oxide-copper oxide (rGO-CuO) nanocomposite films: The case of Pseudomonas aeruginosa PAO1. Mater. Sci. Eng. C. 2020, 109, 110596. [Google Scholar] [CrossRef] [PubMed]
  23. Malafatti, J.O.; Moreira, A.J.; Sciena, C.R.; Silva, T.E.; Freschi, G.P.; Pereira, E.C.; Paris, E.C. Prozac® removal promoted by HAP: Nb2O5 nanoparticles system: By-products, mechanism, and cytotoxicity assessment. J. Environ. Chem. Eng. 2021, 9, 104820. [Google Scholar] [CrossRef]
  24. Moreira, A.J.; Coelho, D.; Dias, J.A.; Mascaro, L.H.; Freschi, G.P.; Mastelaro, V.R.; Pereira, E.C. Phase control and optimization of photocatalytic properties of samarium doped TiO2 synthesized by coupled ultraviolet and microwave radiations. J. Alloys Compd. 2022, 905, 164217. [Google Scholar] [CrossRef]
  25. Moreira, A.J.; Lemos, S.G.; Coelho, D.; Mascaro, L.H.; Freschi, G.P.; Pereira, E.C. UV–Vis spectrophotometry coupled to chemometric analysis for the performance evaluation of atrazine photolysis and photocatalysis. Environ. Sci. Pollut. Res. 2022, 29, 24010–24023. [Google Scholar] [CrossRef]
  26. Cardenas-Flechas, L.J.; Raba, A.M.; Rincón-Joya, M. Synthesis and evaluation of nickel doped Co3O4 produced through hydrothermal technique. Dyna 2020, 87, 184–191. [Google Scholar] [CrossRef]
  27. Jin, L.; Li, X.; Ming, H.; Wang, H.; Jia, Z.; Fu, Y.; Zheng, J. Hydrothermal synthesis of Co3O4 with different morphologies towards efficient Li-ion storage. RSC Adv. 2014, 4, 6083–6089. [Google Scholar] [CrossRef]
Figure 1. Scheme of the samples used in this research.
Catalysts 12 01199 g001
Figure 2. Powder X-ray patterns of Co3O4 phase nanocrystals at 400 °C and 4% Ni: (a) Co3O4-4%Ni SG, (b) Co3O4-4%Ni HT, and (c) Co3O4-4%Ni+rGO HT.
Catalysts 12 01199 g002
Figure 3. FESEM images of Co3O4 doped at 4% Ni: (a) Co3O4-4%Ni SG, (b) Co3O4-4%Ni+rGO SG, (c) Co3O4-4%Ni HT (Method 1), (d) Co3O4-4%Ni HT (Method 2), and (e) Co3O4-4%Ni+rGO HT.
Catalysts 12 01199 g003
Figure 4. TEM images of Co3O4 samples with 4% Ni at 400 °C: (a) Co3O4-4%Ni HT, (b) Co3O4-4%Ni SG, (c) Co3O4-4%Ni HT particle size, (d) Co3O4-4%Ni SG particle size, (e) Co3O4-4%Ni+rGO HT, (f) Co3O4-4%Ni+rGO SG, (g) Co3O4-4%Ni+rGO HT particle size, and (h) Co3O4-4%Ni+rGO SG particle size.
Catalysts 12 01199 g004
Figure 5. (a) FTIR Spectrum Co3O4 nanoparticles. (b) BET Surface Area Analysis.
Catalysts 12 01199 g005
Figure 6. UV–Vis of Co3O4 samples with 4% Ni at 400°C: (a) 2Co3O4-4%Ni HT, (b) 1Co3O4-4%Ni HT, (c) Co3O4-4%Ni SG, (d) Co3O4-4%Ni+rGO SG.
Catalysts 12 01199 g006
Figure 7. Co3O4 samples with 4% Ni at 400 °C; Co3O4-4%Ni+rGO SG, 1-Co3O4-4%Ni SG, 2-Co3O4-4%Ni HT, Co3O4-4%Ni+rGO HT, 1-Co3O4-4%Ni HT.
Catalysts 12 01199 g007
Figure 8. ATZ removal by adsorption, photocatalysis, total (adsorption + photocatalysis) (a) and HAT formation (b) in 30 min for the samples, at 400 °C; Co3O4 HT, Co3O4-4%Ni SG, Co3O4-1%Ni HT, Co3O4-4%Ni+rGO SG, Co3O4-4%Ni HT, and Co3O4-4%Ni+rGO HT.
Catalysts 12 01199 g008
Figure 9. (a) Degradation rate: Co3O4-4%Ni HT, Co3O4-4%Ni+rGO SG, Co3O4-4%Ni SG, Co3O4 HT; (b) concentration of HAT formed at each ATZ degradation time; (c) average conversion values of ATZ in HAT; (d) trapping experiments of the active species during the photocatalytic degradation of ATZ with Co3O4-4%Ni+rGO SG under UV radiation.
Catalysts 12 01199 g009
Figure 10. Proposal of a photocatalytic mechanism for the ATZ degradation mediated by Co3O4-4%Ni+rGO SG.
Catalysts 12 01199 g010
Figure 11. ATZ photocatalytic degradation using Co3O4-4%Ni+rGO SG for up to 6 application cycles.
Catalysts 12 01199 g011
Table 1. The conduction band (CB) and valence band (VB) calculated according to the Mulliken electronegativity.
SamplesEg (eV)Conduction Band (CB) (eV)Valence Band (VB) (eV)
2Co3O4-4%Ni HT2.240.282.52
1Co3O4-4%Ni HT2.800.002.80
Co3O4-4%Ni SG2.150.332.48
Co3O4-4%Ni+rGO SG2.000.402.40
Table 2. Antimicrobial activity of Co3O4 doped with Ni and addition of rGO halo inhibition (mm).
MaterialS. aureus/mmE. coli/mm
Co3O4-4%Ni SG--
1-Co3O4-4%Ni HT--
2-Co3O4-4%Ni HT--
Co3O4-4%Ni+rGO HT--
Co3O4-4%Ni+rGO SG0.72 ± 0.020.47±
Publisher’s Note: MDPI stays neutral with regard to jurisdictional claims in published maps and institutional affiliations.

