
Transesterification of Soybean Oil through Different Homogeneous Catalysts: Kinetic Study


1
Department of Chemical Engineering and Physical-Chemistry, University of Extremadura, Avda. de Elvas s/n, 06006 Badajoz, Spain
2
Department of Applied Physics, University of Extremadura, Avda. de Elvas s/n, 06006 Badajoz, Spain
*
Author to whom correspondence should be addressed.
Catalysts 2022, 12(2), 146; https://doi.org/10.3390/catal12020146
Submission received: 23 December 2021
/
Revised: 18 January 2022
/
Accepted: 21 January 2022
/
Published: 24 January 2022
(This article belongs to the Special Issue Catalysts for Biofuel and Bioenergy Production)
Abstract
:The search for alternatives to fossil fuels has been widely covered, especially in the past two decades. Thus, the role of biodiesel has been important, and its implementation in biorefineries seems feasible due to the sustainability of the process. This way, the knowledge of kinetics is vital to design industrial facilities and to compare the efficiency of catalysts (both typical and innovative ones) during transesterification or other similar processes taking place in a biorefinery, such as biolubricant production through transesterification with superior alcohols. In this work, a thorough kinetic study of homogeneous catalysts (base catalysts, such as KOH, NaOH or CH3OK, and acid catalysts (H2SO4, H3PO4 and p-toluenesulfonic acid, CH3C6H4SO3H)) applied to the transesterification of soybean oil was carried out to provide extensive kinetic data about this process. As a conclusion, a pseudo-first-order reaction mechanism was applied in all cases, with activation energies of 65.5–66 and 92.3 kJ·mol−1 for KOH and CH3C6H4SO3H, respectively, proving the higher activation energy for acid catalysis compared to base catalysis.
1. Introduction
The search for alternatives to petroleum products has been increasingly important, supported by policies (both national and global), such as the Sustainable Development Goals (SDG) [1,2].
For instance, fatty acid methyl (or ethyl) ester (FAME or FAEE) production from different sources (especially fatty acids obtained from vegetable oils) is a recurring process to produce biodiesel, directly used in Diesel engines if this biofuel complies with some quality parameters [3]. In that sense, biodiesel production can play a really important role as an alternative to Diesel, implying many advantages, such as contribution to zero-net CO2 emissions, sustainability, or economic growth of developing areas, for instance [4,5].
This way, the use of a wide variety of vegetable oils (among other raw materials or wastes) could make the implementation of this technology feasible regardless of the climate or agronomic conditions. In that sense, the use of some vegetable oils, such as rapeseed or soybean, has been important, including many studies whose main conclusion was the high quality of the biodiesel produced, complying with most of the requirements included in standards [6,7,8]. Additionally, biodiesel production could take part in more complex processes, such as biorefineries and contribute to sustainability, green chemistry, and circular economy [9,10,11].
Even though biodiesel production and application has been widely studied in the literature, including its catalysis (both homogeneous and heterogeneous), the experimental conditions of research works are different even for the same kind of oil [12,13], with many factors, such as temperature, methanol:oil ratio, the fatty acid composition of the raw material, playing an important role during transesterification [14,15]. Thus, the values used for the most influencing variables (that is, kind and amount of catalyst, methanol/oil ratio, temperature and stirring rate [16,17,18]) on yield process and quality parameters vary depending on the study considered. Moreover, kinetic parameters are important for the correct implementation of this kind of process in real biorefineries, especially concerning reactor design and reagent supply.
Finally, activation energy determination is vital to compare processes with different techniques applied, such as innovative catalysts or green procedures, which can be an alternative for homogeneous catalysts, offering some advantages, such as the avoidance of washing treatments [19], although some disadvantages can be found (for instance, longer reaction times or the low reusability of heterogeneous catalysis, which might make them economically unviable) [13,20], requiring further improvements for the suitable implementation of this technique. In that sense, homogeneous catalysis is still economically feasible, requiring washing treatments and the subsequent water treatment to neutralize the corresponding catalyst [21]. This way, many researchers have compared homogeneous catalysts (both acid and base) with other kinds of catalysts, such as heterogeneous or nano-heterogeneous catalysts, taking the former as a reference to compare the efficiency of the process [18,22,23,24,25,26,27].
Considering the above, the aim of this work was the thorough kinetic study of soybean transesterification through homogeneous catalysis, paying attention to different catalysts (such as sodium hydroxide, potassium hydroxide, sulfuric and p-toluenesulfonicacids) and their proportion, methanol/oil ratio, temperature and stirring rate. Thus, kinetic constants and activation energy values were obtained.
2. Results and Discussion
2.1. Base Catalysis
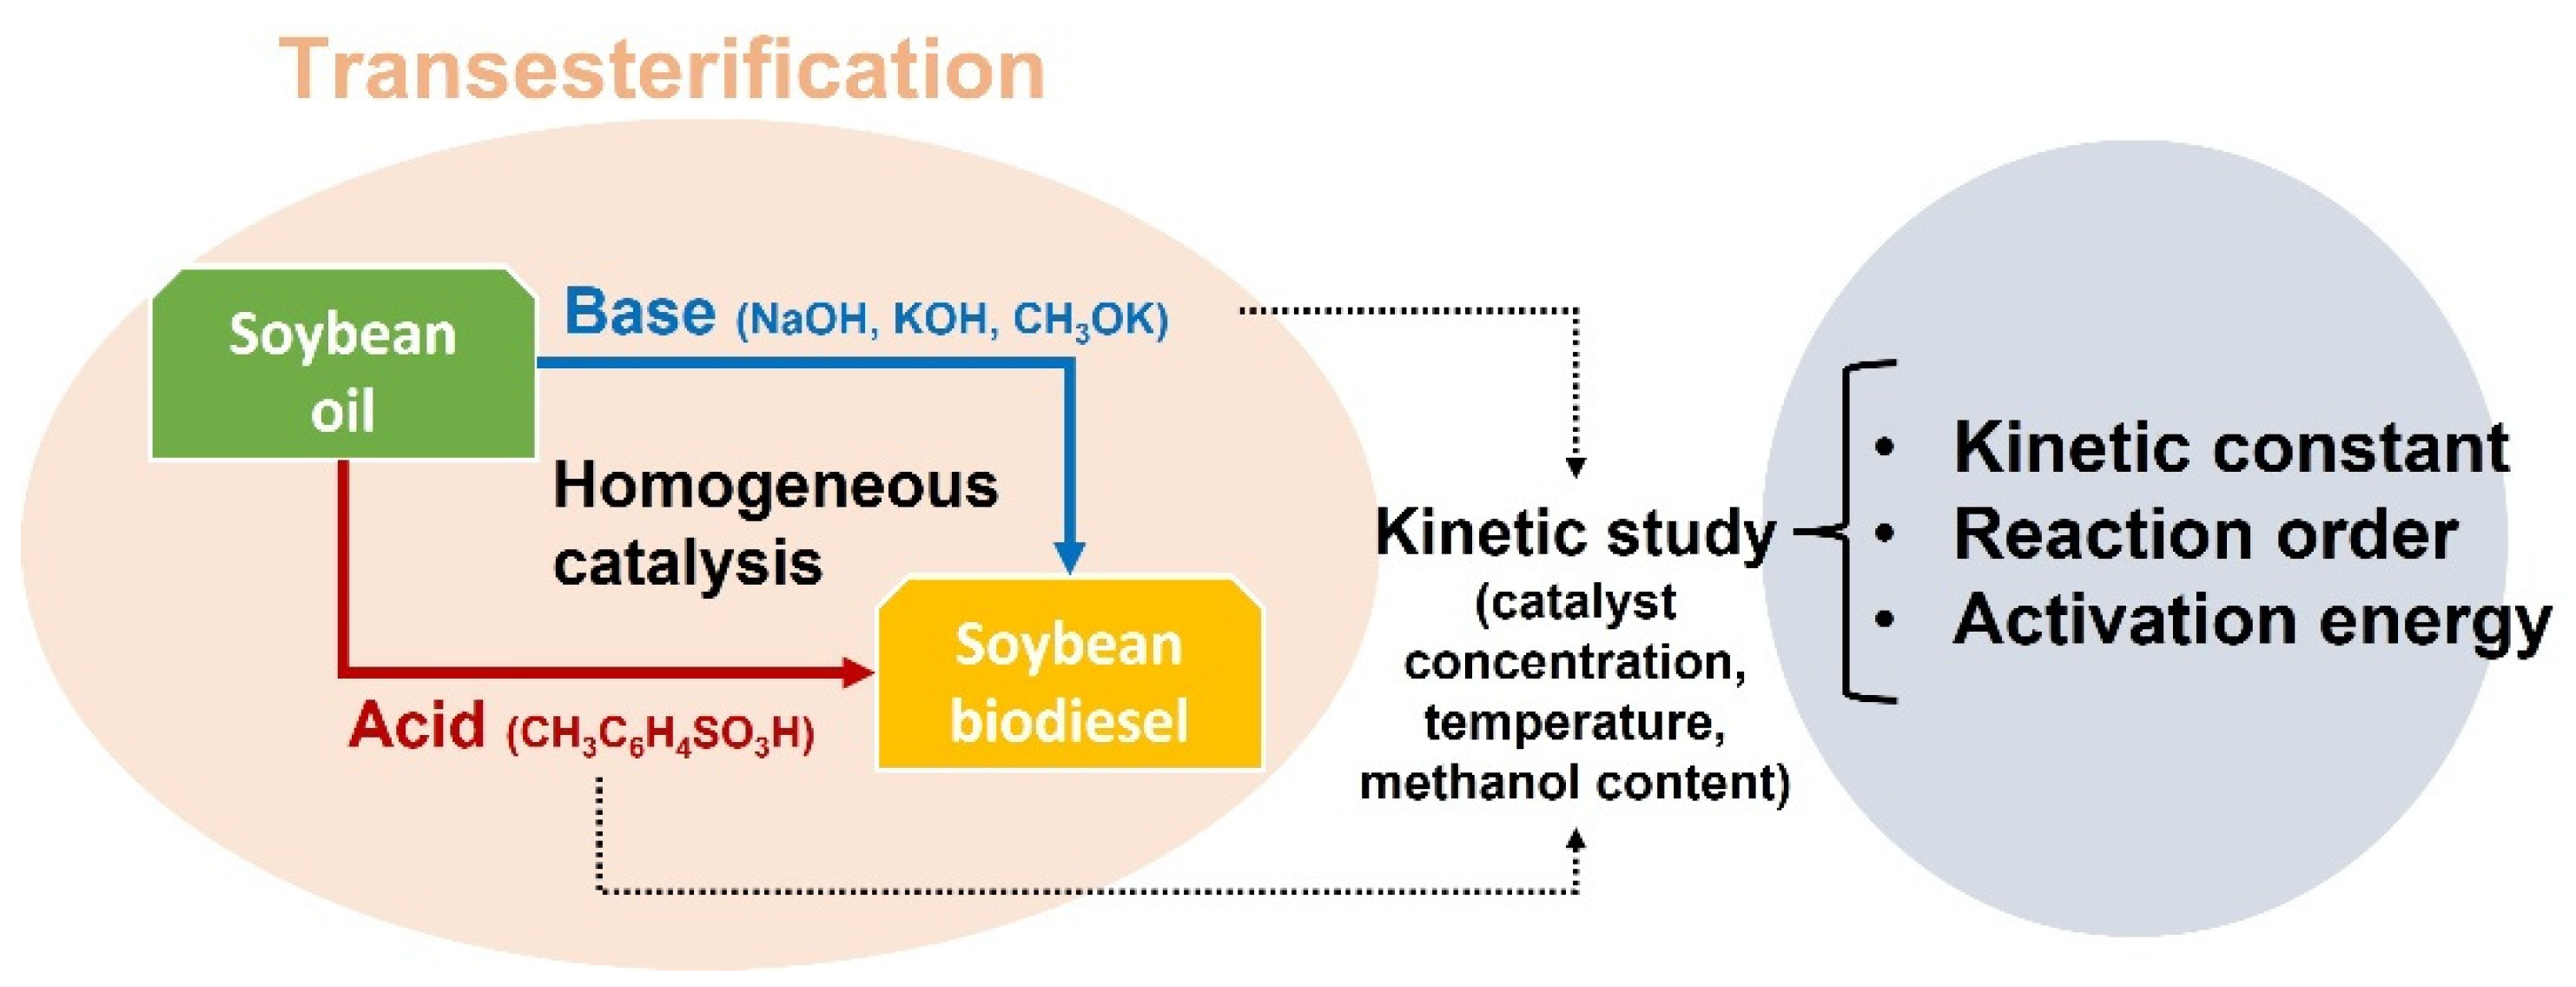
For the kinetic study, transesterification of soybean oil with methanol by using base (KOH, NaOH and CH3OK) and acid (H2SO4, H3PO4 and p-toluenesulfonic acid, CH3C6H4SO3H) was used. In order to carry out the kinetic study, the following simplifications were assumed:
- Although transesterification reaction is reversible, a methanol/oil ratio clearly exceeding the stoichiometric ratio was selected for the experiments included in this study, with the aim of shifting the reaction equilibrium towards FAME production. Consequently, product generation was only considered for the kinetic study.
- Although the transesterification reaction mainly has three stages in series (to generate diglycerides, monoglycerides and fatty acid methyl esters, respectively), the evolution of the different glycerides was not considered in this study, only quantifying FAMEs. For this reason, the kinetic study of the global reaction was carried out (that is, triglyceride conversion to fatty acid methyl ester).
- As soybean oil was refined and presented as a low acid number (2.74 mgKOH·goil−1), the effect of saponification reaction was considered negligible.
- Further, catalyst weight loss was considered negligible and, therefore, it will not take part as a product in any secondary reaction related to this process.
- After the study of the effect of stirring rate, the external diffusion effect was negligible for values higher than 500 rpm and, therefore, the control of the reaction rate was given by the chemical reaction.
Taking into account this approach, the kinetic model used in this study was developed by Singh and Fernando and used by other researchers, [28,29]. The global transesterification reaction can be described by Equation (1):
where A is triglyceride, B is methanol, C is FAME and D is glycerol.
The reaction rate of the given reaction will be expressed according to the following equation:
where −dCA/dt represents reagent A consumption; k is a pseudo-kinetic constant that includes catalyst action; CA is the concentration of reagent A at a certain time t; CB is the concentration of reagent B at a certain time t; α and β are the reaction orders regarding A and B, respectively.
On the other hand, considering the relation between reagent concentration and its conversion, as well as the stoichiometry of the process, θB can be defined as follows:
where and represent the initial concentration of A and B, respectively, and X is triglyceride (A) conversion.
Considering these equations, Equation (2) can be written as:
Which is a differential equation whose integration, once the limits are established (t = 0, X = 0; t = t, X = X), is given by Equation (7):
In this work, six cases were considered for the resolution of this integral, as observed in Table 1:
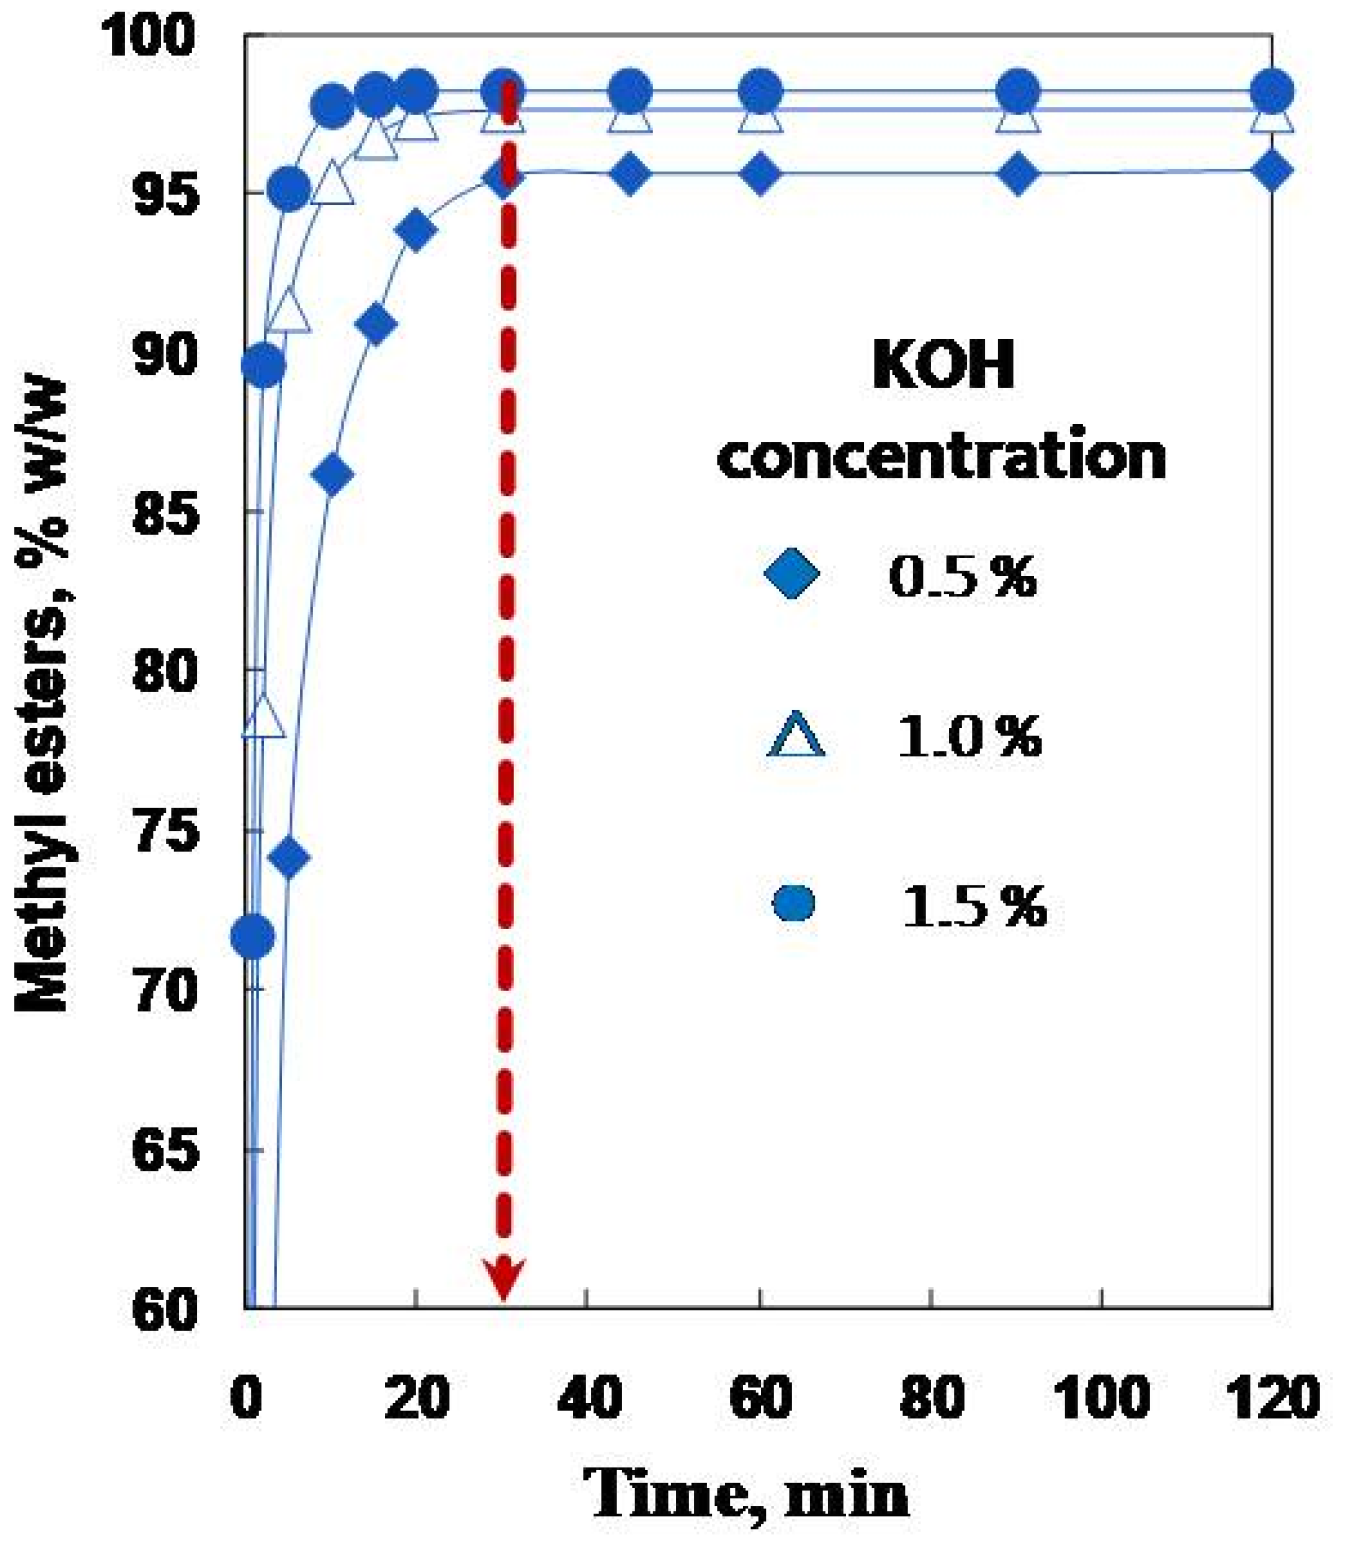
Regarding fatty acid methyl ester conversion during the transesterification of soybean oil, the effect of base catalysts is shown in Figure 1 for the case of KOH at different catalyst concentrations. The increase in methyl ester content was considerable at the initial stages, obtaining stabilization after 30 min (red dashed line). As the catalyst concentration increased, the reaction rate was higher, reaching higher FAME yields at shorter reaction times. The same behavior was observed for the rest of the catalysts included in this study (data not shown) and explained by other authors [16,30,31].
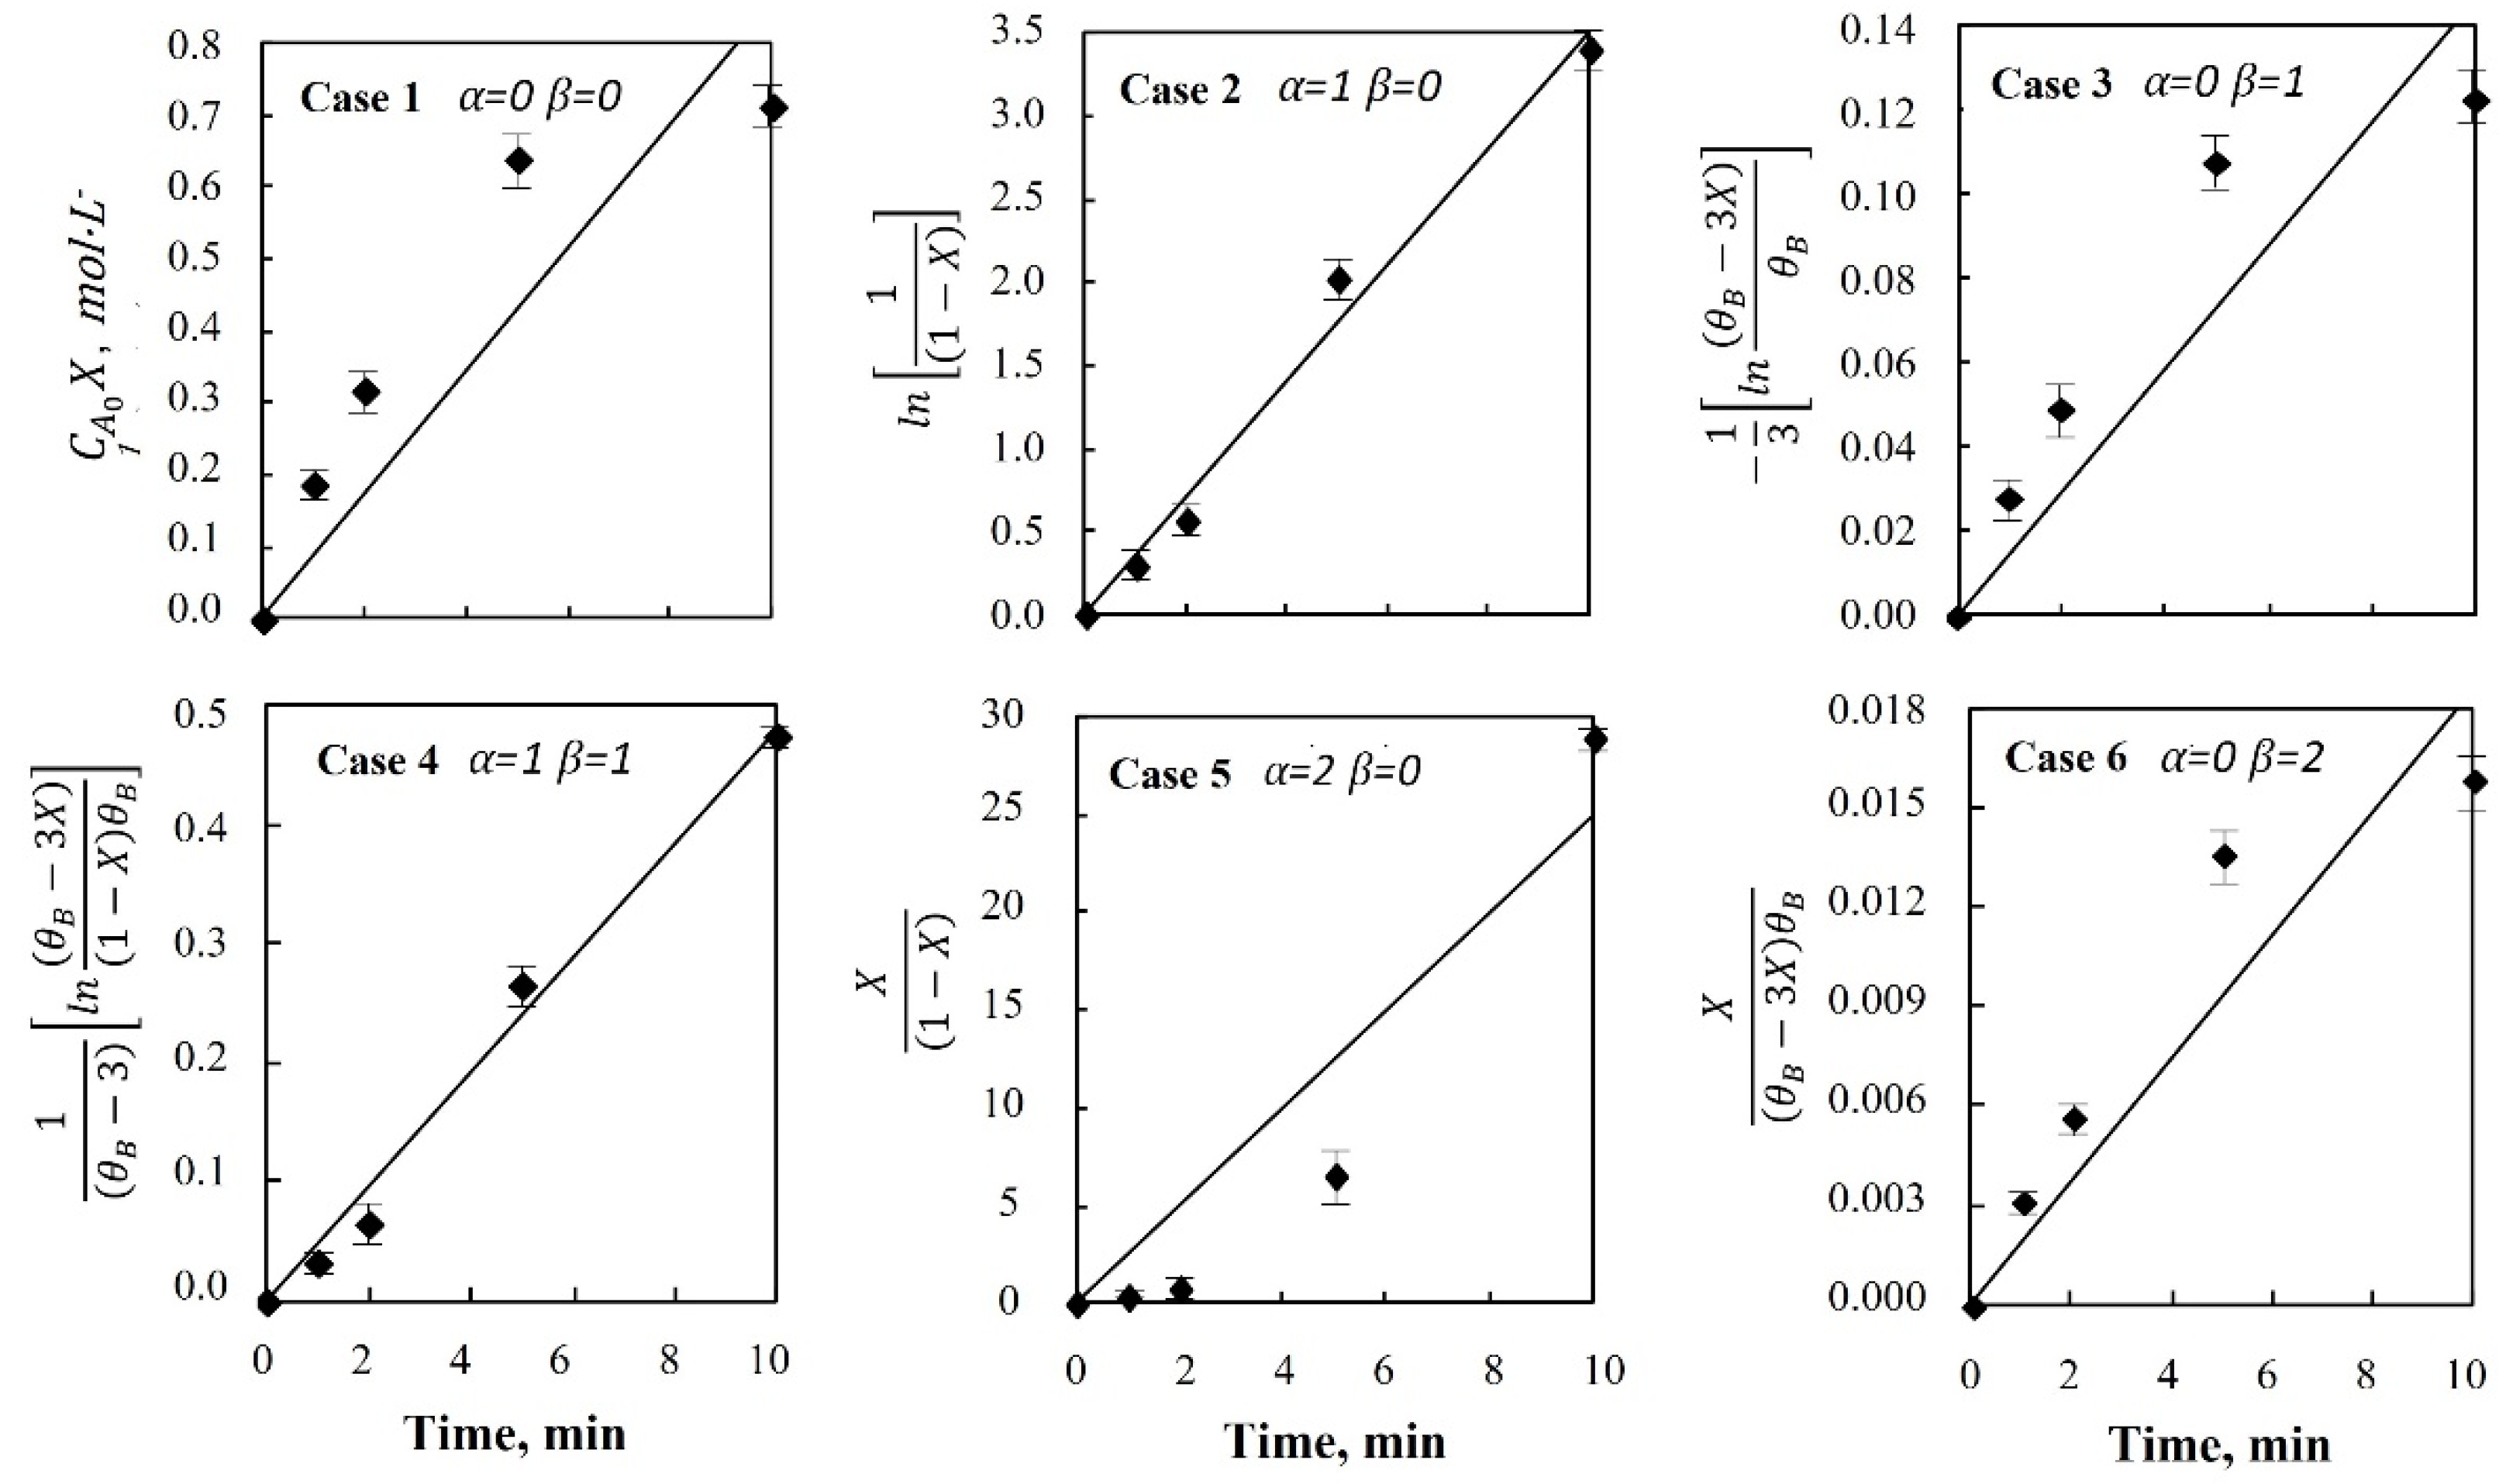
The adjustment of Equations (8)–(13) (see Table 1) for an experiment (in this case, using KOH as a catalyst) is included in Figure 2. Under these circumstances, the chemical balance was achieved after 10 min, which was the range selected for the corresponding adjustments. The same trend was observed for NaOH and CH3OK, omitting these results in this figure.
Thus, the results obtained for the adjustments observed in Figure 2, as well as those observed for the rest of catalysts at different concentrations (expressed in % w/w), are included in Table 2.
As inferred from this table, regardless of the kind of catalyst and its concentration, the best determination coefficients were obtained when the experimental data were adjusted to Equations (9) and (11); that is, Cases 2 (first-order reaction with respect to reagent A and zero-order reaction with respect to reagent B) and 4 (first-order reaction with respect to both reagents), respectively.
In both cases, regarding the experiments carried out at 1.0% and 1.5% catalyst concentration, the kinetic constant obtained through the corresponding adjustment (and, as a consequence, the reaction rate) followed the decreasing order: NaOH > CH3OK > KOH, whereas at 0.5% the order was KOH > CH3OK > NaOH. However, it should be taken into account the way these concentrations are expressed (grams of catalysts per 100 g of oil), and considering the different catalyst molecular weights, these orders might vary if the concentration is expressed as catalyst moles per total volume of the reaction mixture.
Considering Case 2, the reaction rate would be directly proportional to triglyceride concentration, and Equation (2) would be simplified as follows (Equation (14)):
where k′ is the apparent kinetic constant, including both catalytic and non-catalytic contributions according to Equation (15):
where CCat is catalyst concentration (expressed in mol·L−1), k1 is the kinetic constant corresponding to the catalytic contribution (L·mol−1·min−1), and k2 is the kinetic constant due to non-catalytic contribution (min−1).
Regarding Case 4 (first-order with respect to each reagent), the reaction rate equation would be given by Equation (16):
where, again, k′ is the apparent kinetic constant, including k1 (kinetic constant corresponding to the catalytic contribution, expressed in L2·mol−2·min−1) and k2 (kinetic constant corresponding to the non-catalytic contribution, expressed in L·mol−1·min−1).
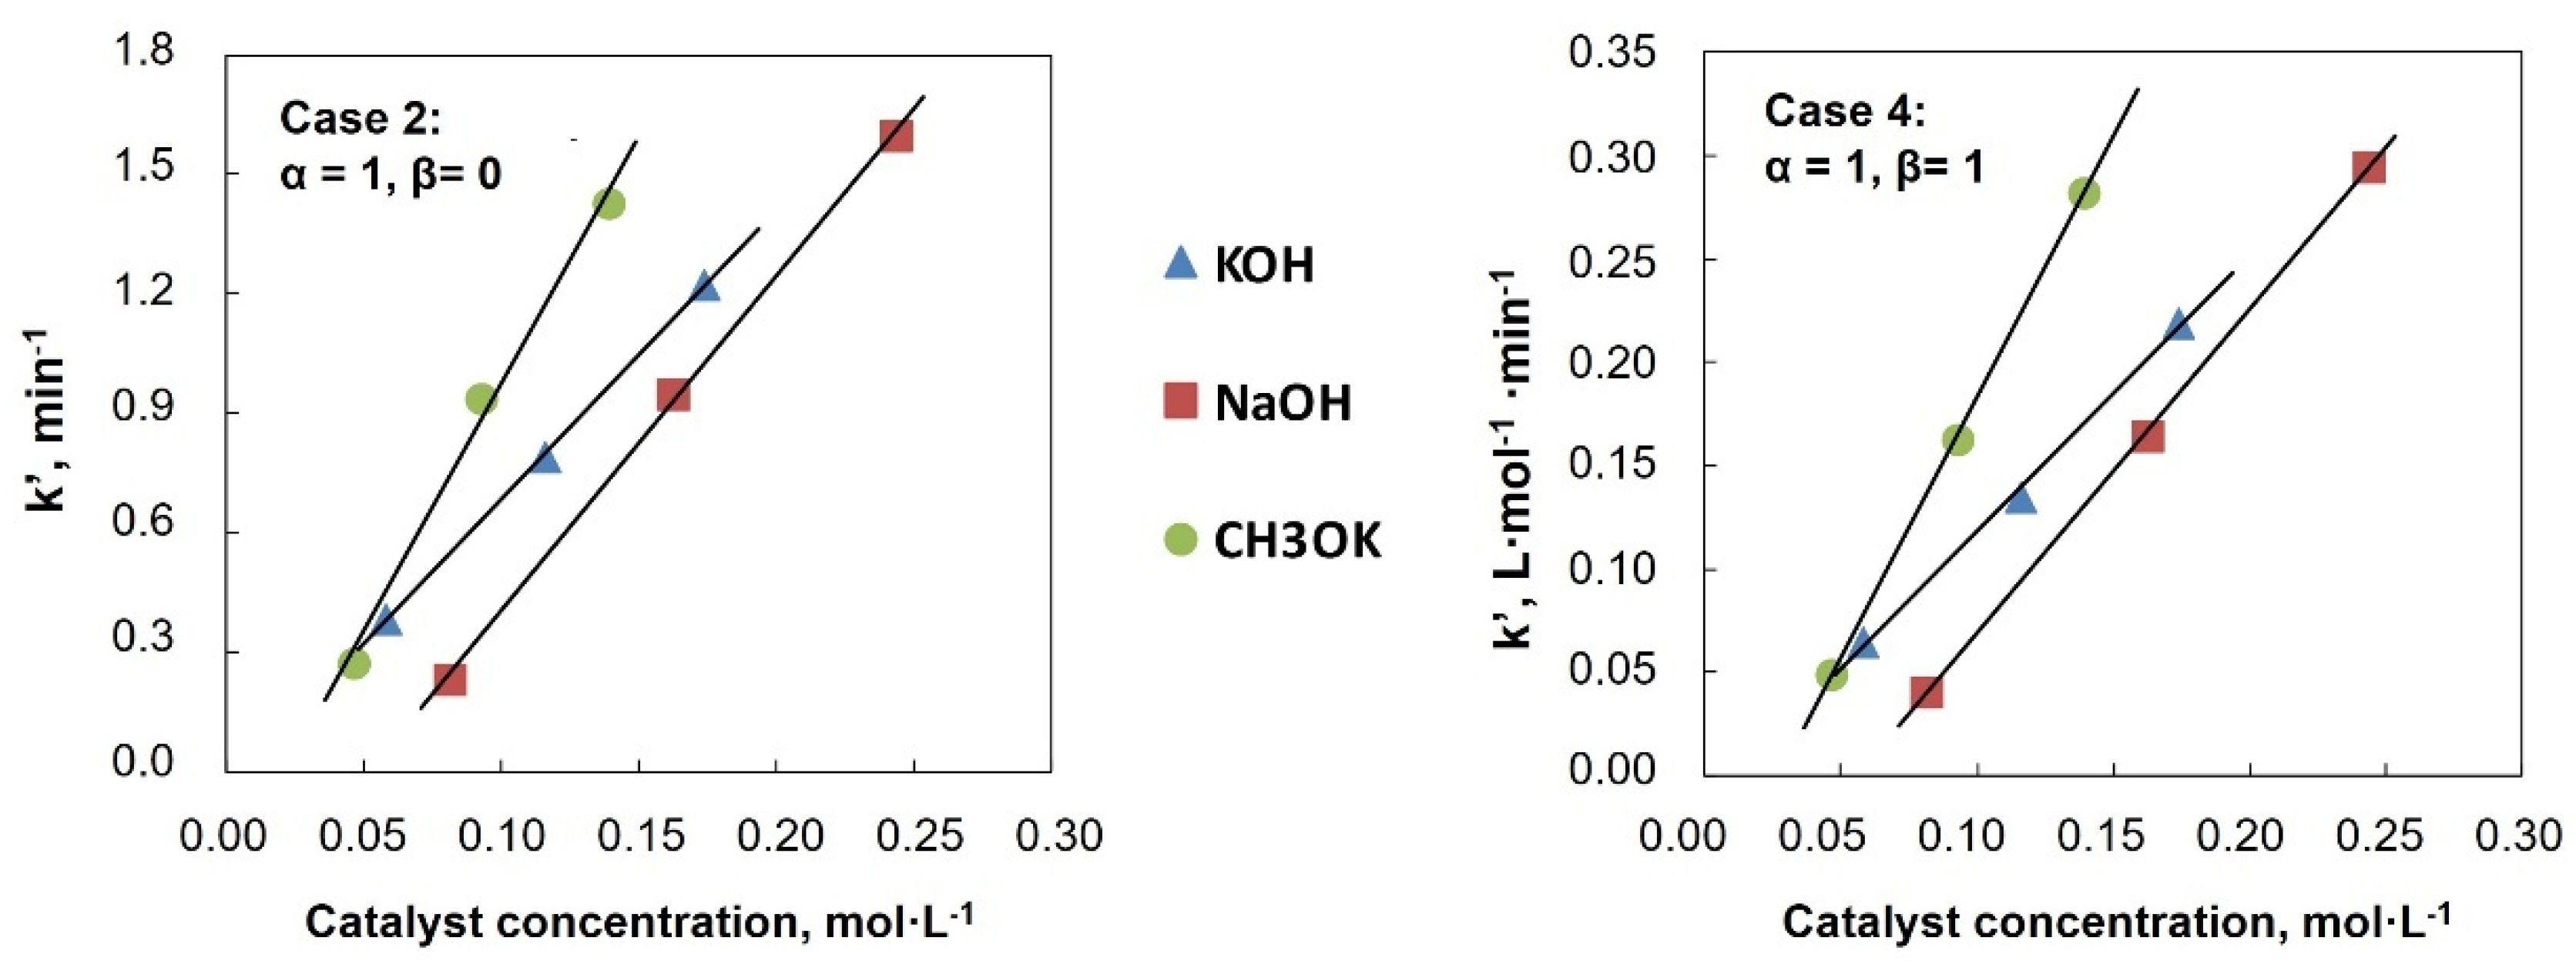
Considering the above, the representation of k′ values (included in Table 2) versus catalyst concentration should imply a line with an intercept and a slope corresponding to k2 and k1, respectively. Thus, Figure 3 shows the adjustment of Equation (15) to Cases 2 (Equation (9)) and 4 (Equation (11)), with the corresponding results regarding the least-squares adjustment included in Table 3.
According to these data, the kinetic constant corresponding to the non-catalytic contribution (k2) had a negative value. Although in the case of KOH this value can be considered negligible, for the remaining base catalysts, the interpretation of these results would lead to considering the absence of transesterification without a catalyst (zero non-catalytic contribution) or the possibility of a lower limit for the catalyst addition, below which the transesterification reaction does not take place, with this limit being higher in the case of NaOH.
On the other hand, when the catalyst concentration was expressed in molarity, CH3OK seemed to be the most effective catalyst, as inferred from k1 values. Other studies had observed a slightly higher activity for methoxides compared to hydroxides in transesterification reaction [32,33,34]. This behavior can be due to the negative effect of small amounts of water generated once hydroxides are dissolved in methanol, decreasing the yield in FAME production [33].
Finally, it should be pointed out that the values corresponding to the coefficient of determination were slightly higher for Case 4; that is, a second-order reaction (first-order for each reagent, α = 1, β = 1). In that sense, the fact that Case 2 showed good R2 values could indicate that, considering the experimental conditions, where reagent B was three times higher than the stoichiometric ratio (methanol:oil ratio of 9:1), the surplus methanol simplifies Case 4, obtaining Case 2; that is, a pseudo-first reaction order.
Following the above-mentioned procedure, a similar study was carried out for the transesterification through base catalysis with KOH, changing the methanol:oil ratio. In this case, the initial concentration of triglycerides (A) was kept constant, changing the initial methanol (B) concentration, and working with the same catalyst concentration (CCat, 1% w/w KOH), temperature (65 °C) and stirring rate (700 rpm). However, when the catalyst concentration was expressed in mol·L−1, it was lower when the methanol:oil ratio increased.
Thus, a higher methanol volume (higher ) implies a higher total reaction volume and, therefore, a higher dilution of the catalyst. For this reason, with the aim of comparing the results of the adjustment with the proposed kinetic model in this experimental set, the influence of the catalyst concentration was considered in Equations (9) and (11) (corresponding to Cases 2 and 4). Thus, taking into account Equation (15) and according to the results shown in Table 3 (and considering the non-catalytic contribution, k2, negligible compared to the catalytic contribution, k1), the combination of Equations (9), (11) and (16) results in Equations (17) and (18):
Table 4 shows the values of k1 and R2 obtained for the adjustments of Equations (17) and (18) for the selected experiments (varying methanol/oil ratio) in the initial time range (10 first minutes, until the chemical balance was achieved).
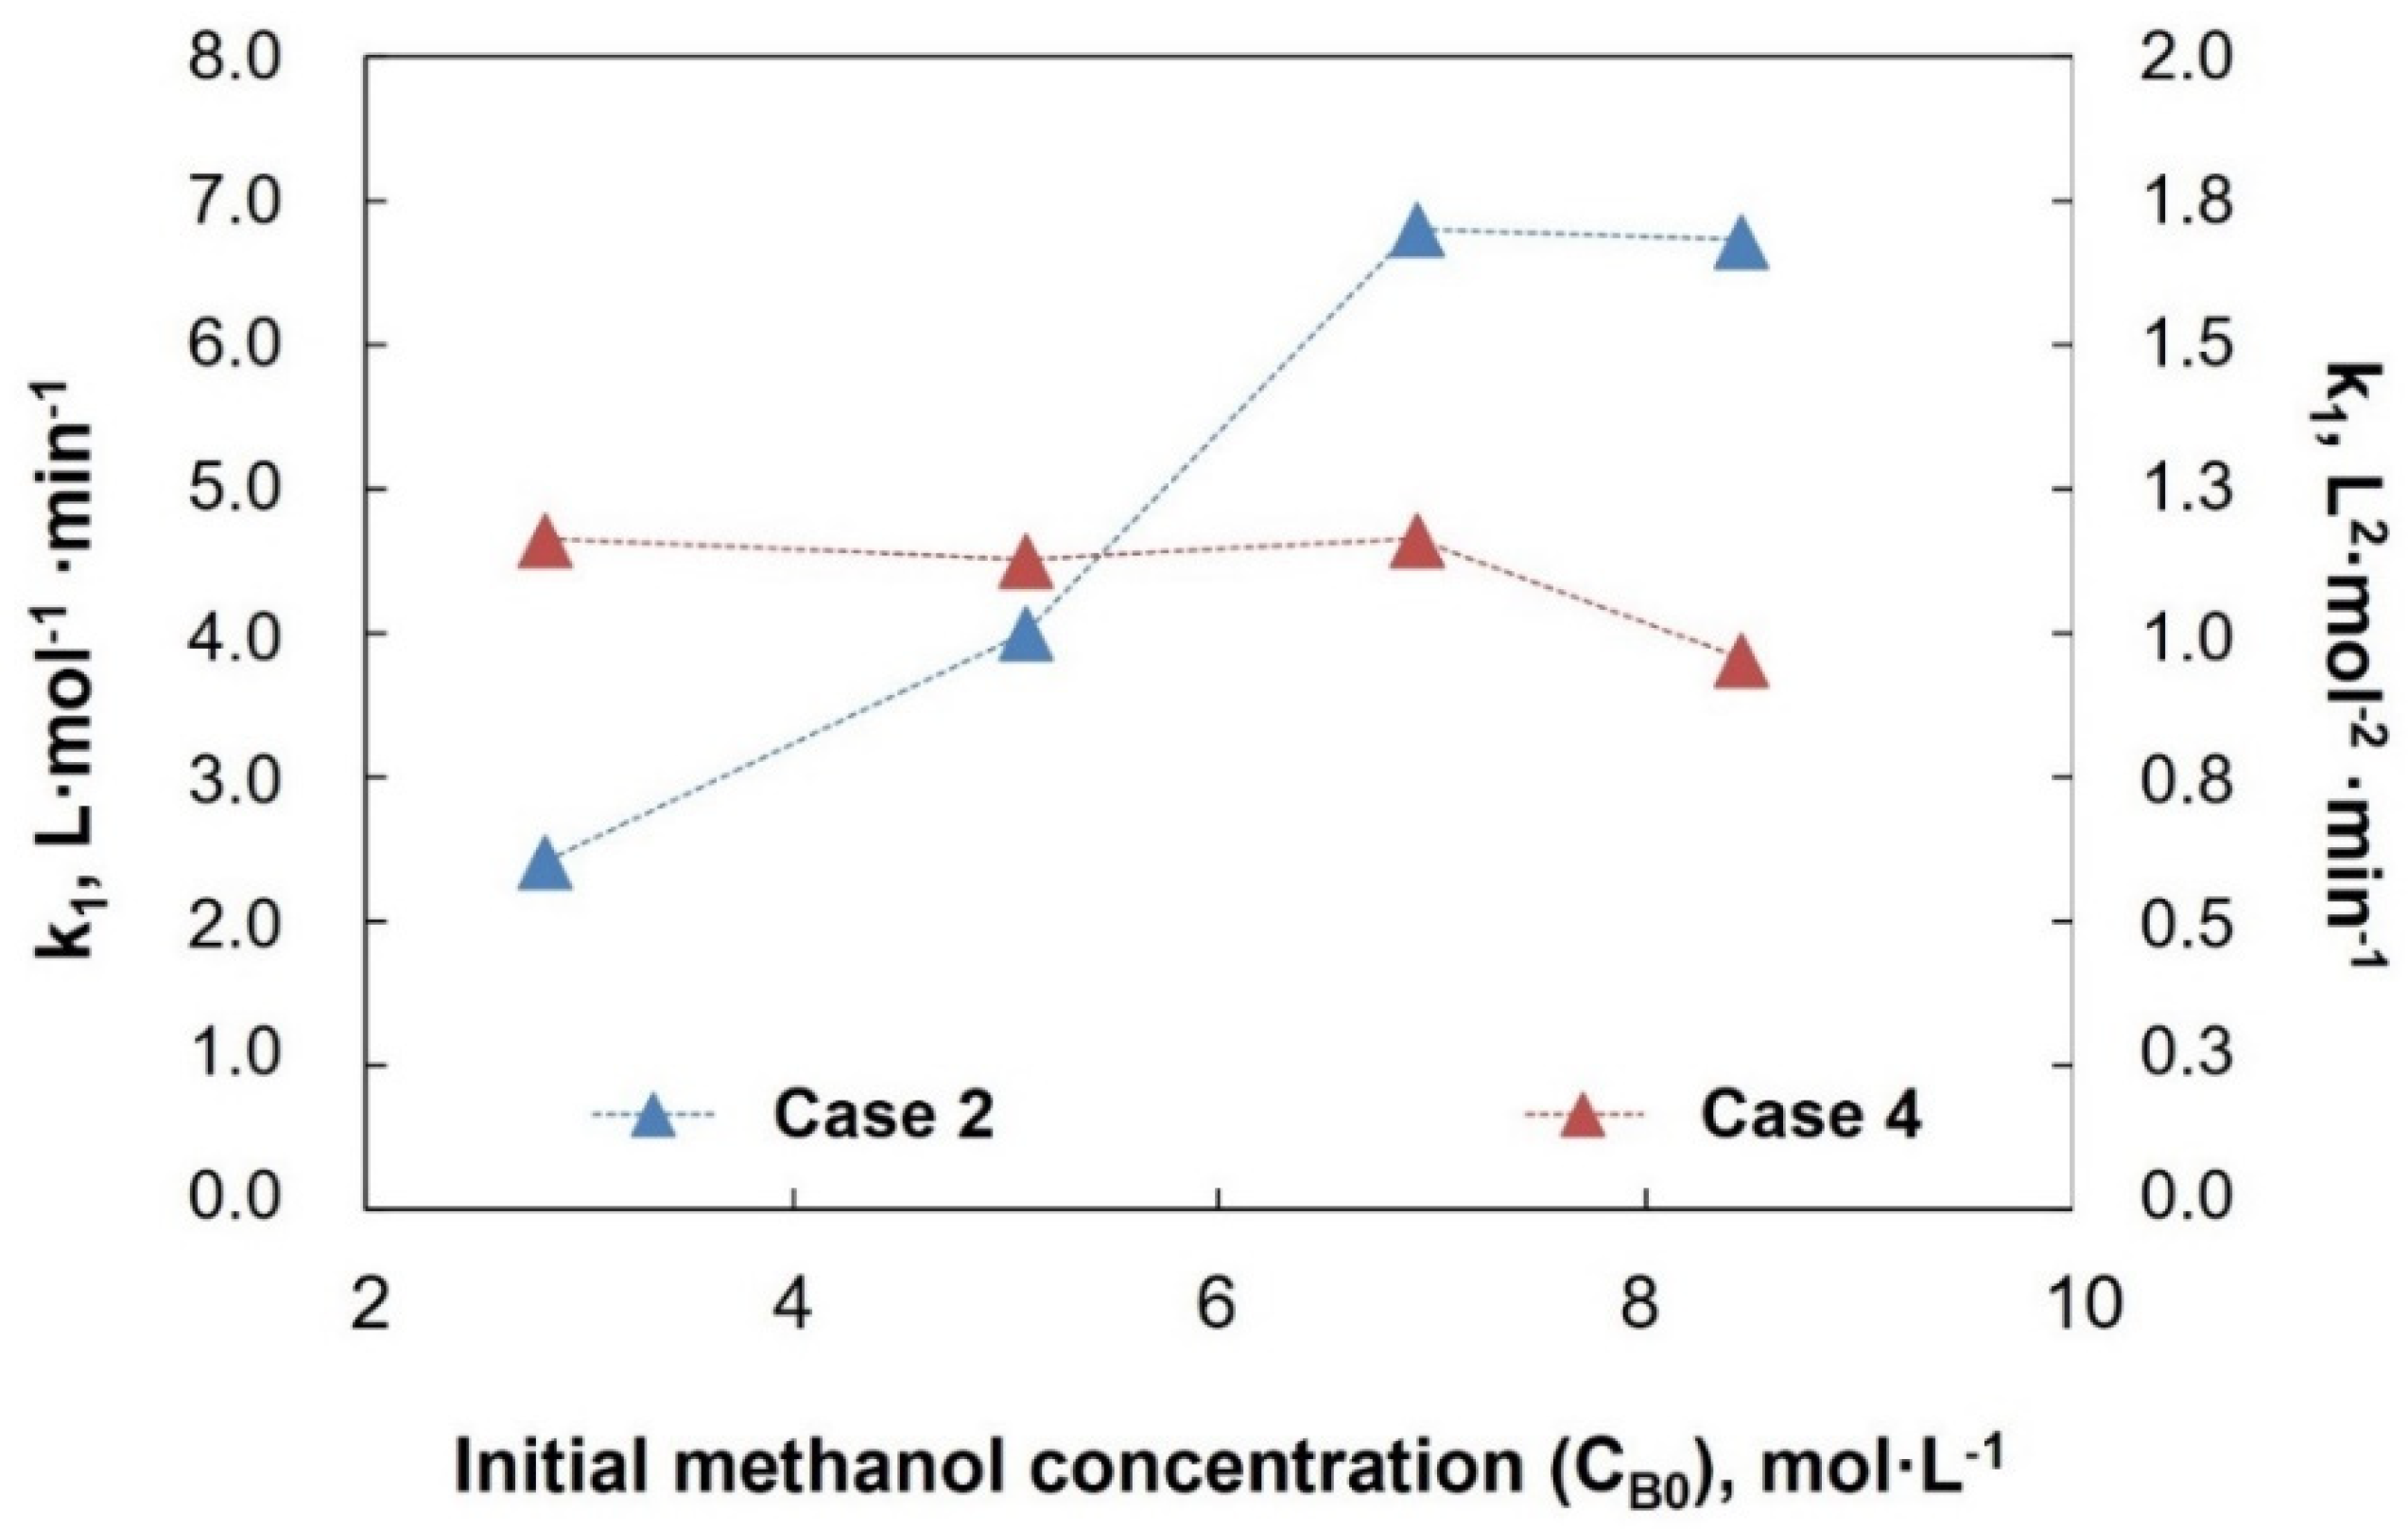
As inferred from the data included in this table, the determination coefficients showed the suitability of Equations (17) and (18) to represent the transesterification process in the chemical conditions tested. On the other hand, whereas the adjustment to Case 4 implied that the k1 value did not vary with the methanol:oil mole ratio (average value of 1.10 L2·mol−2·min−1, approximately), k1 increased with the initial methanol:oil ratio in Case 2, up to a 9:1 mole ratio, from which it was practically constant. The influence of the methanol:oil mole ratio on k1 is shown in Figure 4.
In conclusion, given that the kinetic constant must be constant, only depending on the reaction temperature, the results showed that the use of the kinetic model given by Case 4 (first-order for each reagent) was the one that best represented the kinetics of soybean oil transesterification through base catalysis for all the tested conditions. As it is assumed that the catalyst is not consumed during the reaction, the reaction rate can be defined as follows (Equation (19)):
In the case where the chemical conditions imply excess methanol (methanol:oil ratios above 9:1), a pseudo-first-order can be assumed, complying with Case 2, as shown in Equation (20):
Once the kinetic expression for the transesterification reaction of soybean oil through base catalysis was determined, the influence of the temperature on kinetics was studied. This way, as mentioned above, the experimental data corresponding to soybean oil transesterification with KOH as a catalyst at different reaction temperatures (35, 45, 55, 65 and 72 °C) were adjusted to Cases 2 and 4 (Equations (9) and (11)). Once the k values were obtained through these models, k1 was finally determined. At 65 °C, an average k1 value was selected for Cases 2 (methanol:oil ratios exceeding 9:1) and 4 (experiments at different KOH concentrations and methanol:oil ratios). The results are included in Table 5.
Once the kinetic constants were calculated at different temperatures for both cases, the activation energy was calculated through the Arrhenius equation (Equation (21)):
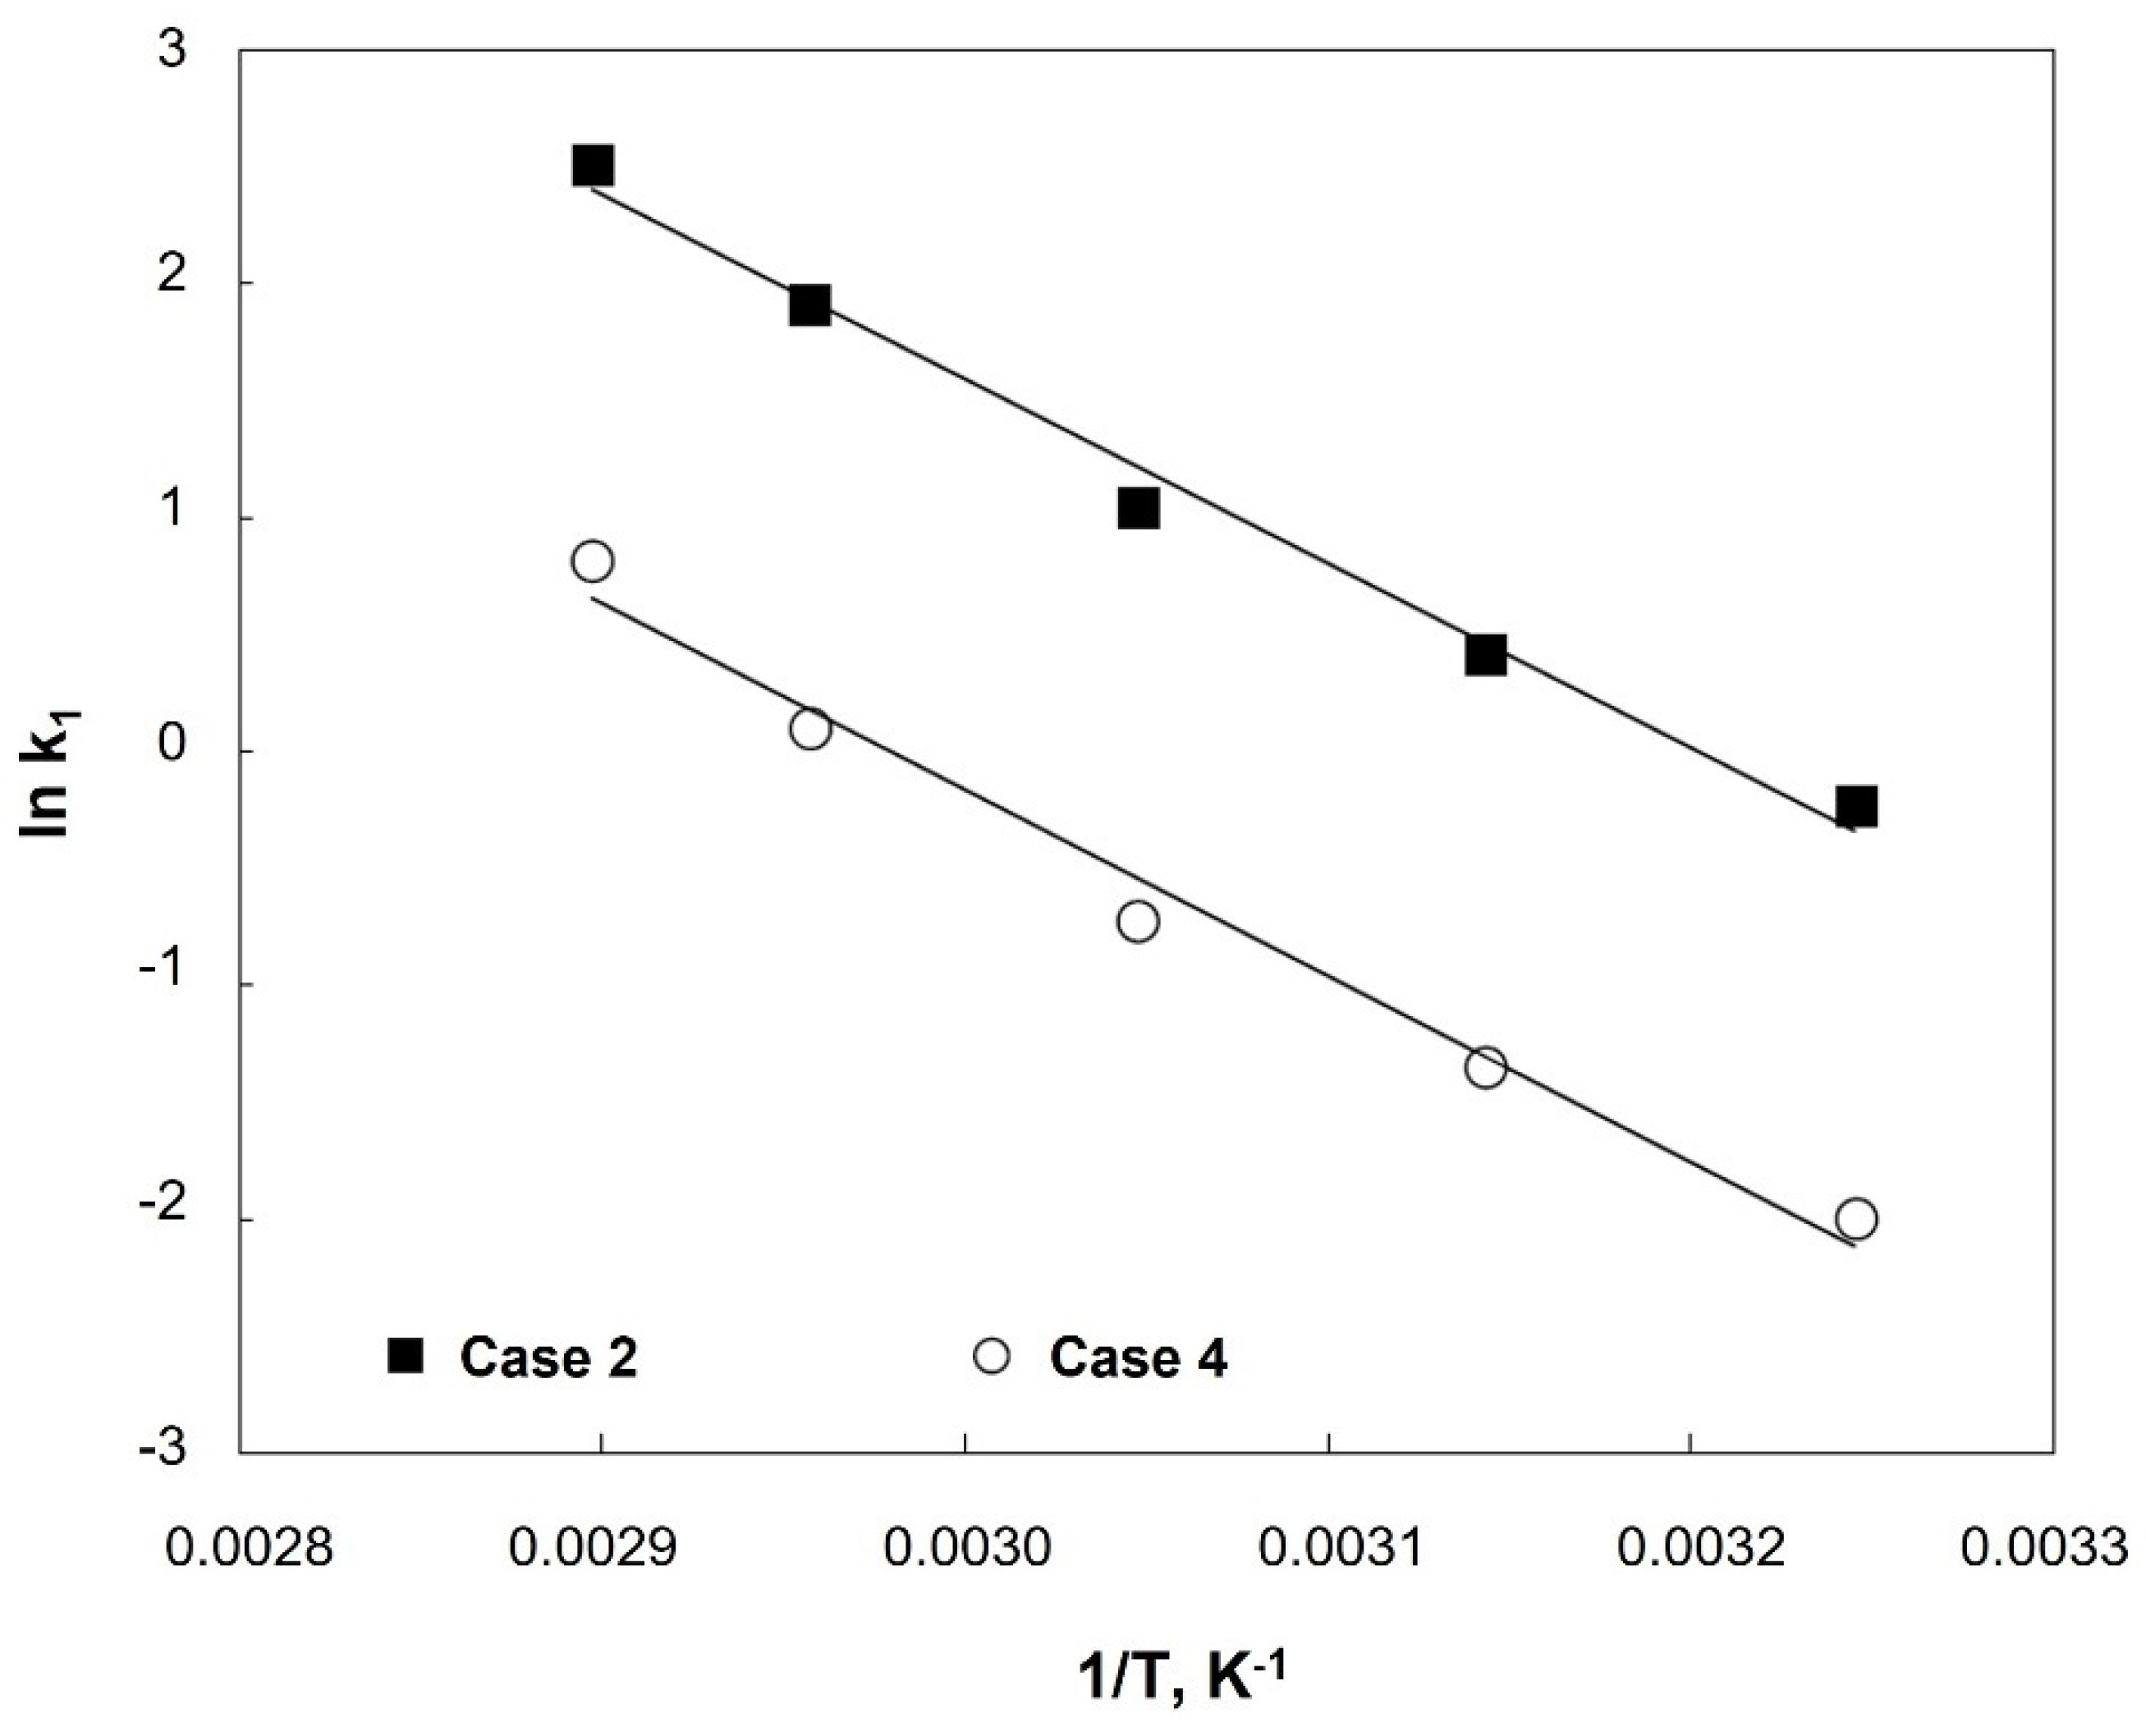
where EA is the activation energy (kJ·mol−1), R is the universal gas constant (kJ·mol−1·K−1), T is the average temperature (K) and A0 is the pre-exponential factor. Figure 5 shows the influence of temperature on kinetic constant, and the subsequent results corresponding to its adjustment to the Arrhenius equation are included in Table 6.
As expected, the activation energies were the same, regardless the model used, as long as these operating conditions were considered (methanol:oil ratios exceeding 9:1 for Case 2). Concerning the Ea values, they are within the range determined in the literature (see Table 7), with kinetic models where the mechanism of three reactions in series was used for transesterification, considering a second-order reaction (first-order for each reagent).
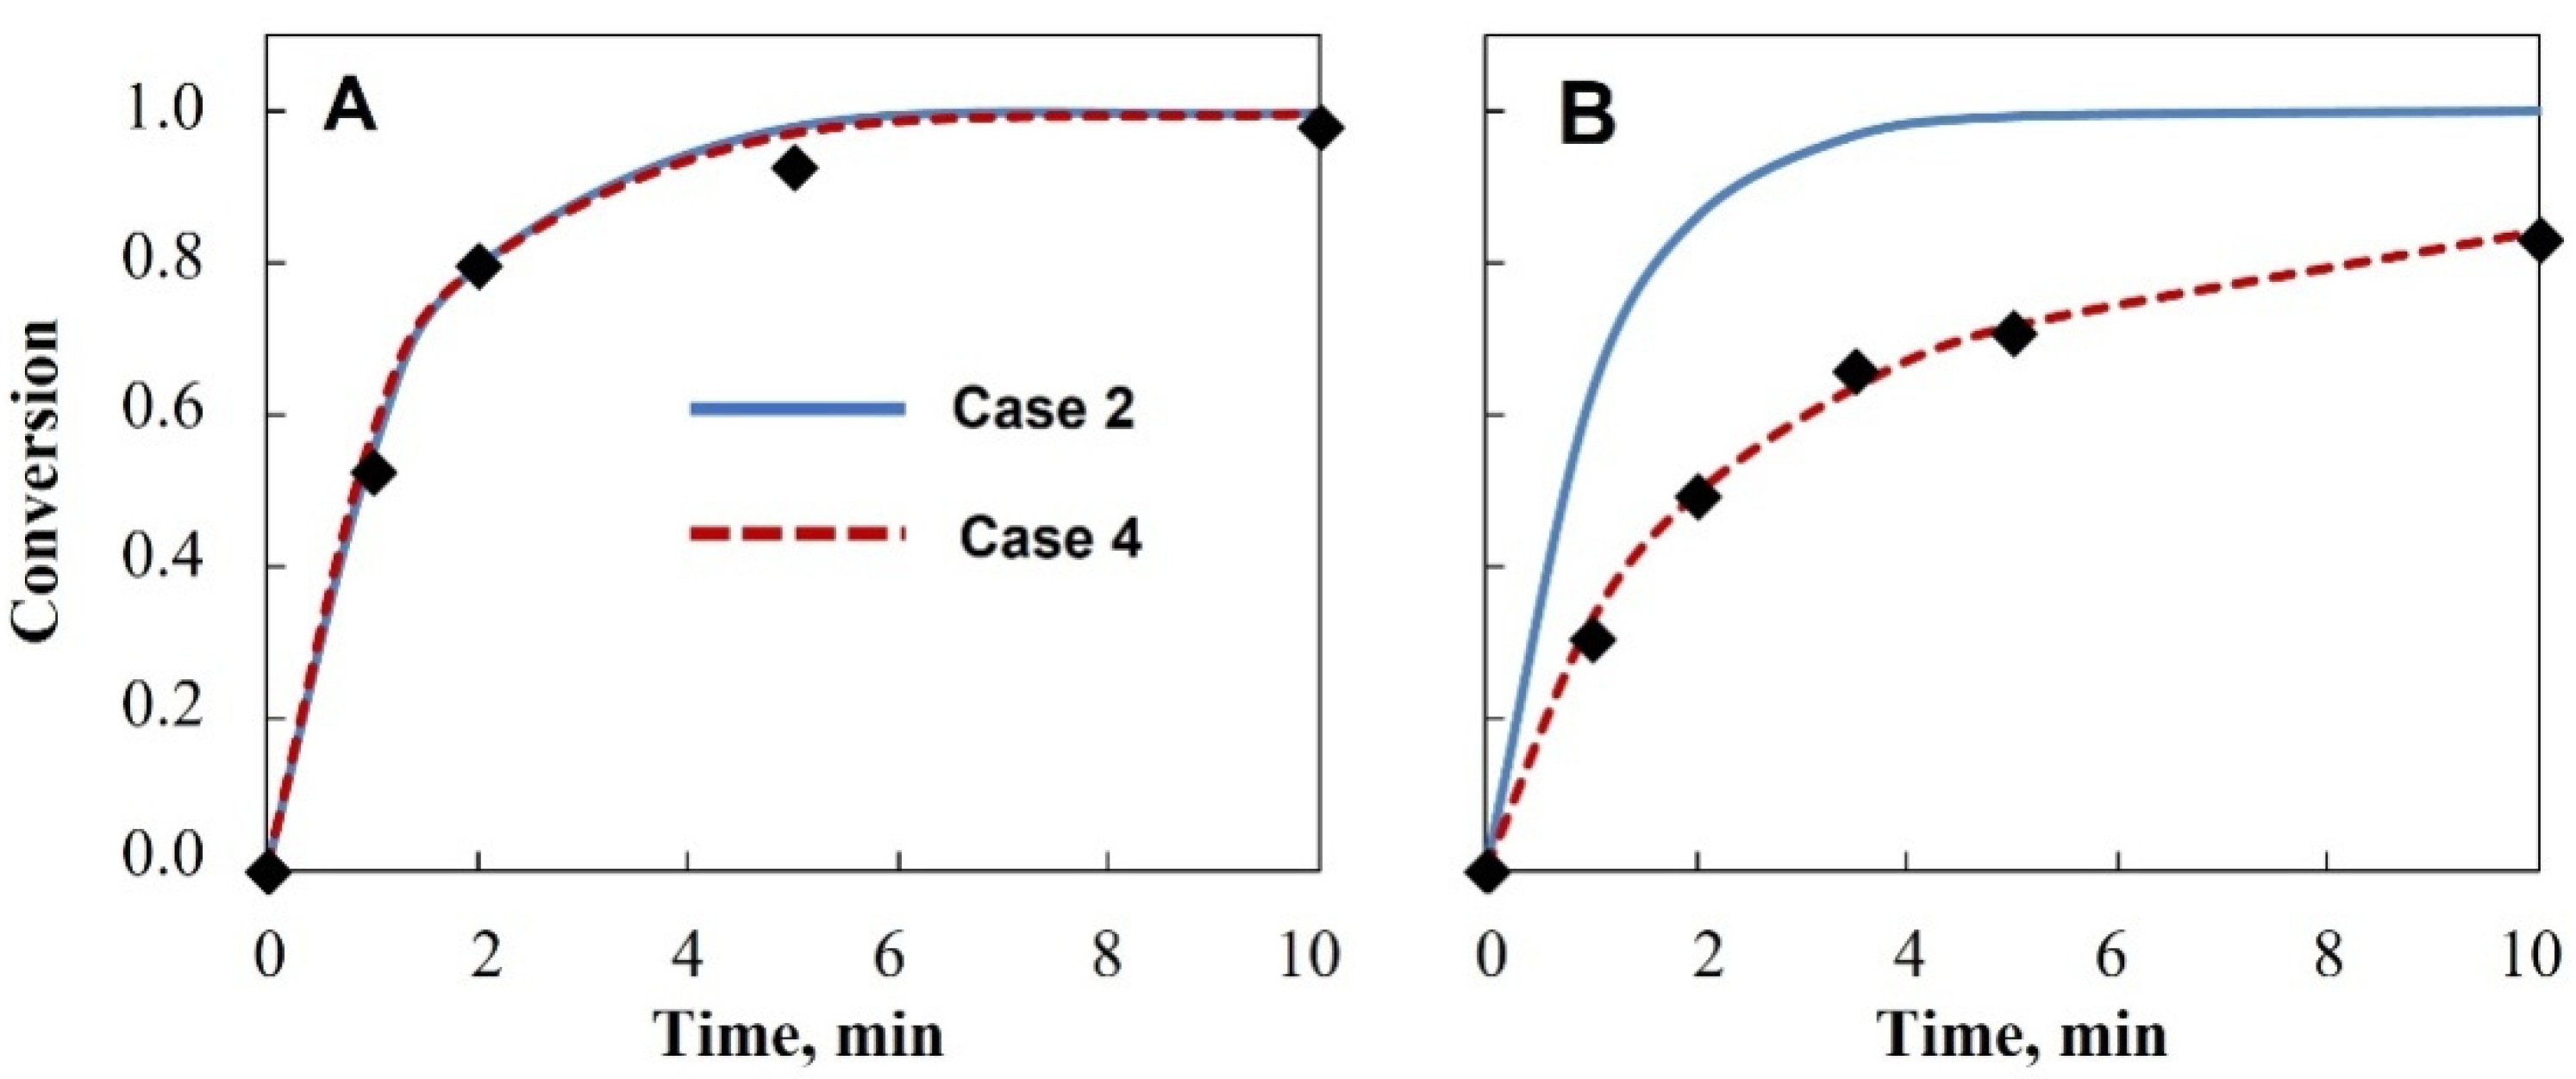
Finally, Figure 6 shows the experimental evolution of the conversion for two experiments (shown as examples), comparing with predicted values obtained by Cases 2 and 4.
As inferred from this figure, Case 4 represented more exactly the experimental data for the experimental set included in this study. This difference between both cases was noticeable for the experiments where low methanol:oil ratios (<9:1) were selected. This was due to the fact that, as previously checked, Case 2 was not valid in these circumstances.
Finally, once the best chemical conditions were selected for soybean biodiesel production (1% w/w KOH, 9:1 methanol/oil ratio, 65 °C, 700 rpm and 120 min), a final FAME content of 97.6% was obtained, complying with the standards, with the following FAME profile: 52.1% methyl linoleate, 25.1% methyl oleate, 10.6% methyl palmitate, 5.91% methyl linolenate, 3.20% stearic acid and 3.09% others. It should be noted that, during the different stages of transesterification, the FAME profile did not change. Equally, when different catalysts were used, the FAME profile did not present significant differences (data not shown).
2.2. Acid Catalysis
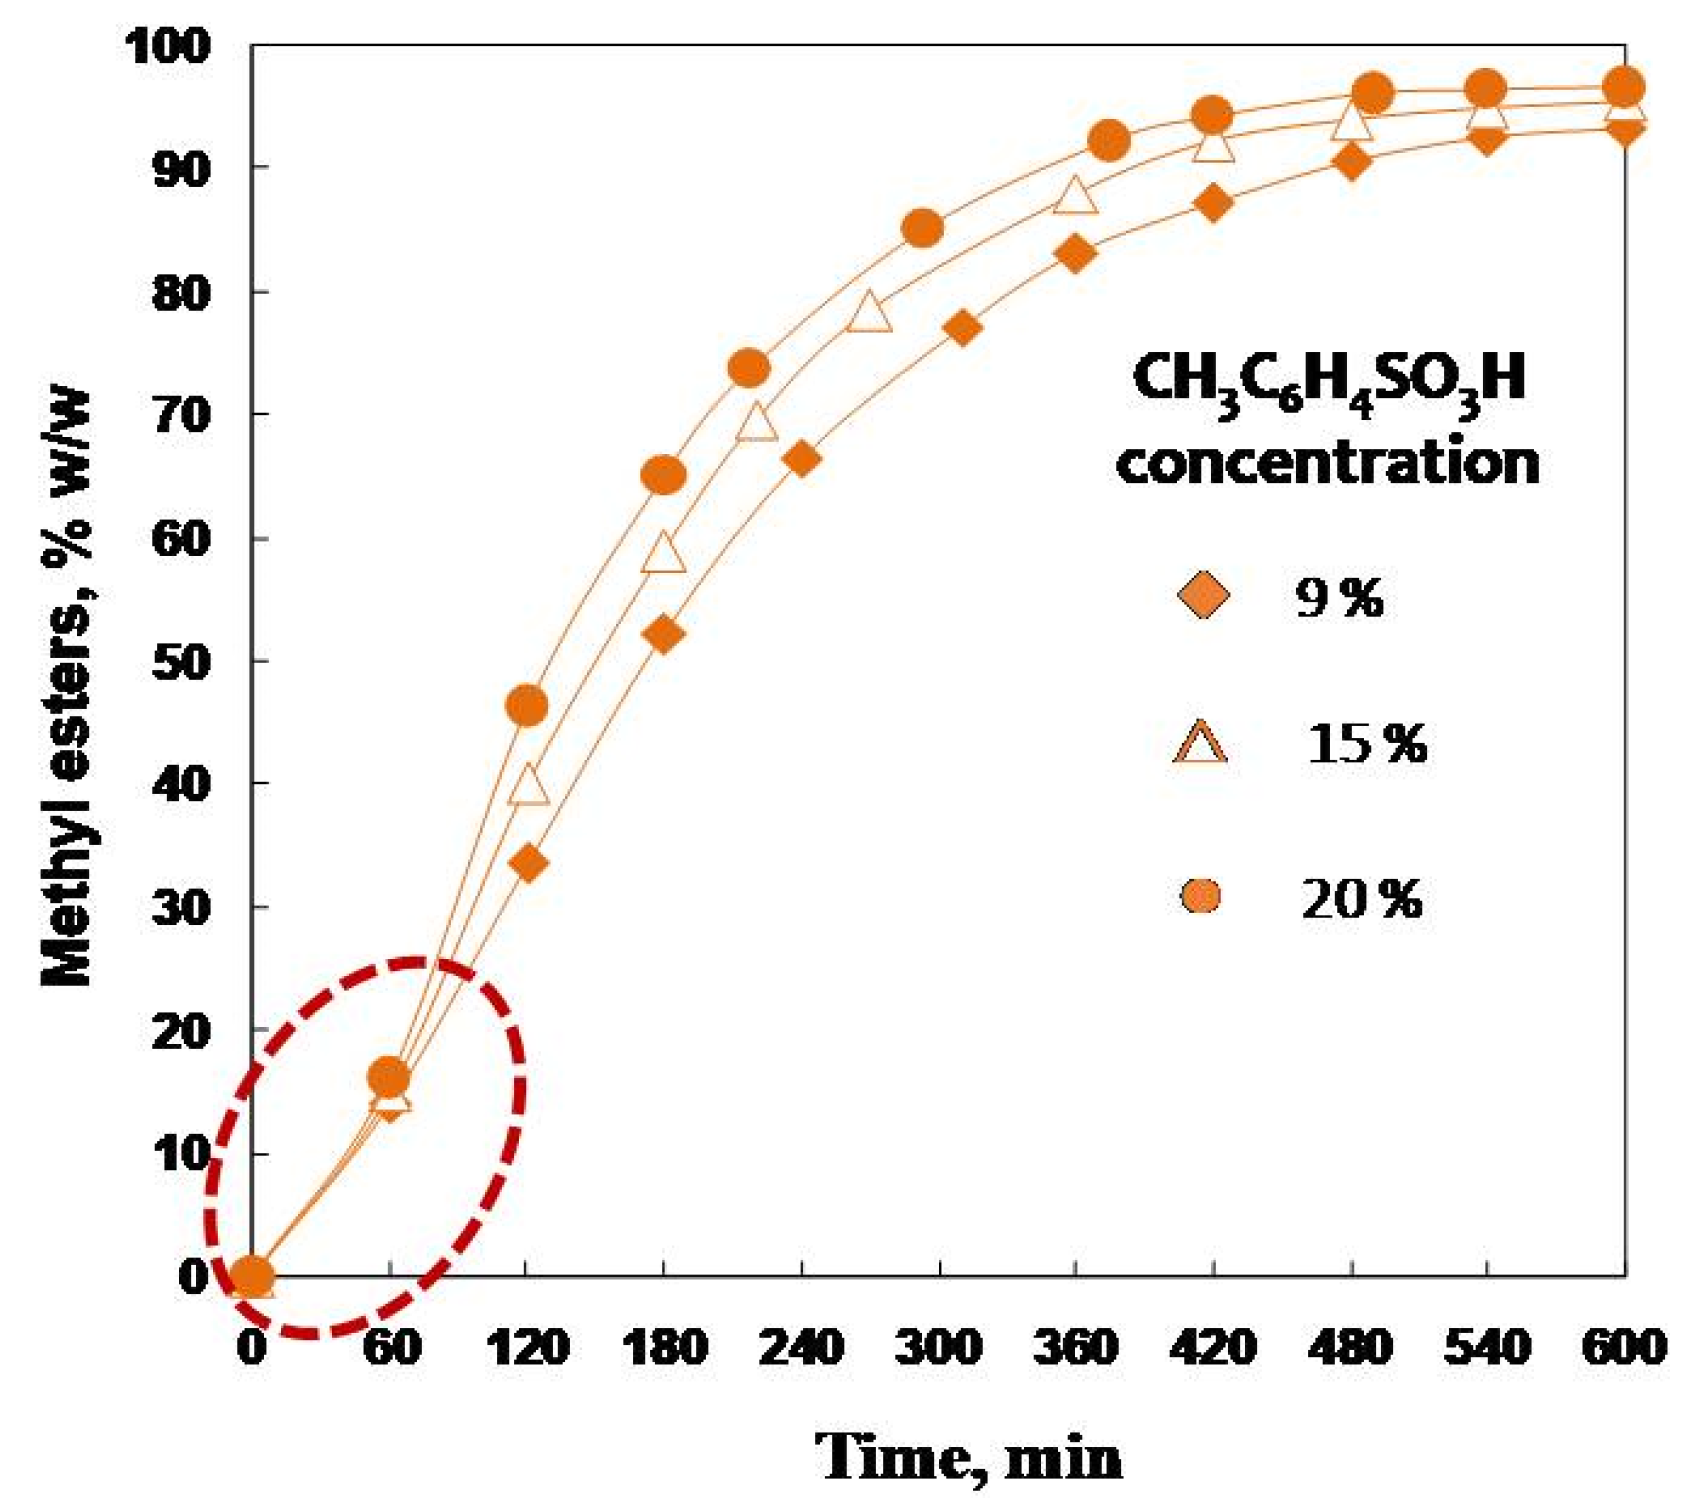
The effect of acid catalysts is shown in Figure 7 in the case of p-toluenesulfonic acid at different concentrations (9%, 15% and 20% w/w). The increase in methyl ester content was not as abrupt as in the case of base catalysis, requiring longer reaction times (up to 9–10 h) to obtain similar conversions, as observed in previous studies where sulfuric acid was compared to other base catalysts, such as sodium hydroxyde and sodium ethoxide, applied to the transesterification of Terminaliacattapa L. and Moringa oleifera oils [37,38]. As the catalyst concentration increased, the reaction rate was higher, reaching higher FAME yields at shorter reaction times.
In addition, as it can be observed, acid homogeneous catalysis of soybean oil transesterification had an initial induction period (red dashed circle in Figure 7). This period could be due to diffusion phenomena of reagents between the phases [39,40,41], which were more pronounced in acid catalysis. Due to this fact, in order to use the same models applied to base catalysis, the time range due to the chemical reaction control was considered (where the reaction rate will be given by the chemical reaction); that is, once this induction period ended and until the chemical balance was achieved. This approach would allow the adjustment of these data to the kinetic model. Thus, Equation (7) can be integrated, considering Cases 2 and 4, resulting in the following (Equations (22) and (23)):
where Xi is triglyceride conversion at a certain time ti (before the chemical equilibrium) and X1 is triglyceride conversion at the beginning of the period corresponding to the control of the chemical reaction (t1).
The kinetic study of acid catalysis was carried out following the same procedure explained for base catalysis, adjusting Equations (22) and (23) to different experimental data (varying the kind of catalyst and their concentration). Table 8 shows the main results, including k and R2.
As inferred from this table, and similarly to the base catalysis, both pseudo-first and second reaction orders showed good determination coefficients for all the catalysts tested in this experience, with lower values for the pseudo-kinetic constant, as expected. On the other hand, it can be checked that, for the same catalyst, the kinetic constant increased as catalyst concentration was higher and, therefore, in this case, it would also be an apparent kinetic constant, k′, depending on catalyst concentration (Ccat), according to Equation (15). Nevertheless, the influence of catalyst concentration was lower compared to base catalysis and, therefore, k2 (non-catalytic constant) could not be considered negligible compared to k1 (see Table 9).
As in the previous subsection, in order to confirm which case (Cases 2 and 4) best fits to the behavior observed in transesterification experiments through acid catalysis, different experiments with different methanol:oil ratios for the most efficient catalyst were carried out (keeping the rest of parameters constant; that is: catalyst concentration, 0.337 mol·L−1 CH3C6H4SO3H; Temperature, 65 °C; and stirring rate, 700 rpm). As in these experiments, the same catalyst concentration was selected, the k′ values were compared instead of the corresponding ones to the evolution of the constant with Ccat (k1 and k2). The results are shown in Table 10.
Thus, the second-order model (Case 4) was not suitable to represent the experimental data, as k′ should be independent of the methanol:oil ratio, as it happened in Case 2, with an average k′ of 5.76·10−4 min−1. As a consequence, the model representing the pseudo-first reaction order was suitable for the kinetic behavior of the transesterification of soybean oil through acid catalysis with p-toluenesulfonic acid for the tests included in this experience. This could be due to the high methanol concentrations used, clearly exceeding the stoichiometry of the process (methanol:oil ratio of 3:1).
Further, the influence of temperature for acid catalysis was studied, determining the value of k′, through the adjustment to Equation (22) for the experiments with different reaction temperatures. The rest of the parameters were kept constant, as explained in Table 11.
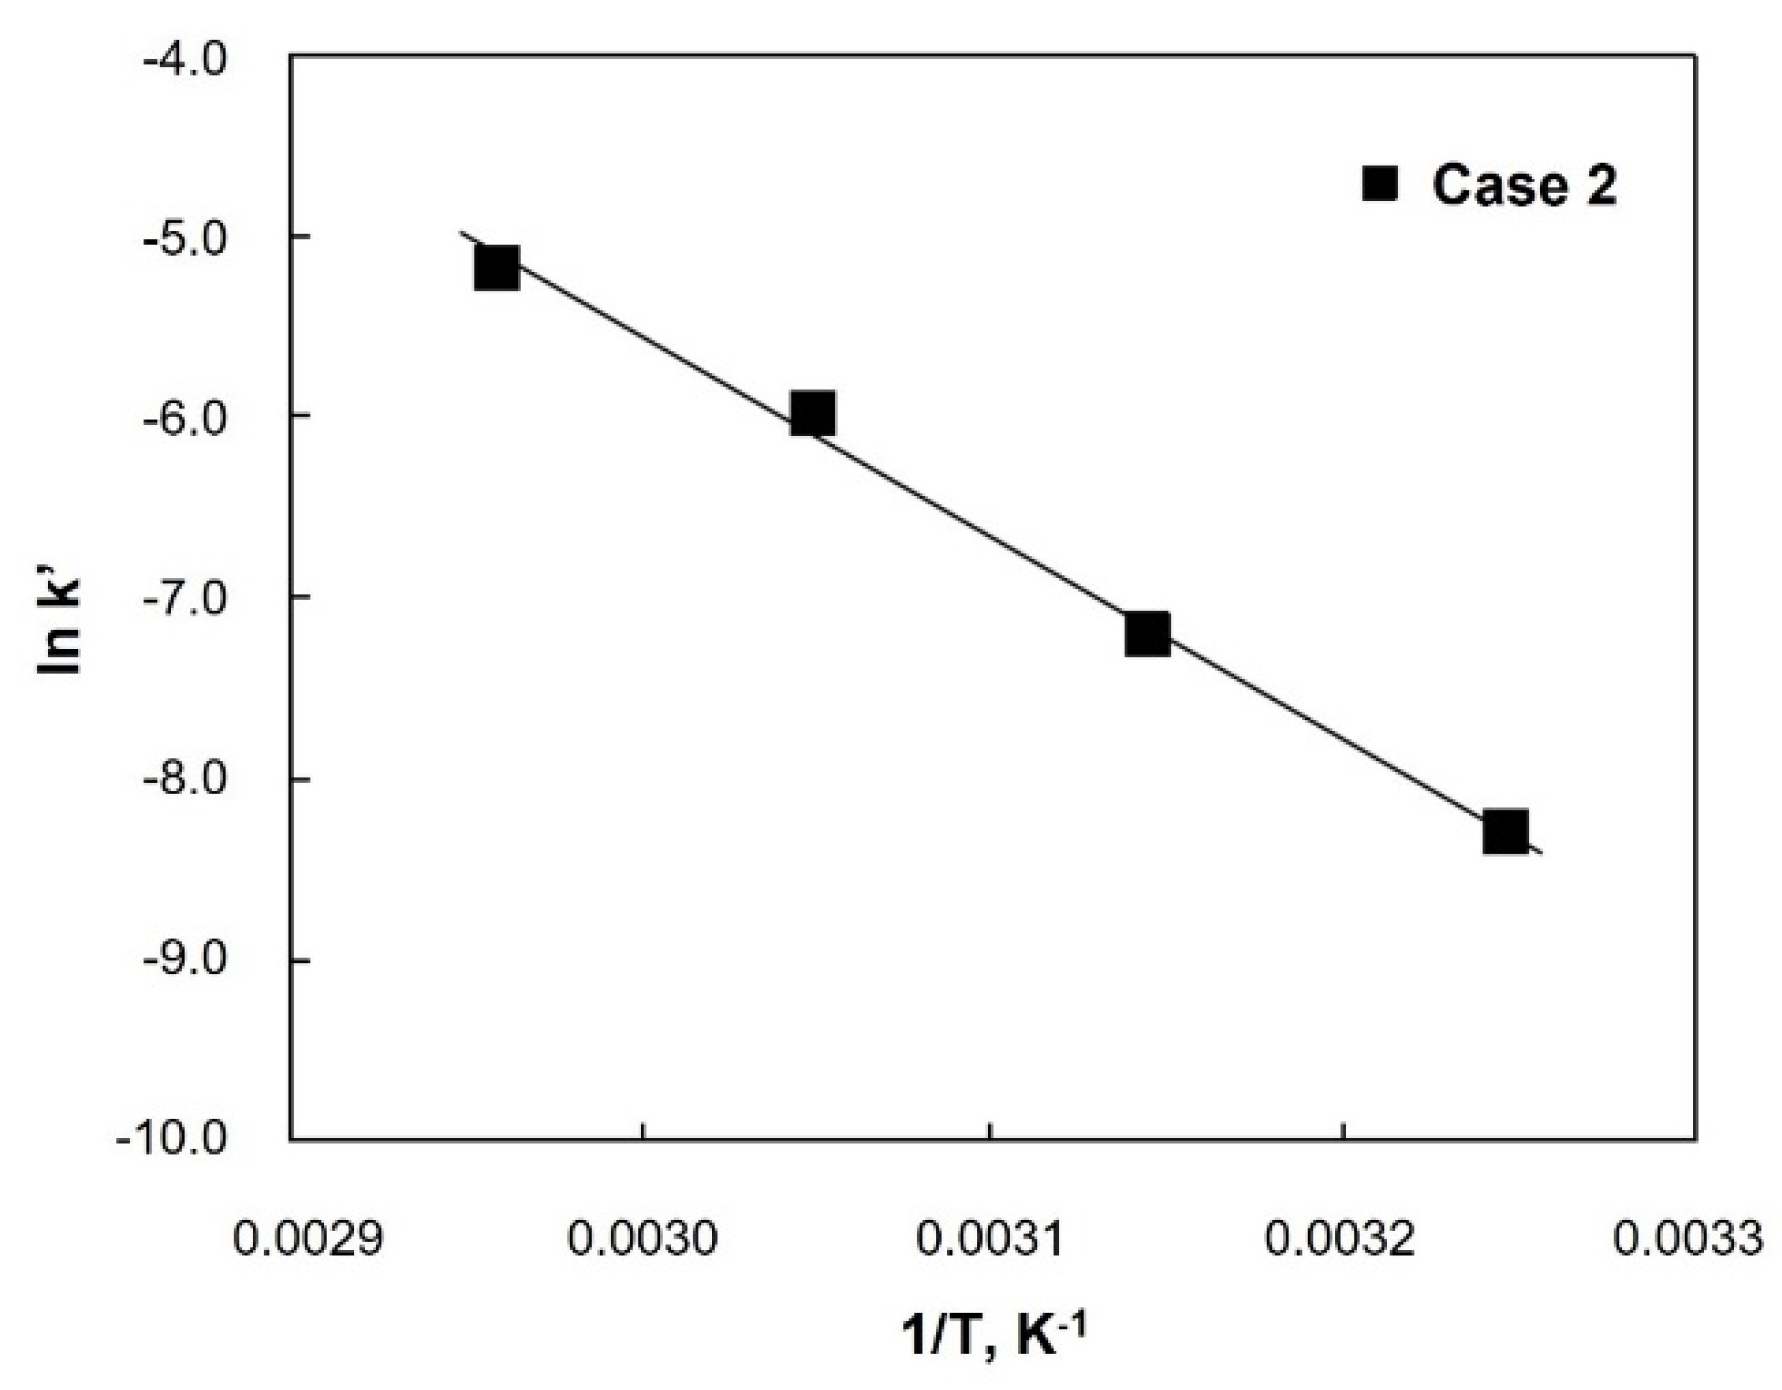
Finally, Figure 8 shows the influence of temperature on k′, and its adjustment to the Arrhenius equation (Equation (21)). As a result, the activation energy obtained (EA) was 92.3 kJ·mol−1 (R2 = 0.996), a higher value (as expected) compared to the experiments corresponding to base catalysis (with an average value of 65.7 kJ·mol−1).
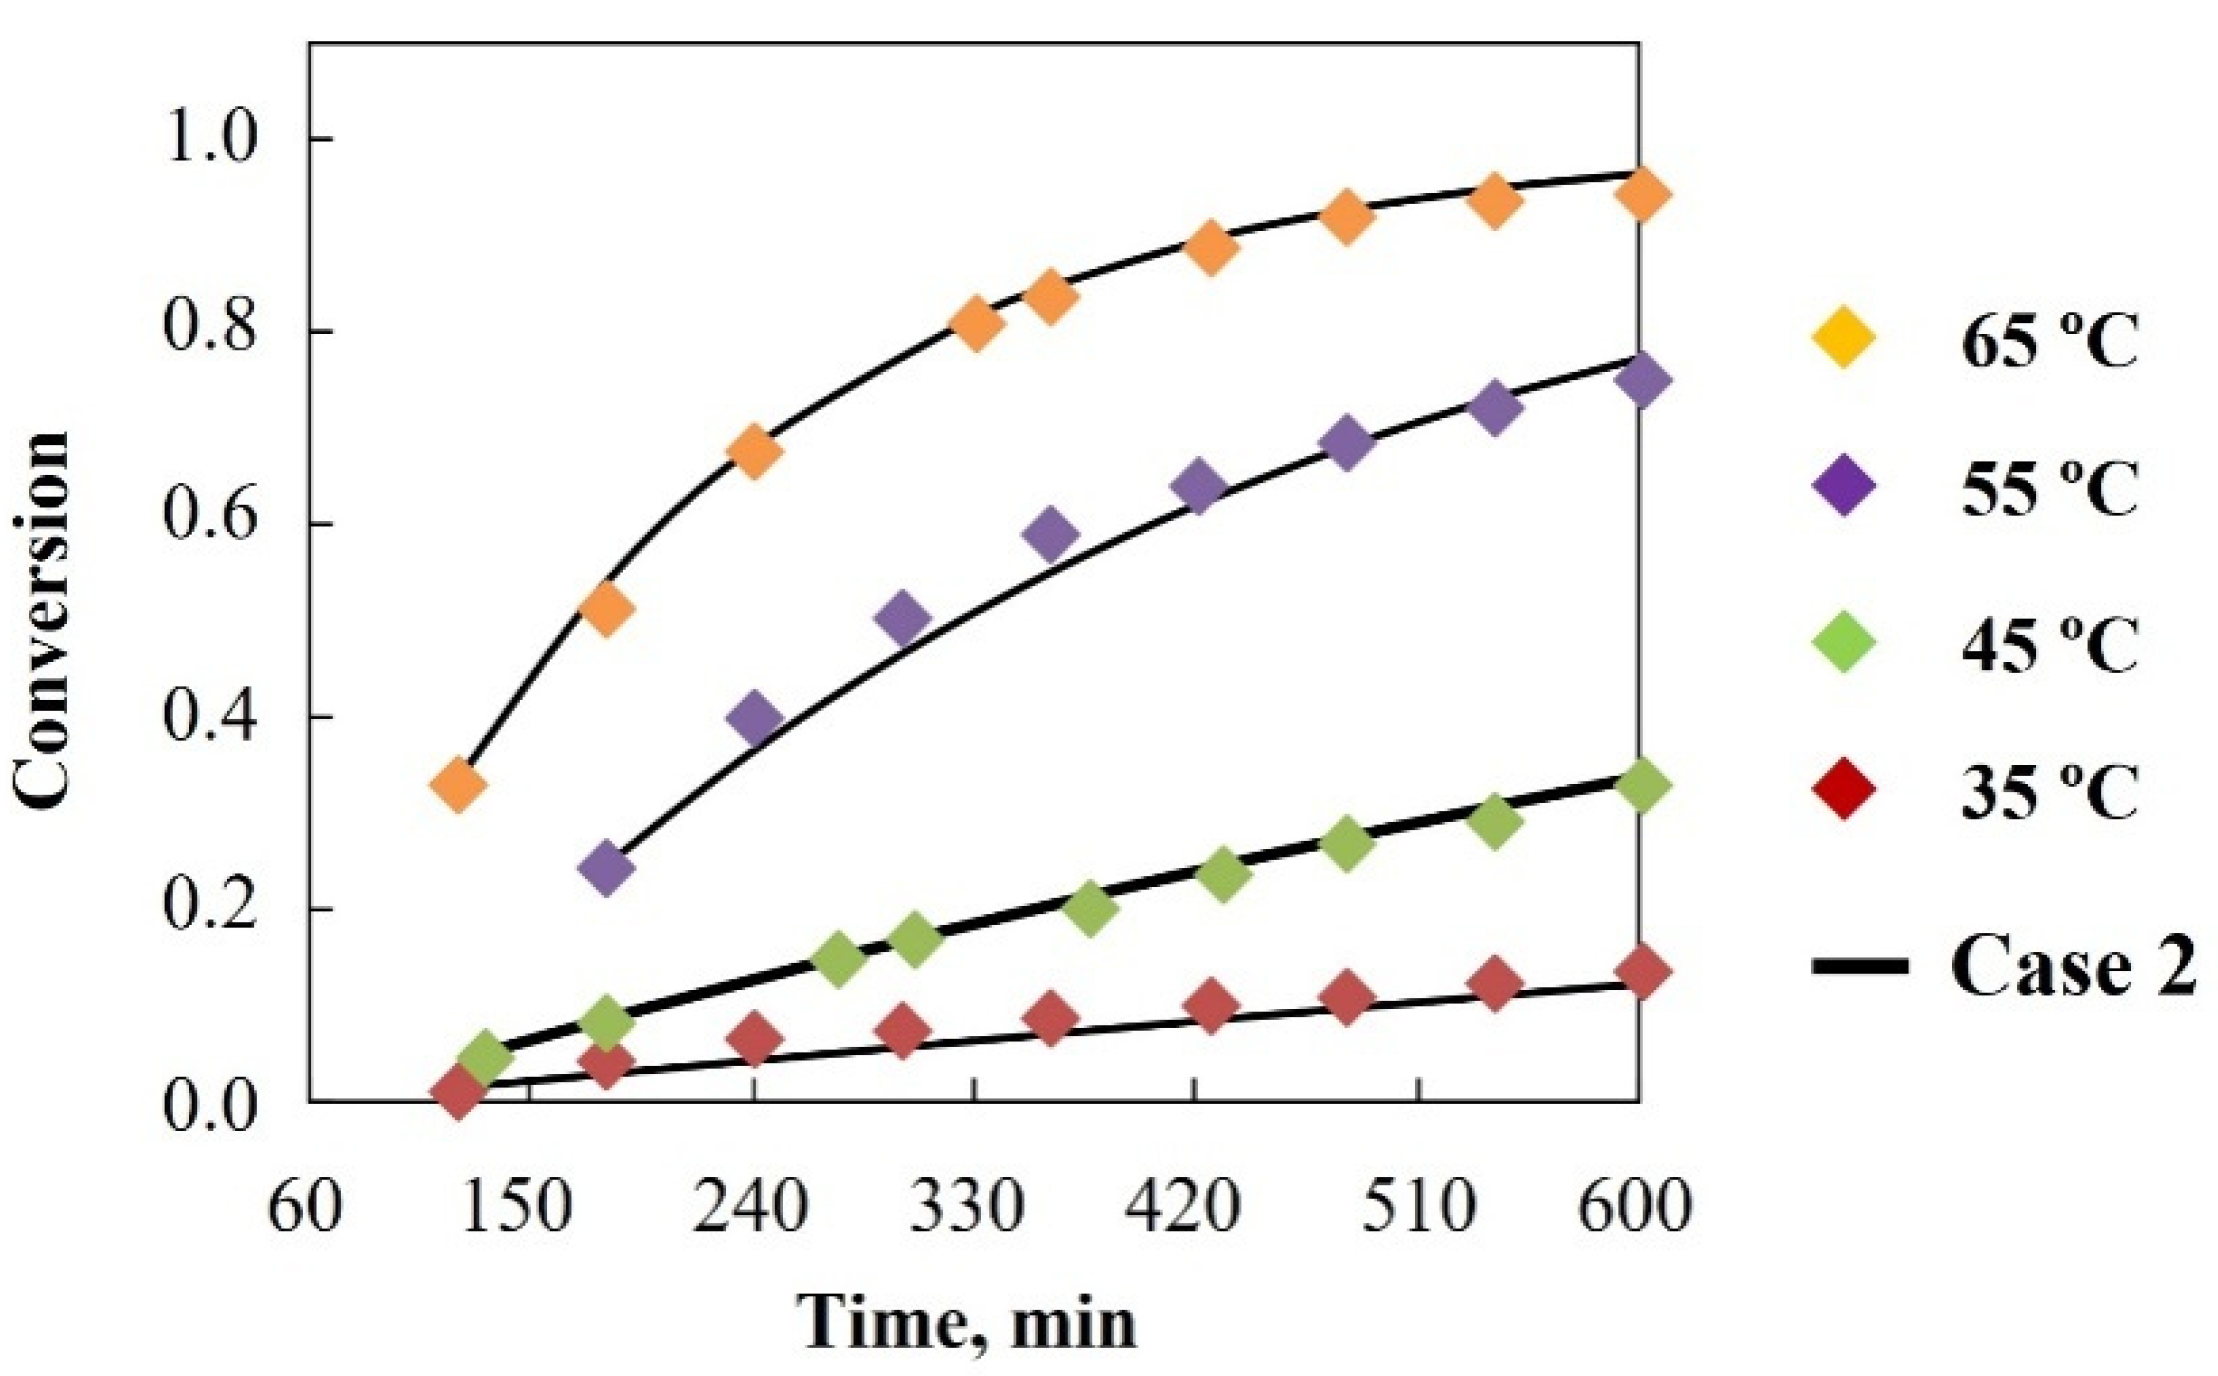
Considering the EA values, Figure 9 shows the experimental evolution (and predicted values) for some experiments carried out (at different reaction temperatures) for acid transesterification of soybean oil using CH3C6H4SO3H as a catalyst, where the good results of the applied model (Case 2) are observed.
3. Materials and Methods
3.1. FAME Production through Homogeneous Catalysis
3.1.1. Raw Material
Soybean oil was used for biodiesel production. It was provided by the “Agrarian Research Institute Finca La Orden-Valdesequera”, from CICYTEX (Centro de InvestigacionesCientíficas y Tecnológicas de Extremadura). The seeds were collected in the 2021 season, and the oil was obtained through mechanical extraction (without any chemical treatments). The oil had free fatty acid content below 3% and moisture below 1% (avoiding the subsequent hydrolysis and free fatty acid generation), and it was filtered and stored in 25-L containers for further processing.
3.1.2. Transesterification Reaction
FAME synthesis, including the main steps and experimental facilities, is explained elsewhere [42,43]. Briefly, 250 g of soybean oil was added to a three-necked reactor, adding the corresponding amount of methanoland reaching a certain temperature and stirring rate. Once the reaction parameters were achieved, a suitable amount of homogeneous catalyst (acid or base) was added. The reaction took place for 180 min. In order to monitor the process, 2 mL of sample was collected and filtered at certain reaction times, cooling it down for FAME quantification through gas chromatography determination according to the UNE-EN 14214 standard [44]. In short, aVARIAN 3900 chromatograph was used (VARIAN, Palo Alto, CA, USA), provided with a flame ionization detector and employing a silica capillary column (30 mm long, 0.32 mm internal diameter, 0.25 µm film thickness). The carrier gas was helium (Linde, Dublin, Ireland) at a flow rate of 0.7 mL·min−1. The injector temperature was kept at 270 °C, and the detector temperature was 300 °C. The temperature program started at 200 °C, increasing at 20 °C·min−1 up to 220 °C. Heptane was used as a solvent, and methyl heptadecanoate was used as an internal standard. All the standards were provided by Sigma-Aldrich (St. Louis, MO, USA). This way, catalytic activity was determined by obtaining the transesterification yield. When biodiesel exceeded the lower limit established by the standard (that is, 96.5%), it also complied with most quality standards (including viscosity, density, cold filter plugging point, etc.). These data were not shown in this study, which was basically focused on kinetic parameters.
3.2. Kinetic Study
For the kinetic study, transesterification of soybean oil with methanol by using base (KOH, NaOH and CH3OK) and acid (H2SO4, H3PO4 and p-toluenesulfonic acid, CH3C6H4SO3H) catalysis was carried out at different catalyst concentrations and temperatures. More details about the description of the kinetic study are provided in the Results and Discussion section in order to make the reasoning of the article easier.
The progress of the transesterification reaction has been monitored through the increase in FAME (product C in Equation (1)), which was analyzed and quantified through gas chromatography, expressed as mC/mTotal (g/g). Thus, the C concentration needs to be related to the conversion (X) of the main substrate (triglycerides, A), hence the value of mTotal should be known at every reaction time.
According to the characteristics of the chromatographic method and the procedure followed for sample analysis, mT is the sum of masses corresponding to triglycerides (without reaction, mA), fatty acid methyl ester generated (FAMEs, mC) and free fatty acid included in the raw material (mFFA):
Thus, for mA, mC and mFFA, the following equations were obtained:
where nAis triglyceride (A) moles at a certain time t; MA is the molecular weight of triglycerides; nA0 are the initial moles of triglycerides; nC are FAME (C) total moles at a certain time t; is the average molecular weight of FAMEs at a certain time t.
Operating with these equations, it is possible to calculate triglyceride conversion (X) from the chromatographic results according to Equation (28):
Once triglyceride conversion was obtained with the above-mentioned equation, the selection of the most suitable kinetic model for transesterification (depending on test conditions) was carried out, requiring the adjustment of experimental data (X evolution over time) to the different cases included in Table 1 (Equations (8)–(13)). Thus, a least-squares adjustment of the experimental data (between the beginning of the reaction and the time when the chemical equilibrium was achieved) to these equations will allow the assessing of the suitability of these models, comparing their coefficient of determination (R2).
Finally, according to the most suitable kinetic models, the kinetic constant of the process, as well as the activation energy, were obtained. For this purpose, different catalysts were used at different concentrations (0.5, 1.0 and 1.5 % w/w), methanol concentrations (corresponding to different methanol:oil ratios; that is, 3:1, 6:1, 9:1 and 12:1 for base catalysis and 9:1, 18:1 and 24:1 for acid catalysis) and temperatures (35, 45, 55 and 65 °C). The rest of the chemical conditions were kept constant (stirring rate at 700 rpm). To sum up, the main steps carried out in this study are included in Figure 10.
4. Conclusions
The most interesting findings were the following:
- A thorough kinetic study was carried out with different acid and base catalysts, which can serve as a dataset for further comparisons with other catalysts or can contribute to the design of experimental or industrial facilities.
- In the case of base homogeneous catalytic transesterification, a second-order kinetic (first-order for each reagent) is proposed, whereas in the case of methanol/oil ratios higher than 9:1, a pseudo-first reaction order with respect to triglycerides was selected.
- In any case, the kinetic constant depended on catalyst concentration, according to the expression k′ = k1·CCat, which is valid regardless of the kind of catalyst and the concentration range used in this experience.
- At 65 °C, the k1 values (which are independent of catalyst concentration) for the pseudo-first reaction order for KOH, NaOH and CH3OK were 7.258, 8.420 and 12.43 L·mol−1·min−1, respectively. Under the same circumstances, the k1 values for the second-order reaction were 1.335, 1.565 and 2.524 L2mol−2min−1 for KOH, NaOH and CH3OK, respectively.
- According to the Arrhenius equation, in the case of base catalysis with KOH, an activation energy of 65.5–66 kJ·mol−1 was obtained.
- Concerning acid homogeneous catalysis, a pseudo-first-order reaction was proposed (linked to triglycerides) once the first stage took place (corresponding to external diffusion control of the reagents between phases).
- The pseudo-first reaction order constant depended on catalyst concentration under the chemical conditions considered in this study, according to the expression: k′ = k1·CCat + k2.
- Thus, at 65 °C, the k1 values were 3.239·10−4, 9.164·10−4 and 6.953·10−3 L·mol−1·min−1 for H3PO4, H2SO4 and CH3C6H4SO3H, respectively. On the other hand, k2 was 1.131·10−4, 1.604·10−4 and 3.610·10−3 min−1 for H3PO4, H2SO4 and CH3C6H4SO3H, respectively. According to these values, it was confirmed that transesterification through acid homogeneous catalysis was much slower than in the case of base homogeneous catalysis.
- For CH3C6H4SO3H, an activation energy of 92.3 kJ·mol−1 was obtained, which was higher (as expected) than in the case of base homogeneous catalysis.
Author Contributions
Conceptualization, J.M.E. and J.F.G.; methodology, J.M.E., J.F.G. and G.M.; validation, J.M.E. and G.M.; formal analysis, G.M.; investigation, J.M.E. and G.M.; resources, J.M.E. and J.F.G.; data curation, G.M. and S.N.-D.; writing—original draft preparation, S.N.-D.; writing—review and editing, S.N.-D.; visualization, J.M.E. and J.F.G.; supervision, J.M.E., J.F.G. and S.N.-D.; project administration, J.M.E. and J.F.G.; funding acquisition, J.M.E. and J.F.G. All authors have read and agreed to the published version of the manuscript.
Funding
This research was funded by Junta de Extremadura and FEDER, grant numbers GR18150 and IB18028.
Acknowledgments
The authors would like to acknowledge the economic support provided by Junta de Extremadura and FEDER (GR18150 and IB18028).
Conflicts of Interest
The authors declare no conflict of interest. The funders had no role in the design of the study; in the collection, analyses, or interpretation of data; in the writing of the manuscript, or in the decision to publish the results.
References
- United Nations. Sustainable Development Goals. 2019. Available online: https://www.un.org/sustainabledevelopment/sustainable-development-goals/ (accessed on 20 December 2021).
- Ogunkunle, O.; Ahmed, N.A. A review of global current scenario of biodiesel adoption and combustion in vehicular diesel engines. Energy Rep. 2019, 5, 1560–1579. [Google Scholar] [CrossRef]
- Knothe, G.; Razon, L.F. Biodiesel fuels. Prog. Energy Combust. Sci. 2017, 58, 36–59. [Google Scholar] [CrossRef]
- Voloshin, R.A.; Rodionova, M.V.; Zharmukhamedov, S.K.; NejatVeziroglu, T.; Allakhverdiev, S.I. Review: Biofuel production from plant and algal biomass. Int. J. Hydrogen Energy 2016, 41, 17257–17273. [Google Scholar] [CrossRef]
- Rathore, V.; Newalkar, B.L.; Badoni, R.P. Processing of vegetable oil for biofuel production through conventional and non-conventional routes. Energy Sustain. Dev. 2016, 31, 24–49. [Google Scholar] [CrossRef]
- Da SilvaCésar, A.; Conejero, M.A.; Barros Ribeiro, E.C.; Batalha, M.O. Competitiveness analysis of “social soybeans” in biodiesel production in Brazil. Renew. Energy 2019, 133, 1147–1157. [Google Scholar] [CrossRef]
- Granjo, J.F.O.; Duarte, B.P.M.; Oliveira, N.M.C. Integrated production of biodiesel in a soybean biorefinery: Modeling, simulation and economical assessment. Energy 2017, 129, 273–291. [Google Scholar] [CrossRef]
- Encinar, J.M.; Nogales, S.; González, J.F. Biodiesel and biolubricant production from different vegetable oils through transesterification. Eng. Rep. 2020, 2, e12190. [Google Scholar] [CrossRef]
- Checa, M.; Nogales-Delgado, S.; Montes, V.; Encinar, J.M. Recent advances in glycerol catalytic valorization: A review. Catalysts 2020, 10, 1279. [Google Scholar] [CrossRef]
- Encinar, J.M.; Nogales-Delgado, S.; Pinilla, A. Biolubricant Production through Double Transesterification: Reactor Design for the Implementation of a Biorefinery Based on Rapeseed. Processes 2021, 9, 1224. [Google Scholar] [CrossRef]
- Manaf, I.S.A.; Embong, N.H.; Khazaai, S.N.M.; Rahim, M.H.A.; Yusoff, M.M.; Lee, K.T.; Maniam, G.P. A review for key challenges of the development of biodiesel industry. Energy Convers. Manag. 2019, 185, 508–517. [Google Scholar] [CrossRef]
- Tariq, M.; Ali, S.; Khalid, N. Activity of homogeneous and heterogeneous catalysts, spectroscopic and chromatographic characterization of biodiesel: A review. Renew. Sustain. Energy Rev. 2012, 16, 6303–6316. [Google Scholar] [CrossRef]
- Nisar, S.; Hanif, M.A.; Rashid, U.; Hanif, A.; Akhtar, M.N.; Ngamcharussrivichai, C. Trends in widely used catalysts for fatty acid methyl esters (Fame) production: A review. Catalysts 2021, 11, 1085. [Google Scholar] [CrossRef]
- Chozhavendhan, S.; VijayPradhapSingh, M.; Fransila, B.; PraveenKumar, R.; Karthiga Devi, G. A review on influencing parameters of biodiesel production and purification processes. Curr. Res. Green Sustain. Chem. 2020, 1–2, 1–6. [Google Scholar] [CrossRef]
- Sivasamy, A.; Cheah, Y.; Fornasiero, P.; Kemausuor, F. Catalytic Applications in the Production of Biodiesel from Vegetable Oils. Chem Sus Chem 2009, 2, 278–300. [Google Scholar] [CrossRef] [PubMed]
- Leung, D.Y.C.; Wu, X.; Leung, M.K.H. A review on biodiesel production using catalyzed transesterification. Appl. Energy 2010, 87, 1083–1095. [Google Scholar] [CrossRef]
- Lam, M.K.; Lee, K.T.; Mohamed, A.R. Homogeneous, heterogeneous and enzymatic catalysis for transesterification of high free fatty acid oil (waste cooking oil) to biodiesel: A review. Biotechnol. Adv. 2010, 28, 500–518. [Google Scholar] [CrossRef] [PubMed]
- Agarwal, M.; Chauhan, G.; Chaurasia, S.P.; Singh, K. Study of catalytic behavior of KOH as homogeneous and heterogeneous catalyst for biodiesel production. J. Taiwan Inst. Chem. Eng. 2012, 43, 89–94. [Google Scholar] [CrossRef]
- Ghedini, E.; Taghavi, S.; Menegazzo, F. A Review on the Efficient Catalysts for Algae Transesterification to Biodiesel. Sustainability 2021, 13, 10479. [Google Scholar] [CrossRef]
- Sahu, G.; Gupta, N.K.; Kotha, A.; Saha, S.; Datta, S.; Chavan, P. A Review on Biodiesel Production through Heterogeneous Catalysis Route. ChemBioEng 2018, 5, 231–252. [Google Scholar] [CrossRef]
- Verma, P.; Sharma, M.P. Review of process parameters for biodiesel production from different feedstocks. Renew. Sustain. Energy Rev. 2016, 62, 1063–1071. [Google Scholar] [CrossRef]
- Lawer-yolar, G.; Dawson-andoh, B.; Atta-obeng, E. Synthesis of Biodiesel from Tall Oil Fatty Acids by Homogeneous and Heterogeneous Catalysis. Sustain. Chem. 2021, 2, 12. [Google Scholar] [CrossRef]
- Jadhav, S.D.; Tandale, M.S. Optimization of Transesterification Process Using Homogeneous and Nano-Heterogeneous Catalysts for Biodiesel Production from Mangifera indica Oil. Environ. Prog. Sustain. Energy 2018, 37, 533–545. [Google Scholar] [CrossRef]
- Rahimi, A.; Moradi, G.; Alavi, S.A.; Ardjmand, M. Simultaneous Extraction of Rapeseed Oil and Conversion to Biodiesel Using Heterogeneous and Homogeneous Catalysts. Environ. Prog. Sustain. Energy 2018, 37, 518–523. [Google Scholar] [CrossRef]
- Gaikar, V.G. Simulation of a Palm Fatty Acid Distillate-Based Biodiesel Plant Using Homogeneous and Heterogeneous Catalysts. Chem. Eng. Technol. 2016, 39, 2416–2426. [Google Scholar] [CrossRef]
- Sree, J.V.; Chowdary, B.A.; Kumar, K.S.; Anbazhagan, M.P.; Subramanian, S. Materials Today: Proceedings Optimization of the biodiesel production from waste cooking oil using homogeneous catalyst and heterogeneous catalysts. Mater. Today Proc. 2021, 46, 4900–4908. [Google Scholar] [CrossRef]
- Boonanuwat, N.; Kiatkittipong, W.; Aiouache, F. Chemical Engineering and Processing: Process Intensification Process design of continuous biodiesel production by reactive distillation: Comparison between homogeneous and heterogeneous catalysts. Chem. Eng. Process. Process Intensif. 2015, 92, 33–44. [Google Scholar] [CrossRef]
- Patil, P.; Gude, V.G.; Pinappu, S.; Deng, S. Transesterification kinetics of Camelina sativa oil on metal oxide catalysts under conventional and microwave heating conditions. Chem. Eng. J. 2011, 168, 1296–1300. [Google Scholar] [CrossRef]
- Singh, A.K.; Fernando, S.D. Reaction kinetics of soybean oil transesterification using heterogeneous metal oxide catalysts. Chem. Eng. Technol. 2007, 30, 1716–1720. [Google Scholar] [CrossRef]
- Onukwuli, D.O.; Azikiwe, N.; Umeuzuegbu, J.C.; Ude, C.N.; Nwobi-okoye, C.C.; Ojukwu, C.O. In the Field Homogeneous catalyzed transesterification of neem seed oil to biodiesel and its kinetic modeling. Biofuels Bioprod. Biorefin. 2021, 15, 392–403. [Google Scholar] [CrossRef]
- Kasirajan, R. South African Journal of Chemical Engineering Biodiesel production by two step process from an energy source of Chrysophyllum albidum oil using homogeneous catalyst. S. Afr. J. Chem. Eng. 2021, 37, 161–166. [Google Scholar] [CrossRef]
- Rashid, U.; Anwar, F.; Knothe, G. Evaluation of biodiesel obtained from cottonseed oil. Fuel Process. Technol. 2009, 90, 1157–1163. [Google Scholar] [CrossRef]
- Sarin, R.; Sharma, M.; Khan, A.A. Studies on Guizotia abyssinica L. oil: Biodiesel synthesis and process optimization. Bioresour. Technol. 2009, 100, 4187–4192. [Google Scholar] [CrossRef] [PubMed]
- Enweremadu, C.C.; Mbarawa, M.M. Technical aspects of production and analysis of biodiesel from used cooking oil—A review. Renew. Sustain. Energy Rev. 2009, 13, 2205–2224. [Google Scholar] [CrossRef]
- Vicente, G.; Martínez, M.; Aracil, J. Kinetics of Brassica carinata Oil Methanolysis. Energy Fuels 2006, 20, 1722–1726. [Google Scholar] [CrossRef]
- Darnoko, D.; Cheryan, M. Kinetics of palm oil transesterification in a batch reactor. J. Am. Oil Chem. Soc. 2000, 77, 1263–1267. [Google Scholar] [CrossRef]
- Dos Santos, I.; De Carvalho, S.; Solleti, J.; Ferreira de La Salles, W.; Teixeira da Silva de La Salles, K.; Meneguetti, S. Studies of Terminalia catappa L. oil: Characterization and biodiesel production. Bioresour. Technol. 2008, 99, 6545–6549. [Google Scholar] [CrossRef]
- Da Silva, J.P.V.; Serra, T.M.; Gossmann, M.; Wolf, C.R.; Meneghetti, M.R.; Meneghetti, S.M.P. Moringa oleifera oil: Studies of characterization and biodiesel production. Biomass Bioenergy 2010, 34, 1527–1530. [Google Scholar] [CrossRef]
- Marjanović, A.V.; Stamenković, O.S.; Todorović, Z.B.; Lazić, M.L.; Veljković, V.B. Kinetics of the base-catalyzed sunflower oil ethanolysis. Fuel 2010, 89, 665–671. [Google Scholar] [CrossRef]
- Stamenković, O.S.; Todorović, Z.B.; Lazić, M.L.; Veljković, V.B.; Skala, D.U. Kinetics of sunflower oil methanolysis at low temperatures. Bioresour. Technol. 2008, 99, 1131–1140. [Google Scholar] [CrossRef]
- Ataya, F.; Dubé, M.A.; Ternan, M. Variables Affecting the Induction Period during Acid-Catalyzed Transesterification of Canola Oil to FAME. Energy Fuels 2008, 22, 679–685. [Google Scholar] [CrossRef]
- Nogales-Delgado, S.; Encinar, J.M.; González, J.F. Safflower biodiesel: Improvement of its oxidative stability by using BHA and TBHQ. Energies 2019, 12, 1940. [Google Scholar] [CrossRef] [Green Version]
- Nogales-Delgado, S.; Sánchez, N.; Encinar, J.M. Valorization of Cynara cardunculus L. Oil as the basis of a biorefinery for biodiesel and biolubricant production. Energies 2020, 13, 5085. [Google Scholar] [CrossRef]
- EN 14214:2013 V2+A1:2018; Liquid Petroleum Products—Fatty Acid Methyl Esters (FAME) for Use in Diesel Engines and Heating Applications—Requirements and Test Methods; The European Parliament: Strasbourg, France, 2018.
Figure 1.
Fatty acid methyl ester (content in sample) evolution during transesterification reaction of soybean oil (base catalysis, KOH at different concentrations).
Figure 1.
Fatty acid methyl ester (content in sample) evolution during transesterification reaction of soybean oil (base catalysis, KOH at different concentrations).

Figure 2.
Experimental data adjustment to kinetic models for base catalysis. Experimental conditions: T, 65 °C; methanol:oil ratio, 9:1; catalyst concentration, 0.5% w/w KOH; stirring rate, 700 rpm; reaction time, 120 min.
Figure 2.
Experimental data adjustment to kinetic models for base catalysis. Experimental conditions: T, 65 °C; methanol:oil ratio, 9:1; catalyst concentration, 0.5% w/w KOH; stirring rate, 700 rpm; reaction time, 120 min.

Figure 3.
Kinetic constant versus catalyst concentration for base catalysis (Cases 2 and 4).

Figure 4.
First-order (Case 2, left axis) and second-order (Case 4, right axis) kinetic constants versus initial methanol concentration for homogeneous catalysis.
Figure 4.
First-order (Case 2, left axis) and second-order (Case 4, right axis) kinetic constants versus initial methanol concentration for homogeneous catalysis.

Figure 5.
Influence of temperature on the transesterification kinetics for base catalysis. Linear adjustment according to the Arrhenius equation.
Figure 5.
Influence of temperature on the transesterification kinetics for base catalysis. Linear adjustment according to the Arrhenius equation.

Figure 6.
Conversion of evolution with time and comparison of experimental data with data corresponding to Cases 2 and 4. Experimental conditions for (A): Catalyst, 1.0 % w/w KOH; reaction time, 120 min; methanol:oil mole ratio, 9:1; stirring rate, 700 rpm; temperature, 65 °C. Experimental conditions for (B): Catalyst, 1.0 % w/w KOH; reaction time, 120 min; methanol:oil mole ratio, 3:1; stirring rate, 700 rpm; temperature, 65 °C.

Figure 7.
FAME evolution during acid catalysis of soybean oil transesterification (example for p-toluenesulfonic acid at different concentrations).
Figure 7.
FAME evolution during acid catalysis of soybean oil transesterification (example for p-toluenesulfonic acid at different concentrations).

Figure 8.
The influence of temperature on transesterification kinetics (acid catalysis). Linear adjustment according to the Arrhenius equation. Experimental conditions: catalyst addition, 0.337 mol·L−1 CH3C6H4SO3H; methanol:oil ratio, 18:1; stirring rate, 700 rpm.
Figure 8.
The influence of temperature on transesterification kinetics (acid catalysis). Linear adjustment according to the Arrhenius equation. Experimental conditions: catalyst addition, 0.337 mol·L−1 CH3C6H4SO3H; methanol:oil ratio, 18:1; stirring rate, 700 rpm.

Figure 9.
Conversion evolution with time at different reaction temperatures and comparison with predicted values by using Case 2. Experimental conditions: Catalyst addition, 0.058 g·mL−1 CH3C6H4SO3H; reaction time, 600 min; methanol:oil ratio, 18:1; stirring rate, 700 rpm.
Figure 9.
Conversion evolution with time at different reaction temperatures and comparison with predicted values by using Case 2. Experimental conditions: Catalyst addition, 0.058 g·mL−1 CH3C6H4SO3H; reaction time, 600 min; methanol:oil ratio, 18:1; stirring rate, 700 rpm.

Figure 10.
Experimental design.


Table 1.
Integral resolutions for different cases.
| Case | Condition | Equation | |
|---|---|---|---|
| 1 | α = 0, β = 0 | t | (8) |
| 2 | α = 1, β = 0 | (9) | |
| 3 | α = 0, β = 1 | (10) | |
| 4 | α = 1, β = 1 | (11) | |
| 5 | α = 2, β = 0 | (12) | |
| 6 | α = 0, β = 2 | (13) | |
Table 2.
Results concerning the use of kinetic models to global transesterification reaction through base homogeneous catalysis. Experimental conditions: T, 65 °C; stirring rate, 700 rpm; methanol:oil ratio, 9:1.
Table 2.
Results concerning the use of kinetic models to global transesterification reaction through base homogeneous catalysis. Experimental conditions: T, 65 °C; stirring rate, 700 rpm; methanol:oil ratio, 9:1.
| KOH | NaOH | CH3OK | ||||||||
|---|---|---|---|---|---|---|---|---|---|---|
| Case | Parameter | 0.5% | 1.0% | 1.5% | 0.5% | 1.0% | 1.5% | 0.5% | 1.0% | 1.5% |
| 1 | k (mol·L−1·min−1) | 0.0857 | 0.313 | 0.375 | 0.075 | 0.345 | 0.407 | 0.0808 | 0.340 | 0.176 |
| R2 | 0.732 | 0.890 | 0.872 | 0.767 | 0.884 | 0.786 | 0.739 | 0.919 | 0.579 | |
| 2 | k (min−1) | 0.384 | 0.791 | 1.22 | 0.232 | 0.948 | 1.60 | 0.273 | 0.937 | 1.42 |
| R2 | 0.987 | 0.988 | 0.997 | 0.972 | 0.988 | 0.965 | 0.961 | 0.999 | 0.995 | |
| 3 | k (min−1) | 0.0146 | 0.0516 | 0.0634 | 0.0130 | 0.0574 | 0.0174 | 0.0137 | 0.0566 | 0.0305 |
| R2 | 0.786 | 0.910 | 0.894 | 0.813 | 0.904 | 0.801 | 0.781 | 0.939 | 0.588 | |
| 4 | k (L·mol−1·min−1) | 0.0650 | 0.135 | 0.219 | 0.0409 | 0.165 | 0.295 | 0.0493 | 0.163 | 0.283 |
| R2 | 0.988 | 0.996 | 0.999 | 0.984 | 0.996 | 0.978 | 0.972 | 0.999 | 0.999 | |
| 5 | k (L·mol−1·min−1) | 3.38 | 2.46 | 6.22 | 0.997 | 3.37 | 12.2 | 1.51 | 3.39 | 255 |
| R2 | 0.880 | 0.927 | 0.917 | 0.945 | 0.928 | 0.947 | 0.956 | 0.939 | 0.811 | |
| 6 | k·10−3 (L·mol−1·min−1) | 2.52 | 8.55 | 10.8 | 2.19 | 9.63 | 3.05 | 2.34 | 9.49 | 5.36 |
| R2 | 0.830 | 0.929 | 0.916 | 0.854 | 0.923 | 0.818 | 0.819 | 0.957 | 0.598 | |
Table 3.
Catalytic and non-catalytic constant determination for base catalysis (Cases 2 and 4). Chemical conditions: T, 65 °C; methanol:oil mole ratio, 9:1; stirring rate, 700 rpm; reaction time, 120 min.
Table 3.
Catalytic and non-catalytic constant determination for base catalysis (Cases 2 and 4). Chemical conditions: T, 65 °C; methanol:oil mole ratio, 9:1; stirring rate, 700 rpm; reaction time, 120 min.
| Case | Parameter | KOH | NaOH | CH3OK |
|---|---|---|---|---|
| 2 (α =1, β = 0) | k1(L·mol−1·min−1) | 7.258 | 8.420 | 12.43 |
| k2(min−1) | −0.034 | −0.440 | −0.273 | |
| R2 | 0.999 | 0.999 | 0.992 | |
| 4 (α =1, β = 1) | k1(L2·mol−2·min−1) | 1.335 | 1.565 | 2.524 |
| k2(L·mol−1·min−1) | −0.014 | −0.087 | −0.069 | |
| R2 | 0.997 | 0.999 | 0.999 |
Table 4.
Results of the application of the kinetic model. Influence of the methanol:oil mole ratio in homogeneous catalysis. Experimental conditions: catalyst addition, 1% w/w KOH; T, 65 °C; stirring rate, 700 rpm.
Table 4.
Results of the application of the kinetic model. Influence of the methanol:oil mole ratio in homogeneous catalysis. Experimental conditions: catalyst addition, 1% w/w KOH; T, 65 °C; stirring rate, 700 rpm.
| Case | 3:1 (2.84) | 6:1 (5.09) | 9:1 (6.92) | 12:1 (8.44) | |
|---|---|---|---|---|---|
| 2 (α = 1, β = 0) | k1 (L·mol−1·min−1) | 2.428 | 4.015 | 6.820 | 6.735 |
| R2 | 0.990 | 0.932 | 0.998 | 0.994 | |
| 4 (α = 1, β = 1) | k1 (L2·mol−2·min−1) | 1.165 | 1.129 | 1.165 | 0.957 |
| R2 | 0.9969 | 0.9673 | 0.9956 | 0.9966 | |
Table 5.
Results for k1 determination. Influence of temperature on base catalysis. Experimental conditions: catalyst addition, 0.058–0.173 mol·L−1 KOH; methanol/oil ratio, 9:1–12:1; stirring rate, 700 rpm.
Table 5.
Results for k1 determination. Influence of temperature on base catalysis. Experimental conditions: catalyst addition, 0.058–0.173 mol·L−1 KOH; methanol/oil ratio, 9:1–12:1; stirring rate, 700 rpm.
| Temperature, °C | ||||||
|---|---|---|---|---|---|---|
| Case | Parameter | 35 | 45 | 55 | 65 | 72 |
| 2 (α = 1, β = 0) | k1 (L·mol−1·min−1) | 0.793 | 1.515 | 2.846 | 6.806 | 12.40 |
| R2 | 0.990 | 0.998 | 0.992 | 0.992 | 0.986 | |
| 4 (α = 1, β = 1) | k1 (L2·mol−2·min−1) | 0.136 | 0.260 | 0.486 | 1.108 | 2.270 |
| R2 | 0.994 | 0.998 | 0.994 | 0.992 | 0.990 | |
Table 6.
Activation energy determination through Arrhenius adjustment.
| Case 2 | Case 4 | ||
|---|---|---|---|
| Ea, kJ·mol−1 | R2 | Ea, kJ·mol−1 | R2 |
| 65.5 | 0.988 | 66.0 | 0.984 |
Table 7.
Activation energies found in the literature for transesterification of triglycerides.
| Process | Ea, kJ·mol−1 | Reference | |||||
|---|---|---|---|---|---|---|---|
| T→D | D→T | D→M | M→D | M→G | G→M | ||
| Methanolysis of Brassica carinata oil with KOH | 10.8 | 71.0 | 92.4 | 70.7 | 12.0 | n.d. | [35] |
| Methanolysis of palm oil with KOH | 64.5 | n.d. | 59.4 | n.d. | 26.8 | n.d. | [36] |
T = triglyceride; D = diglyceride; M = monoglyceride; G = glyceride.
Table 8.
Results concerning the use of kinetic models to global transesterification reaction through acid homogeneous catalysis. Experimental conditions: T, 65 °C; stirring rate, 700 rpm; methanol:oil ratio, 9:1.
Table 8.
Results concerning the use of kinetic models to global transesterification reaction through acid homogeneous catalysis. Experimental conditions: T, 65 °C; stirring rate, 700 rpm; methanol:oil ratio, 9:1.
| H2SO4 | H3PO4 | CH3C6H4SO3H | ||||||||
|---|---|---|---|---|---|---|---|---|---|---|
| Case | Parameter | 9% | 15% | 20% | 9% | 15% | 20% | 9% | 15% | 20% |
| 2 | k′·10−3 (min−1) | 2.134 | 2.535 | 2.805 | 0.3068 | 0.4292 | 0.5452 | 5.752 | 7.109 | 8.388 |
| R2 | 0.996 | 0.989 | 0.994 | 0.957 | 0.980 | 0.982 | 0.998 | 0.998 | 0.993 | |
| 4 | k′·10−4 (L·mol−1·min−1) | 3.555 | 4.319 | 4.840 | 0.4541 | 0.6413 | 0.8221 | 10.75 | 13.53 | 16.35 |
| R2 | 0.993 | 0.978 | 0.986 | 0.961 | 0.984 | 0.987 | 0.998 | 0.998 | 0.985 | |
Table 9.
Catalytic and non-catalytic kinetic constant determination for acid catalysis. Experimental conditions: T, 65 °C; methanol:oil mole ratio, 9:1; stirring rate, 700 rpm.
Table 9.
Catalytic and non-catalytic kinetic constant determination for acid catalysis. Experimental conditions: T, 65 °C; methanol:oil mole ratio, 9:1; stirring rate, 700 rpm.
| Case 2 | Case 4 | |||||
|---|---|---|---|---|---|---|
| Parameter | k1·104 | k2·104 | R2 | k1·104 | k1·104 | R2 |
| Units | (L·mol−1·min−1) | (min−1) | (L2·mol−2·min−1) | (L·mol−1·min−1) | ||
| H2SO4 | 9.164 | 1.604 | 0.996 | 1.756 | 2.537 | 0.996 |
| H3PO4 | 3.239 | 1.131 | 0.999 | 0.4988 | 0.1553 | 0.999 |
| CH3C6H4SO3H | 69.53 | 36.10 | 0.999 | 14.75 | 61.77 | 0.997 |
Table 10.
Results for the application of the kinetic model. Influence of methanol:oil mole ratio on acid catalysis. Experimental conditions: catalyst addition, 0.337 mol·L−1 CH3C6H4SO3H; T, 65 °C; stirring rate, 700 rpm.
Table 10.
Results for the application of the kinetic model. Influence of methanol:oil mole ratio on acid catalysis. Experimental conditions: catalyst addition, 0.337 mol·L−1 CH3C6H4SO3H; T, 65 °C; stirring rate, 700 rpm.
| Methanol/Oil Ratio (CB0, mol·L−1) | ||||
|---|---|---|---|---|
| Case | Parameter | 9:1 (2.84) | 18:1 (5.09) | 24:1 (6.92) |
| 2 (α = 1, β = 0) | k′ (min−1) | 5.752·10−3 | 5.740·10−3 | 5.787·10−3 |
| R2 | 0.998 | 0.998 | 0.990 | |
| 4 (α = 1, β = 1) | k′ (L·mol−1·min−1) | 1.075·10−3 | 6.037·10−3 | 5.038·10−3 |
| R2 | 0.998 | 0.992 | 0.995 | |
Table 11.
Results for k′ determination. Influence of temperature on acid catalysis. Experimental conditions: catalyst addition, 0.337 mol·L−1 CH3C6H4SO3H; methanol/oil ratio, 18:1; stirring rate, 700 rpm.
Table 11.
Results for k′ determination. Influence of temperature on acid catalysis. Experimental conditions: catalyst addition, 0.337 mol·L−1 CH3C6H4SO3H; methanol/oil ratio, 18:1; stirring rate, 700 rpm.
| Temperature, °C | |||||
|---|---|---|---|---|---|
| Case | 35 | 45 | 55 | 65 | |
| 2 (α = 1, β = 0) | k′·103(min−1) | 0.2486 | 0.7433 | 2.563 | 5.740 |
| R2 | 0.974 | 0.995 | 0.984 | 0.998 | |
Publisher’s Note: MDPI stays neutral with regard to jurisdictional claims in published maps and institutional affiliations. |
© 2022 by the authors. Licensee MDPI, Basel, Switzerland. This article is an open access article distributed under the terms and conditions of the Creative Commons Attribution (CC BY) license (https://creativecommons.org/licenses/by/4.0/).
Share and Cite
MDPI and ACS Style
Encinar, J.M.; González, J.F.; Martínez, G.; Nogales-Delgado, S. Transesterification of Soybean Oil through Different Homogeneous Catalysts: Kinetic Study. Catalysts 2022, 12, 146. https://0-doi-org.brum.beds.ac.uk/10.3390/catal12020146
AMA Style
Encinar JM, González JF, Martínez G, Nogales-Delgado S. Transesterification of Soybean Oil through Different Homogeneous Catalysts: Kinetic Study. Catalysts. 2022; 12(2):146. https://0-doi-org.brum.beds.ac.uk/10.3390/catal12020146
Chicago/Turabian StyleEncinar, José María, Juan Félix González, Gloria Martínez, and Sergio Nogales-Delgado. 2022. "Transesterification of Soybean Oil through Different Homogeneous Catalysts: Kinetic Study" Catalysts 12, no. 2: 146. https://0-doi-org.brum.beds.ac.uk/10.3390/catal12020146
Note that from the first issue of 2016, this journal uses article numbers instead of page numbers. See further details here.