Article

Photo-Fenton Degradation of Methyl Orange with Dunino Halloysite as a Source of Iron

1
Istituto per la Microelettronica e Microsistemi, Consiglio Nazionale delle Ricerche (CNR-IMM), Ottava Strada n.5, I-95121 Catania, Italy
2
Faculty of Chemical and Process Engineering, Warsaw University of Technology, ul. Warynskiego 1, 00-645 Warsaw, Poland
3
Dipartimento di Ingegneria, Università degli Studi di Messina, Contrada di Dio, I-98166 Messina, Italy
*
Authors to whom correspondence should be addressed.
Submission received: 14 January 2022 / Revised: 21 February 2022 / Accepted: 24 February 2022 / Published: 26 February 2022
(This article belongs to the Topic Catalysis: Homogeneous and Heterogeneous)

Abstract

:
The Fenton reaction is one of the most important processes for water and soil remediation, although this process has some drawbacks such as the use of H2O2 in large amounts, the formation of sludge due to the use of iron salts, and the need for acid pH values. Here we present the use of a natural clay, modified by acid treatment, as a heterogeneous catalyst to replace soluble iron salts and to avoid the use of water peroxide, resulting in a considerable increase in the attractiveness of the process. Halloysite (HT) clay from the Dunino mine consists of alumina and silica layers with the presence of iron species acting as a source of Fe ions. The etching of alumina layers using hydrochloric acid induces the release of iron species (mainly ions) in the solution, giving rise to the photodegradation activity of organic contaminants in water (i.e., Methyl Orange, MO) under UV irradiation without the need for hydrogen peroxide and avoiding the formation of sludges. MO adsorption properties and MO photodegradation ability were investigated for untreated and acid treated samples, respectively, to achieve the optimal process conditions. MO was not adsorbed on the clay’s surface due to electrostatic repulsion, but a complete degradation was observed after three hours under UV irradiation. The kinetics of photodegradation and the values of the half-life time are presented as a measure of the degradation rate. The proposed process shows a new route for effective remediation of water containing biologically active organic substances dissolved in it.

1. Introduction

The prevention of environmental pollution caused by inorganic and organic toxic chemical compounds has recently gained the attention of the scientific community [1]. In particular, the presence of organic compounds in water poses a serious threat to public health since most of them are toxic and potentially carcinogenic to humans even when present at very low concentrations [2]. The most investigated remediation techniques involve filtration and adsorption-based approaches using low cost and regenerable materials [3]. In this regard, carbon nanomaterials such as graphene oxide [4,5,6], clay minerals [7], and polymer-based materials [6] have shown good results in water purification applications. Furthermore, in many cases, conventional methods are not effective in the removal of organic contaminants due to their recalcitrant nature. Consequently, the need for the efficient treatment of these contaminants is imperative. Oxidation processes are preferred pre- or post-treatment to degrade such organics [8]. High degradation efficiencies are possible with direct oxidation techniques. However, these processes require specified operating conditions to degrade the target compounds, and this increases the operation cost of the process [2]. A cheaper alternative is represented by advanced oxidation processes (AOPs) which successfully degrade organic compounds at a near ambient temperature and pressure involving the generation of hydroxyl radicals in a sufficient quantity to affect water purification [9]. In this regard, inorganic semiconductors such as TiO2 and Bi2O3 individually or in combination with carbon-based materials and polymers [10,11,12,13,14] have been investigated for the degradation of water contaminants under UV or visible light irradiation through photocatalytic processes.
In the recent past, the Fenton reaction was efficiently utilized in the wastewater treatment process for the removal of many hazardous organics from wastewater [15,16], for the removal of hydrocarbons from saline wastewater [17], or in combination with flocculation and decantation for the removal of the insecticide fipronil from wastewater [18]. The Fenton reaction, observed by H. J. Fenton in 1894 for the first time, is described as the enhanced oxidative power of H2O2 when using iron (Fe) as a catalyst under acidic conditions [19]: oxygen-radical species are generated by the disproportionation of hydrogen peroxide in the presence of Fe2+/Fe3+. These free radicals generate secondary oxidation reactions, leading to the degradation of organic compounds into carbon dioxide and water [8,19]. UV irradiation of ferric ions in an acidic medium increases the generation of hydroxyl radicals responsible for the oxidation reactions as an effect of the electron transfer initiated by irradiation. In addition, the Fenton process has some practical limitations such as the production of metal hydroxide sludge as secondary pollution, environmental toxicity, operation in a narrow pH range (2–4) as well as the requirement to neutralize the effluent and the failure to recover and reuse the catalyst [20]. Moreover, the effectiveness of the catalysts is decreased by the presence of ligands in the wastewater, such as oxalate anions, which may irreversibly coordinate iron ions reducing their availability for the catalytic process [21].
To overcome these problems, many researchers have focused their attention on the incorporation of a catalyst on the surface of porous materials, such as multi-walled carbon nanotubes, activated carbon, graphene, polymers, and clays. In this way, catalyst performances are increased due to a larger surface area and, furthermore, composites can be easily removed, regenerated, and reused at the end of the process [21]. Natural supporting materials such as clays are the best candidates for this purpose, thanks to their easy availability in high amounts in mining sites, resulting in cost effectiveness for large scale applications from an environmental remediation perspective [22]. Novel structured inorganic silica fabrics loaded with Fe ions by exchange–impregnation has been used as a heterogeneous photo-catalyst to degrade organic compounds i.e., oxalates [23]; their degradation on the Fe-silica fabric was due to Fe ions leaching into the solution as they were re-adsorbed onto the silica fabric when compounds were mineralized. Iron can be incorporated into clays by different strategies such as the cationic exchange of naturally present cations in the clay, but this may lead to iron contents being too low, pillaring, and impregnation of clay-based Fe nanocomposites [24,25]. Many natural clays just contain iron and iron oxides [26,27] which could be used as a source of iron in Fenton processes. Furthermore, clay minerals, especially those exhibiting nanotubular morphology such as halloysite, are promising and cheap materials used for adsorption and pollution remediation [28,29]. This relates to their stability in aqueous solutions making them promising candidates for water treatment. Halloysite belongs to the kaolin group of minerals consisting of stacked pairs of tetrahedral silica sheets and octahedral alumina sheets [30,31]. Negatively charged sites in the tetrahedral sheets originate from the replacement of Si(IV) atoms by Al(III) atoms and terminal hydroxyl moieties are present at the edges. Depending on pH, these groups could be protonated or not, thus affecting their charge. The porous textural structure of the halloysite can provide an excellent adsorption capacity to remove contaminants [26,27]. Therefore, this material could be directly used in heterogeneous Fenton-like processes without any purification or iron enrichment treatment, allowing one to achieve wastewater purification by means of AOP methods. In this way, chemical contaminants and their toxicity are reduced to such an extent that treated wastewater may be reintroduced into receiving streams or, at least, into a conventional sewage treatment.
In this work we tested natural HT from Dunino cave before and after acid treatment with hydrochloric acid for the removal and degradation of the anionic dye Methyl Orange (MO). MO is a synthetic azo dye, generally used as a coloring agent in the textile, pharmaceutical, food processing and leather industries, and for printing and paper manufacturing [32]. It is generally present as contaminant in water and its removal is mandatory due to the fact that it is carcinogenic; high levels of exposure to MO or its by-products can result in death. The natural clay was morphologically and chemically characterized as received and after being treated by hydrochloric acid. Different experimental parameters of acid treatment are investigated to obtain the higher amount of extracted iron ions by the etching of alumina layers starting from the natural clay at different concentrations. Taking advantage of the photodegradation activity of these iron species, we propose the use of natural Dunino halloysite (HT), after acid treatment, for organic pollutants removal by both adsorption and photo Fenton processes. The reported results point to the possibility of using this natural and low-cost material as an iron source in Fenton processes, reducing the cost of the process itself and its impact on the environment.

2. Results

2.1. Acid Treatment of Raw Dunino Halloysite

Iron particles and oxides are naturally present in kaolin clays, conferring to the mineral a typical brown colour [26,27]. To remove these species considered as impurities, both physical techniques (magnetic separation, selective flocculation) and chemical treatments under acidic or reducing conditions [33] and biological processes [34] have been investigated. In this work, HT samples with two different concentrations (0.115 and 0.23 mg/mL) were treated by adding concentrated hydrochloric acid to obtain the dissolution of iron particles from the clay into the solution, according to the procedure reported in Section 4. Figure 1 reports the UV-Visible absorbance spectra of raw HT at pH < 3 (HT(H+)), precipitate and supernatant dispersions after acid treatment (here named, pHT(H+) and sHT(H+), respectively) for the two initial HT concentrations, i.e., 0.115 mg/mL (Figure 1a) and 0.23 mg/mL (Figure 1b). Figure 1c presents a comparison of UV-Vis absorbance spectra for supernatant dispersions of both concentrations.
The black curves in Figure 1a,b show the UV-Visible spectra of raw HT powder dispersed in water (pH < 3) at two different concentrations; these spectra are the sum of the two contributions due to both aluminosilicate layers and iron oxide nanoparticles, as reported in a previous work [7], showing that HT absorbs light in the whole investigated range. After acid treatment in HCl, a precipitate was observed in both solutions whose spectra are reported as dark green and cyan in Figure 1a,b, respectively. These show the same absorption features as the initial HT samples. For the supernatants (see green and blue curves of Figure 1a,b, respectively), the spectra report an absorption peak at 334 nm and an increased absorption at lower wavelengths. This peak is associated with iron ions dissolved into solution from the initial structure as an effect of acid treatment. Figure 1c shows that two different amounts of iron ions were removed from HT according to the initial clay concentration: the higher the initial clay amount, the higher the dissolved iron amount. By comparing the absorbance peaks in Figure 1c with the calibration curve obtained for different concentrations of FeCl3 acid solutions (details on the calibration procedure are reported in Section 4), we found that the Fe3+ ions concentration in supernatant solutions are 54.5 μM (i.e., 3.04 μg of Fe3+ ions for mL of solution) and 144.4 μM (i.e., 8.06 μg of Fe3+ ions for mL of solution) for 0.115 mg/mL and 0.23 mg/mL HT, respectively. Considering the initial amount of HT in mg, these values correspond to a QFe of 26.44 and 35.04 μg of iron per 1 mg of HT, respectively, for the two concentrations.
Similarly, the amount of dissolved iron as a function of the sonication time was investigated and the UV-Visible spectra for 0.23 mg/mL HT(H+) are reported in Figure 2.
Observing the peak at 334 nm, the amount of dissolved iron increases with ultrasonication time during the first hour. According to the calibration curve reported in Section 4, the concentration of Fe3+ was estimated to be 144.4, 427.8, 470.6 and 540.1 μM after 30, 60, 120 and 180 min, respectively.
Figure 3 reports the values of QFe, as defined in the previous paragraph, versus ultrasonication time.
The ultrasonication time affects the amount of dissolved iron; it increases with time and the highest increase occurs after one hour, when the QFe value (103.8 μg/mg) is three times higher than the value measured after 30 min (35.4 μg/mg). After one hour, the dissolution of iron continues but more slowly. This is evident from the slope of the curve in Figure 3. With respect to the value after 60 min, the increase of dissolved iron ions after two and three hours is 10% and 27%, respectively, corresponding to QFe values of 114.2 and 131.1 μg/mg, respectively.
In our experiment, we promoted the dissolution of iron contained in the aluminosilicate clay by treatment with concentrated hydrochloric acid. This suggests that the structural unit of these stratified minerals was partly destroyed by acid treatment. This mechanism is explained in the following paragraph.

2.2. Morphological and Chemical Characterizations

Figure 4 reports the SEM images of raw HT mineral powder before (a) and after (b) acid treatment, deposited on an acid-resistant polymeric substrate for analysis purposes.
The untreated sample shows platy and tubular structures typical of material from the Dunino deposit [7]. The flakes’ surface is irregular, heterogeneous, and porous. This roughness is due to the iron particles on aluminosilicate layers [7], and it increases with the amount of iron species in the sample as also confirmed by EDX analysis, not shown here. After acid treatment, the morphology of the HT sample (Figure 4b) is quite like the untreated one (Figure 4a) although, the flakes present in the supernatant solution after acidification are on average thinner and smoother than the initial ones. The main differences between acid treated and untreated samples are pointed out considering their chemical composition as evidenced by the EDX analysis acquired from these samples.
The mass-averaged quantitative and qualitative EDX elemental analyses were acquired from the raw and acid treated clay, confirming that the most abundant elements are oxygen, aluminum, silicon, iron, while carbon and sulfur signals come from the polymeric substrate used for analysis. Besides iron, other impurities such as Ti, Mg were observed and further confirmed by XRF analysis, as also reported in ref. [7]. To evaluate the chemical composition of each sample, at least 15 spectra were acquired in different areas of each sample and the Si/Al, Fe/Al and Fe/Si ratios were calculated as average values over all the acquired spectra.
In the raw sample, the relative Si/Al ratio is about 1.14 [7]; after acid treatment, this ratio increases up to 2.95 and 13.10 for sHT(H+) and pHT(H+), respectively, because of the dissolution of alumina layers and the Fe ions’ enrichment of the solution. The flakes observed in the precipitate show a larger silicon to aluminum ratio and some layers are only composed of silica suggesting that iron ions are removed from the clay flakes because of alumina dissolution. For what concerns iron species, these are distributed through the whole raw sample with variable percentages depending on the single analyzed structure [7]. Similarly, the iron amount is still variable from region to region after acid treatment. Generally, the structures with a higher iron amount can be easily recognized in electron microscopy images since they present a higher roughness The raw sample has an Fe/Si ratio quite similar to the Fe/Al one (up to 0.92 and 0.97, respectively [7]), while for the sHT(H+) the Fe/Al ratio increases to higher values than the Fe/Si ratio (up to 2.30 and 1.49, respectively). This further confirms that the dissolution process occurred by destroying alumina layers and releasing iron ions into the solution.
Similarly, the structure of untreated HT and sHT(H+) was investigated by acquiring TEM images of these samples deposited on grids. The TEM images are presented in Figure 5. The precipitate structure was very similar to the initial sample and, therefore, it is not reported here.
Dunino clay consists of tetrahedral Si2O5 sheets and octahedral Al sheets ending with hydroxyl groups (a scheme of its structure is reported in Figure S2 of our previous work [7]). The layer repetition defines the (001) basal spacing of the unit cell and this spacing is characteristic of the type of stacking present, i.e., 10 Å and 7 Å, according to a higher or lower hydration state, respectively. Considering the morphology of these samples, globally no significant differences were observed when comparing the initial and acid treated samples (see Figure 5a,b, respectively). Both the samples are composed of platy or rolled layered structures related to aluminosilicate layers and small spherical particles (see the darker structure of Figure 5a,b). According to our previous work [7], these are iron oxide particles with a hematite α-Fe2O3 structure. Iron is also present as Fe3+ substitutional to Al3+ in the layers [7] as confirmed by chemical characterization performed by EELS spectroscopy. From the high-resolution image shown in Figure 5d it is possible to extract the (001) basal spacing of the HT(H+) sample corresponding to 10 Å, as shown in the Supporting information (Figure S1).
A difference between the untreated and acid-modified samples was observed by acquiring higher magnification images of the stacked layers (see Figure 5c,d): These became more jagged after acid treatment due to the damaging of alumina layers and the release of iron ions into the solution. This is further confirmed by chemical analysis; EDX spectra acquired on initial (blue curve) and treated (red curve) samples during TEM acquisition are reported in the Supporting Information Figure S2. The Si/Al ratio is almost 1 in different areas of the initial sample, while this value increases after acid treatment. The residual platy structures observed in the supernatant show an increase of Si/Al ratio up to 3.5 in the investigated area, a reduction in the iron amount and a contamination of Cl. Consequently, the Fe/Al ratio is higher than the Fe/Si ratio in the treated sample with respect to the initial one. This agrees with EDX analysis performed during SEM analysis at larger magnifications and confirms the occurrence of alumina dissolution and the release of iron ions into the solution.
To evaluate the chemical elemental composition of the whole HT samples before and after acid treatment, XRF spectra were acquired for pHT(H+) dispersed in boric acid and compared with the results obtained for the initial sample reported in our previous work [7]. The amount of each element as mass% is reported in Table 1.
For untreated HT, the Si/Al ratio is 1.13 and the Fe/Si ratio is 0.76, slightly lower than 0.85 obtained for Fe/Al ratio. For the precipitate after acid treatment, both the amount of iron and aluminum are reduced to 50% of the initial value (i.e., from 14.20% to 6.80% for iron and from 16.62 to 9.43 for aluminium). With respect to the bare clay, the Si/Al ratio is double (i.e., 2.56), the Fe/Si ratio is highly reduced (i.e., 0.28), while the Fe/Al ratio is 0.72 which is quite similar to the value observed for the untreated sample. These values confirm that iron oxide was dissolved and released into the solution after adding hydrochloric acid because of alumina destruction, while silica remained unaltered.

2.3. MO Removal by Adsorption and Photocatalytic Process

The adsorption and photo-degradation abilities of bare and acid treated HT for the removal of negative charged dye i.e., Methyl Orange (MO) were investigated. In a previous work we already showed [30] the high adsorption efficiency and selectivity of Dunino raw halloysite mineral versus positively charged molecules, due to the presence of negatively charged sites on the clay’s surface.
Figure S3 of SI reports the UV-Vis spectra of the MO solutions and HT/MO solutions both at neutral and acid pH. The UV-Vis absorbance spectrum of MO dissolved in water shows two maxima: the first at 270 nm and the second at 465 nm, related to the benzene ring in MO and the azo linkage of MO [10,12], respectively. The latter absorbance peak was used to quantify MO concentration reduction or degradation due to adsorption or photocatalysis at neutral pH. In an acid environment, the absorbance band shifts to 505 nm and an additional feature (a hump) appears at a larger wavelength, due to the protonation of MO [10]. In this case, the peak at 505 nm was used to quantify MO adsorption/degradation. At both neutral and acid pH, no degradation of MO under dark or UVA/blue irradiation was observed in the absence of HT powder (not shown here) and any variation of the 270 nm peak position is also correlated with the formation of by-products because of azo-dye degradation [10,12].
Figure S3 also reports the UV-Visible reference spectra of HT/MO solutions after a few minutes of contact. No variations of the shape of the dye absorbance peaks were observed after the addition of the clay powder. The reference spectra of the clay solutions without any dye molecules is reported in Figure 1b. The stability of the clay under UV-Visible or Visible light irradiation was also confirmed (not shown here).
At a pH between 4.3 and 7, the HT surface is prevailed by negative charges which enhance the electrostatic attraction with cationic species with respect to the negatively charged molecules [6]. Thus, at neutral condition (pH = 5.8) no interactions between MO and HT were expected, indeed, no adsorption of MO occurred on the clay in these conditions (see supporting material Figure S4a,b). Therefore, the degradation ability of this clay under UV-Vis light irradiation in the same experimental condition is negligible due to the absence of interaction of MO molecules on the clay’s surface as an effect of electrostatic repulsion.
Furthermore, we tested the adsorption and photo-degradation abilities of the acid treated clay sample for MO dye removal from water.
At pH lower than 4.3 (i.e., <3 in our experiments), both MO molecules and the clay surface are completely protonated (as shown in [7]) thus their interaction is electrostatically hindered. Indeed, acid treated samples show no effective adsorption for MO molecules as shown in Figure S5: HT(H+) and pHT(H+) show the same removal efficiency i.e., 8%. No interaction with the dye was observed for the sHT(H+) sample since this is formed quite completely by iron ions extracted from the initial solution, as shown by morphological and chemical characterization.
More interesting results were observed testing these samples under UV-Vis irradiation for MO photodegradation. Figure 6 shows the UV-Vis absorbance spectra of MO in HT(H+) (a), pHT(H+) (b) and sHT(H+) (c) dispersions, respectively, at pH < 3 and after exposure to UV-Visible light irradiation for different times (from 1 h to 4 h).
It is immediately evident that under irradiation both HT(H+) and pHT(H+) show quite similar photodegradation efficiencies (up to 47% and 35%, respectively). On the contrary, sHT(H+) has a higher efficiency since it was able to completely remove MO after 3 h under irradiation.
The % of removed MO molecules versus irradiation time are reported in Table 2 for each sample as a measure of degradation efficiency (where C0 and C are the solution concentration at t = 0 after some irradiation time).
From the chemical and morphological characterizations reported above, we could consider iron ions responsible of the photodegradation ability. For supernatant dispersion, the amount of extracted iron ions is higher than for HT(H+) and pHT(H+) and it showed the best removal efficiency under irradiation. Since the first hour, its photodegradation ability is four times higher than that of HT(H+) and pHT(H+). This ability doubled in the second hour until complete MO removal during the third hour. HT(H+) and pHT(H+) show similar photodegradation activity but it is lower than that of sHT(H+) due to a lower amount of extracted iron ions.
In the spectra acquired for MO in the presence of the sHT(H+) sample, it is clear that MO molecules were photodegraded as evidenced by the change of UV-Vis spectra within irradiation time in the region below 300 nm.
The MO molecule in the pH range 4.1–9.5 is characterized by a band in the range 485–465 nm in the visible region attributed to azo form (-N=N-) and the bands at 276 nm are due to the presence of benzene rings in MO [12]. Under progressive protonation, the color of the solution changes from orange to red due to the formation of a monoprotonated form of MO and the most intense absorption band shifts to a longer wavelength (i.e., 506 nm due to azonium ion). Two new bands at 317 nm and 226 nm (not shown) in the UV region appear due to the modification of the system delocalization [12].
According to GC-MS analysis reported in [35], during irradiation, degradation proceeds through the cleavage of the azo group connecting the two aromatic rings forming substituted aromatic amines. The azo group -N=N- may convert to amines when it is adsorbed on the iron surface. Increasing the irradiation time, benzene sulfonic acid and aniline appear followed by the formation of benzene and phenol. Further degradation leads to complete mineralization.
During the irradiation of sHT(H+) dispersion, bands at 505 nm and 317 nm completely disappeared after 180 min, while the peak at 257 nm increased with irradiation time up to 4 h and then decreased (see Figure 6). The disappearance of the 505 nm absorption peak and the appearance of the peak at 257 nm confirm that -N=N- bonding is completely decomposed, corresponding to the disappearance of the red color in the solution, and a new benzene ring is formed with a smaller molecular weight as a reaction product after the degradation reaction. This toxic by-product is further removed with increasing irradiation time.
The kinetics of photodegradation reactions are examined based on the dye concentration change by measuring the characteristic absorbance peak (i.e., 505 nm) at different irradiation times. Figure 7 reports the efficiency of MO degradation by each sample versus irradiation time (a) and the kinetic curves (b) for photocatalytic processes considering C = C0 exp(−kt), where C and C0 are the dye concentration at time t and zero, respectively, k is the kinetic constant and t is the irradiation time.
The rate constants k, calculated as the slope fitting of the experimental C/C0 data versus irradiation time, and the R2 values for each fitting, are reported in the Table 3. The half-life time t1/2 is calculated by t1/2 = 0.6932/k. This is the time required to photodegradate half of the initial dye concentration, which is used to quantitatively compare the photodegradation reaction.
The kinetic constant for the photodegradation is one order of magnitude greater for the supernatant with respect to the initial sample and the precipitate. Consequently, the half-life time is 82% and 87% lower than the one for HT(H+) and pHT(H+), respectively. The last one shows the low kinetic constant and higher half-time; although the two samples show similar photodegradation trends (see Table 2), the reduced amount of iron and alumina in the precipitate decreased the kinetic constant of the process, confirming the key role iron species play in the photocatalytic process.

3. Discussion

The surface modification of halloysite or, more generally, of kaolin-group minerals includes thermal treatments and acid activation [36]. In the first case, at the 600–850 °C temperature range, hydroxyl groups are removed reducing aluminum coordination and generating active centers for adsorption. Similarly, hydrochloric acid has been used to remove mineral impurities and promote aluminum octahedral sheets dissolution. By increasing the concentration of acid or etching time, tetrahedral sheets also start to be etched followed by the precipitation of SiO2. This partial destruction of the surface layers increases the mineral reactivity [36]. Furthermore, the acid treatment could favor the extraction of iron naturally present in the clay since it is soluble at a pH equal or below 3 [34].
In our experiment, we promoted the dissolution of iron contained in the aluminosilicate clay by treatment with concentrated hydrochloric acid; high H+ concentrations promote the dissolution of iron destroying Fe-O bonds in the crystal lattice of iron-bearing minerals [37]. Indeed, the iron content measured by XRF decreased from 14% for the initial sample to 6.8% for the precipitate after the acid treatment. Furthermore, the elemental analysis underlined that the Al structural unit of the halloysite was partly destroyed by acid treatment, increasing the molar ratio of Si/Al from 1.13 in the halloysite to 2.56 in the acid treated one. At the very beginning, we hypothesized that the iron on the surface would rapidly dissolve in the solution as Fe3+ by reaction with H+; after the dissolution of the superficial iron, the one in the hydroxyl sheets and interlayers of the halloysite structure would be further dissolved by destroying the crystal structure. This mechanism is reported in the following Equations (1) and (2).
Fe2O3 + 6HCl → 2FeCl3 + 3H2O
3Al2O32SiO2 + 18HCl → 6AlCl3 + 2SiO2 + 9H2O
This is also confirmed by the appearance of an absorbance peak at 334 nm in the solution of supernatant due to iron ions.
Extracted iron ions from the clay show a photocatalytic activity for MO degradation under UV-Visible light irradiation; at neutral pH the clay was not able to adsorb MO due to electrostatic repulsion and, consequently, no photodegradation occurred under irradiation (see Figure S5 of Supporting Information). Although at acid pH both the dye and the clay were positively charged and thus no adsorption was observed, the material showed the ability to degrade MO under irradiation (see Figure 6). In particular, the best activity was observed for the supernatant because of the higher iron amount.
The photodegradation process occurring in the presence of iron species is the Fenton oxidation process which has been successfully applied to the treatment of textile effluents [38]. In the Fenton process, hydroxyl radicals are generated from the reduction of hydrogen peroxide by the simultaneous oxidation of Fe2+ to Fe3+ as reported in Equation (3). Fe3+ is then reduced back to Fe2+ by another molecule of hydrogen peroxide, forming a hydroperoxyl radical and a proton, see Equation (4). The net effect is a disproportionation of hydrogen peroxide to create two different oxygen-radical species, with water as a byproduct Equation (5). These generated free radicals engage secondary reactions for oxidation, i.e., degradation of organic compounds to carbon dioxide and water.
Fe2+ + H2O2 → Fe3+ + OH + OH
Fe3+ + H2O2 → Fe2+ + HOO + H+
2H2O2 → HOO + OH + H2O
The Fenton reaction depends on the presence of iron species: the reaction only proceeds rapidly under acidic conditions (pH = 2.5–3) to avoid the precipitation of Fe(OH)3, lowering the concentration of the Fe3+ species in the solution. The degradation rate is increased under UV irradiation due to the photoreduction of Fe3+ to Fe2+ ions, which produce new OH radicals according to the following mechanism of Equations (6) and (7) [39]. This process is called the photo-Fenton reaction.
Fe3+ + H2O + hν → Fe2+ + OH + H+
H2O2 + hν → 2OH
In an aqueous solution, in the absence of other ligands and acidic medium, the ferric ion exists as aqueous complexes up to [Fe(H2O)6]3+; these complexes are formed depending on pH by the following reaction.
Fe3+ + H2O → Fe (OH)2+ + H+
Under irradiation, an electron is promoted from an orbital centered in the ligand to a metal-centered orbital involving the reduction of Fe3+ to Fe2+ and ligand oxidation forming hydroxyl radicals:
Fe (OH)2+ + → Fe2+ + OH
The species Fe(OH)2+ show maximum absorbance at about 300 nm extending to 400 nm, which enables solar-irradiated photo-Fenton reactions. These hydroxylated species which are responsible for light absorption are insoluble at pH levels above 5, thus the acid environment is fundamental for the efficiency of this process. The optimum pH range to obtain the maximum efficiency was found to be between 2.5 and 3.0 [38]. This is the major drawback of the Fenton process since the acid pH should be maintained throughout the whole reaction time and the treated wastewater should be neutralized at the end of the process.
Recently, the use of iron ions immobilized on solid support (i.e., Nafion membranes and iron-modified clays) has been investigated [39]. If the particles’ immobilization avoids the formation of sludge, as shown in other studies using nanomaterials [4,5,6,7,9], the ions and contaminants must diffuse to the surface. In our system, iron was naturally present and immobilized in bare clay, thus this material could be used, in principle, for Fenton processes. Iron is agglomerated on clay layers or dispersed inside them, as shown by TEM analysis, and the interaction with water contaminants is difficult both for electrostatic repulsion (as in the case of MO) and for the fact that water contaminants should diffuse inside the clay structure to come in contact with iron. The acid treatment fosters the interaction between iron ions and water contaminants, thanks to the destruction of alumina layers and the release of iron species in solution. As explained above, the photo Fenton process involves hydroxyl radicals for the oxidation of organic contaminants, usually generated by UV irradation or by additional hydrogen peroxide (see Equations (6) and (7). In our case, hydrogen peroxide was not added during the process and additional hydroxyl radicals could be produced on silica and/or alumina surfaces.
Previous studies have suggested the presence of some radical species on the silica surface, however, the generation mechanism of the OH radical remains unclear [40,41]. The interaction of an H2O molecule with cluster models of fractured silica surfaces was studied by means of quantum mechanical calculations [40]: these calculations suggested that when silica is fractured in a vacuum, homolytic cleavage is favored. The reaction of H2O with ≡Si and ≡SiO radicals was predicted to generate OH [40]. The UV light irradiation has sufficient energy to generate hydroxyl radicals on silica surfaces. According to [41], the cleavage of the Si–O–Si bond requires energy as high as 540.19 kJ/mol, while the direct bond-breaking of surface silanol groups requires energy ranging from 428 to 435 kJ/mol according to the nature of the SiOH group. Another possibility for the generation of OH is the reaction of physically adsorbed water with reactive silanol sites on silica, which only consumes 211.51 kJ/mol of energy [41]. In our experiment, we irradiated the clay with a UV lamp having main emissions at 313, 365, 405 and 435 nm (see Figure S6 of SI) corresponding to energy values of 385, 327, 295 and 275 kJ/mol, respectively. These energies are sufficient to induce hydroxyl radicals’ generation by involving water molecules physiosorbed on a silica surface. Furthermore, acid treatment could weaken Si-O-Si and Si-OH bonds by interaction with Cl, indeed, this is present on the treated clay’s surface, as revealed by the EDX spectra acquired during the TEM analysis. Consequently, hydroxyl radicals could be generated with lower energies.
Similarly, hydroxyl radicals could also be generated on the remaining alumina surfaces after the acid treatment. Recently the photochemical removal of hexachlorobenzene (HCB) in an aqueous system by alumina was investigated and the generation of hydroxyl radicals on Al2O3 surface under 500 W Xe lamp irradiation was verified by EPR and theoretical calculations [42]. These could be formed by the homolytic cleavage of water molecules resulting in the formation of OH and H radicals. Second, the water molecules, with the characteristics of Lewis base, could coordinate onto Lewis’s acid sites of Al2O3 to generate hydroxyl radicals under irradiation. Moreover, the cleavage of the Al-OH bond could also produce OH. The Gibbs free energies for these three reactions were calculated to be 455, 420 and 481 kJ/mol, corresponding to the irradiation energies of 262, 285 and 248 nm UV light, respectively. Considering the energy of the lamp used in our experiments and the fact that alumina layers were destroyed during acid treatment, the generation of hydroxyl radials could be adducted to the silica surface. Furthermore, the generation of radicals on the alumina could be not completely neglected considering that interactions with Cl could weaken O-Al-O and Al-OH bonds, reducing the energy required for OH radicals’ generation.

4. Materials and Methods

The raw halloysite (HT) mineral used in this work, as a product of basalt weathering, is obtained from the “Dunino Mine” located in Lower Silesia (Poland) [26]. The samples were structurally characterized and tested for anionic dye removal (i.e., Methyl Orange MO) both as received and after acid treatment with hydrochloric acid. Hydrochloric acid 37% wt and MO (0.1% in H2O) were acquired at Merck Life Science S.r.l. (Milan, Italy).
Raw HT powder was dispersed in water by ultrasonication for 6 h and the resulting dispersion was further ultra-sonicated for one hour before each measurement. HT samples with a concentration of 0.23 mg/mL and 0.115 mg/mL were treated by adding hydrochloric acid until the solution achieved pH < 3 and these underwent ultrasonication for 30 min. The last process was performed to extract iron particles from the aluminosilicate layers and make iron available for the photocatalytic process. A precipitate was observed after 24 h the supernatant was collected, and the precipitate was dispersed in water by ultra-sonication for one hour.
The UV-Visible spectra of acid raw HT, the precipitate, and the supernatant (here named, HT(H+), pHT(H+) and sHT(H+), respectively) were recorded using a UV-Vis spectrophotometer (Cary® 50 UV/vis by Agilent Technologies, Santa Clara, CA, USA), in a wavelength range between 200 and 800 nm, using wide optical window quartz cuvettes (200–2500 nm).
After acidification, the most concentrated clay dispersion (i.e., 0.23 mg/mL) underwent the ultra-sonication step for increasing time: different aliquots were collected after 30, 60, 120 and 180 min. A precipitate was observed after 24 h in each aliquot, these were re-dispersed in water after being separated from each supernatant and UV-Visible spectra were acquired as described above. The amount of iron ions dissolved in acid solutions for each sample versus raw clay concentrations and versus ultrasonication time was calculated as μg of iron ions per mg of HT (QFe). The amount of dissolved iron ions was calculated by the peak of the UV-visible spectra at 334 nm, as acquired from different samples according to the calibration curve obtained for FeCl3 solutions at different known concentrations (see Figure 8).
Morphological analysis and chemical mapping of the samples were performed using a field emission scanning electron microscope (Supra 35 FE-SEM by Zeiss, Oberkochen, Germany) equipped with an energy dispersive X-ray (EDX) microanalysis system (X-MAX, 80 mm2 by Oxford Instruments, Abingdon, UK). The clay powder was dispersed in water at neutral and acid pH, respectively, and some drops of the solution were deposited on a polymeric film (NexarTM) and used as the substrate for the SEM analysis.
Transmission electron microscopy (TEM) was used for the nanoscale structural characterization. To make the specimen suitable for TEM observation, an aqueous solution containing the clay powder at neutral and acid pH was dropped out on a lacey-carbon grid. TEM analysis was performed by Jeol JEM-2010F (Jeol, Peabody, MA, USA) at 200 keV. A low dose electron beam was used during TEM analysis to avoid sample modification, nevertheless we observed that some tubular structures are quickly modified under the electron beam. Scanning TEM and EDX investigations were performed with JEOL ARM200F (Peabody, MA, USA).
The elemental composition of the halloysite material was performed using a Rigaku Supermini200 (Tokyo, Japan), a benchtop wavelength dispersive X-ray fluorescence (WDXRF) spectrometer equipped with a Pd X-ray tube for X-ray production. The sample was included in a pressed pellet using boric acid as binder; the concentrations of the major and minor elements were calculated using ZSX software (Rigaku, Tokyo, Japan).
The oxidative potential of the initial and acid treated clay was evaluated by the photocatalytic degradation of MO dye in water. This was compared with the samples’ adsorption ability in the dark. Halloysite samples at 0.23 mg/mL were directly tested for MO adsorption at pH = 5.8 by dispersing the clay in MO solution (10−5 M) in the dark, or the same HT/MO sample was tested for photodegradation under UV-Visible light irradiation. The irradiation was performed by an 18 W UVA/blue DULUX n.78 OSRAM lamp (OSRAM GmbH, Munich, Germany) (producing mainly UV emission at 365 nm and a few narrow lines in the visible). The emission spectrum of the lamp is reported in Figure S6 of the Supporting Information. Furthermore, two HT samples at different concentrations were acidified at pH < 3 by adding HCl (here named HT(H+)). For each sample, an aliquot (5 mL) was directly tested for MO adsorption or photocatalytic degradation. The remaining aliquot (5 mL) was sonicated for 2 h after acidification and then it was decanted over night. A precipitate (pHT(H+)) on the bottom of the flask appeared and this was separated by the supernatant (sHT(H+)). The last one was directly tested for the adsorption or photocatalytic degradation of MO. At the same time, the precipitate was dispersed in 5 mL of water and tested for MO adsorption or degradation (the pH of precipitate remained at a value below 3).
All the experiments were conducted at pH < 3. The MO removal efficiency was evaluated by measuring the changes in the UV-Vis absorbance spectra acquired using a UV-Vis spectrophotometer (Cary® 50 UV/vis by Agilent Technologies), in a wavelength range between 200 and 800 nm, using wide optical window quartz cuvettes (200–2500 nm). In particular, the MO concentrations were evaluated by means of the Lambert–Beer law, considering the absorbance peaks at 464 and 505 nm for neutral and acid MO solution, respectively.

5. Conclusions

In this study we present the use of natural Dunino halloysite as source of reagent in Fenton photocatalytic processes for organic molecule degradation. The reported results concern (i) the chemical and morphological characterization of the clay before and after acid treatment; (ii) the release of iron ions from the clay; and (iii) their application in the photocatalytic process for MO degradation.
(i)
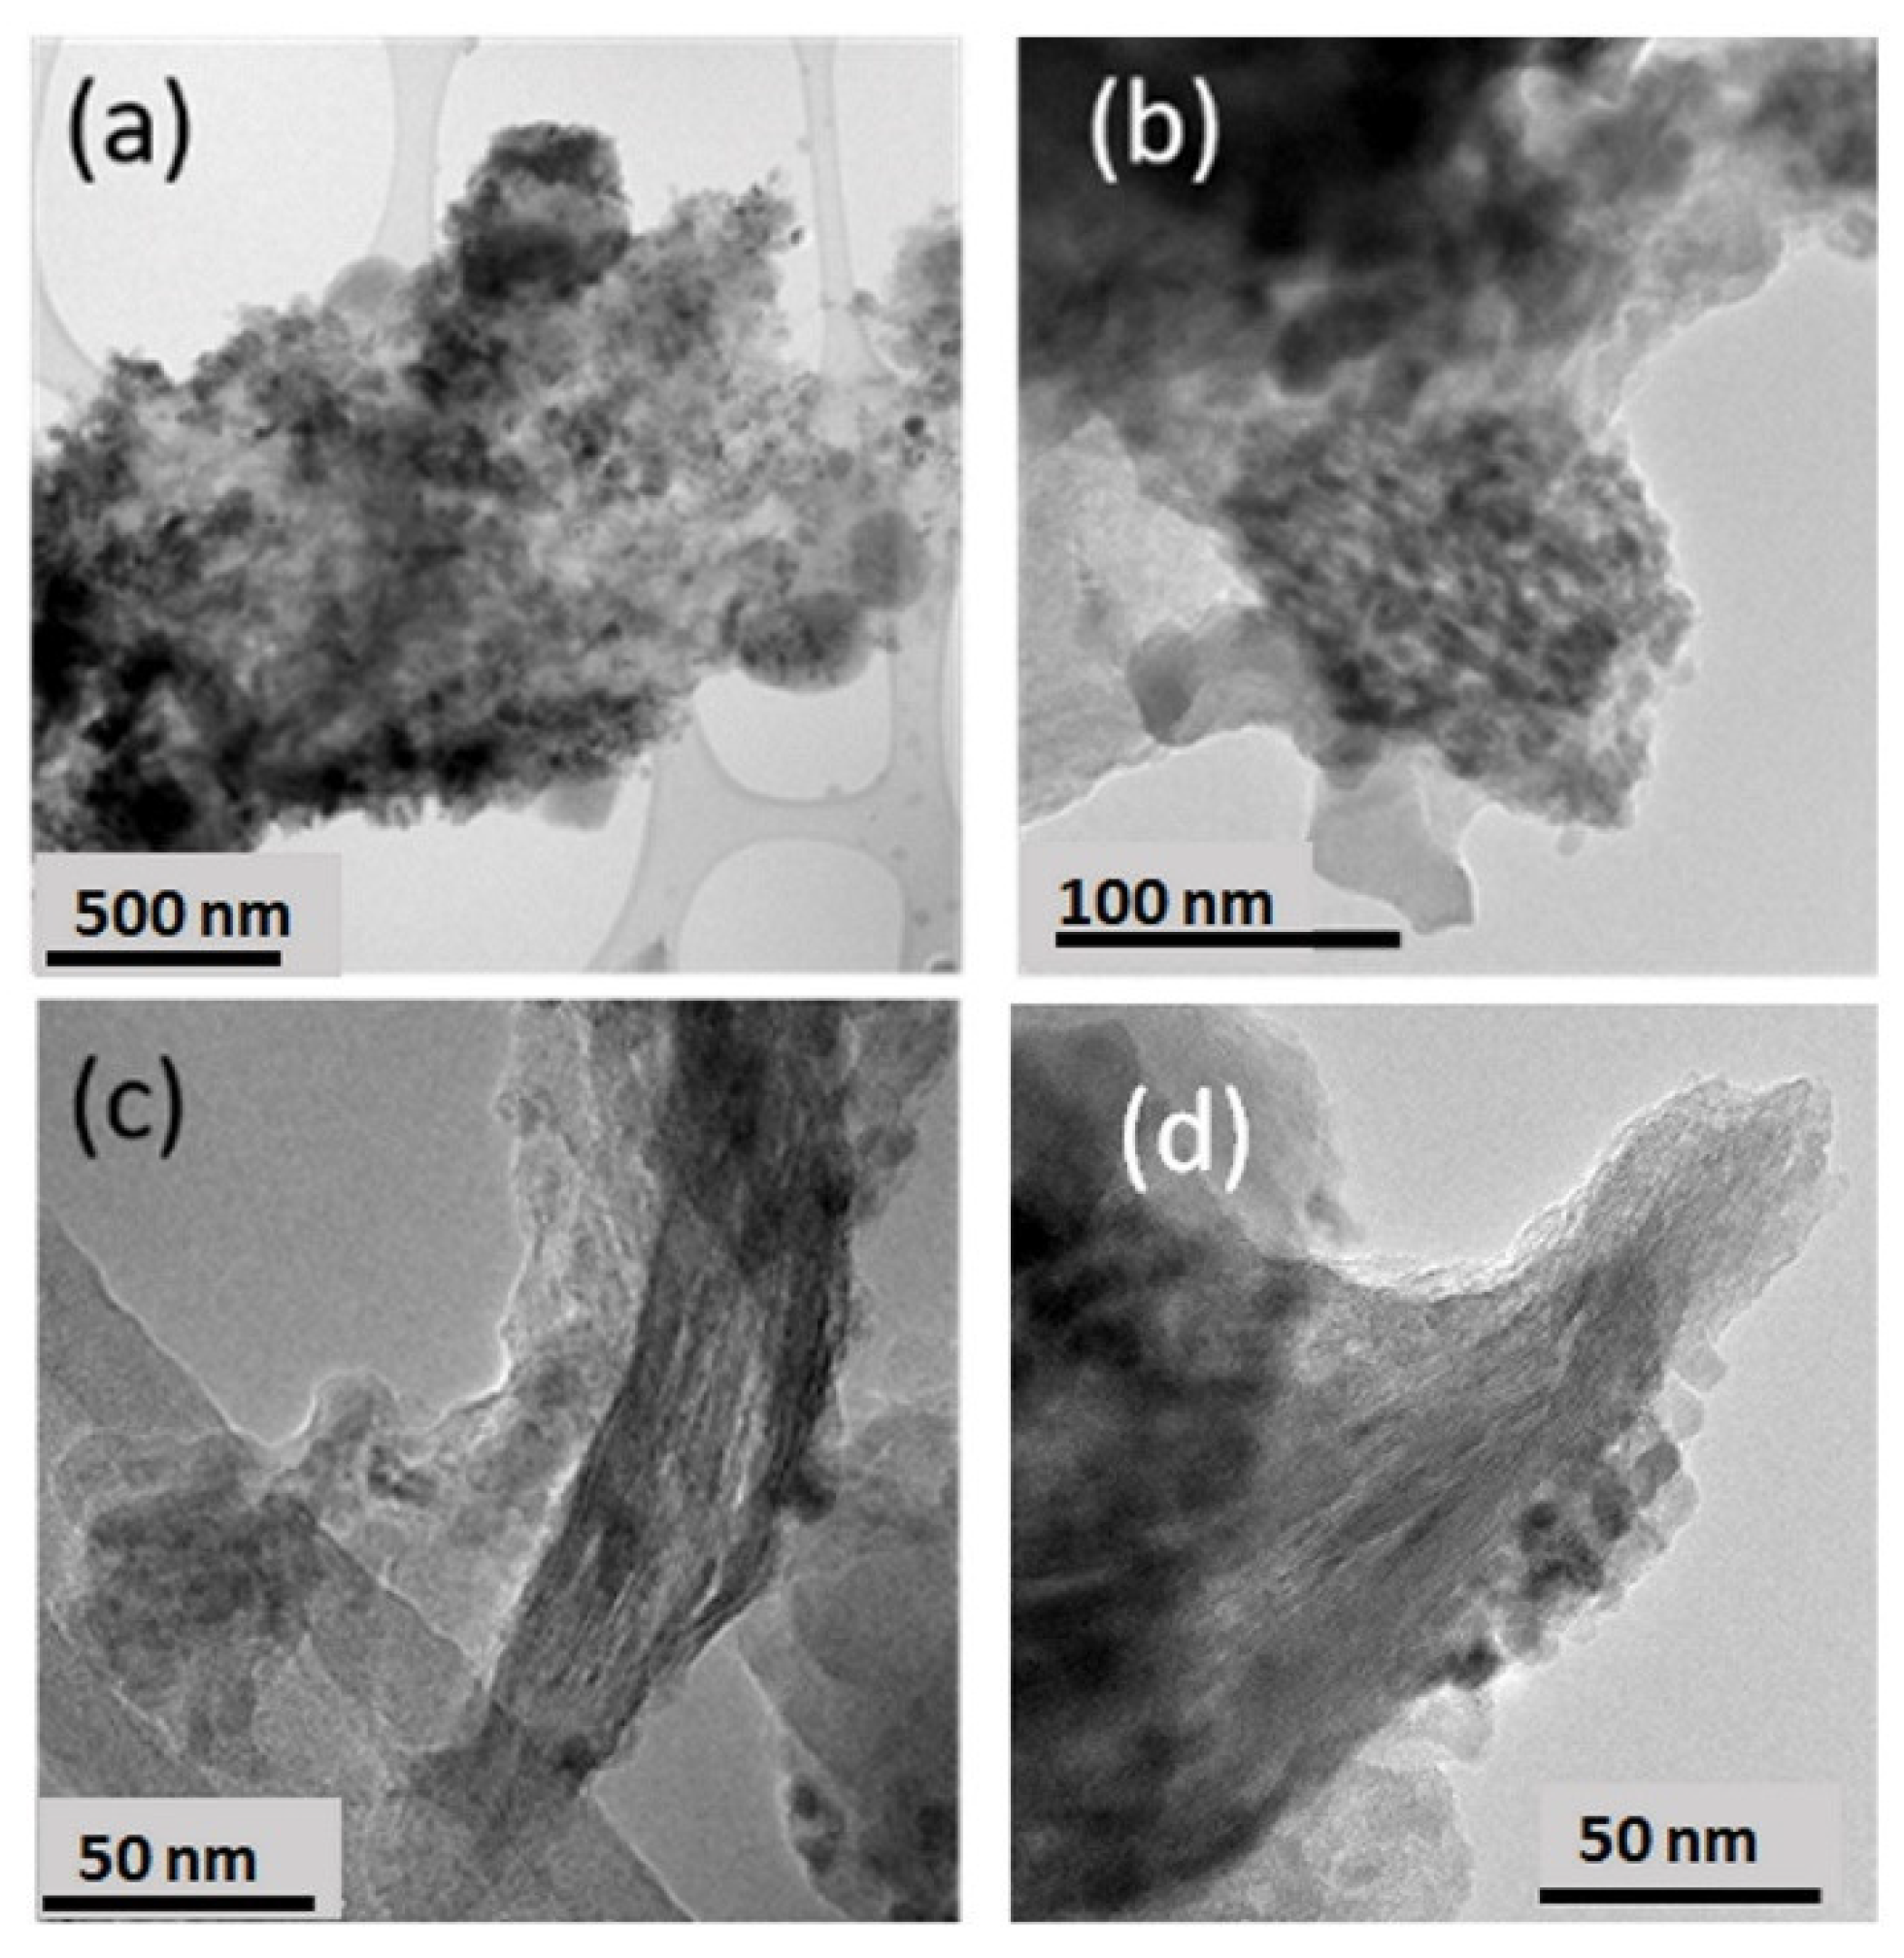
The natural clay consists of platy and tubular structures mainly composed of Si, Al, O, and Fe. Iron is distributed all over the sample, both as substitutional ion and as hematite particles in a total amount of 14% of the total weight, as measured by XRF analysis.
(ii)
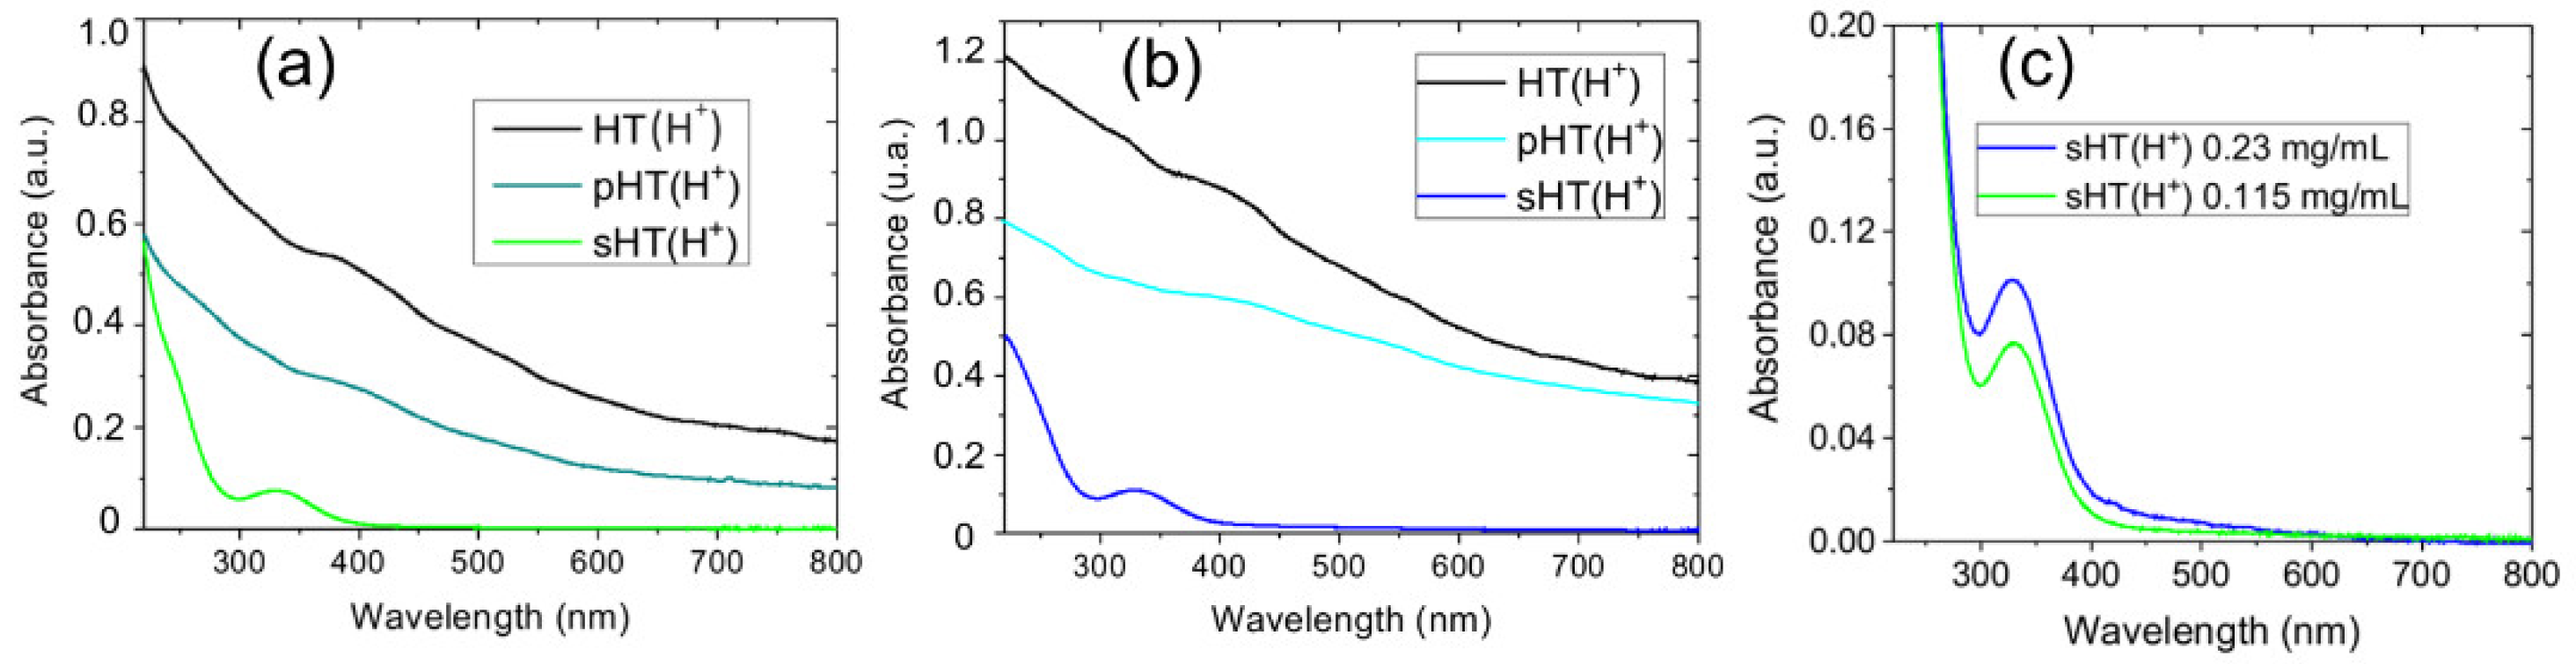
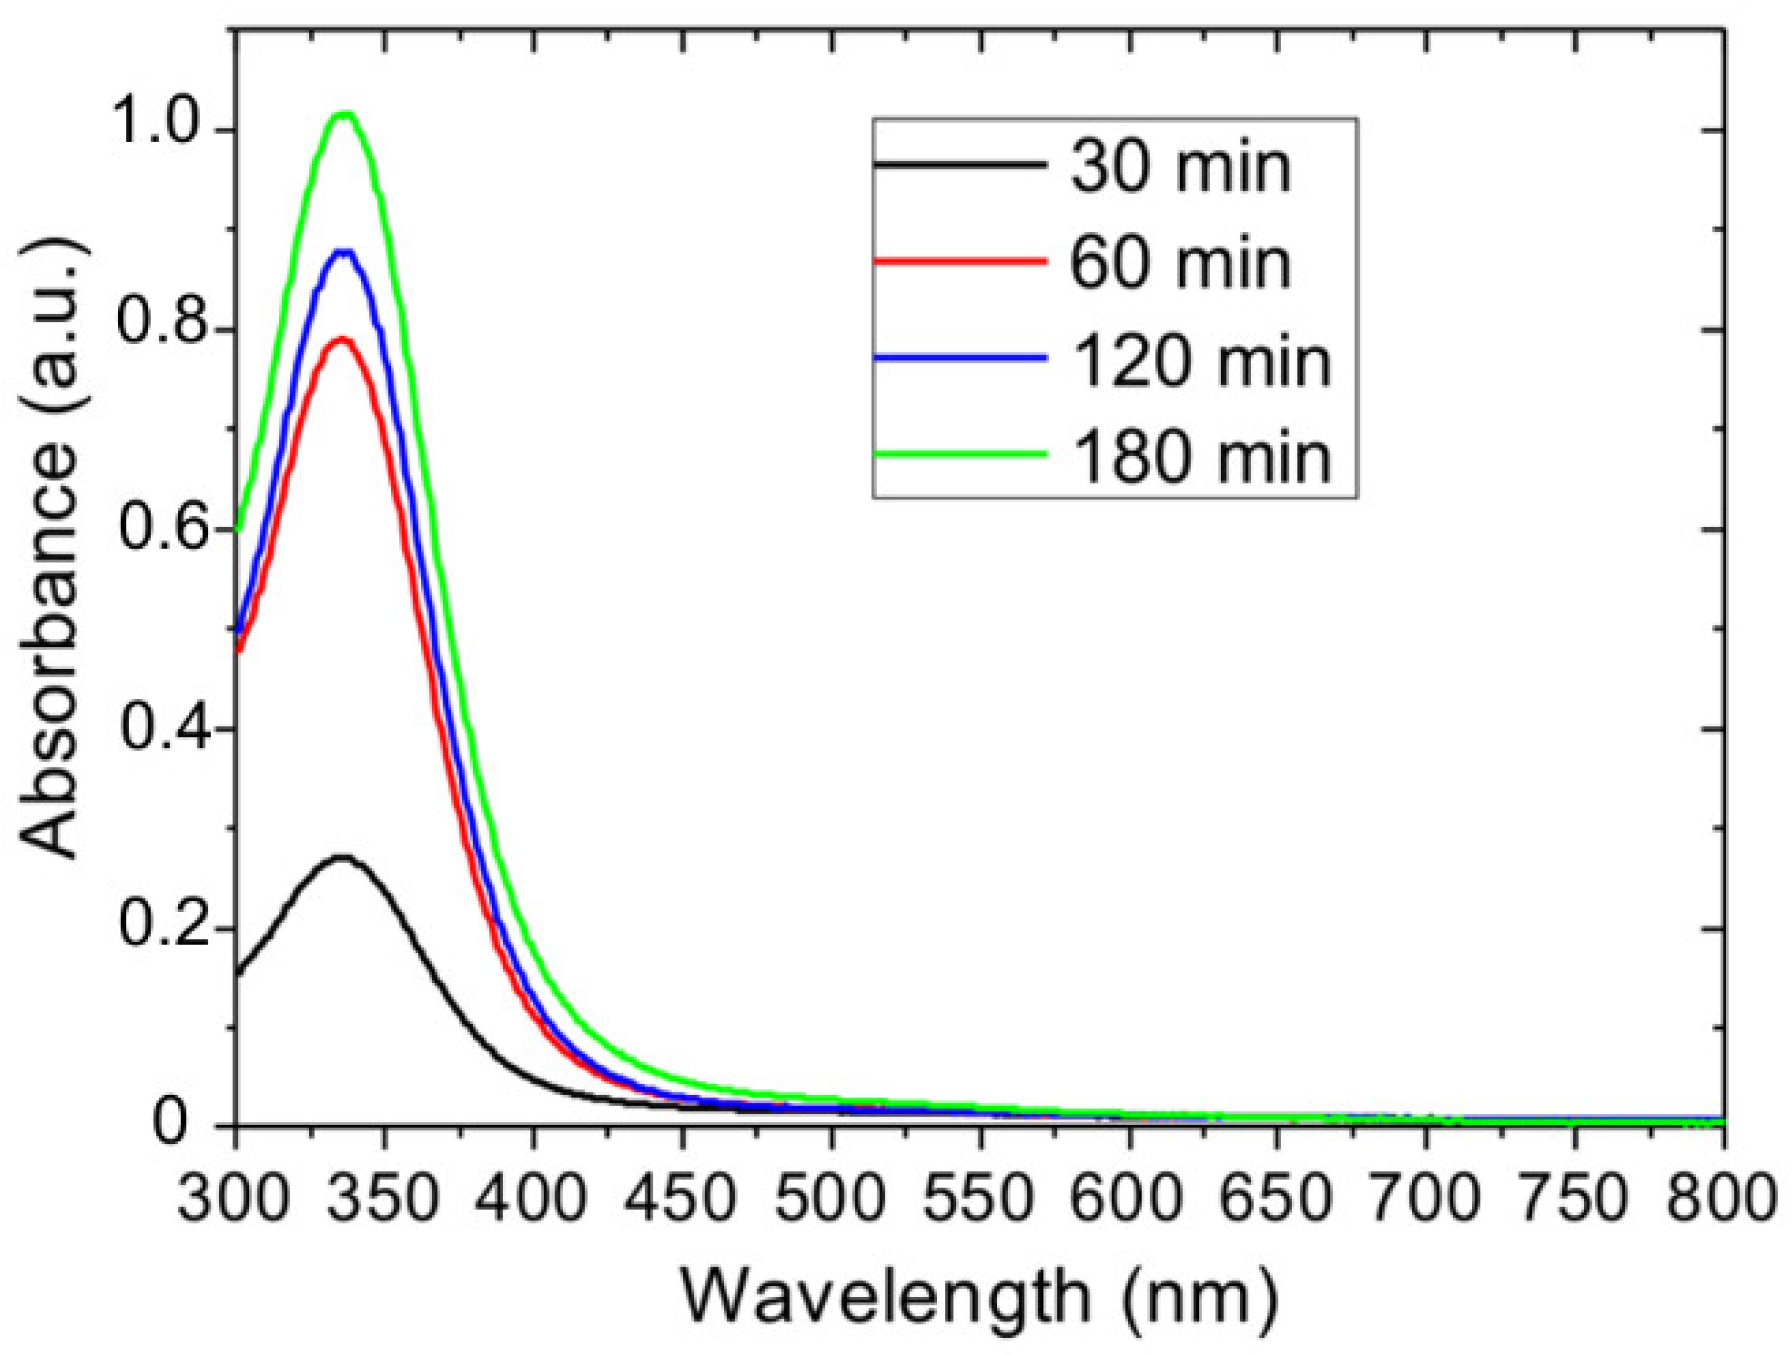
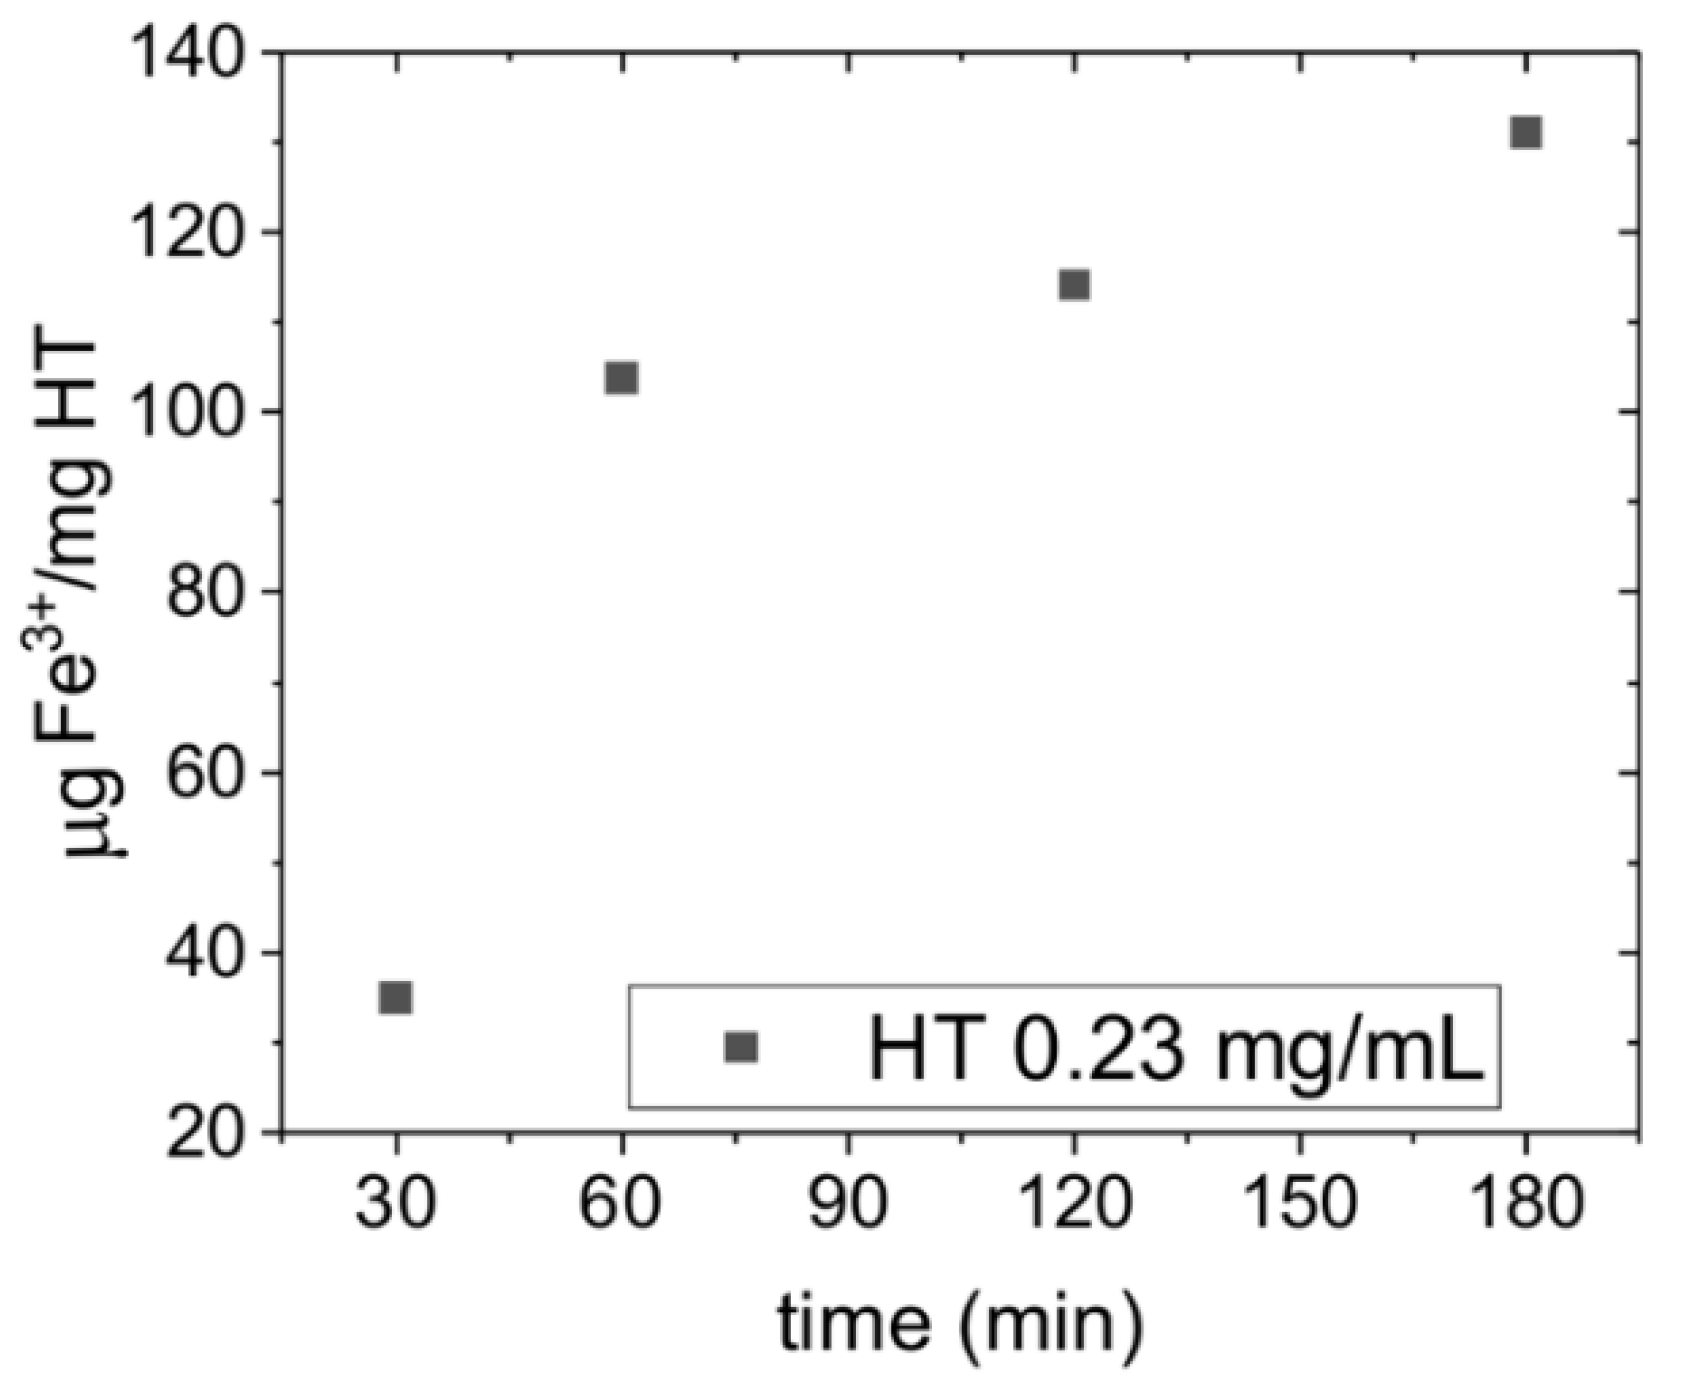
The acid treatment of this clay by hydrochloric acid was performed to etch alumina layers and release iron ions into the water solution. This was confirmed by chemical analysis which reported a lower amount of Al (from 16.6 to 9.4%) and Fe (from 14.2 to 6.8%) in the precipitated HT structures after acid treatment. Considering the total amount of iron in bare clay measured by XRF and the amount of Fe ions measured by UV-Visible spectroscopy on supernatant solutions, the % of Fe extraction is estimated as 19% and 25% for HT 0.115 mg/mL and 0.23 mg/mL, respectively. At neutral pH this clay has a negative surface charge, while at acid pH it is positive. However, the adsorption of MO is forbidden at both pH values due to electrostatic repulsion, since MO is also negatively charged at neutral pH and is protonated at low pH. On the contrary, under UV irradiation in acidic conditions, this clay removed MO very efficiently, demonstratinng noteworthy photodegradation activity: 47% and 35% MO removal efficiency was observed for HT(H+) and pHT(H+) samples, respectively. This percentage increased up to 100% for the supernatant solution containing iron ions extracted from the clay: sHT(H+) was able to completely remove MO after 3 h under irradiation and the kinetic constant for the photodegradation of MO is one order of magnitude greater for the supernatant with respect to the initial sample and the precipitate. These results confirm that MO degradation activity depends on the amount of iron and occurred due to a photo Fenton process induced by iron ions extracted in the solution and hydroxyl radicals extracted from alumina/silica surface.
The reported results point towards the possibility of using this natural and low-cost material as an iron source in Fenton processes, reducing the production of sludge from iron salts and the use of hydrogen peroxide, thus reducing the cost of the process and the impact on the environment. The proposed solution could be extended to the remediation of water contaminated by biologically active organic substances, such as medications.

Supplementary Materials

The following supporting information can be downloaded at online https://0-www-mdpi-com.brum.beds.ac.uk/article/10.3390/catal12030257/s1, Figure S1: SEM images of clay powder deposited on polymeric substrate for the EDX analysis before (a) and after (b,c) acid treatment. The white squares indicate the sample area where EXD spectrum was acquired; Table S1: Si/Al, Fe/Si and Fe/Al ratios acquired by EDX spectra on a different area of the clay powder deposited on the polymeric substrate before and after acid treatment; Figure S2: HR-TEM image of an HT(H+) sample and its line profile from the region defined by the red box. The (001) basal spacing measured by the line profile is 1.0 nm; Figure S3: EDX spectra acquired on initial (blue curve) and treated (red curve) samples during TEM acquisition; Figure S4: UV-Visible spectra of MO solutions and HT/MO solutions both at neutral and acid pH; Figure S5: UV-Visible spectra of raw HT sample after adding MO at pH = 5.8 in the dark (a) and under UV-Visible light irradiation (b); Figure S6: UV-Visible spectra of (a) HT(H+), (b)p HT(H+) and (c) sHT(H+) after adding MO in the dark; Figure S7: The emission spectra of an 18 W UVA/blue DULUX n.78 OSRAM lamp.

Author Contributions

Conceptualization, S.F. and S.S.; methodology, S.F., C.B., S.L., S.S. and D.I.; software, S.F., C.B., S.L., S.S. and D.I.; validation, S.F., C.B., S.L., S.S., D.I. and L.G.; formal analysis, S.F., C.B., S.L., S.S. and D.I.; investigation, S.F., C.B., S.L., S.S. and D.I.; resources, S.F., S.S. and L.G.; data curation, S.F., C.B., S.L., S.S., D.I. and L.G.; writing—original draft preparation, S.F. and S.S.; writing—review and editing, S.F. and S.S.; visualization, S.F., C.B., S.L., S.S., D.I. and L.G.; supervision, S.S.; project administration, S.S. All authors have read and agreed to the published version of the manuscript.

Funding

This research received no external funding.

Data Availability Statement

Not applicable.

Conflicts of Interest

The authors declare no conflict of interest.

References

  1. Matusik, J. Halloysite for adsorption and pollution remediation. In Nanosized Tubular Clay Minerals; Yuan, P., Thill, A., Bergaya, F., Eds.; Elsevier: Amsterdam, The Netherlands, 2016; pp. 1–754. [Google Scholar]
  2. Babuponnusami, A.; Muthukumar, K. A review on Fenton and improvements to the Fenton process for wastewater treatment. J. Environ. Chem. Eng. 2014, 2, 557–572. [Google Scholar] [CrossRef]
  3. Singh, N.B.; Nagpal, G.; Agrawal, S.; Rachna. Water purification by using Adsorbents: A Review. Environ. Technol. Innov. 2018, 11, 187–240. [Google Scholar] [CrossRef]
  4. Buccheri, M.A.; D’Angelo, D.; Scalese, S.; Spanò, S.F.; Filice, S.; Fazio, E.; Compagnini, G.; Zimbone, M.; Brundo, M.V.; Pecoraro, R.; et al. Modification of graphene oxide by laser irradiation: A new route to enhance antibacterial activity. Nanotechnology 2016, 27, 245704. [Google Scholar] [CrossRef] [PubMed]
  5. Scalese, S.; Nicotera, I.; D’Angelo, D.; Filice, S.; Libertino, S.; Simari, C.; Dimos, K.; Privitera, V. Cationic and anionic azo-dye removal from water by sulfonated graphene oxide nanosheets in Nafion membranes. New J. Chem. 2016, 40, 36543663. [Google Scholar] [CrossRef]
  6. Filice, S.; Mazurkiewicz-Pawlicka, M.; Malolepszy, A.; Stobinski, L.; Kwiatkowski, R.; Boczkowska, A.; Gradon, L.; Scalese, S. Sulfonated Pentablock Copolymer Membranes and Graphene Oxide Addition for Efficient Removal of Metal Ions from Water. Nanomaterials 2020, 10, 1157. [Google Scholar] [CrossRef]
  7. Filice, S.; Bongiorno, C.; Libertino, S.; Compagnini, G.; Gradon, L.; Iannazzo, D.; La Magna, A.; Scalese, S. Structural Characterization and Adsorption Properties of Dunino Raw Halloysite Mineral for Dye Removal from Water. Materials 2021, 14, 3676. [Google Scholar] [CrossRef]
  8. Loures, C.; Alcântara, M.; Filho, H.; Teixeira, A.; Silva, F.; Paiva, T.; Samanamud, G. Advanced Oxidative Degradation Processes: Fundamentals and Applications. Int. Rev. Chem. Eng. (IRECHE) 2013, 5, 102–120. [Google Scholar] [CrossRef]
  9. Glaze, W.H.; Kang, J.W.; Chapin, D.H. The chemistry of water treatment processes involving ozone, hydrogen peroxide and ultraviolet radiation. Ozone Sci. Eng. 1987, 9, 335–352. [Google Scholar] [CrossRef]
  10. Filice, S.; D’Angelo, D.; Scarangella, V.; Iannazzo, V.; Compagnini, V.; Scalese, S. Highly effective and reusable sulfonated pentablock copolymer nanocomposites for water purification applications. RSC Adv. 2017, 7, 45521–45534. [Google Scholar] [CrossRef] [Green Version]
  11. D’Angelo, D.; Filice, S.; Libertino, S.; Nicotera, I.; Kosma, V.; Privitera, V.; Scalese, S. Photocatalytic properties of Nafion membranes containing graphene oxide/titania nanocomposites. In Proceedings of the 2014 IEEE 9th Nanotechnology Materials and Devices Conference (NMDC), Aci Castello, Italy, 12–15 October 2014; pp. 54–57. [Google Scholar]
  12. Filice, S.; D’Angelo, D.; Libertino, S.; Nicotera, I.; Kosma, V.; Privitera, V.; Scalese, S. Graphene oxide and titania hybrid Nafion membranes for efficient removal of methyl orange dye from water. Carbon 2015, 82, 489–499. [Google Scholar] [CrossRef]
  13. D’Angelo, D.; Filice, S.; Scarangella, A.; Iannazzo, D.; Compagnini, G.; Scalese, S. Bi2O3/Nexar® polymer nanocomposite membranes for azo dyes removal by UV–vis or visible light irradiation. Catal. Today 2019, 321, 158–163. [Google Scholar] [CrossRef]
  14. Filice, S.; D’Angelo, D.; Spanò, S.F.; Compagnini, G.; Sinatra, M.; D’Urso, L.; Fazio, E.; Privitera, V.; Scalese, S. Modification of graphene oxide and graphene oxide–TiO2 solutions by pulsed laser irradiation for dye removal from water. Mater. Sci. Semicond. Proc. 2015, 42, 50–53. [Google Scholar] [CrossRef]
  15. Neyens, E.; Baeyens, V. A review of classic Fenton’s peroxidation as an advanced oxidation technique. J. Hazard. Mater. 2003, 98, 33–50. [Google Scholar] [CrossRef]
  16. Bautista, P.; Mohedano, A.F.; Casas, J.A.; Zazo, J.A.; Rodriguez, J.J. An overview of the application of Fenton oxidation to industrial wastewaters treatment. J. Chem. Technol. Biotechnol. 2008, 83, 1323–1338. [Google Scholar] [CrossRef]
  17. Moraes, J.E.F.; Quina, F.H.; Nascimento, C.A.O.; Silva, D.N.; Chiavone-Filho, O. Treatment of Saline Wastewater Contaminated with Hydrocarbons by the Photo-Fenton Process. Environ. Sci. Technol. 2004, 38, 1183–1187. [Google Scholar] [CrossRef]
  18. Da Costa Filho, B.M.; Da Silva, V.M.; De Oliveira Silva, J.; Da Hora Machado, A.E.; Trovó, A.G. Coupling coagulation, flocculation and decantation with photo-Fenton process for treatment of industrial wastewater containing fipronil: Biodegradability and toxicity assessment. J. Environ. Manag. 2016, 174, 71–78. [Google Scholar] [CrossRef] [PubMed]
  19. Hansson, H.; Kaczala, F.; Marques, M.; Hogland, W. Photo-Fenton and Fenton oxidationof recalcitrant industrial wastewater using nanoscale zero-valent iron. Int. J. Photoenergy 2012, 2012, 1–11. [Google Scholar] [CrossRef] [Green Version]
  20. Kakavandi, B.; Takdastan, A.; Pourfadakari, S.; Ahmadmoazzam, M.; Jorfi, S. Heterogeneous catalytic degradation of organic compounds using nanoscale zero-valent iron supported on kaolinite: Mechanism, kinetic and feasibility studies. J. Taiwan Inst. Chem. Eng. 2019, 96, 329–340. [Google Scholar] [CrossRef]
  21. Herney-Ramirez, J.; Vicente, M.A.; Madeira, L.M. Heterogeneous photo-Fenton oxidation with pillared clay-based catalysts for wastewater treatment: A review. Appl. Catal. B Environ. 2010, 98, 10–26. [Google Scholar] [CrossRef]
  22. Awasthi, A.; Jadhao, P.; Kumari, K. Clay nano-adsorbent: Structures, applications and mechanism for water treatment. SN Appl. Sci. 2019, 1, 1076. [Google Scholar] [CrossRef] [Green Version]
  23. Bozzi, A.; Yuranova, T.; Mielczarski, J.; Lopez, A.; Kiwi, J. Abatement of oxalates catalyzed by Fe-silica structured surfaces via cyclic carboxylate intermediates in photo-Fenton reactions. Chem. Commun. 2002, 19, 2202–2203. [Google Scholar] [CrossRef]
  24. Feng, J.; Hu, X.; Lock Yue, P. Effect of initial solution pH on the degradation of Orange II using clay-based Fe nanocomposites as heterogeneous photo-Fenton catalyst. Water Res. 2006, 40, 641–646. [Google Scholar] [CrossRef]
  25. Thomas, N.; Dionysiou, D.D.; Pillai, S.C. Heterogeneous Fenton catalysts: A review of recent advances. J. Hazard. Mater. 2021, 404, 124082. [Google Scholar] [CrossRef] [PubMed]
  26. Sakiewicz, P.; Nowosielski, R.; Pilarczyk, W.; Golombek, K.; Lutynski, M. Selected properties of the halloysite as a component of Geosynthetic Clay Liners (GCL). J. Achiev. Mater. Manuf. Eng. 2011, 48, 177–191. [Google Scholar]
  27. Lvov, Y.M.; Shchukin, D.G.; Möhwald, H.; Price, R.R. Halloysite Clay Nanotubes for Controlled Release of Protective Agents. ACS Nano 2008, 2, 814–820. [Google Scholar] [CrossRef] [PubMed]
  28. Crini, G.; Lichtfouse, E.; Wilson, L.; Morin-Crini, N. Conventional and non-conventional adsorbents for wastewater treatment. Environ. Chem. Lett. 2019, 17, 195–213. [Google Scholar] [CrossRef]
  29. Wang, Y.H.; Siu, W.K. Structure characteristics and mechanical properties of kaolinite soils. I. Surface charges and structural characterizations. Can. Geotech. J. 2006, 43, 587–600. [Google Scholar] [CrossRef]
  30. Grim, R.E. Applied Clay Mineralogy; McGraw-Hill: New York, NY, USA, 1962. [Google Scholar]
  31. White, R.E. Introduction to the Principles of Soil Science, 2nd. ed.; Blackwell: Boston, MA, USA, 1987. [Google Scholar]
  32. Hanafi, M.F.; Sapawe, N. A review on the water problem associate with organic pollutants derived from phenol, methyl orange, and remazol brilliant blue dyes. Mater. Today Proc. 2020, 31, A141–A150. [Google Scholar] [CrossRef]
  33. Thurlow, C. China Clay from Cornwall and Devon—The modern China Clay Industry; Cornish Hillside Publication: St. Austell, UK, 2001. [Google Scholar]
  34. Zegeye, A.; Yahaya, S.; Fialips, C.I.; White, M.L.; Gray, N.D.; Manning, D.A.C. Refinement of industrial kaolin by microbial removal of iron-bearing impurities. Appl. Clay Sci. 2013, 86, 47–53. [Google Scholar] [CrossRef]
  35. Xie, S.; Huang, P.; Kruzic, J.; Zeng, X.; Qian, H. A highly efficient degradation mechanism of methyl orange using Fe-based metallic glass powders. Sci. Rep. 2016, 6, 21947. [Google Scholar] [CrossRef] [Green Version]
  36. Khalifa, A.Z.; Cizer, Ö.; Pontikes, Y.; Heath, A.; Patureau, P.; Bernal, S.A.; Marsh, A.T.M. Advances in alkali-activation of clay minerals. Cem. Concr. Res. 2020, 132, 106050. [Google Scholar] [CrossRef]
  37. Xie, T.; Lu, S.; Zeng, J.; Rao, L.; Wang, X.; Win, M.S.; Zhang, D.; Lu, H.; Liu, X.; Wang, Q. Soluble Fe release from iron-bearing clay mineral particles in acid environment and their oxidative potential. Sci. Total Environ. 2020, 726, 138650. [Google Scholar] [CrossRef] [PubMed]
  38. Ruppert, G.; Bauer, R.; Heisler, G. The photo-Fenton reaction—An effective photochemical wastewater treatment process. J. Photoch. Photobiol. A Chem. 1993, 73, 75–78. [Google Scholar] [CrossRef]
  39. Pignatello, J.J.; Oliveros, E.; MacKay, A. Advanced Oxidation Processes for Organic Contaminant Destruction Based on the Fenton Reaction and Related Chemistry. Crit. Rev. Environ. Sci. Technol. 2006, 36, 1–84. [Google Scholar] [CrossRef]
  40. Narayanasamy, J.; Kubicki, J.D. Mechanism of Hydroxyl Radical Generation from a Silica Surface:  Molecular Orbital Calculations. J. Phys. Chem. B 2005, 109, 21796–21807. [Google Scholar] [CrossRef]
  41. Qu, R.; Li, C.; Liu, J.; Xiao, R.; Pan, X.; Zeng, X.; Wang, Z.; Wu, J. Hydroxyl Radical Based Photocatalytic Degradation of Halogenated Organic Contaminants and Paraffin on Silica Gel. Environ. Sci. Technol. 2018, 52, 7220–7229. [Google Scholar] [CrossRef] [PubMed]
  42. Pan, X.; Wei, J.; Qu, R.; Xu, S.; Chen, J.; Al-Basher, G.; Li, C.; Shad, A.; Ahmed Dar, A.; Wang, Z. Alumina-mediated photocatalytic degradation of hexachlorobenzene in aqueous system: Kinetics and mechanism. Chemosphere 2020, 257, 127256. [Google Scholar] [CrossRef]
Figure 1. UV-Vis absorbance spectra of acid treated HT samples (black curves), supernatants and precipitates at 0.115 mg/mL (a) and 0.23 mg/mL (b) initial concentrations, respectively. A comparison of supernatants’ solutions for both concentrations is reported in (c).
Catalysts 12 00257 g001
Figure 2. UV-Vis absorbance spectra of acid treated HT samples at 0.23 mg/mL initial concentration for different ultrasonication times.
Catalysts 12 00257 g002
Figure 3. QFe values calculated as weight ratio (μg/mg) between dissolved iron ions and initial HT(H+) versus ultrasonication time.
Catalysts 12 00257 g003
Figure 4. SEM images of raw HT sample (a) and after adding HCl (b) deposited on a polymeric substrate.
Catalysts 12 00257 g004
Figure 5. TEM images of raw HT sample (a,c) and after adding HCl (b,d) at different magnifications.
Catalysts 12 00257 g005
Figure 6. UV-Vis absorbance spectra of MO in HT(H+) (a), pHT(H+) (b) and sHT(H+) (c) dispersions, respectively, at pH < 3 and after exposure to UV-Visible light irradiation for different times.
Catalysts 12 00257 g006
Figure 7. MO removal (%) by each HT sample versus irradiation time (a) and kinetic curves (b) for photocatalytic processes, considering C = C0 exp(−kt).
Catalysts 12 00257 g007
Figure 8. UV-Vis absorbance spectra of FeCl3 solutions at different concentrations (on the left); calibration curve of absorbance peak at 334 nm as a function of FeCl3 concentration (on the right).
Catalysts 12 00257 g008
Table 1. Chemical elemental composition of raw halloysite and the precipitate after acid treatment measured by XRF.
ElementHTpHT(H+)
Mass%Mass%
Si18.7624.12
Al16.629.43
O45.1542.15
Fe14.206.80
Ti1.962.07
Ca0.740.29
K0.682.12
Na0.541.90
P, Mn, Mg, Cr0.1 < x < 0.50.1 < x < 0.3
Ni, Zn, As, Zr, Co, V, S, Cu0.01 < x < 0.10.01 < x < 0.1
Y, Sr, Rb<0.01<0.01
Table 2. Removal (%) of MO molecules versus irradiation time for the investigated samples.
Time (min)(C-C0)/C0 (%)
HT(H+)pHT(H+)sHT(H+)
0000
60141244
120251884
1803828100
2404735100
Table 3. Kinetic constant, R2 and t1/2 values of the fitting for each sample.
Samplek (×10−3 min−1)t1/2 (min)R2
HT(H+)2.62 ± 0.004264.580.99852
pHT(H+)1.84 ± 0.004376.740.99706
sHT(H+)14.25 ± 1.6648.650.96051
Publisher’s Note: MDPI stays neutral with regard to jurisdictional claims in published maps and institutional affiliations.

