
Ag-Doped TiO2 Composite Films Prepared Using Aerosol-Assisted, Plasma-Enhanced Chemical Vapor Deposition


1
Department of Chemical Engineering, Graduate School of Engineering, Hiroshima University, 1-4-1, Kagamiyama, Higashi-Hiroshima, Hiroshima 739-8527, Japan
2
Chemical Engineering Program, Graduate School of Advanced Science and Engineering, Hiroshima University, 1-4-1, Kagamiyama, Higashi-Hiroshima, Hiroshima 739-8527, Japan
*
Author to whom correspondence should be addressed.
Catalysts 2022, 12(4), 365; https://0-doi-org.brum.beds.ac.uk/10.3390/catal12040365
Submission received: 28 February 2022
/
Revised: 17 March 2022
/
Accepted: 20 March 2022
/
Published: 23 March 2022
(This article belongs to the Special Issue Structured Semiconductors in Photocatalysis)
Abstract
:TiO2 is a promising photocatalyst, but its large bandgap restricts its light absorption to the ultraviolet region. The addition of noble metals can reduce the bandgap and electron-hole recombination; therefore, we prepared TiO2-Ag nanoparticle composite films by plasma-enhanced chemical vapor deposition (PECVD) using a mixture of aerosolized AgNO3, which was used as a Ag nanoparticle precursor, and titanium tetraisopropoxide, which acted as the TiO2 precursor. Notably, the use of PECVD enabled a low process temperature and eliminated the need for pre-preparing the Ag nanoparticles, thereby increasing the process efficiency. The structures and morphologies of the deposited films were characterized by ultraviolet (UV)—visible spectroscopy, X-ray diffraction, X-ray photoelectron spectroscopy, scanning electron microscopy, transmission electron microscopy and energy-dispersive X-ray spectroscopy, and the effects of the AgNO3 concentration on the photocatalytic activity of the deposited films were determined by assessing the degradation of methylene blue under UV light irradiation. The Ag ions were successfully reduced to metallic nanoparticles and were embedded in the TiO2 film. The best photocatalytic activity was achieved for a 1 wt% Ag-loaded TiO2 composite film, which was 1.75 times that of pristine TiO2.
1. Introduction
Since the first use of TiO2 electrodes for the photocatalytic splitting of water in 1972 [1], TiO2 has become one of the most promising photocatalysts. To date, TiO2 photocatalysts have been used in the bulk, powdered, nanostructured, and thin-film forms. In particular, the synthesis of TiO2 in the form of thin films allows it to be efficiently utilized, thereby expanding its applications [2]. Furthermore, the immobilization of catalyst thin films on a substrate is advantageous compared to the use of powdered catalysts, because it (1) eliminates the need for catalyst separation and filtration, (2) enables application in continuous flow systems, and (3) reduces agglomeration at various catalyst loadings [3]. However, despite the promise of thin-film TiO2 photocatalysts, TiO2 has an intrinsically low photocatalytic activity because of the large bandgap (3.2 eV) of the anatase phase, which allows absorption only in the ultraviolet (UV) region, thereby preventing the full utilization of solar energy (typically, only 3–5% of the total solar spectrum). In addition, the fast recombination of electron-hole pairs reduces the catalytic activity [4,5,6]. Therefore, metals, such as Ag, Au, Pt, and Cu, have been doped into TiO2 films, which enhance the photocatalytic activity compared to that of undoped TiO2 films. In this study, we focused on the doping of TiO2 thin films with Ag.
Several methods have been developed for film deposition, among which chemical vapor deposition (CVD) is one of the most popular. It requires simple equipment, and yields good surface coverage and a high deposition rate [7], but it requires high temperatures. Therefore, to enable the use of lower temperatures, the plasma-enhanced CVD (PECVD) method has been proposed. In PECVD, films are deposited on a low-cost substrate by utilizing the reactive chemical species formed in a microwave-induced plasma [8]. Notably, thin TiO2 films and metal-doped TiO2 composite films have been deposited by PECVD [9,10,11], where titanium tetraisopropoxide (TTIP) was employed as a reactive TiO2 precursor. During the reaction, TTIP was cracked by inelastic collisions with the ionized species in the plasma [12], enabling the use of a low overall process temperature. In addition, metal ions can be reduced to their metallic state by plasma treatment [13]. In fact, recently, we successfully fabricated TiO2 composite films by adding a Ag nanoparticle suspension [14]; however, this required pre-preparing the nanoparticle mixture. Therefore, in this study, to increase the process efficiency, AgNO3 was used as the Ag+-ion source and TTIP was used as the TiO2 precursor. Briefly, aqueous AgNO3 was aerosolized and supplied to the PECVD reactor. In the plasma, Ag nanoparticles were obtained by the reduction of AgNO3, and these were deposited on the substrate. Simultaneously, the TiO2 film was deposited from the species formed by the cracking of the TTIP vapor introduced in the He and O2 carrier gases. In particular, we investigated the influence of the AgNO3 concentration on the structure and photocatalytic activity of the TiO2-Ag composite films.
2. Results and Discussion
2.1. Ultraviolet (UV)—Visible (Vis) Spectra
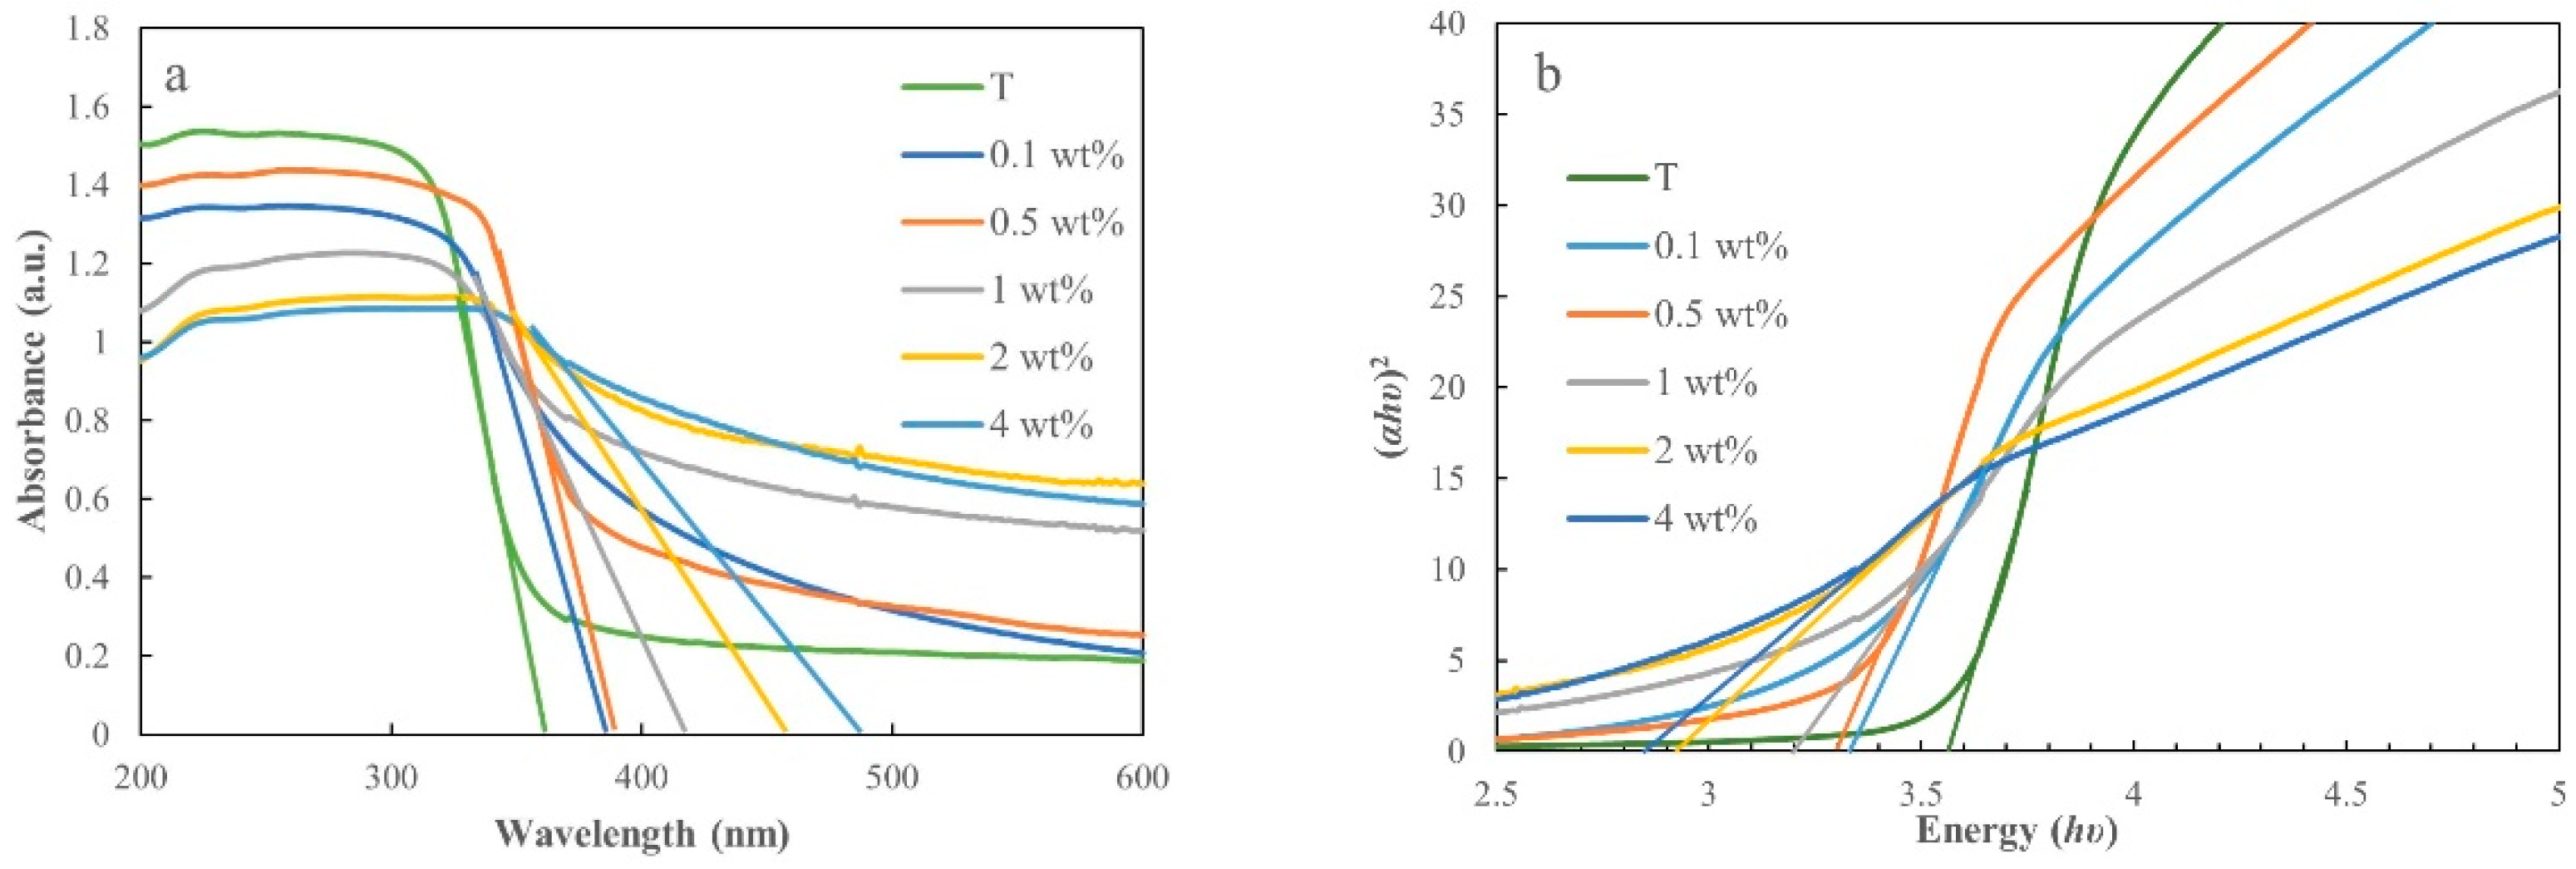
Figure 1a demonstrates the UV-Vis spectra of the pristine TiO2 film and the TiO2-Ag composite films prepared using different concentrations of AgNO3 (0.1–4 wt%). The pristine TiO2 film exhibits a threshold wavelength of 358 nm, which does not fall in the visible light range. Increasing the concentration of AgNO3 shifts the absorption edges of the TiO2-Ag composite films toward longer wavelengths; that is, they shift toward the visible region. In particular, the spectra of the TiO2-Ag composite films show a strong shoulder peak at 300–500 nm, which can be attributed to the surface plasmon absorption of spatially confined electrons in the Ag nanoparticles [15]. This suggests that doping TiO2 with Ag can significantly enhance its visible-light absorption. The bandgap energy was calculated using the relation (αhυ)1/γ = B(hυ − Eg), where α is the absorption coefficient, hυ is the incident photon energy, Eg is the bandgap energy, the γ-factor is equal to 1/2 for a direct bandgap, and B is a constant [16]. The (αhυ)2 versus hυ plots, constructed based on the absorbance spectra, are shown in Figure 1b. The bandgap was estimated by extrapolating the tangent of the curve to the x-axis (Table 1). The bandgap of pristine TiO2 was 3.54 eV, while those of the TiO2-Ag composite films decreased from 3.21 to 2.61 eV with increasing AgNO3 concentration. The difference in the bandgaps of these samples may originate from the different surface microstructures and compositions [17].
2.2. X-ray Diffraction (XRD) Analysis
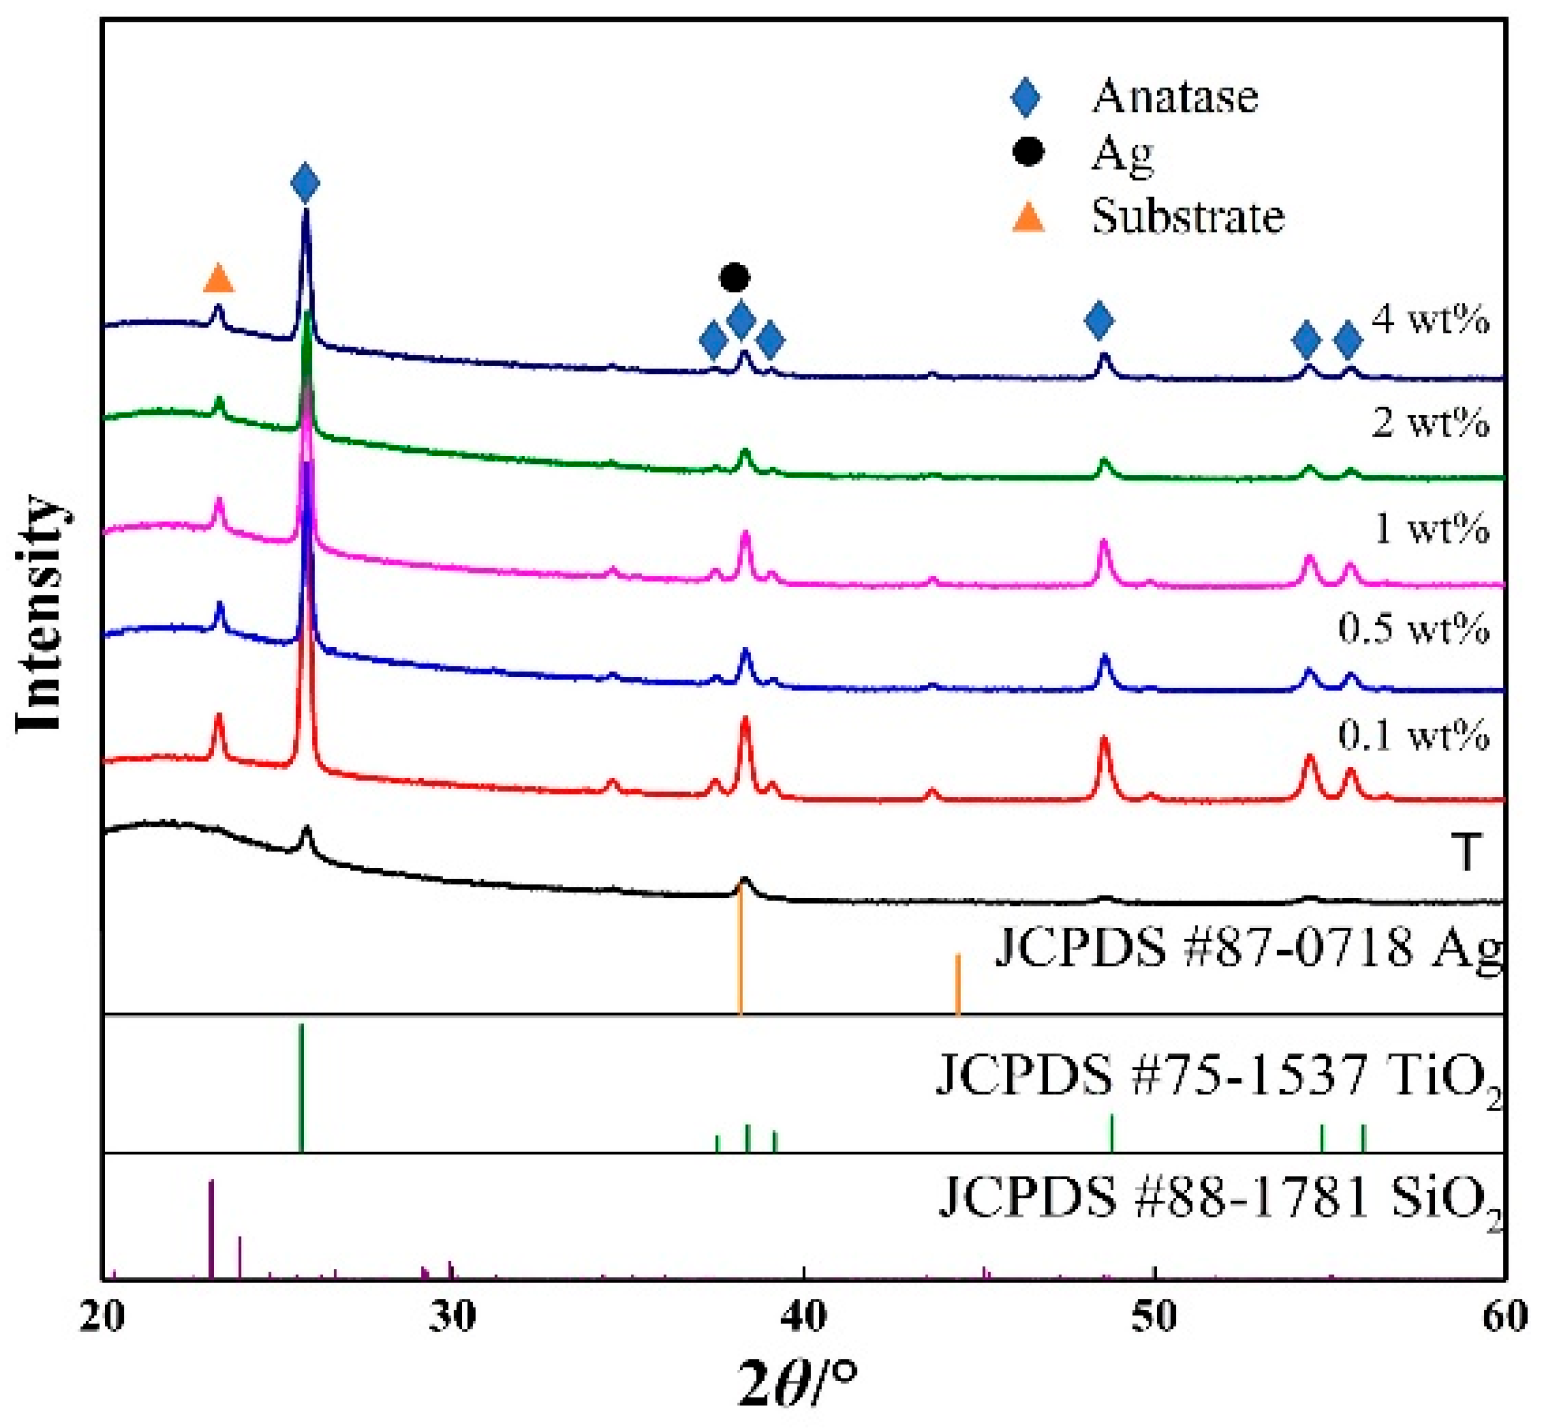
The effect of AgNO3 concentration on the crystal phase of the prepared films was analyzed by XRD (Figure 2) using JCPDS cards of TiO2, Ag, and SiO2 as the reference. Regardless of the AgNO3 concentration, the prepared films exhibited peaks only for the anatase phase at 25.82°, 37.53°, 38.34°, 39.16°, 48.56°, 54.44°, and 55.56° correspond to the (101), (112), (103), (004), (200), (105), and (211) planes, respectively. In particular, no peaks consistent with those of metallic Ag are observed, possibly because of the low loading of Ag or overlap with peaks corresponding to TiO2 [18]. In addition, the peak near 23° may be attributed to the SiO2 of the substrate. However, we were unable to identify the peaks near 35° and 43°, which may originate from unknown contamination.
2.3. X-ray Photoelectron Spectroscopy (XPS) Analysis
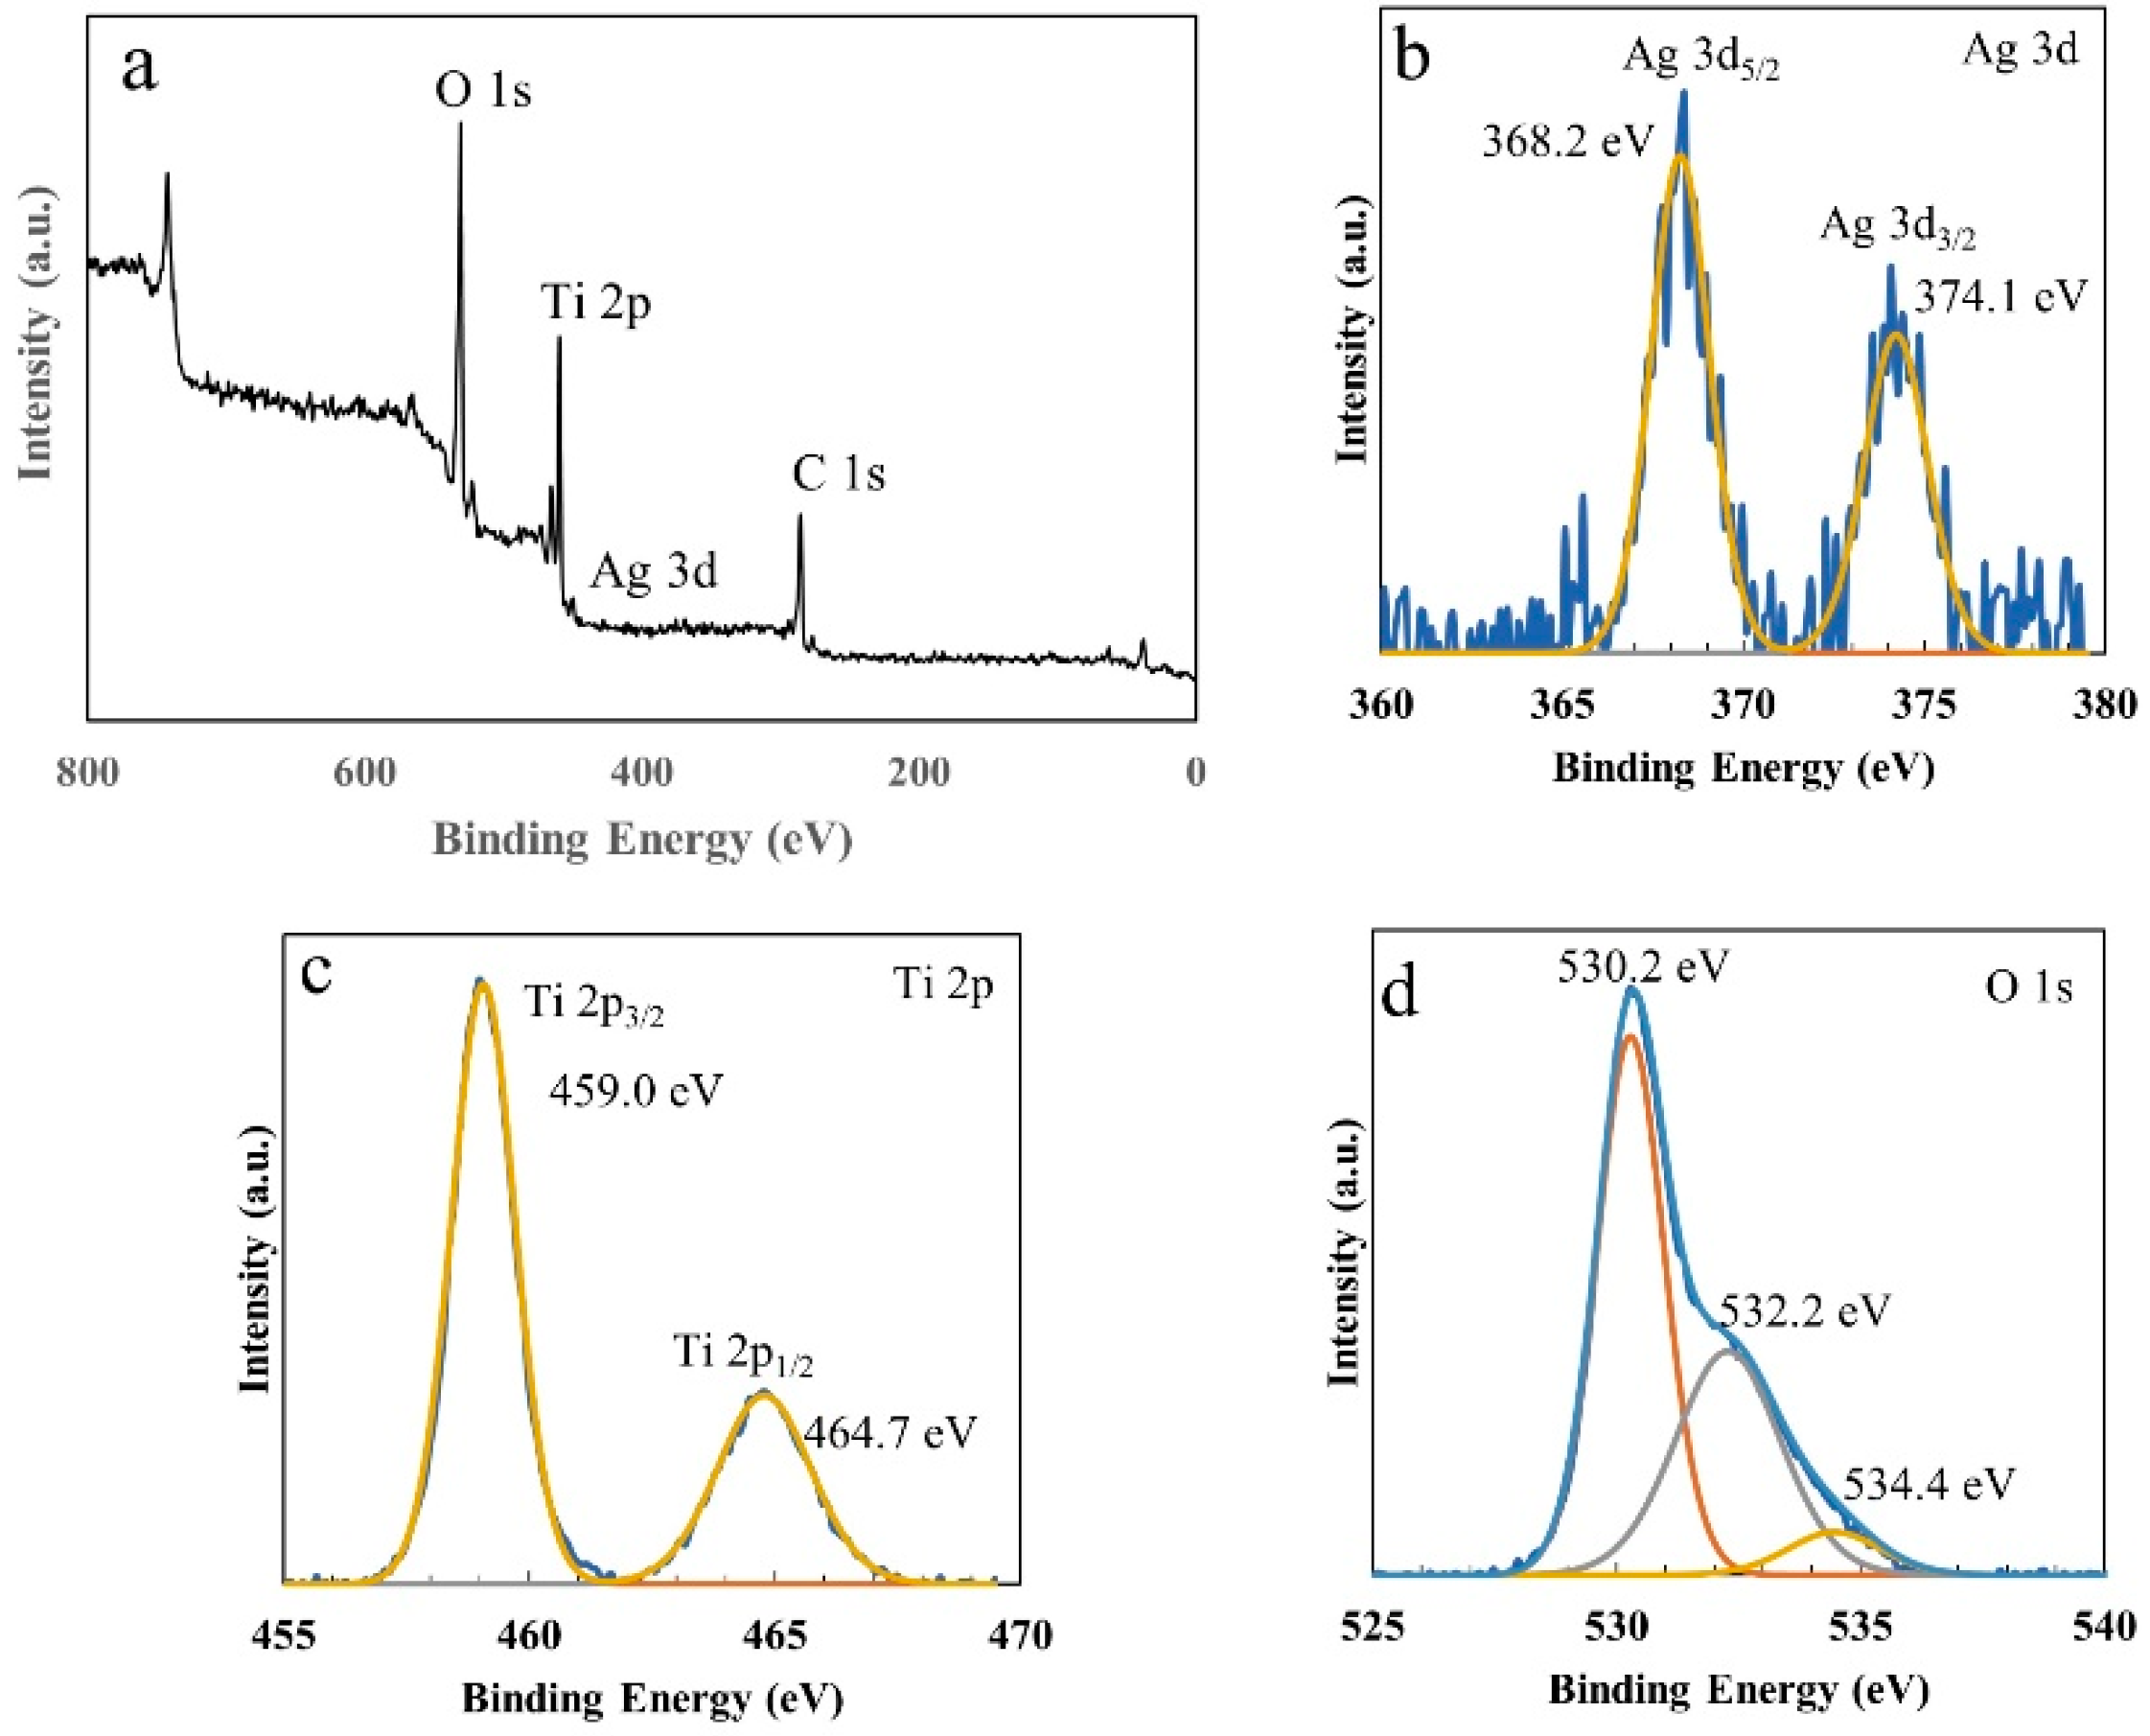
Next, XPS measurements were performed to examine the chemical species and their oxidation states in the prepared 1 wt% AgNO3-loaded TiO2-Ag film, which was selected as a representative sample to confirm the conversion of AgNO3 to metallic Ag. Figure 3a illustrates the XPS survey profile of this film, which contains three peaks corresponding to O 1s, Ti 2p, and Ag 3d. Figure 3b demonstrates the typical Ag 3d spectrum, with Ag 3d5/2 and Ag 3d3/2 peaks at binding energies of 368.2 and 374.1 eV, respectively; these peaks are characteristic of metallic Ag. The two peaks corresponding to the Ti 2p3/2 and Ti 2p1/2 peaks (459.0 eV and 464.7 eV, respectively) are shown in Figure 3c, and they confirm the presence of Ti4+; this is consistent with the use of TiO2 in the prepared films. The O 1s spectrum could be deconvoluted into three peaks at 530.2, 532.2, and 534.3 eV (Figure 3d), corresponding to the lattice oxygen in TiO2 and the dissociated oxygen and hydroxyl-like groups [19,20], respectively.
2.4. Morphological Structure
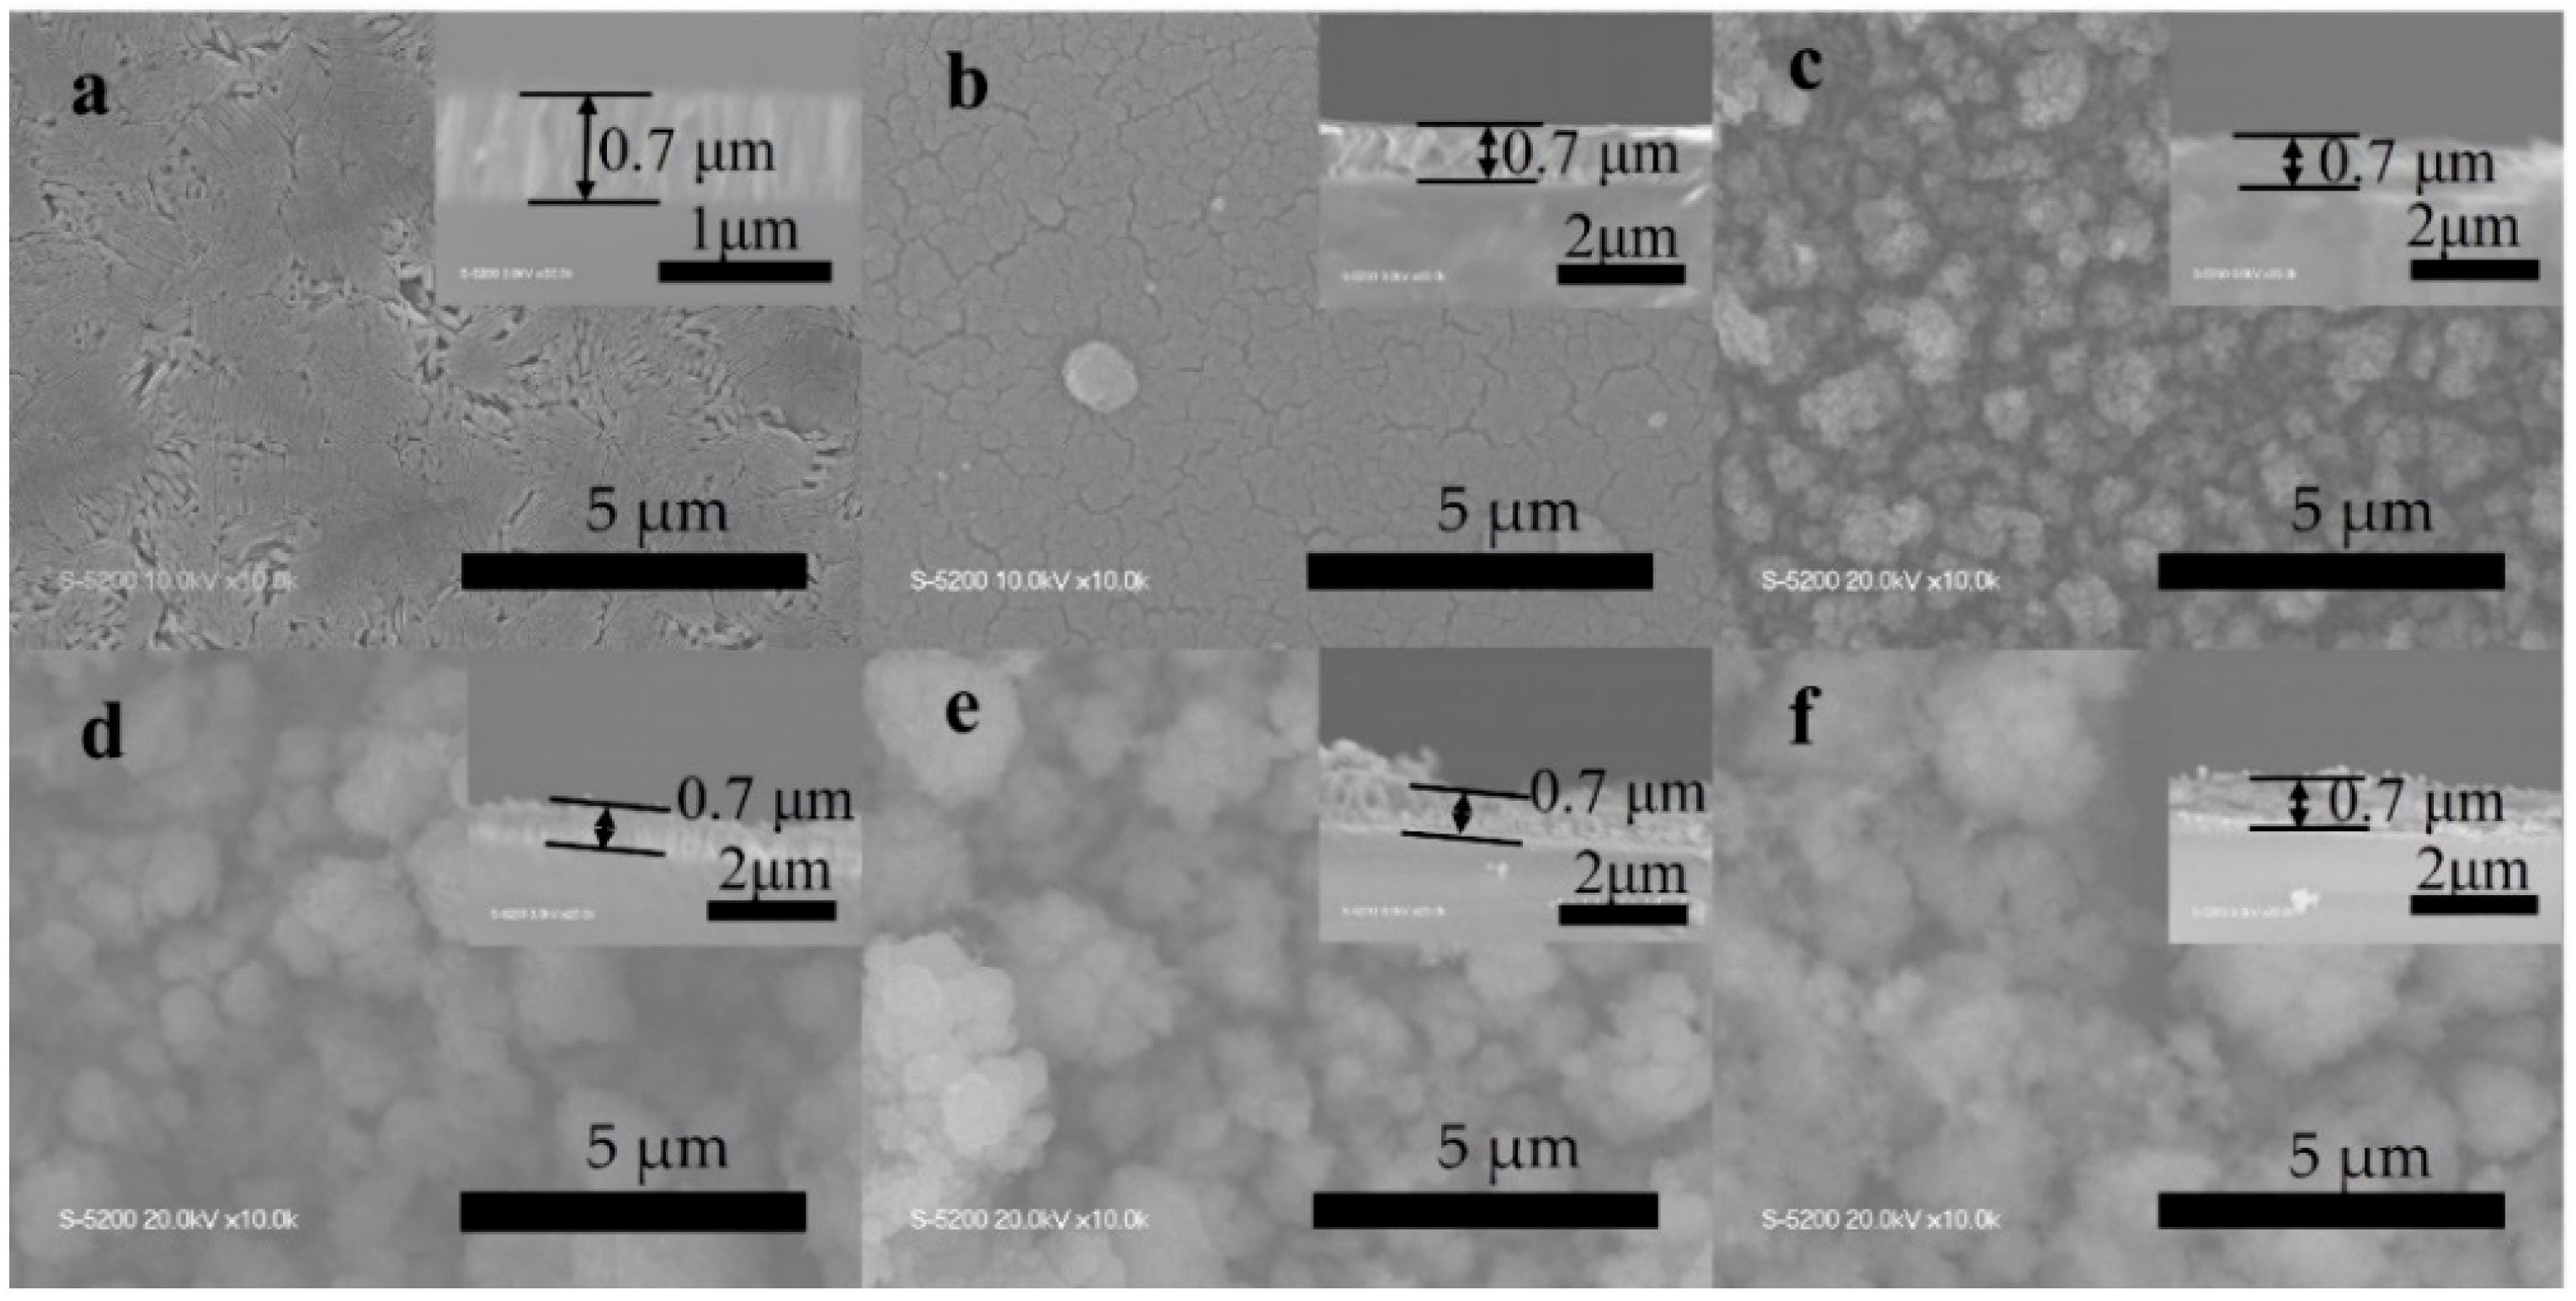
Figure 4 demonstrates the scanning electron microscopy (SEM) images on the surface microstructures and cross-section of the TiO2-Ag composite films deposited using different AgNO3 concentrations. The pristine TiO2 film has a dense surface structure. However, the prepared composite films contain secondary spherical particles formed by the aggregation of tiny particles; these secondary particles show a wide range of sizes. Generally, additives such as Ag nanoparticles provide nucleation centers, thereby inducing the formation of agglomerates or dense heterogeneities during deposition [21]. In addition, higher AgNO3 concentrations resulted in a more severe agglomeration on the surface of the films, as previously reported [22,23]. However, the aggregated particles are tightly packed together, suggesting that the PECVD method produces films with good substrate coverage. The layer thickness was estimated using cross-section images, and all the films showed a thickness of approximately 0.7 μm. Furthermore, repeated experiments yielded a relatively smooth surface for the TiO2 films and a rough surface for the TiO2-Ag composite films, indicating that our film deposition process is reproducible.
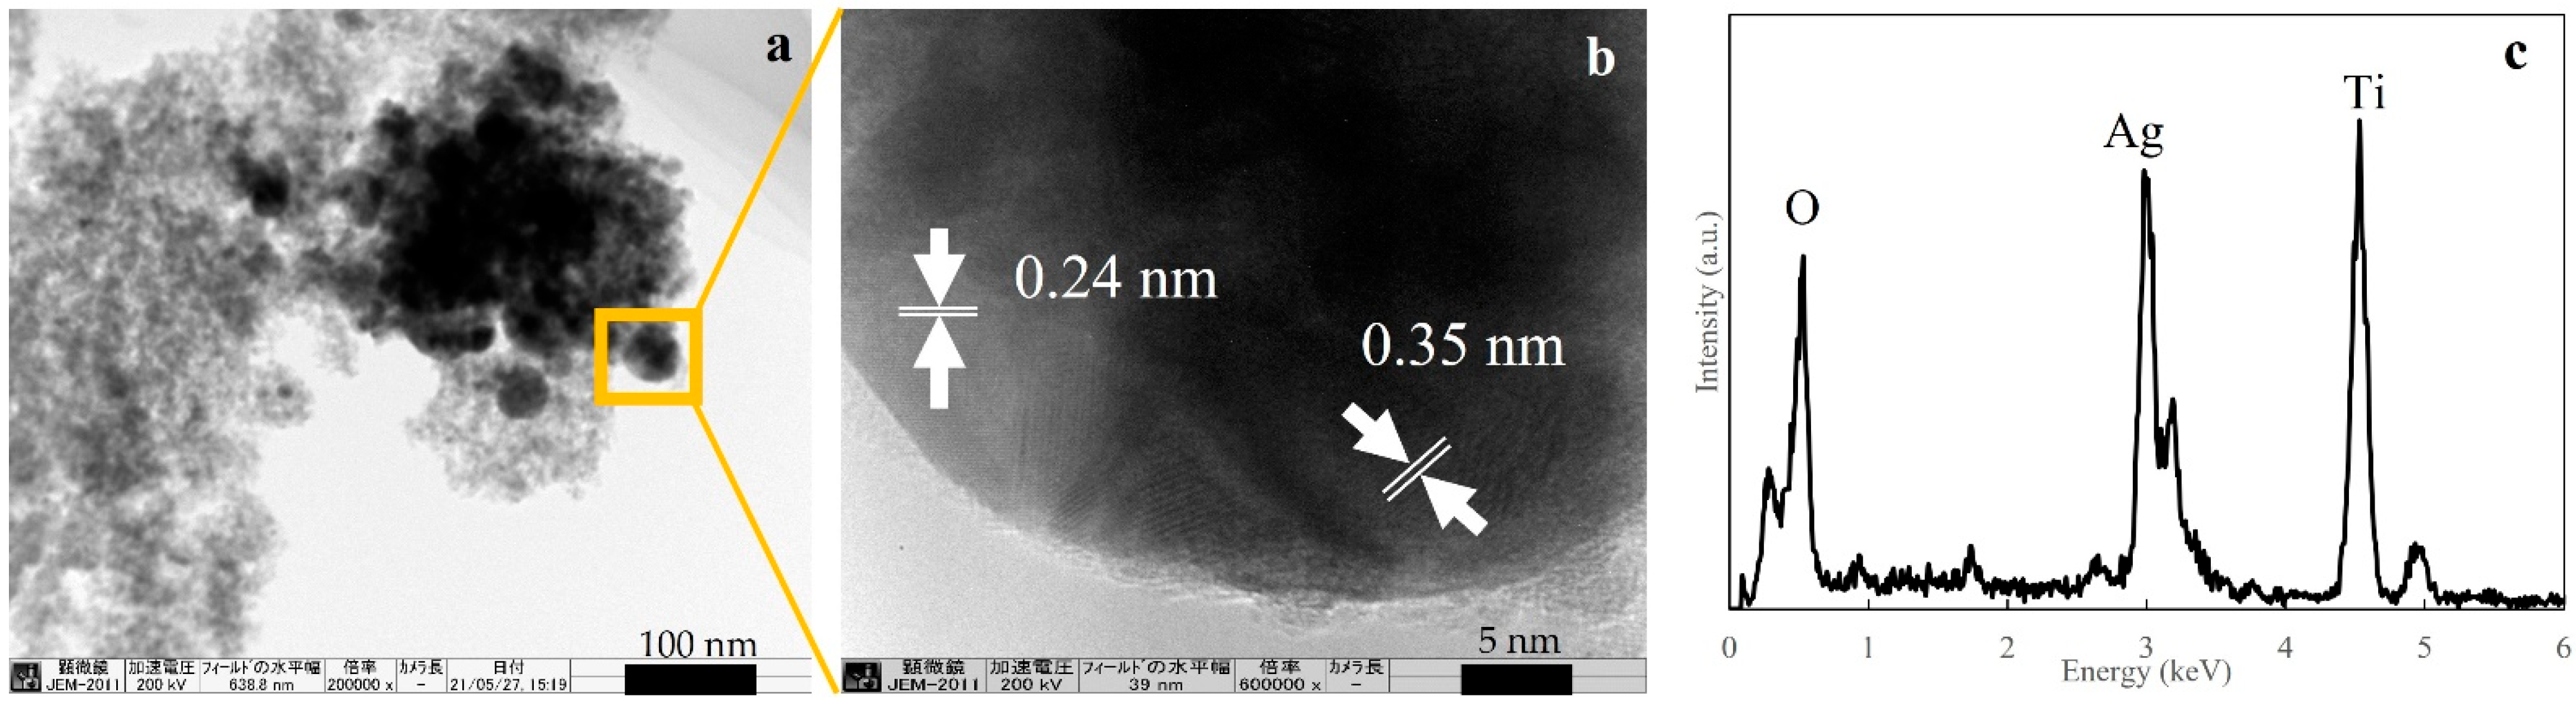
A microgrid was employed to scratch the surface of the synthesized TiO2-Ag composite films, which were subsequently investigated using transmission electron microscopy energy dispersive X-ray (TEM-EDS). The results reflect only a very small part of the surface of the film. The images of the 1 wt% AgNO3-containing film (Figure 5) shows that spherical Ag nanoparticles of 40–60 nm diameter are attached to the very small TiO2 particles. The large size of the Ag nanoparticles may cause the aggregation on the surface of the film as shown in the SEM images (b–f). Figure 5b shows the high-resolution TEM (HRTEM) images. The interplanar spacings of the (111) plane of Ag and (101) plane of anatase were determined to be 0.24 and 0.35 nm, respectively. Thus, the Ag nanoparticles were tightly coated by the TiO2 particles. Furthermore, the EDS analysis of the region enclosed in a yellow square in Figure 5a confirmed the presence of the Ag species in the film.
2.5. Photocatalytic Activity
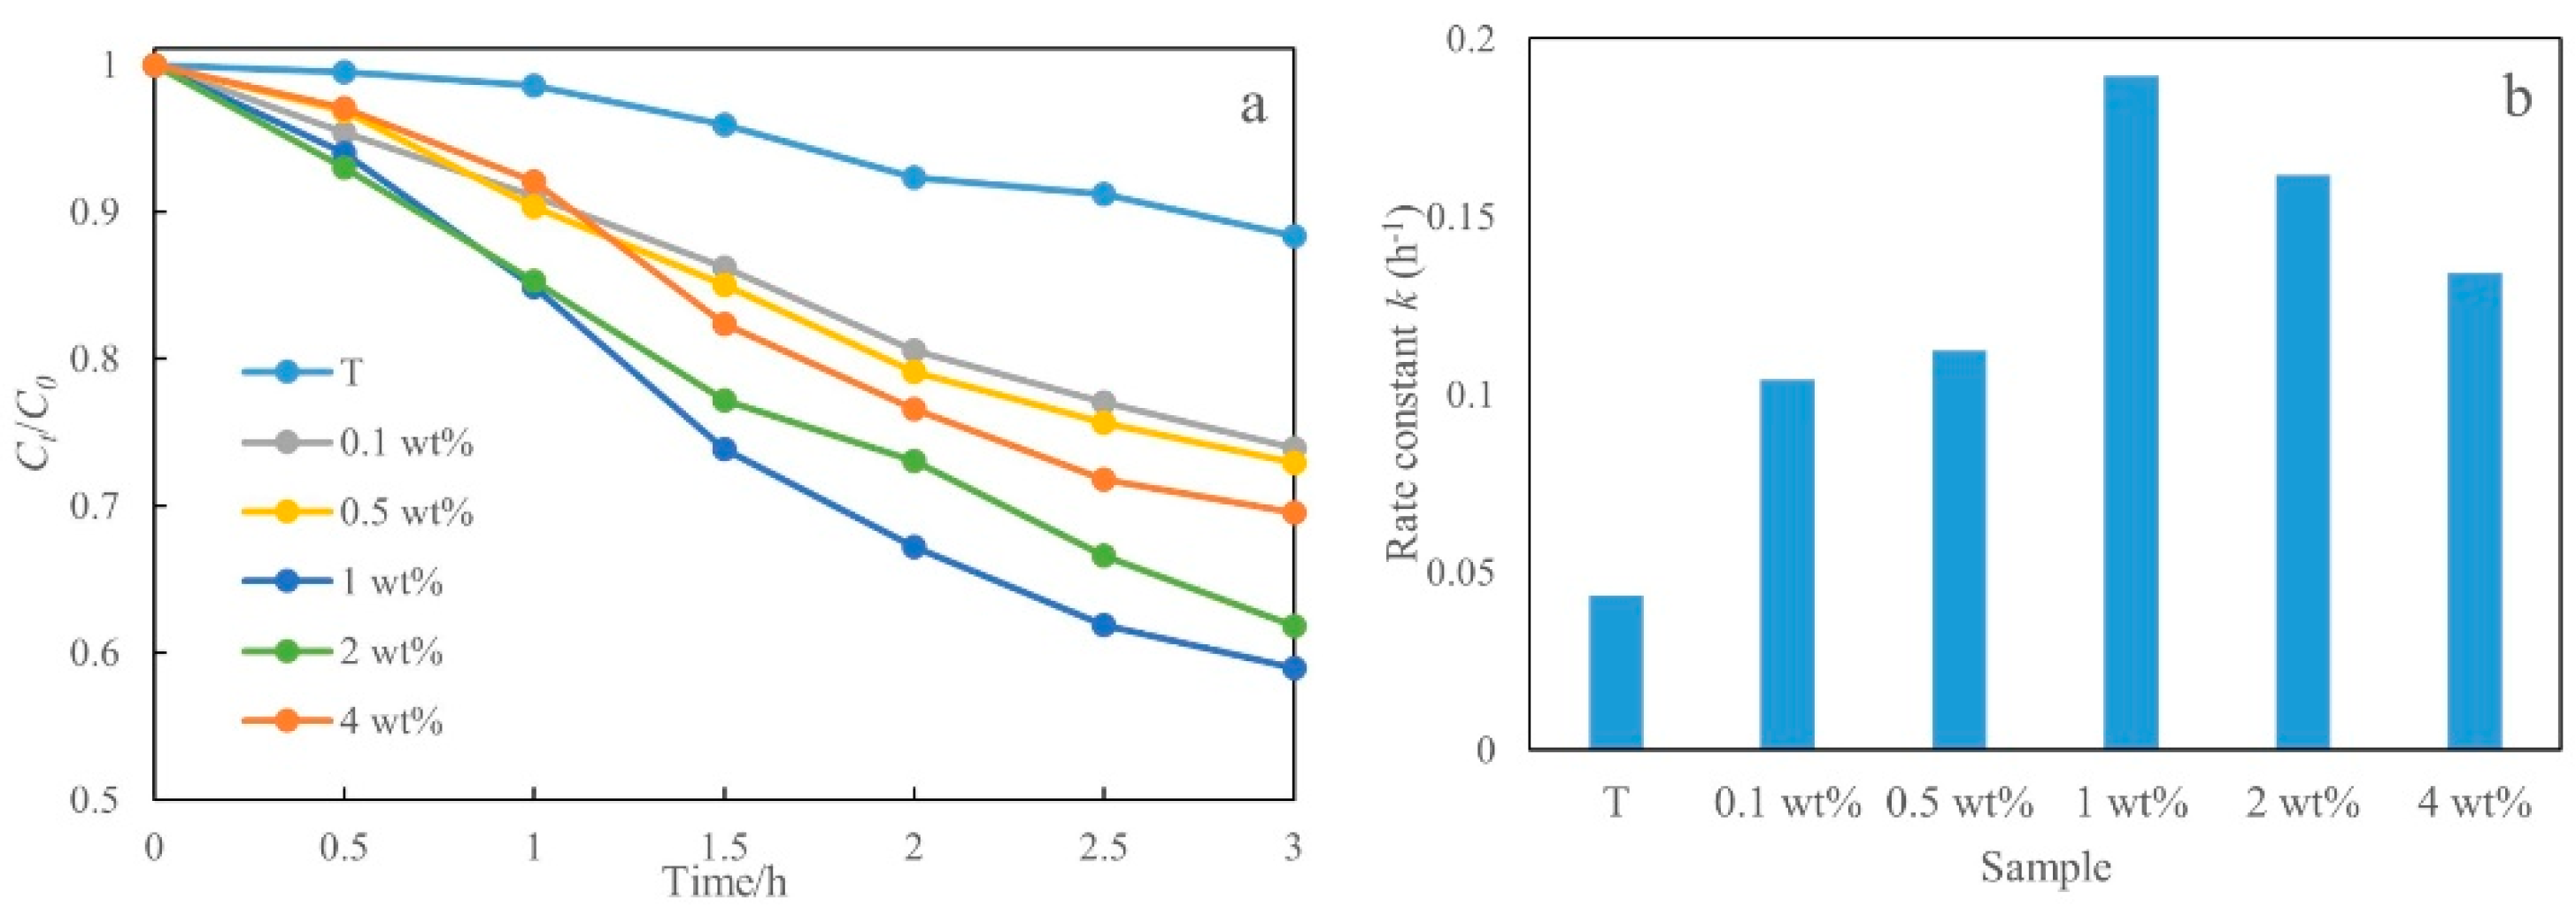
The photocatalytic activities of the samples were evaluated based on the decomposition of methylene blue (MB) under UV irradiation. Figure 6a shows the degradation of MB (Ct/C0) with respect to time (t) for the different films under UV light irradiation. All the films exhibited photocatalytic activities under the same conditions. However, the photocatalytic activities of the TiO2-Ag composite films were higher compared to that of the pristine TiO2 film. A possible mechanism has been previously reported [19,24]. The percent MB degradation by the different films after 3 h of irradiation was calculated using the formula [(C0 − Ct)/C0] × 100%, where C0 and Ct are the concentrations of MB at time t = 0 and after irradiation for time t, respectively. The TiO2-Ag (1 wt%) composite film exhibited the best photocatalytic activity, yielding an MB degradation of approximately 41%, whereas the pristine TiO2 film showed an activity of approximately 11%. As mentioned, the rate constant, k, for MB degradation by the different films was calculated using Equation (1), and the results are shown in Figure 6b. The resulting k values also confirm that the maximum photocatalytic activity was exhibited by the TiO2-Ag (1 wt%) composite film, which was almost 1.7 times that of pristine TiO2. Thus, 1 wt% was determined to be the optimal concentration because higher loadings (e.g., 2 wt% and 4 wt%) resulted in lower activities. Previously, adding excess Ag has been shown to reduce the photocatalytic activity because of the increased reflection of incident light [25,26]. In addition, electron-hole recombination can occur on the Ag nanoparticles, thereby hindering or preventing electron transfer to the surface and reducing the photocatalytic activity [27].
3. Experimental Setup and Characterization
3.1. Experimental Setup
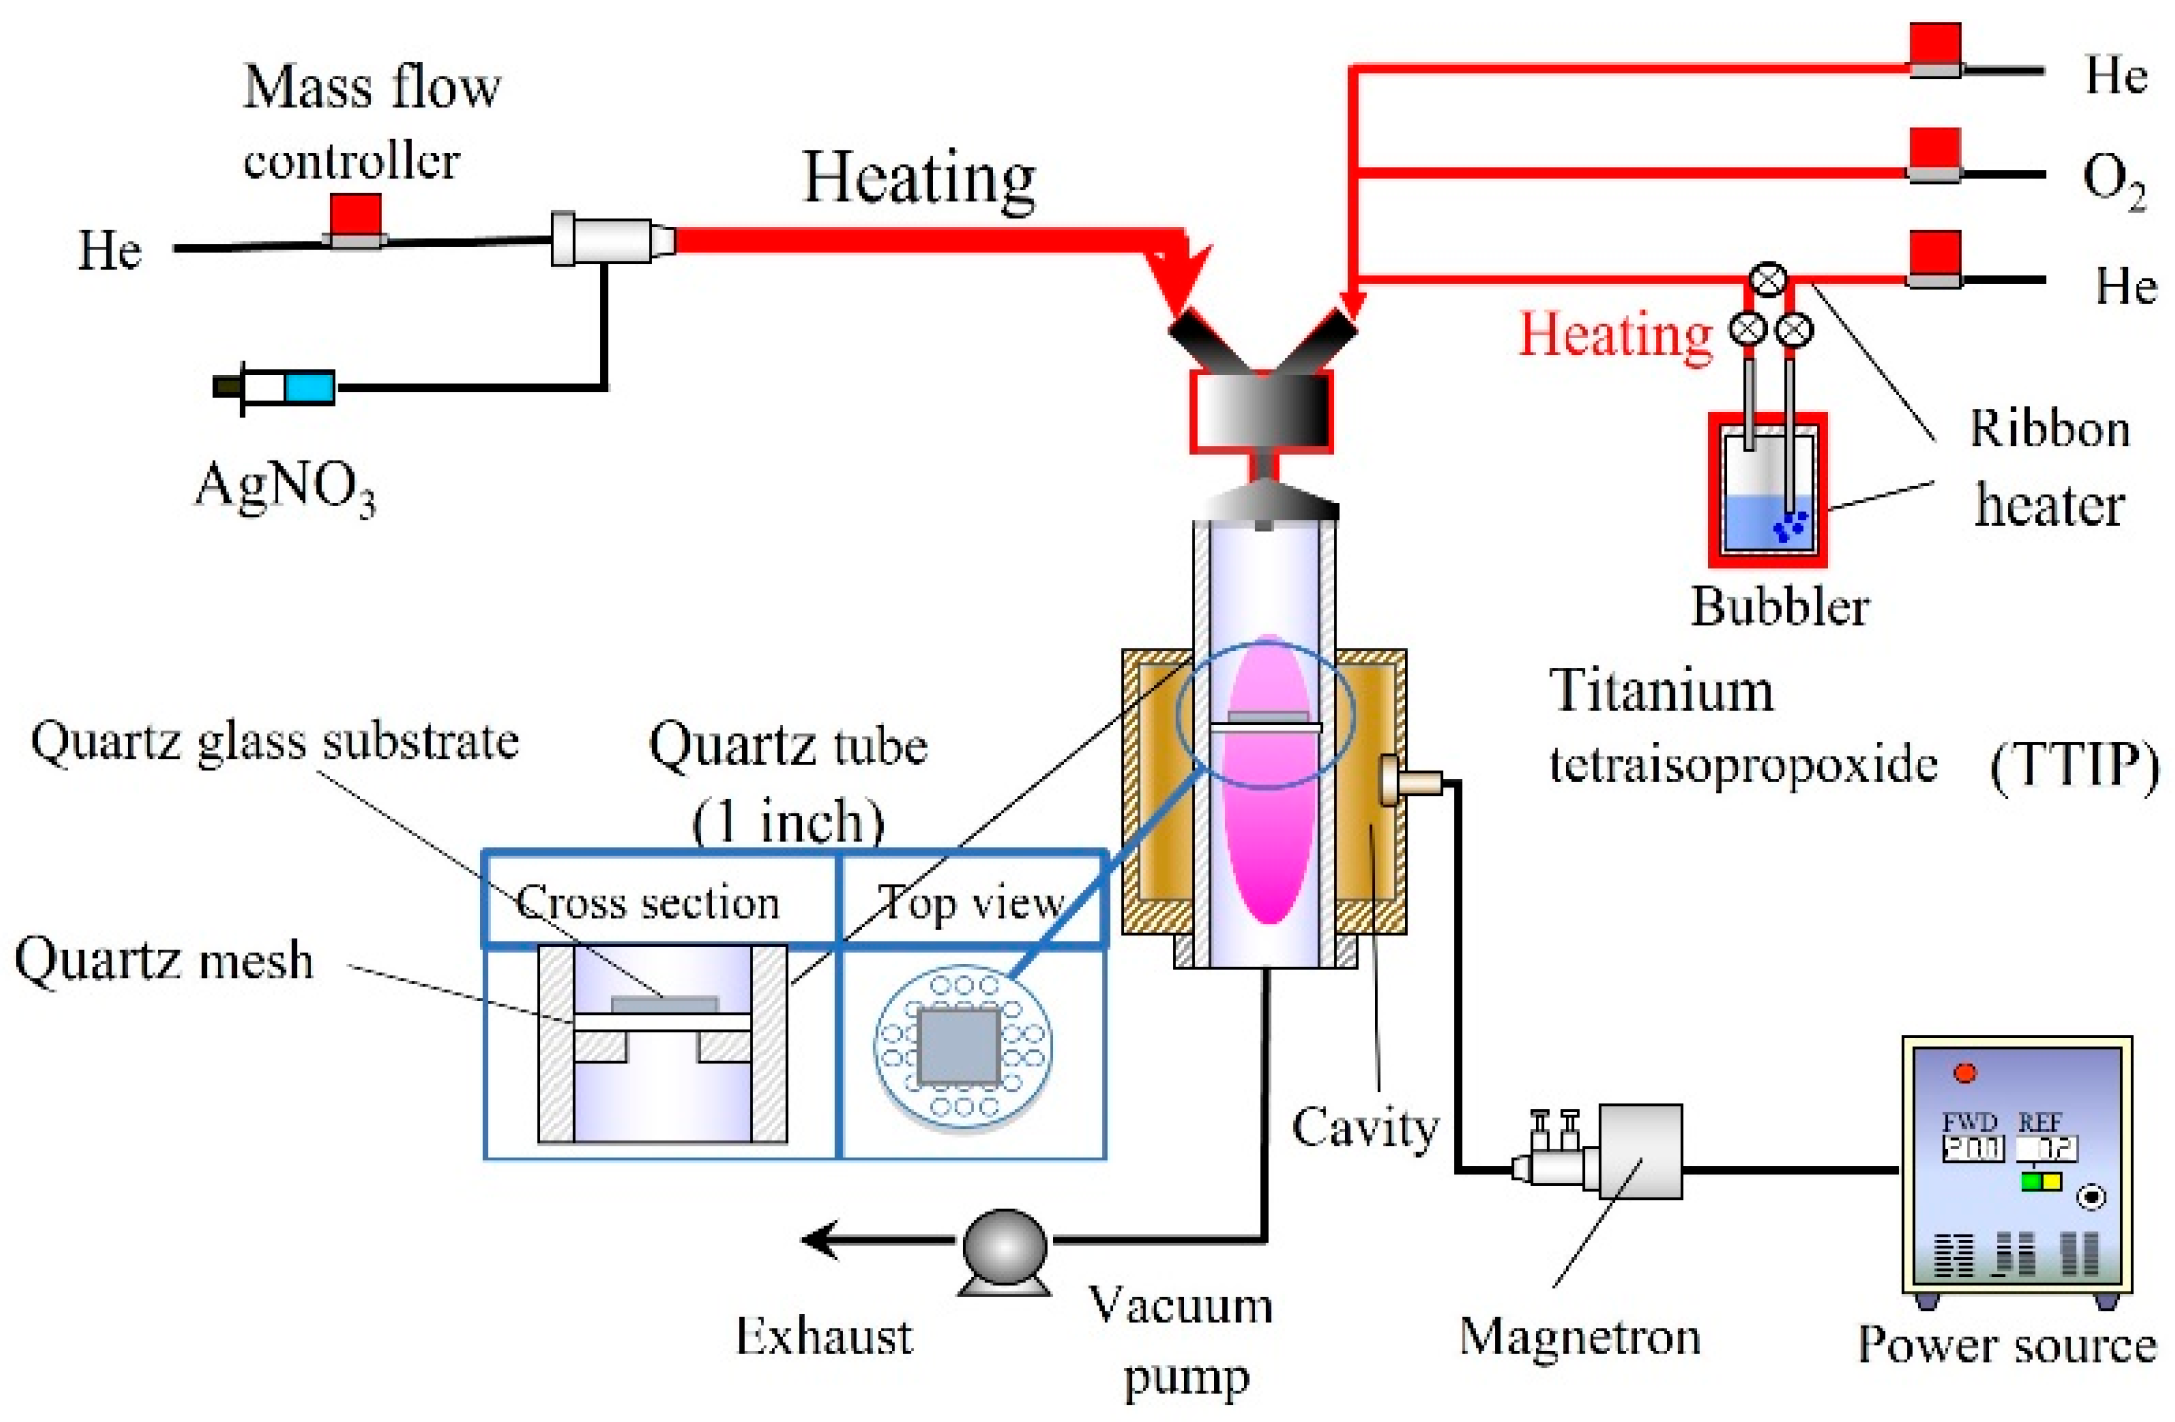
Figure 7 shows a schematic of the PECVD reactor consisting of the material feeding systems, a ribbon heater, a quartz tube with a substrate holder, the plasma generation system, and a vacuum pump [14,28]. The plasma was produced when the gaseous species was ionized by 2.45 GHz microwaves generated using a magnetron (MH2000S-212BB, Muegge, Co., Ltd., Reichelsheim, Germany). The temperature and pressure of the system were controlled using the ribbon heater and vacuum pump (Pascal 2015C1, Pfeiffer Vacuum, Inc., Asslar, Germany), respectively. On the left-hand side of the system, aqueous AgNO3 (99.8%, Nacalai Tesque, Inc., Tokyo, Japan) solutions with concentrations ranging from 0 to 4 wt% were supplied by a syringe pump (YSP-301, YMC. Co., Ltd., Kyoto, Japan). To aerosolize the aqueous AgNO3 solution, a two-fluid nozzle was used. The carrier gas was He gas and was introduced at a rate of 1500 standard cubic centimeters per minute (sccm). TTIP (Tokyo Chemical Industry Co., Ltd., Tokyo, Japan) was vaporized and fed into the system with He and O2 gases at a flow rate of 50 sccm. The plasma gas was generated inside a glass tube with an inner diameter and length of 25.4 mm and 300 mm, respectively, and the materials were fed into this tube. As AgNO3 and TTIP were simultaneously fed into the system over 15 min, the films were deposited onto the glass substrate. Subsequently, the obtained films were annealed at 600 °C for 12 h under N2 gas flow at 200 sccm.
3.2. Characterization
The optical properties of the films were investigated using a V-650 spectrophotometer (JASCO, Tokyo, Japan). The crystal structures of the films were determined by XRD (RINT2100, Rigaku, Tokyo, Japan), using Cu-Kα radiation (λ = 1.5406 Å). The elemental composition and their oxidation states were determined using XPS (ESCA-3400, SHIMADAZU, Kyoto, Japan). The recorded XPS spectra were fitted using the C 1s peak at 284.6 eV as the reference; this peak corresponded to adventitious carbon on the sample surface. The morphologies of the films were visualized using SEM (S-5200, Hitachi High-Technologies, Tokyo, Japan) and TEM (JEM-2010, JEOL, Tokyo, Japan), in conjunction with energy-dispersive EDS (JED-2300T, JEOL, Tokyo, Japan).
The photocatalytic activities of the films were measured in a cuvette using 3 mL of MB (Kanto Chemical Co. Inc., Tokyo, Japan). To attain the adsorption equilibrium, the cuvette was left in the dark for 30 min. Then, the photocatalytic reaction was initiated by irradiating the sample with UV light (365 nm, 1407 μW/cm). The absorption spectrum of the sample was recorded on a V-650 spectrophotometer at an interval of 30 min. MB mainly absorbed in the range of 550–700 nm, with an absorption maximum at 665 nm. The measurement was conducted in a thermostatically controlled system maintained at 25 °C. The concentration of MB was determined using the Beer-Lambert law, and the percent degradation of MB was calculated as [(C0 − Ct)/C0] × 100%, where C0 and Ct are the concentrations of MB at time t = 0 and after irradiation for time t, respectively. Further, the reaction rate constant, k, was calculated to evaluate the photocatalytic ability of the different films, as expressed by Equation (1).
4. Conclusions
In this work, pristine TiO2 films and TiO2-Ag composite films were successfully prepared with the PECVD method. The films were annealed at 600 °C after PECVD, and they exhibited a typical anatase structure. The addition of Ag nanoparticles significantly altered the morphology of the films due to particle aggregation. Notably, the use of the Ag dopant significantly improved the light absorption ability of the films; that is, compared to pristine TiO2, the TiO2-Ag composite films show significantly enhanced photocatalytic activities. Thus, the optimal film (in terms of the photocatalytic activity) was prepared using 1 wt% AgNO3. Overall, the results demonstrate the success of PECVD for doping TiO2 thin films with metal nanoparticles, thereby providing a simple synthetic process for preparing metal-doped films with high photocatalytic activity.
Author Contributions
Conceptualization, M.S.; methodology, J.L. and K.T.; formal analysis, J.L.; writing, J.L.; writing—review and editing, J.L., M.S. and M.K.; supervision: M.S.; funding acquisition, M.S. All authors have read and agreed to the published version of the manuscript.
Funding
This work was partly supported by the Japan Society for the Promotion of Science KAKENHI grant number 21K04750.
Data Availability Statement
Data are contained within the article.
Acknowledgments
The authors are grateful to M. Maeda for assistance with the TEM analysis.
Conflicts of Interest
The authors declare no conflict of interest.
References
- Fujishima, A.; Honda, K. Electrochemical photolysis of water at a semiconductor electrode. Nature 1972, 238, 37–38. [Google Scholar] [CrossRef] [PubMed]
- Xi, B.J.; Verma, L.K.; Li, J.; Bhatia, C.S.; Danner, A.J.; Yang, H.; Zeng, H.C. TiO2 Thin Films Prepared via Adsorptive Self-Assembly for Self-Cleaning Applications. ACS Appl. Mater. Interfaces 2012, 4, 1093–1102. [Google Scholar] [CrossRef] [PubMed]
- Arabatzis, I.M.; Stergiopoulos, T.; Bernard, M.C.; Labou, D.; Neophytides, S.G.; Falaras, P. Silver-modified titanium dioxide thin films for efficient photodegradation of methyl orange. Appl. Catal. B 2003, 42, 187–201. [Google Scholar] [CrossRef]
- Diaz-Uribe, C.; Viloria, J.; Cervantes, L.; Vallejo, W.; Navarro, K.; Romero, E.; Quinones, C. Photocatalytic Activity of Ag-TiO2 Composites Deposited by Photoreduction under UV Irradiation. Int. J. Photoenergy 2018, 2018, 6080432. [Google Scholar] [CrossRef] [Green Version]
- Sen, S.; Mahanty, S.; Roy, S.; Heintz, O.; Bourgeois, S.; Chaumont, D. Investigation on sol-gel synthesized Ag-doped TiO2 cermet thin films. Thin Solid Film. 2005, 474, 245–249. [Google Scholar] [CrossRef]
- Tang, B.; Chen, H.Q.; Peng, H.P.; Wang, Z.W.; Huang, W.Q. Graphene Modified TiO2 Composite Photocatalysts: Mechanism, Progress and Perspective. Nanomaterials 2018, 8, 205. [Google Scholar] [CrossRef] [Green Version]
- Rasoulnezhad, H.; Kavei, G.; Ahmadi, K.; Rahimipour, M.R. Combined sonochemical/CVD method for preparation of nanostructured carbon-doped TiO2 thin film. Appl. Surf. Sci. 2017, 408, 1–10. [Google Scholar] [CrossRef]
- Li, D.; Goullet, A.; Carette, M.; Granier, A.; Zhang, Y.; Landesman, J.P. Structural and optical properties of RF-biased PECVD TiO2 thin films deposited in an O2/TTIP helicon reactor. Vacuum 2016, 131, 231–239. [Google Scholar] [CrossRef]
- Li, D.; Bulou, S.; Gautier, N.; Elisabeth, S.; Goullet, A.; Richard-Plouet, M.; Choquet, P.; Granier, A. Nanostructure and photocatalytic properties of TiO2 films deposited at low temperature by pulsed PECVD. Appl. Surf. Sci. 2019, 466, 63–69. [Google Scholar] [CrossRef]
- Li, D.; Gautier, N.; Dey, B.; Bulou, S.; Richard-Plouet, M.; Ravisy, W.; Goullet, A.; Choquet, P.; Granier, A. TEM analysis of photocatalytic TiO2 thin films deposited on polymer substrates by low-temperature ICP-PECVD. Appl. Surf. Sci. 2019, 491, 116–122. [Google Scholar] [CrossRef]
- Sobczyk-Guzenda, A.; Owczarek, S.; Szymanowski, H.; Volesky, L.; Walkowiak, B.; Miszczak, S.; Gazicki-Lipman, M. Iron doped thin TiO2 films synthesized with the RF PECVD method. Ceram. Int. 2015, 41, 7496–7500. [Google Scholar] [CrossRef]
- Ehlbeck, J.; Schnabel, U.; Polak, M.; Winter, J.; von Woedtke, T.; Brandenburg, R.; von dem Hagen, T.; Weltmann, K.D. Low temperature atmospheric pressure plasma sources for microbial decontamination. J. Phys. D Appl. Phys. 2011, 44, 013002. [Google Scholar] [CrossRef] [Green Version]
- Zou, J.-J.; Zhang, Y.-P.; Liu, C.-J. Reduction of Supported Noble-Metal Ions Using Glow Discharge Plasma. Langmuir 2006, 22, 11388–11394. [Google Scholar] [CrossRef] [PubMed]
- Lang, J.; Takahashi, K.; Kubo, M.; Shimada, M. Preparation of TiO2-CNT-Ag Ternary Composite Film with Enhanced Photocatalytic Activity via Plasma-Enhanced Chemical Vapor Deposition; Hiroshima University: Hiroshima, Japan, 2022; to be submitted. [Google Scholar]
- Lei, X.F.; Xue, X.X.; Yang, H. Preparation and characterization of Ag-doped TiO2 nanomaterials and their photocatalytic reduction of Cr(VI) under visible light. Appl. Surf. Sci. 2014, 321, 396–403. [Google Scholar] [CrossRef]
- Makula, P.; Pacia, M.; Macyk, W. How To Correctly Determine the Band Gap Energy of Modified Semiconductor Photocatalysts Based on UV-Vis Spectra. J. Phys. Chem. Lett. 2018, 9, 6814–6817. [Google Scholar] [CrossRef] [Green Version]
- Yu, J.G.; Xiong, J.F.; Cheng, B.; Liu, S.W. Fabrication and characterization of Ag-TiO2 multiphase nanocomposite thin films with enhanced photocatalytic activity. Appl. Catal. B 2005, 60, 211–221. [Google Scholar] [CrossRef]
- Shi, H.; Yu, Y.; Zhang, Y.; Feng, X.; Zhao, X.; Tan, H.; Khan, S.U.; Li, Y.; Wang, E. Polyoxometalate/TiO2/Ag composite nanofibers with enhanced photocatalytic performance under visible light. Appl. Catal. B Environ. 2018, 221, 280–289. [Google Scholar] [CrossRef]
- Demirci, S.; Dikici, T.; Yurddaskal, M.; Gultekin, S.; Toparli, M.; Celik, E. Synthesis and characterization of Ag doped TiO2 heterojunction films and their photocatalytic performances. Appl. Surf. Sci. 2016, 390, 591–601. [Google Scholar] [CrossRef]
- Yu, J.-G.; Yu, H.-G.; Cheng, B.; Zhao, X.-J.; Yu, J.C.; Ho, W.-K. The Effect of Calcination Temperature on the Surface Microstructure and Photocatalytic Activity of TiO2 Thin Films Prepared by Liquid Phase Deposition. J. Phys. Chem. B 2003, 107, 13871–13879. [Google Scholar] [CrossRef]
- Chen, C.Y.; Tuan, W.H. Effect of silver on the sintering and grain-growth behavior of barium titanate. J. Am. Ceram. Soc. 2000, 83, 2988–2992. [Google Scholar] [CrossRef]
- Tomas, S.A.; Luna-Resendis, A.; Cortes-Cuautli, L.C.; Jacinto, D. Optical and morphological characterization of photocatalytic TiO2 thin films doped with silver. Thin Solid Film. 2009, 518, 1337–1340. [Google Scholar] [CrossRef]
- Singh, J.; Sahu, K.; Pandey, A.; Kumar, M.; Ghosh, T.; Satpati, B.; Som, T.; Varma, S.; Avasthi, D.K.; Mohapatra, S. Atom beam sputtered Ag-TiO2 plasmonic nanocomposite thin films for photocatalytic applications. Appl. Surf. Sci. 2017, 411, 347–354. [Google Scholar] [CrossRef]
- Zhang, H.; Liang, C.; Liu, J.; Tian, Z.; Wang, G.; Cai, W. Defect-Mediated Formation of Ag Cluster-Doped TiO2 Nanoparticles for Efficient Photodegradation of Pentachlorophenol. Langmuir 2012, 28, 3938–3944. [Google Scholar] [CrossRef] [PubMed]
- Yu, B.Y.; Leung, K.M.; Guo, Q.Q.; Lau, W.M.; Yang, J. Synthesis of Ag-TiO2 composite nano thin film for antimicrobial application. Nanotechnology 2011, 22, 115603. [Google Scholar] [CrossRef] [PubMed] [Green Version]
- Ko, S.; Banerjee, C.K.; Sankar, J. Photochemical synthesis and photocatalytic activity in simulated solar light of nanosized Ag doped TiO2 nanoparticle composite. Compos. Part B 2011, 42, 579–583. [Google Scholar] [CrossRef]
- Yang, D.; Sun, Y.Y.; Tong, Z.W.; Tian, Y.; Li, Y.B.; Jiang, Z.Y. Synthesis of Ag/TiO2 Nanotube Heterojunction with Improved Visible-Light Photocatalytic Performance Inspired by Bioadhesion. J. Phys. Chem. C 2015, 119, 5827–5835. [Google Scholar] [CrossRef]
- Kubo, M.; Taguchi, T.; Shimada, M. Preparation of nanoparticle-embedded thin films by simultaneous feeding of gaseous and solid raw materials in plasma-enhanced chemical vapor deposition process. Thin Solid Film. 2017, 632, 55–65. [Google Scholar] [CrossRef]
Figure 1.
Optical properties of the pristine TiO2 film (T) and TiO2-Ag composite films deposited using AgNO3 concentrations of 0.1–4 wt%: (a) absorbance spectra, (b) plot of (αhυ)2 versus photon energy (hυ).
Figure 1.
Optical properties of the pristine TiO2 film (T) and TiO2-Ag composite films deposited using AgNO3 concentrations of 0.1–4 wt%: (a) absorbance spectra, (b) plot of (αhυ)2 versus photon energy (hυ).

Figure 2.
X-ray diffraction patterns of the pristine TiO2 film and TiO2-Ag composite films deposited using different concentrations of AgNO3.
Figure 2.
X-ray diffraction patterns of the pristine TiO2 film and TiO2-Ag composite films deposited using different concentrations of AgNO3.

Figure 3.
X-ray photoelectron profiles of the TiO2-Ag (1 wt%) film: (a) survey, (b) Ag 3d, (c) Ti 2p, and (d) O 1s spectra.
Figure 3.
X-ray photoelectron profiles of the TiO2-Ag (1 wt%) film: (a) survey, (b) Ag 3d, (c) Ti 2p, and (d) O 1s spectra.

Figure 4.
Scanning electron microscopy images of the surface view and cross-section of (a) pristine TiO2 film and TiO2-Ag composite films deposited using different AgNO3 concentrations: (b–f) 0.1, 0.5, 1, 2, and 4 wt%, respectively.
Figure 4.
Scanning electron microscopy images of the surface view and cross-section of (a) pristine TiO2 film and TiO2-Ag composite films deposited using different AgNO3 concentrations: (b–f) 0.1, 0.5, 1, 2, and 4 wt%, respectively.

Figure 5.
Structure and component of the TiO2-Ag (1 wt%) film: (a) transmission electron microscopy (TEM) image, (b) high-resolution TEM images, and (c) the corresponding energy dispersive X-ray profile of the region in the yellow square.
Figure 5.
Structure and component of the TiO2-Ag (1 wt%) film: (a) transmission electron microscopy (TEM) image, (b) high-resolution TEM images, and (c) the corresponding energy dispersive X-ray profile of the region in the yellow square.

Figure 6.
Photocatalytic activity for the degradation of methylene blue over different films: (a) degradation with respect to time and (b) rate constants.
Figure 6.
Photocatalytic activity for the degradation of methylene blue over different films: (a) degradation with respect to time and (b) rate constants.

Figure 7.
Schematic describing the fabrication process of the plasma-enhanced chemical vapor deposition method.
Figure 7.
Schematic describing the fabrication process of the plasma-enhanced chemical vapor deposition method.


Table 1.
Bandgap energies (Eg) of the films.
| Film | Threshold Wavelength (nm) | Eg (eV) |
|---|---|---|
| Pristine TiO2 | 350 | 3.54 |
| TiO2-Ag (0.1 wt%) | 386 | 3.21 |
| TiO2-Ag (0.5 wt%) | 389 | 3.18 |
| TiO2-Ag (1 wt%) | 410 | 3.02 |
| TiO2-Ag (2 wt%) | 442 | 2.80 |
| TiO2-Ag (4 wt%) | 457 | 2.61 |
Publisher’s Note: MDPI stays neutral with regard to jurisdictional claims in published maps and institutional affiliations. |
© 2022 by the authors. Licensee MDPI, Basel, Switzerland. This article is an open access article distributed under the terms and conditions of the Creative Commons Attribution (CC BY) license (https://creativecommons.org/licenses/by/4.0/).
Share and Cite
MDPI and ACS Style
Lang, J.; Takahashi, K.; Kubo, M.; Shimada, M. Ag-Doped TiO2 Composite Films Prepared Using Aerosol-Assisted, Plasma-Enhanced Chemical Vapor Deposition. Catalysts 2022, 12, 365. https://0-doi-org.brum.beds.ac.uk/10.3390/catal12040365
AMA Style
Lang J, Takahashi K, Kubo M, Shimada M. Ag-Doped TiO2 Composite Films Prepared Using Aerosol-Assisted, Plasma-Enhanced Chemical Vapor Deposition. Catalysts. 2022; 12(4):365. https://0-doi-org.brum.beds.ac.uk/10.3390/catal12040365
Chicago/Turabian StyleLang, Jianghua, Kazuma Takahashi, Masaru Kubo, and Manabu Shimada. 2022. "Ag-Doped TiO2 Composite Films Prepared Using Aerosol-Assisted, Plasma-Enhanced Chemical Vapor Deposition" Catalysts 12, no. 4: 365. https://0-doi-org.brum.beds.ac.uk/10.3390/catal12040365
Note that from the first issue of 2016, this journal uses article numbers instead of page numbers. See further details here.