
H2 Photoproduction Efficiency: Implications of the Reaction Mechanism as a Function of the Methanol/Water Mixture


Abstract
:1. Introduction
2. Results and Discussion
3. Materials and Methods
3.1. Catalysts Preparation
3.2. Catalytic Measurements
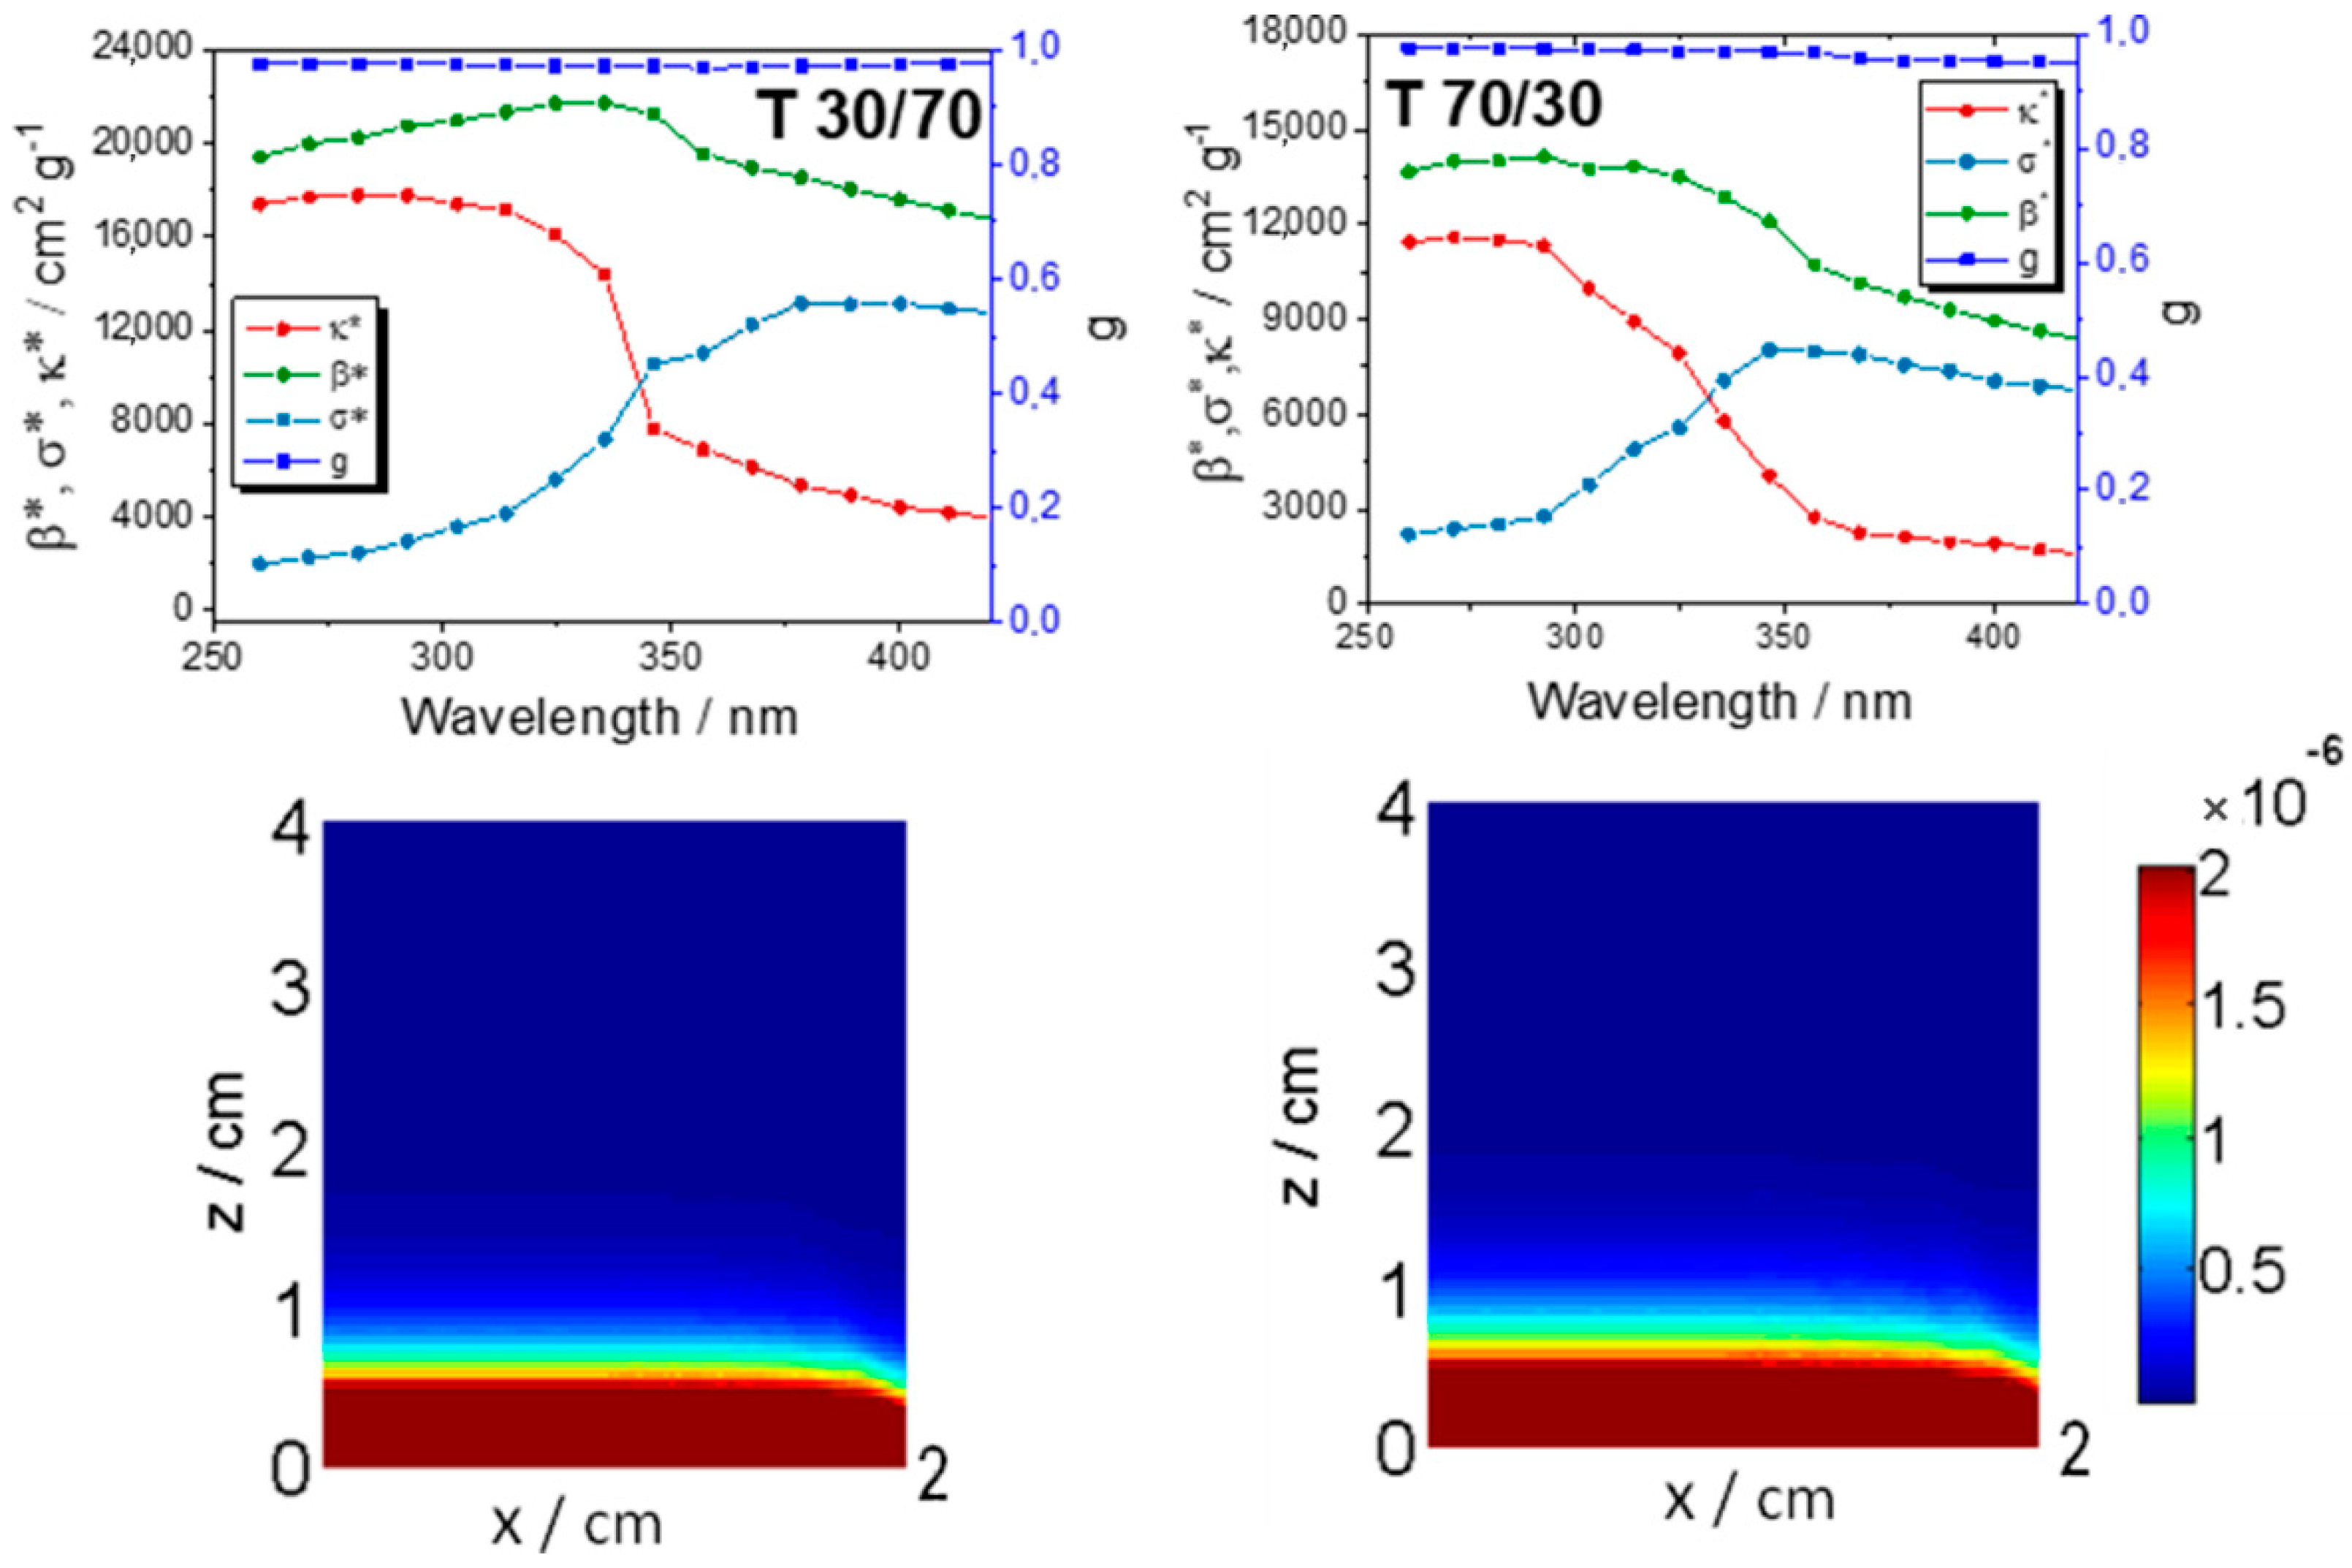
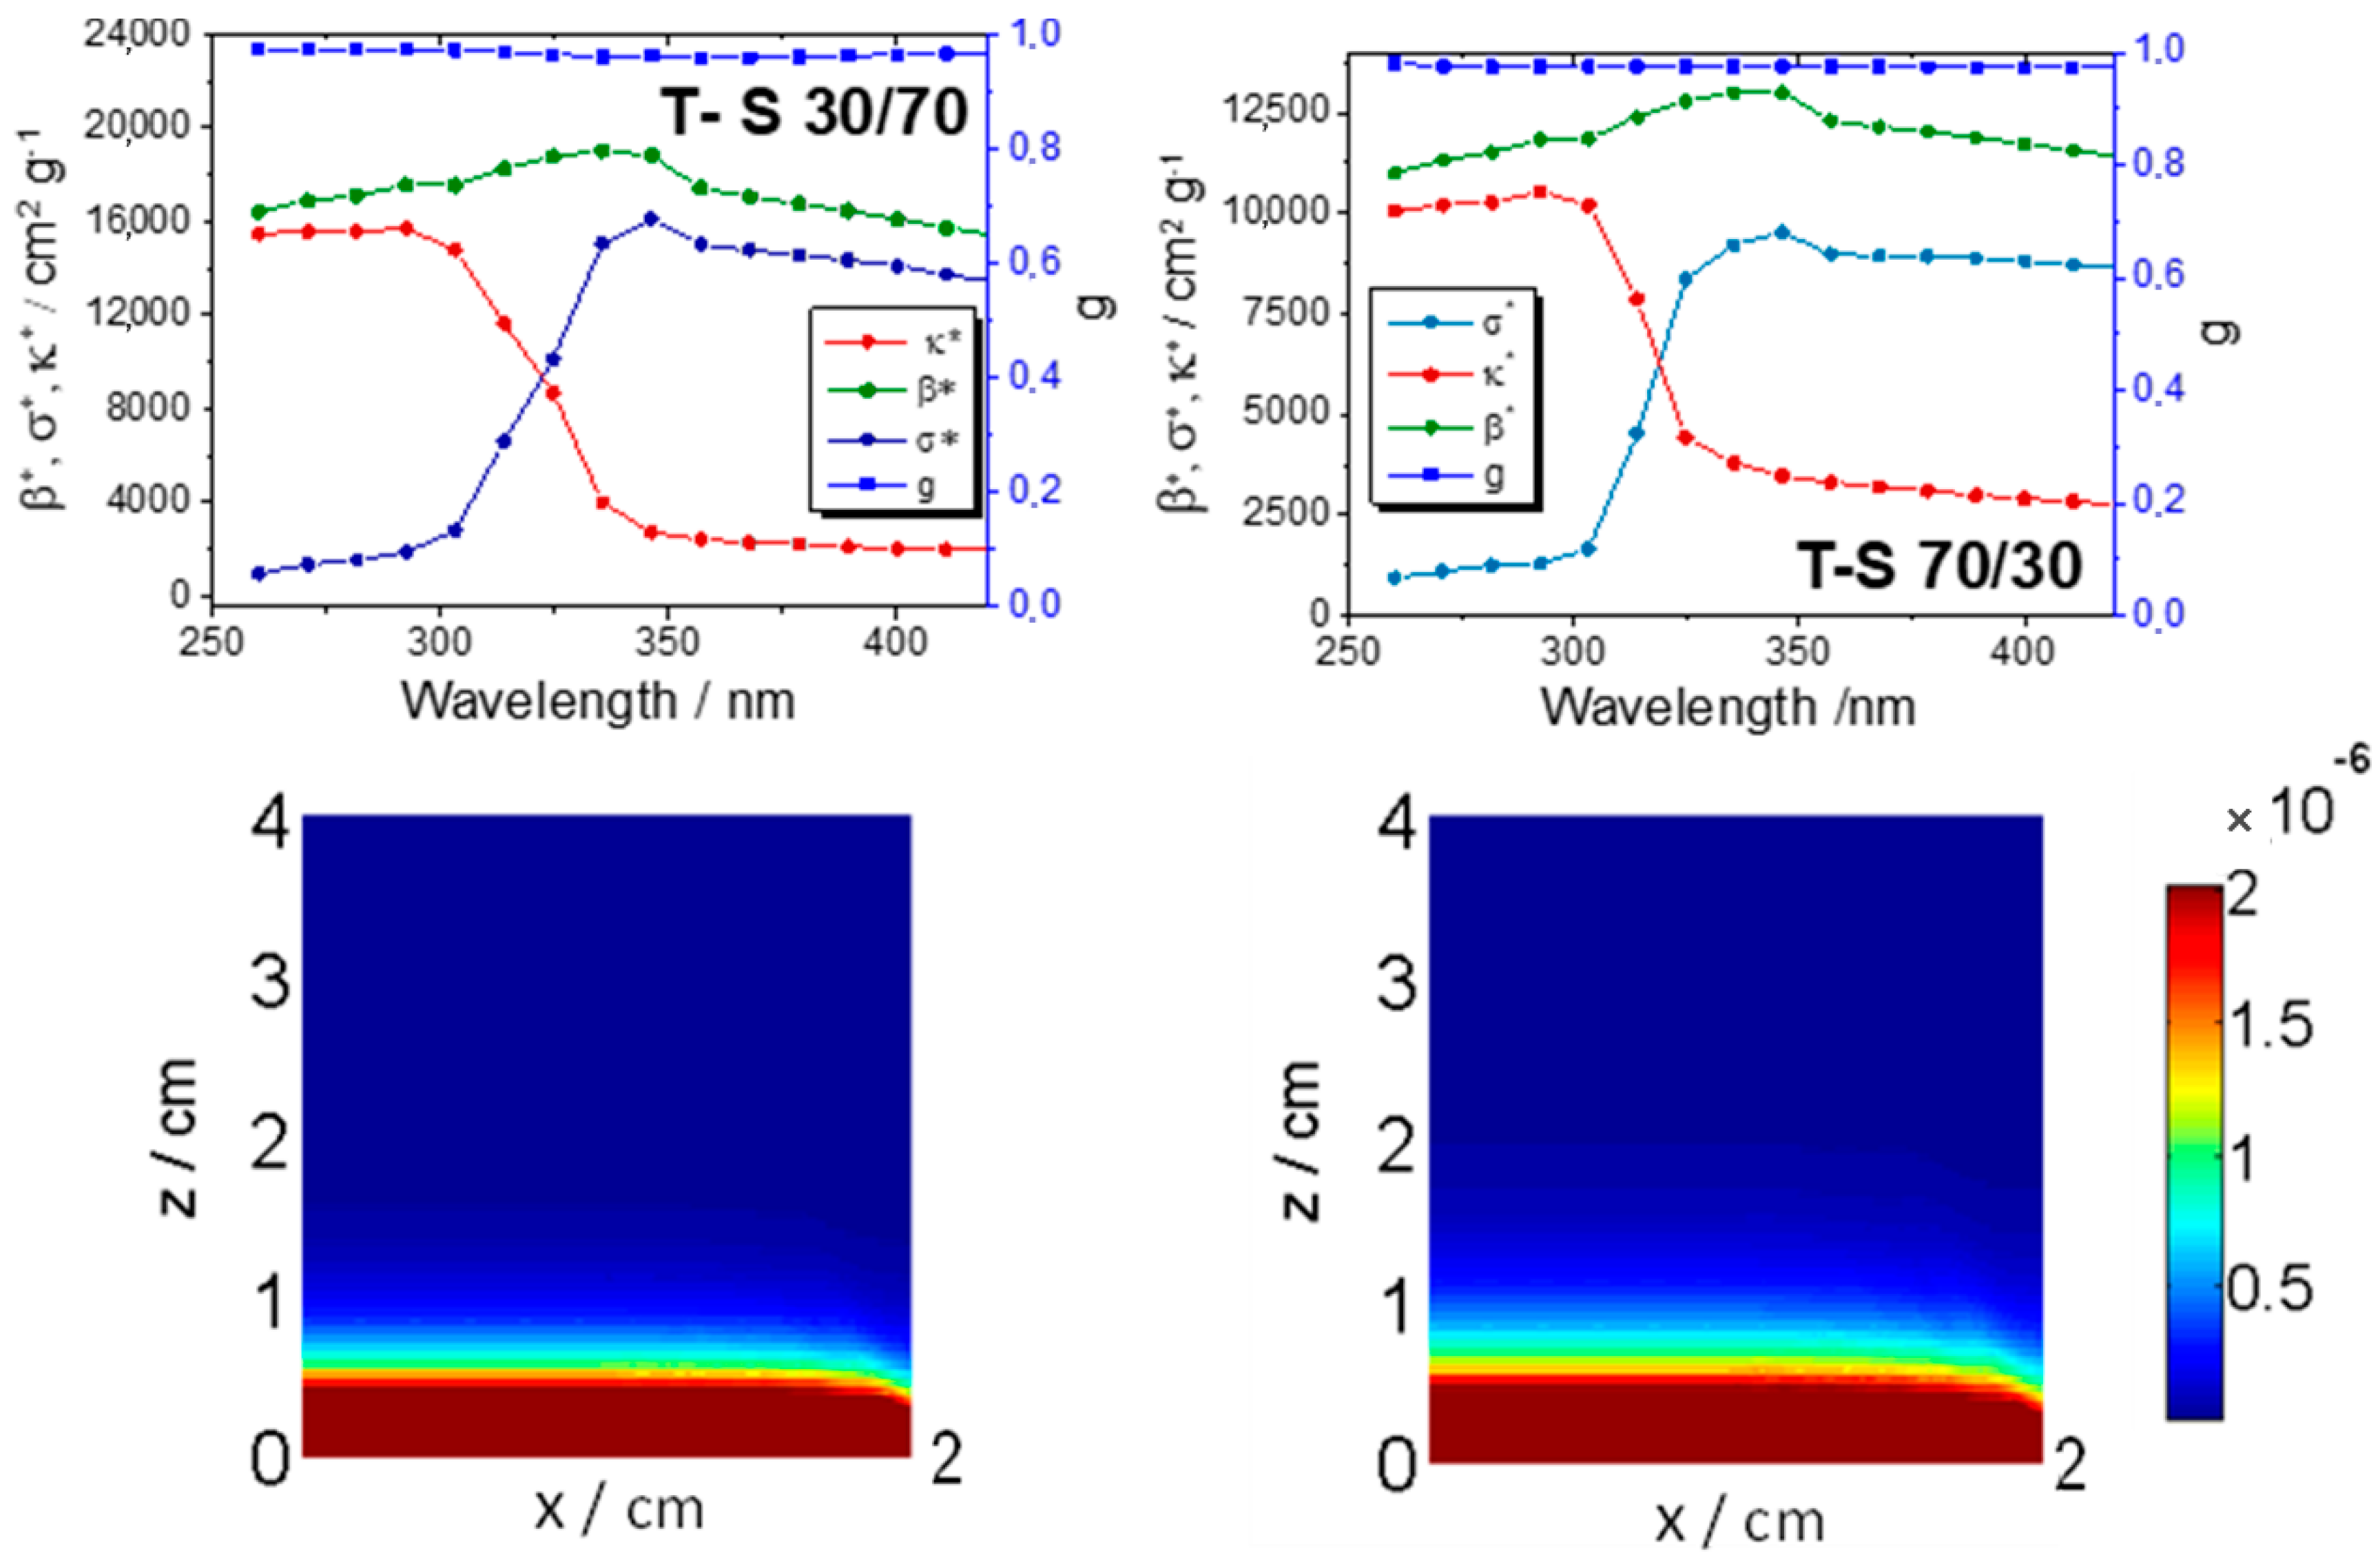
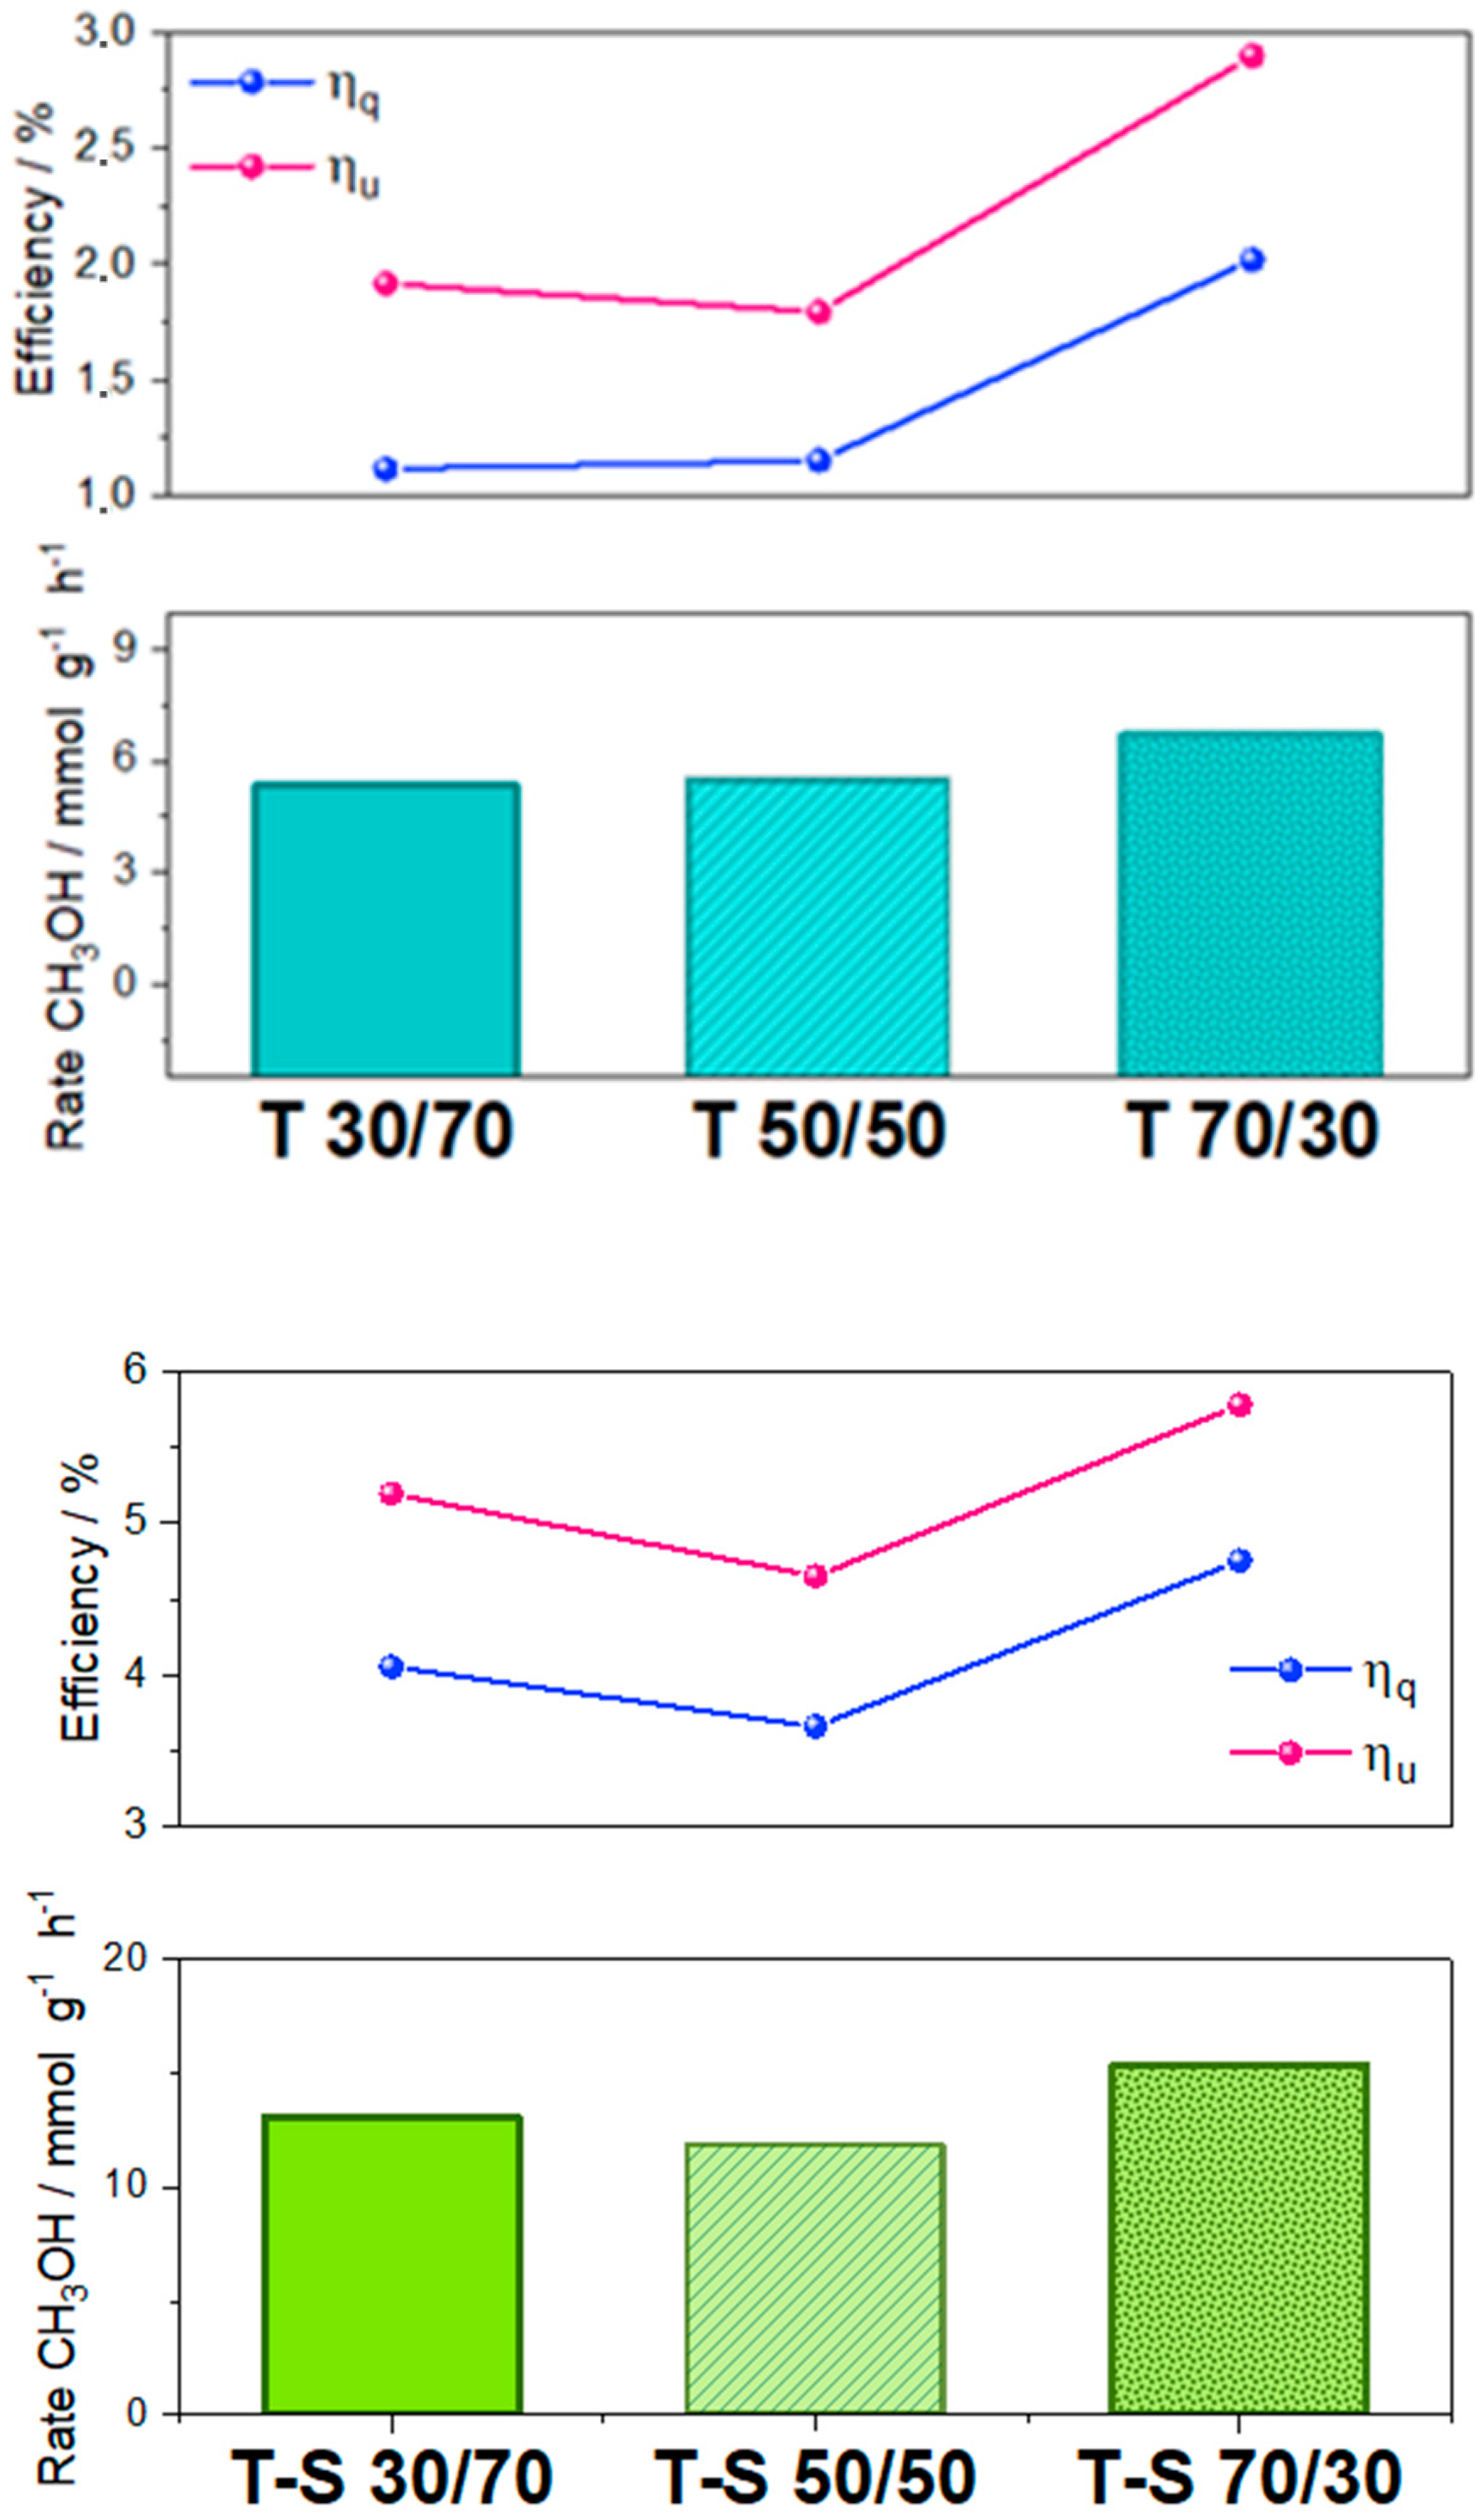
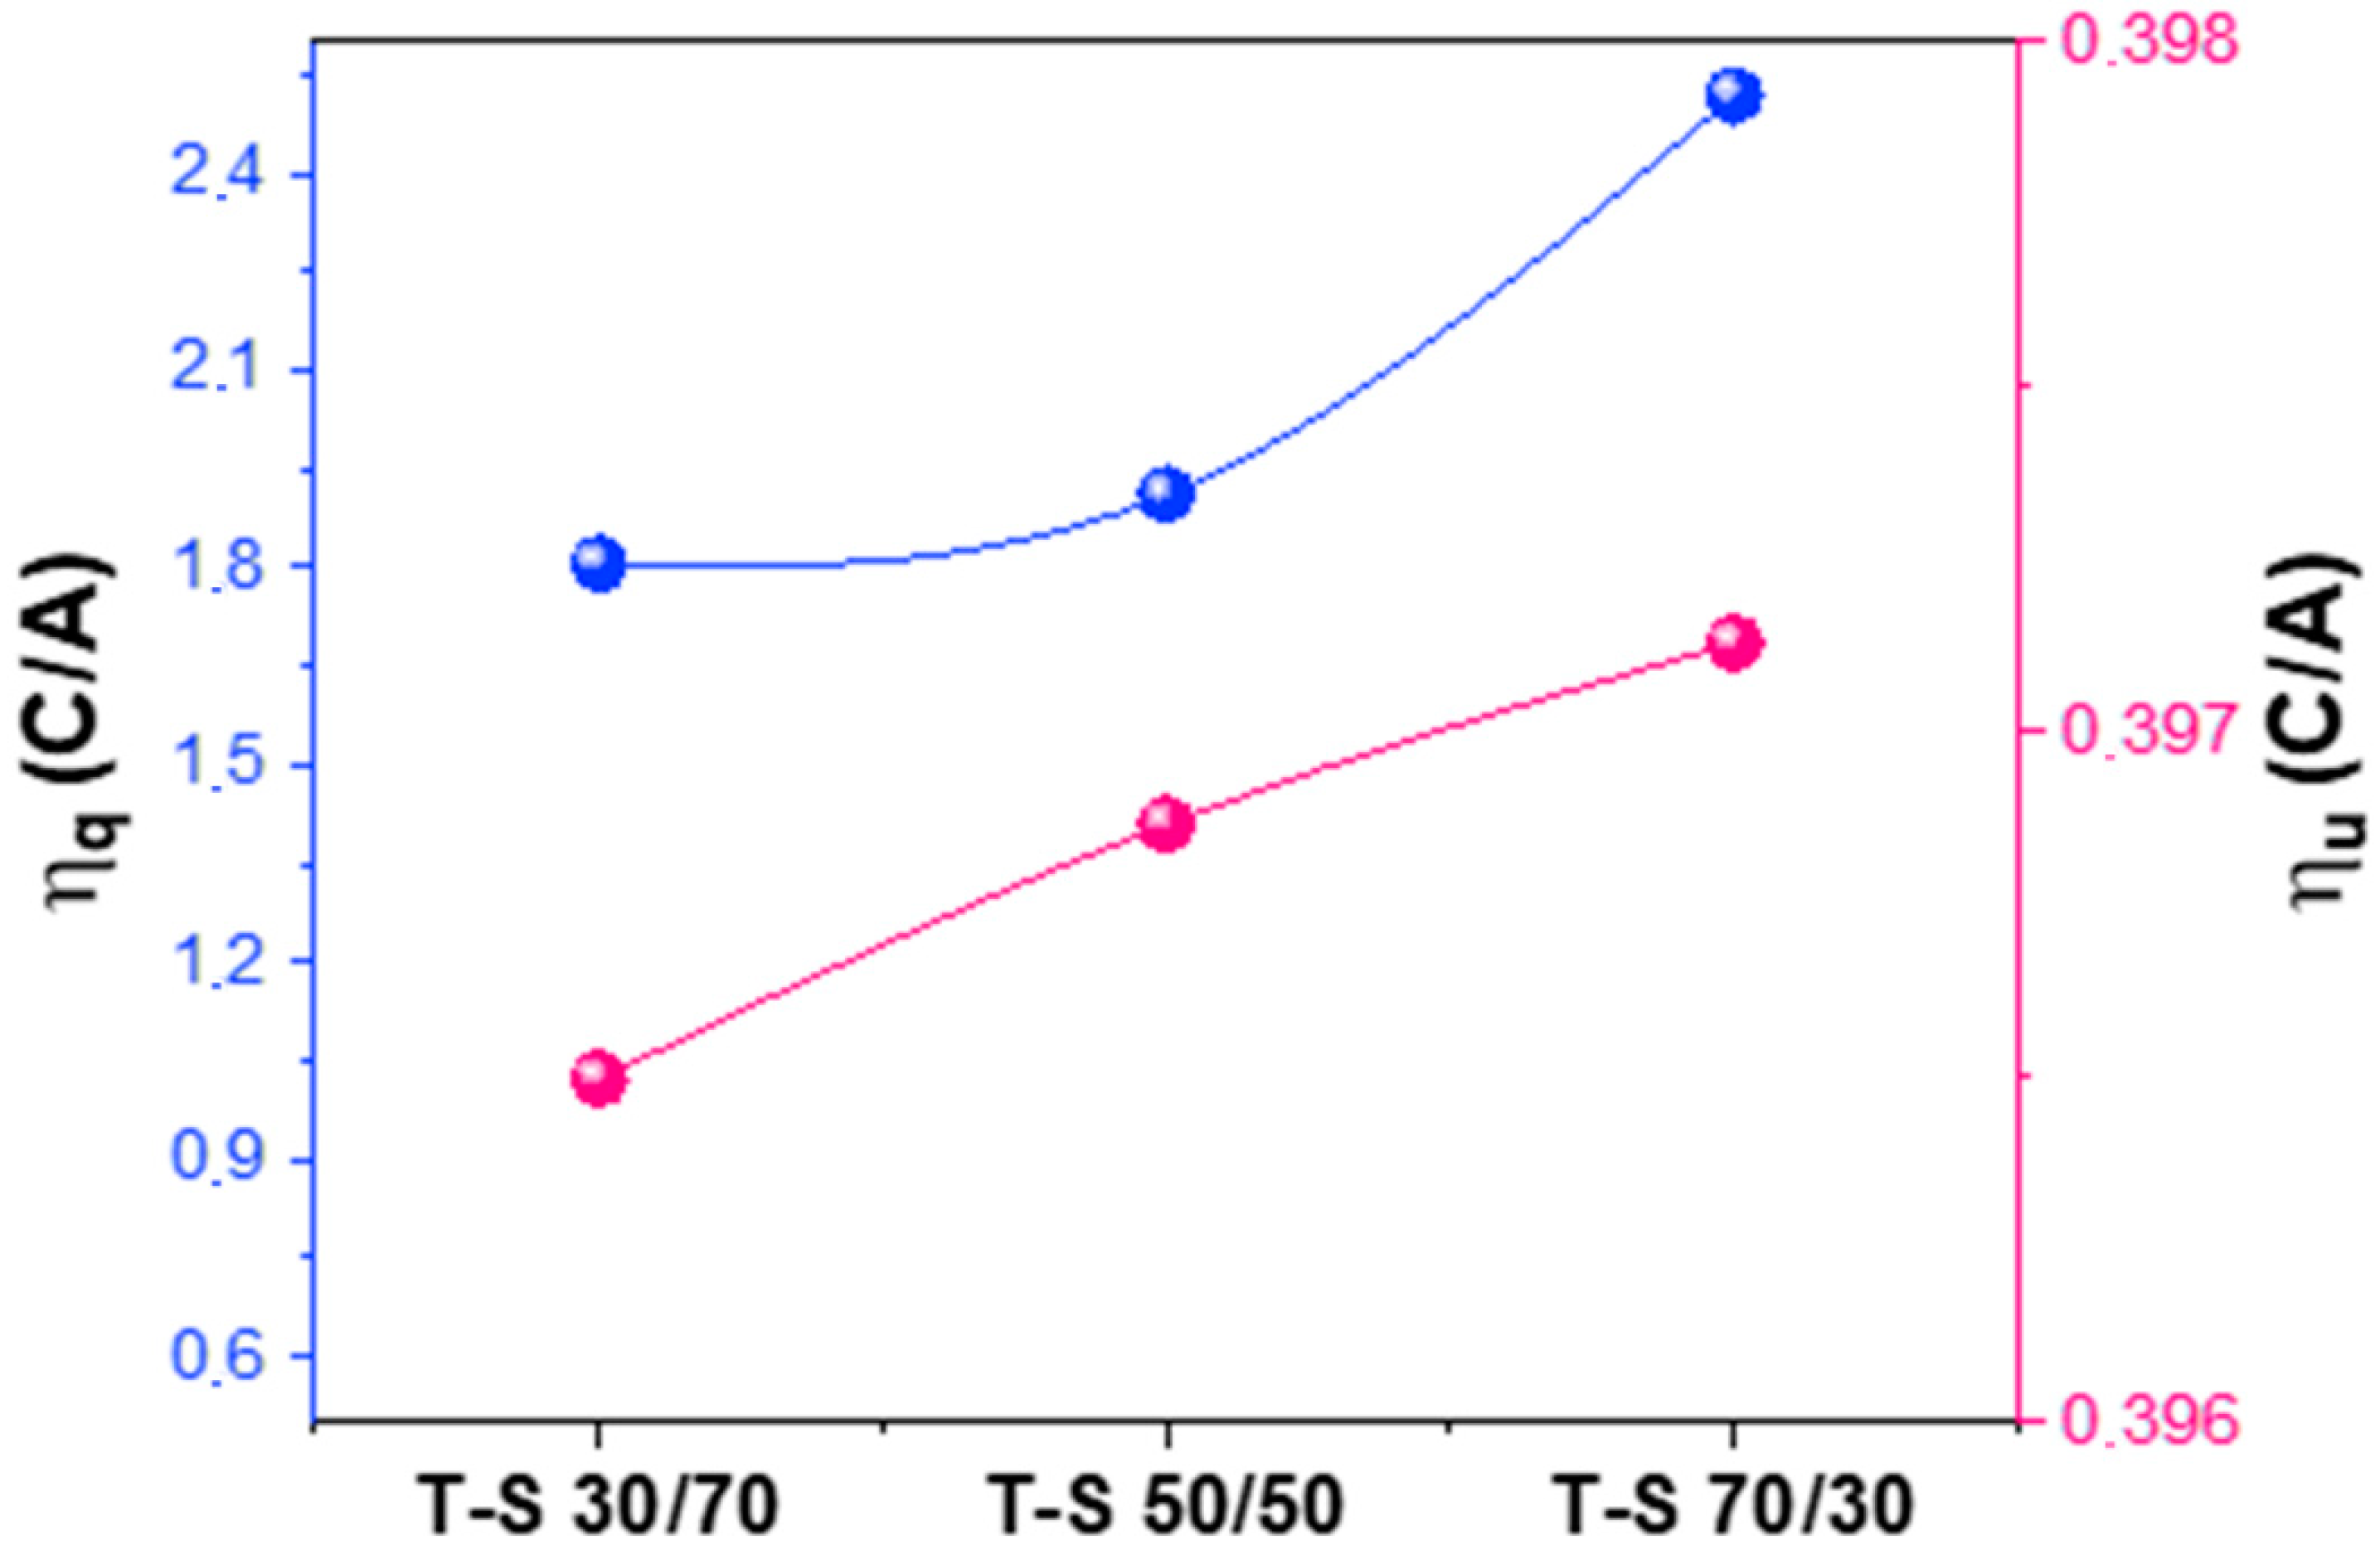
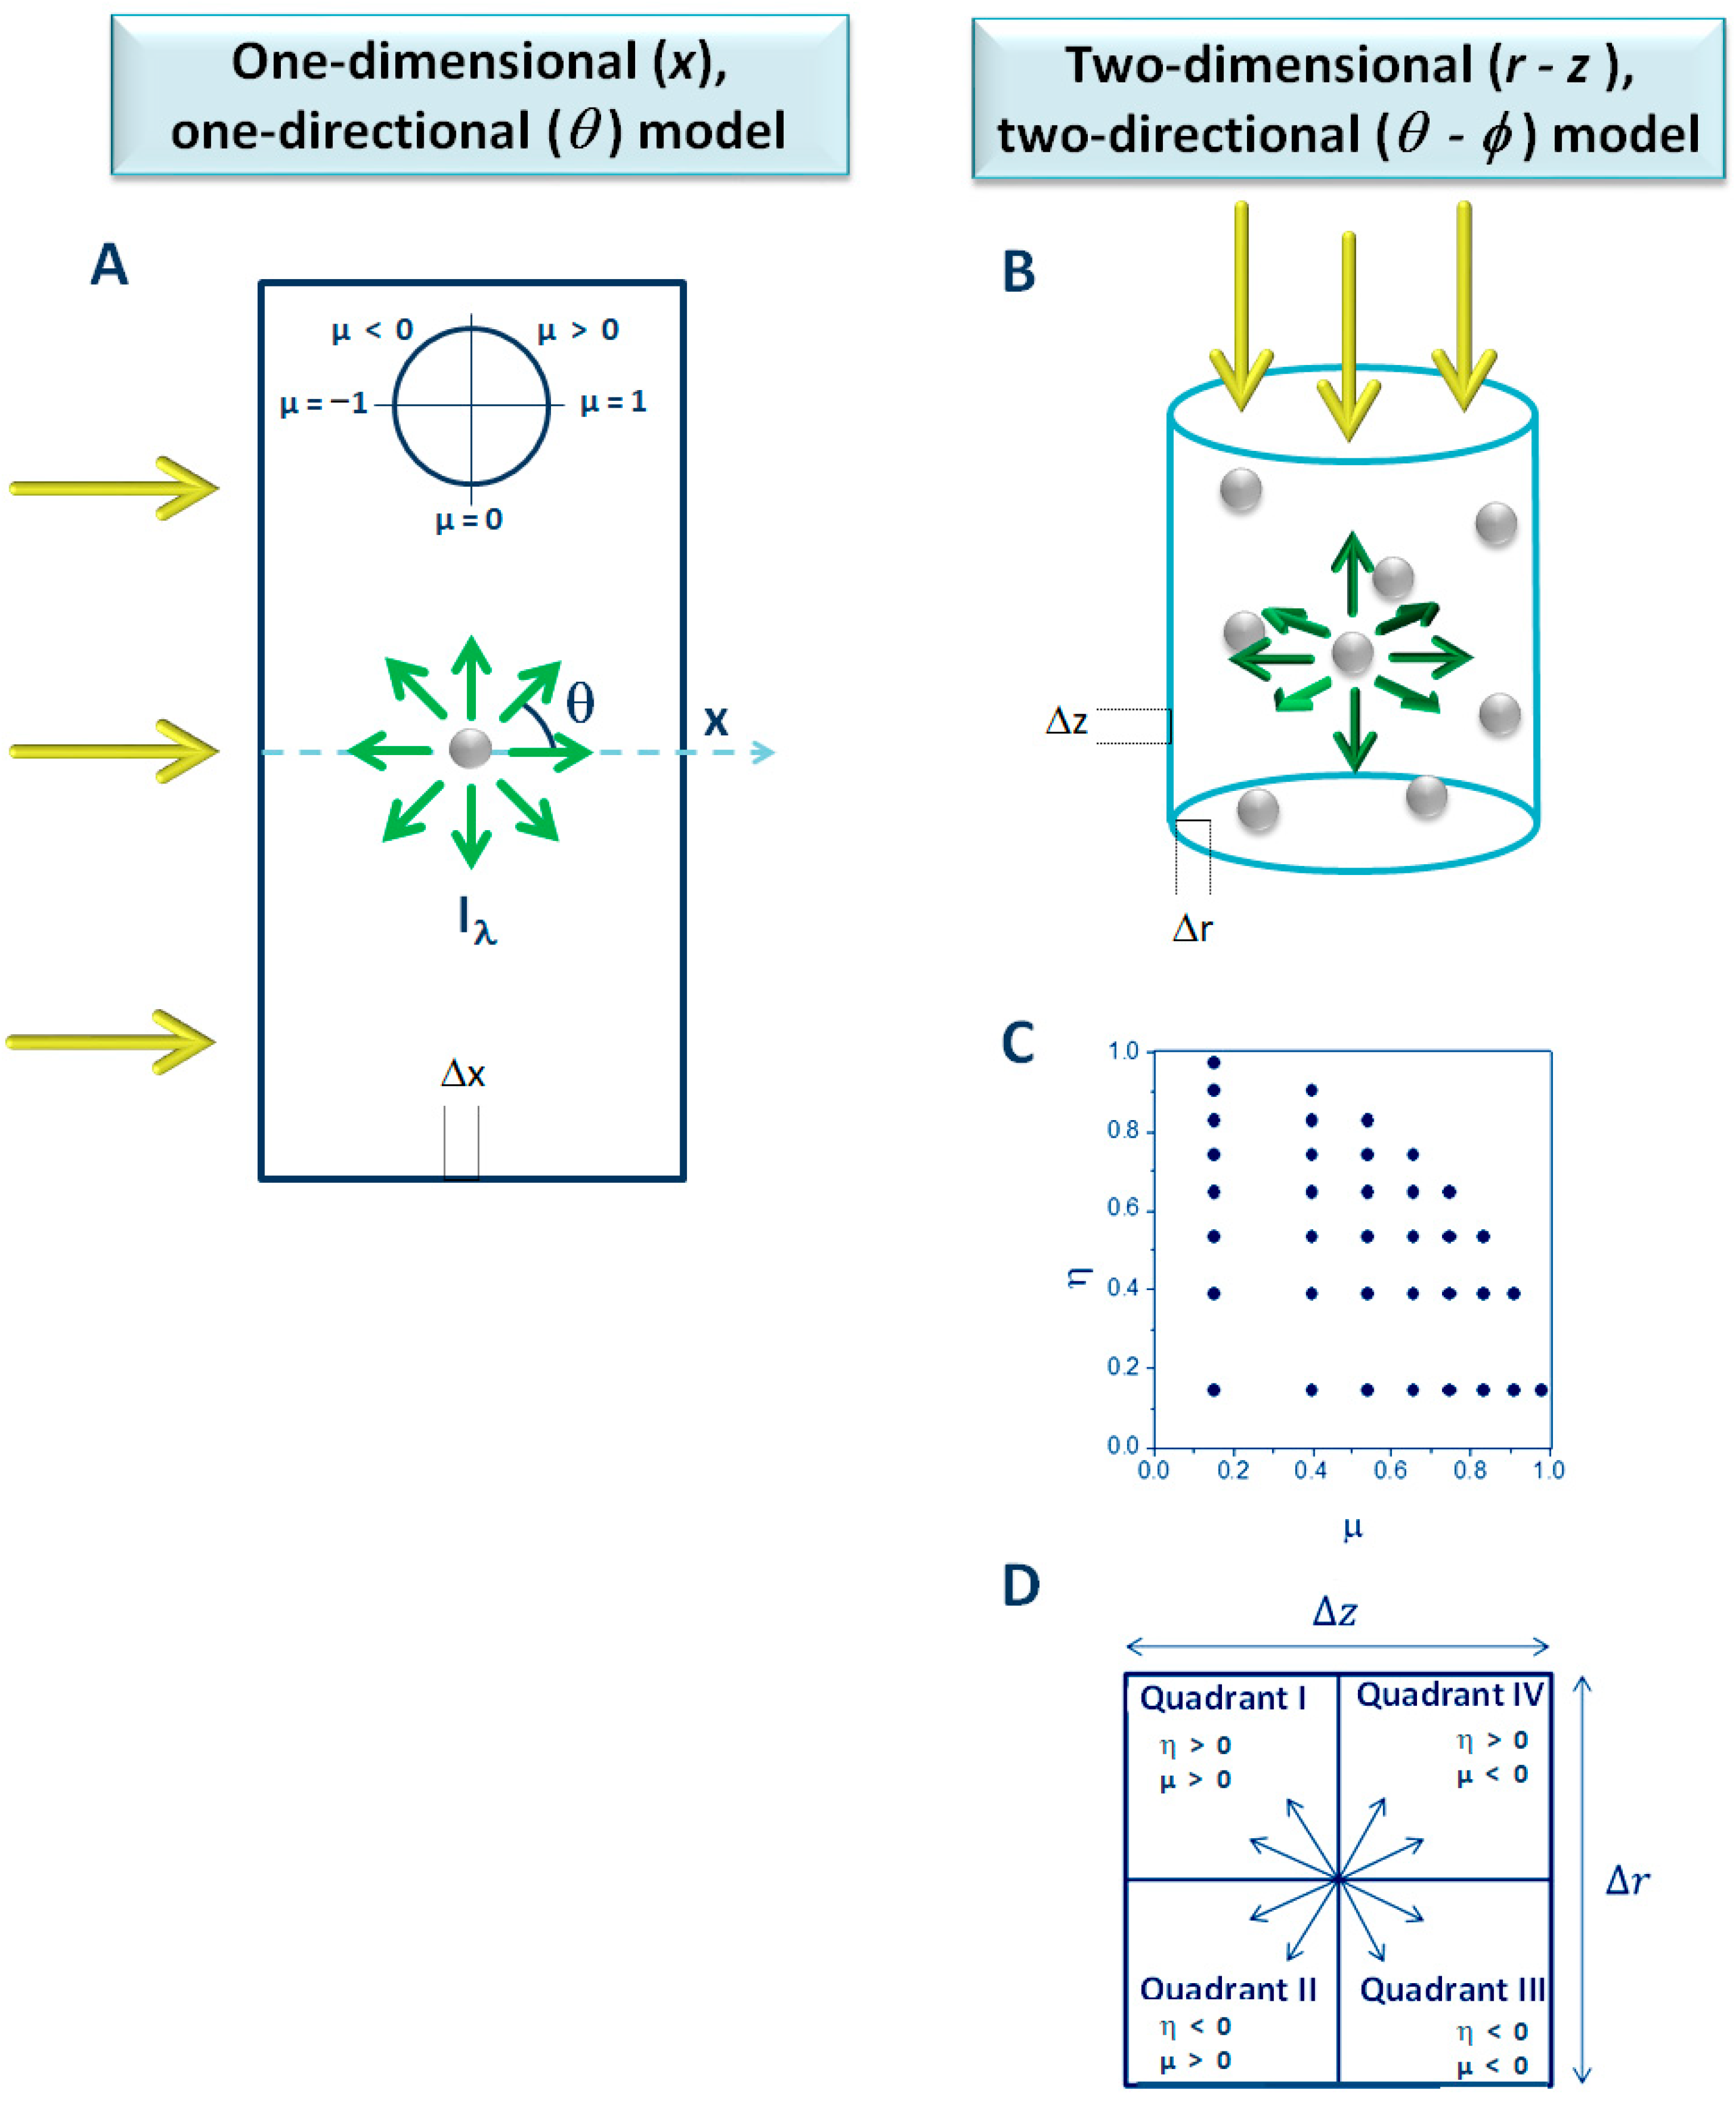
3.3. Efficiency Calculations: Volumetric Rate of Photon Absorption
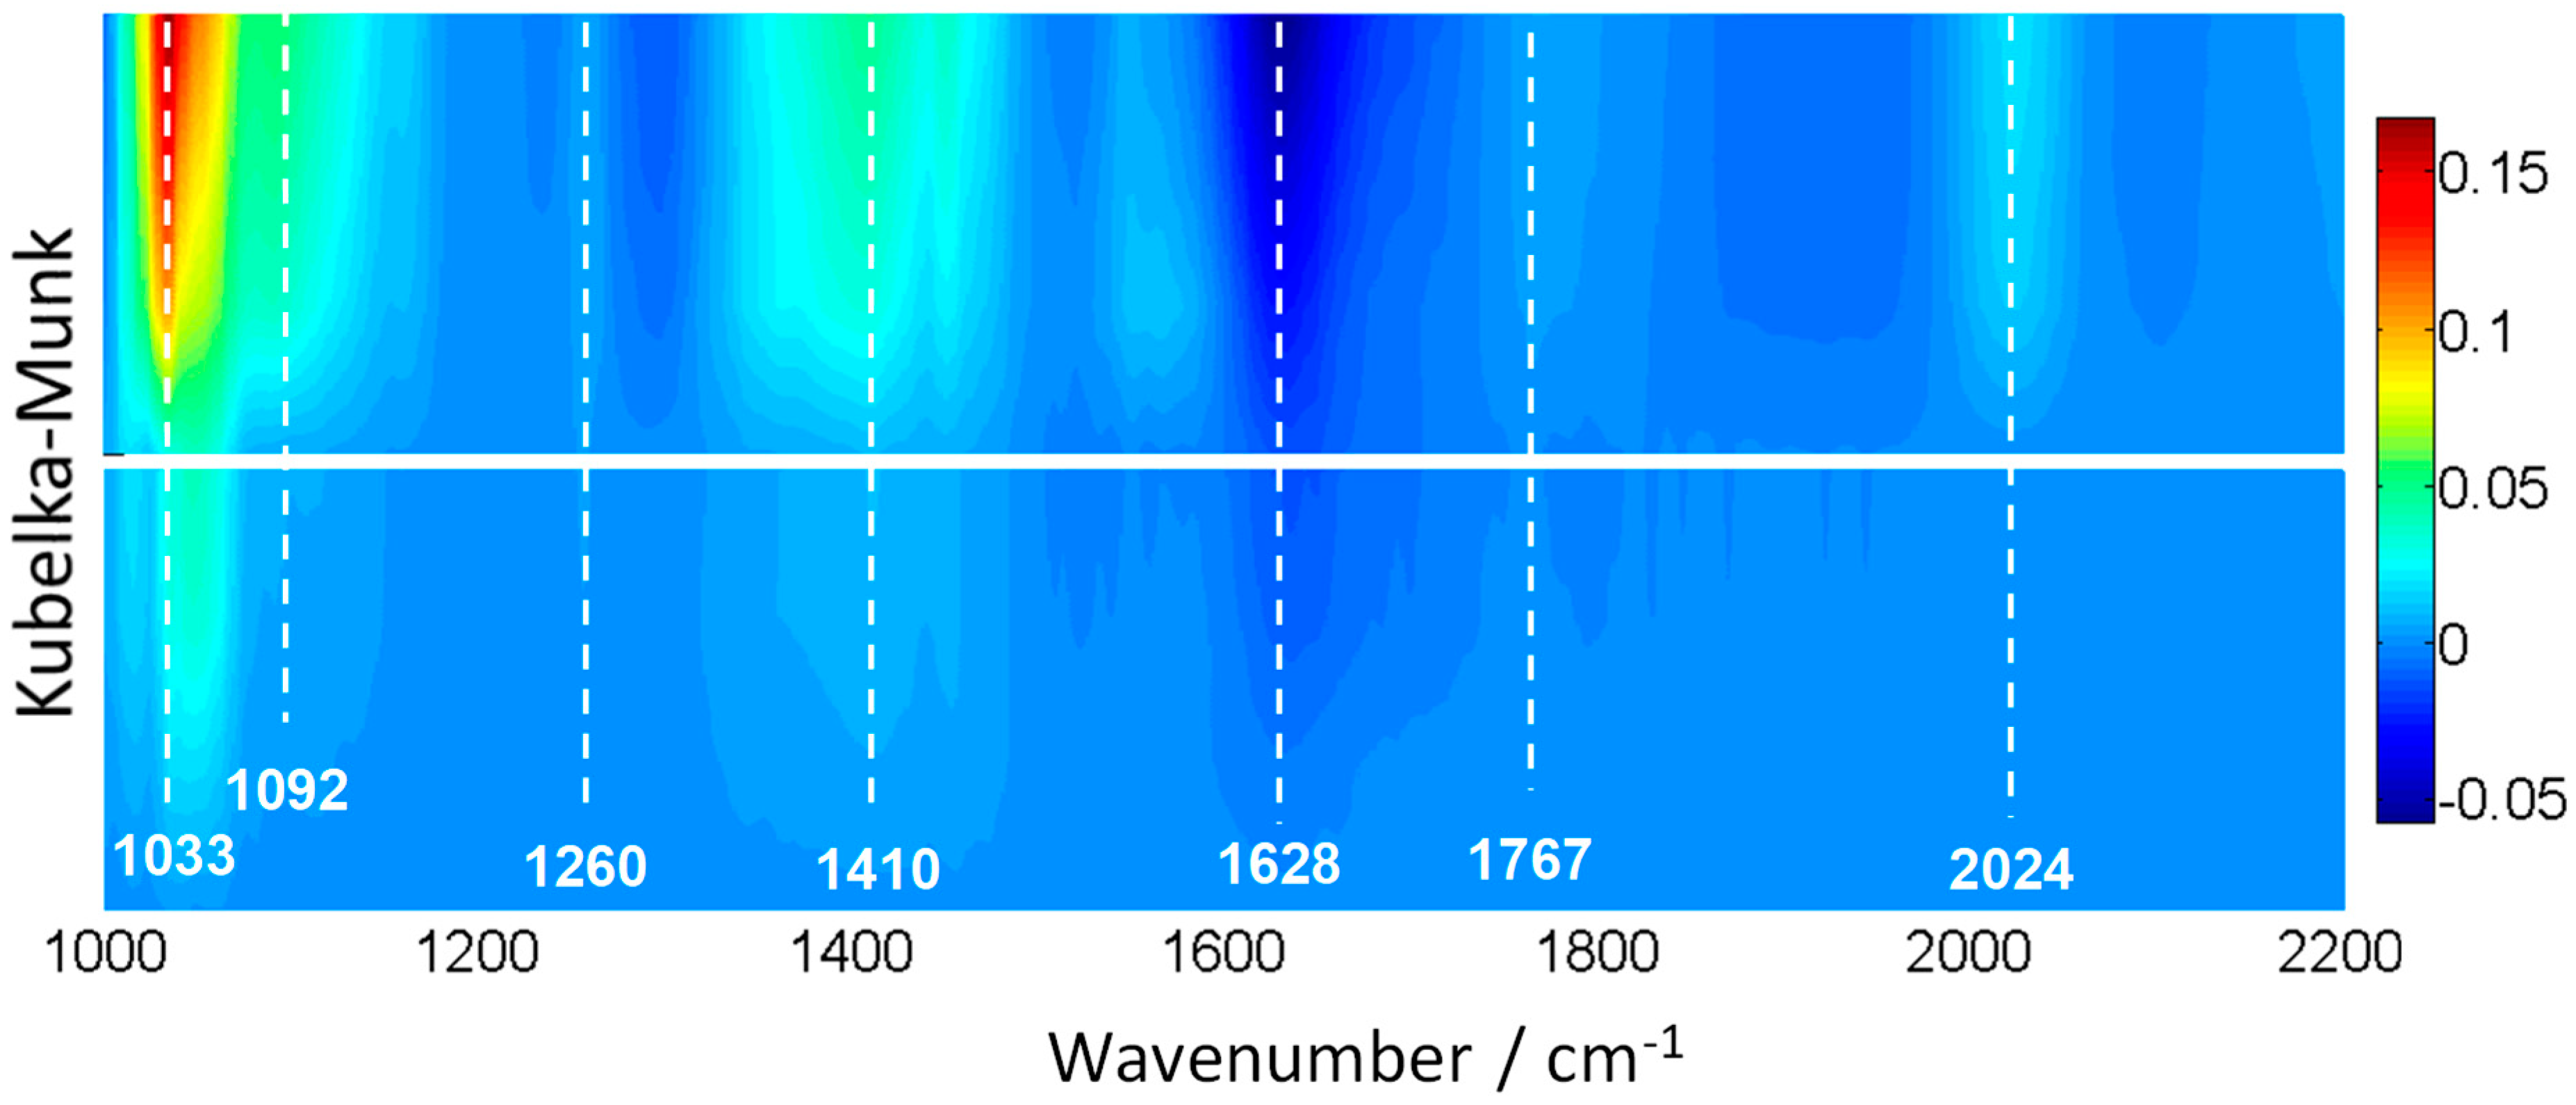
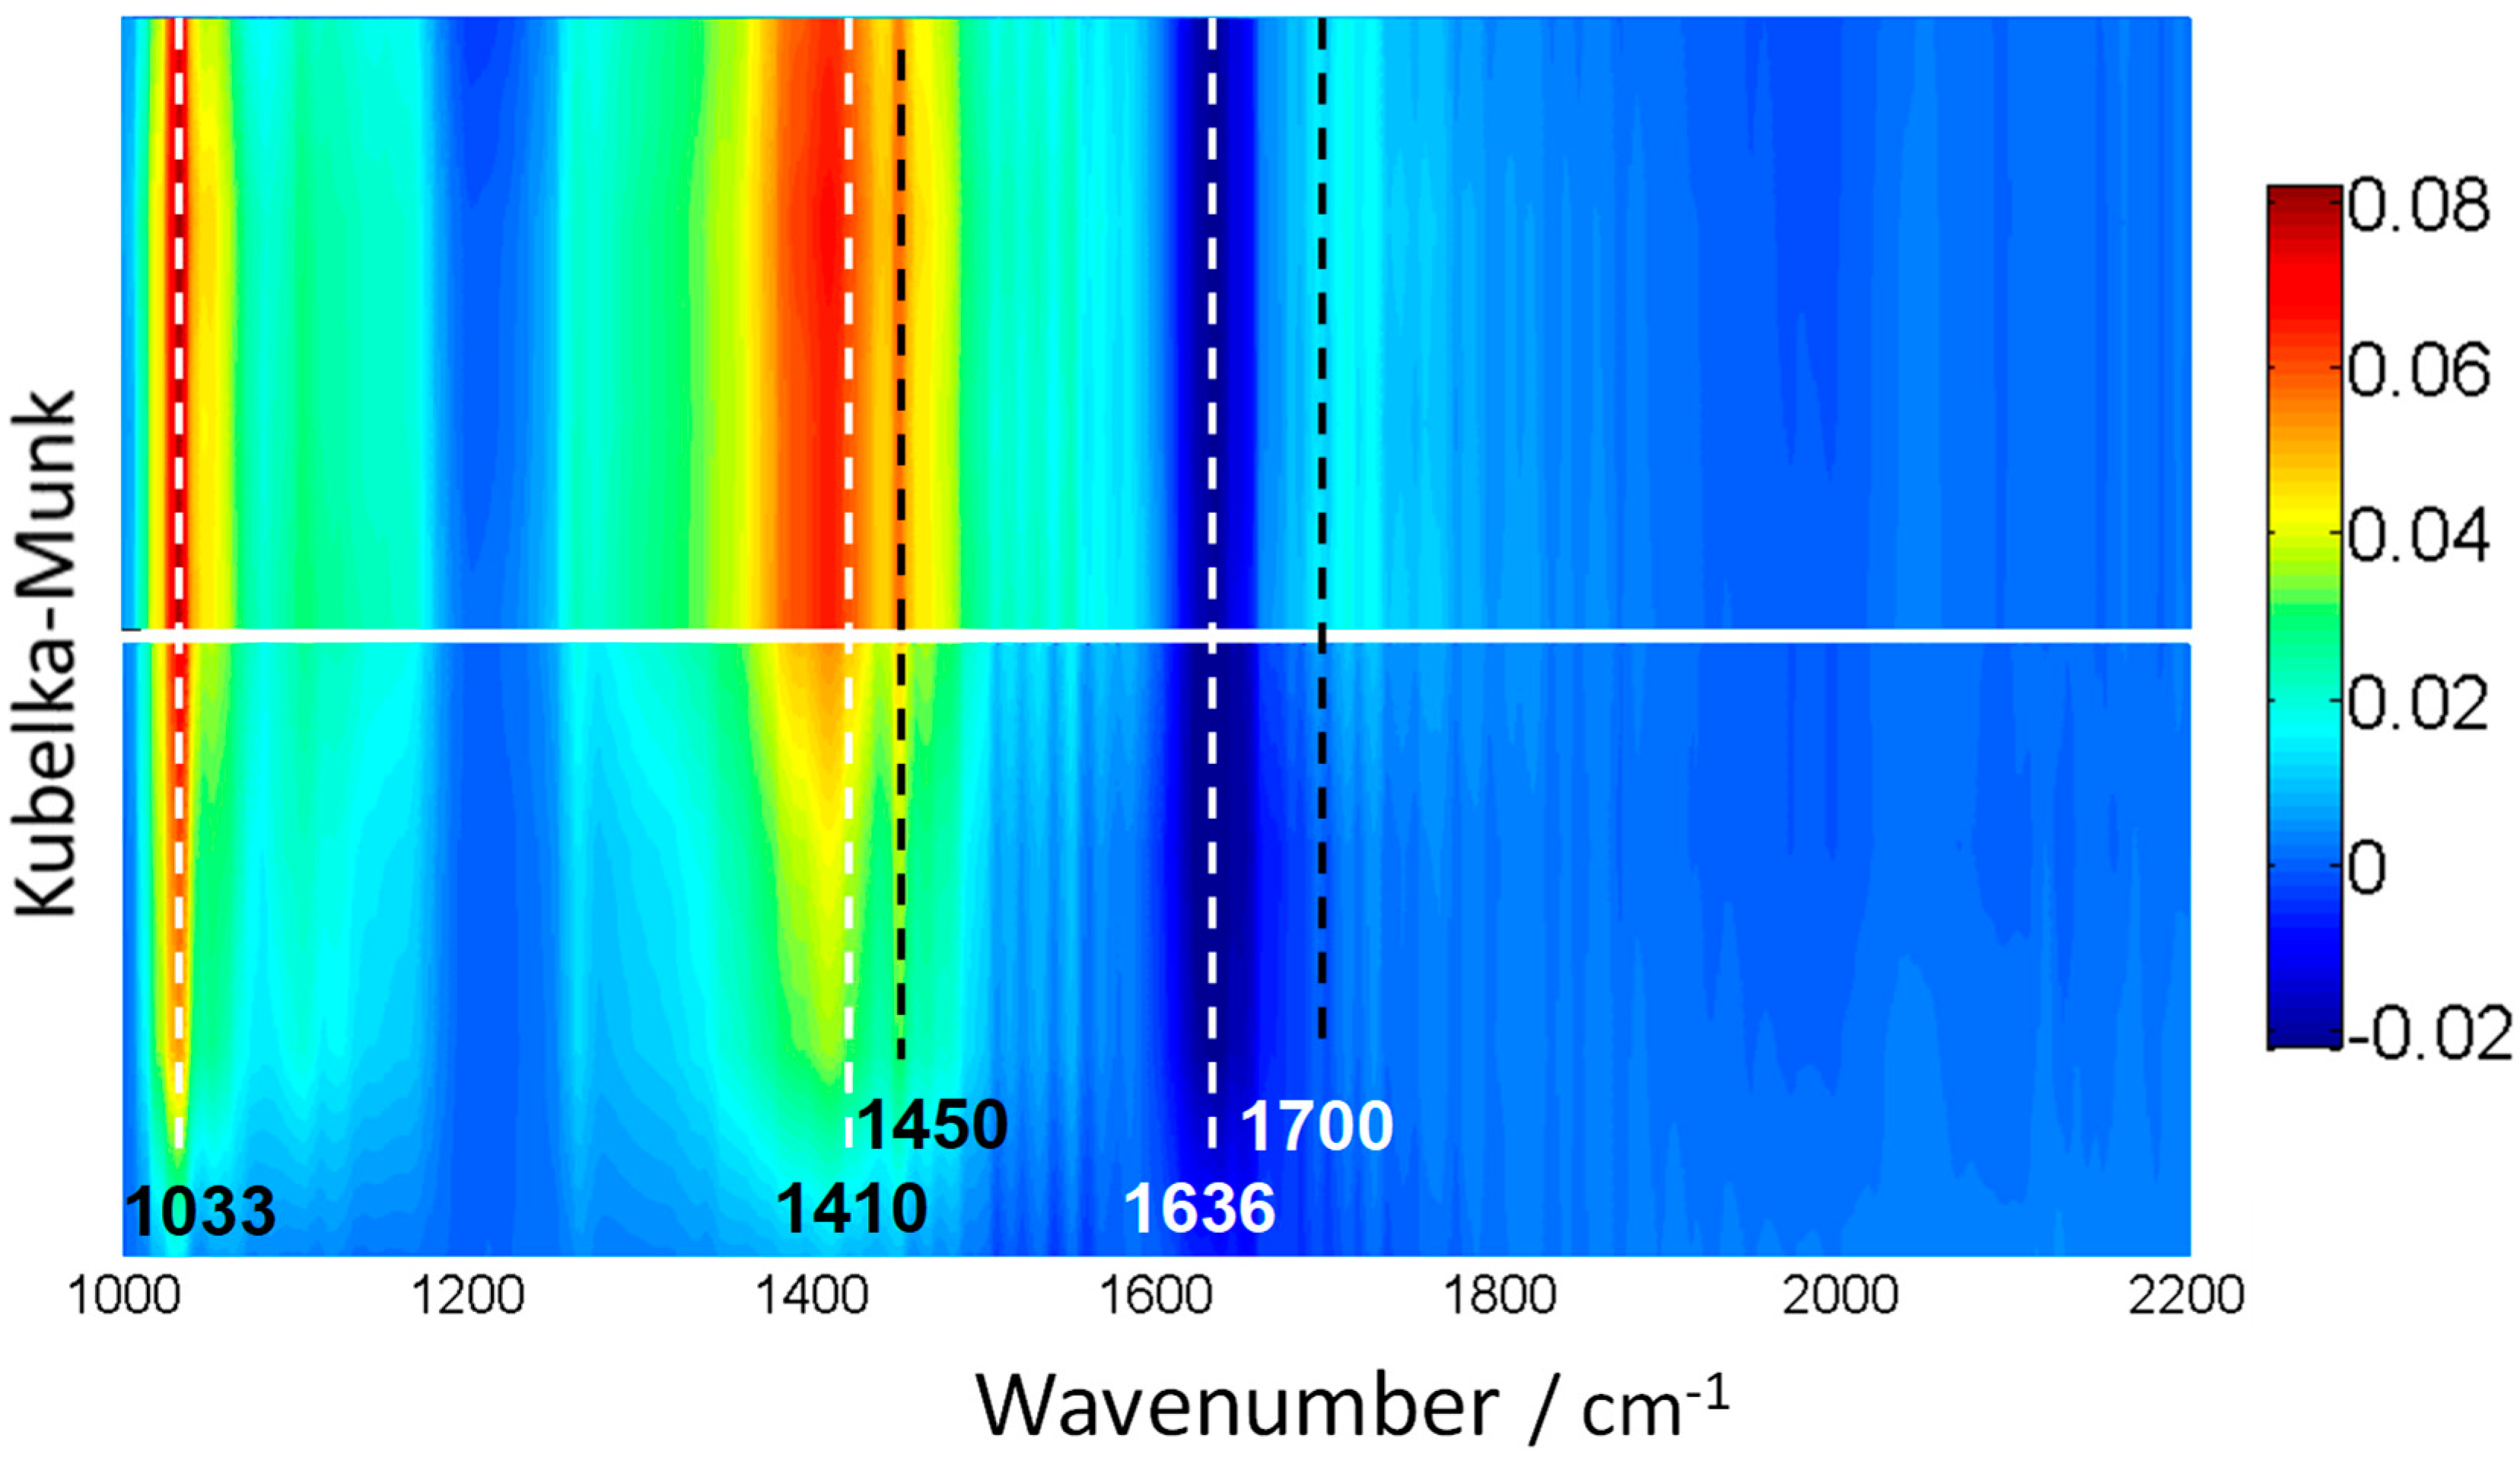
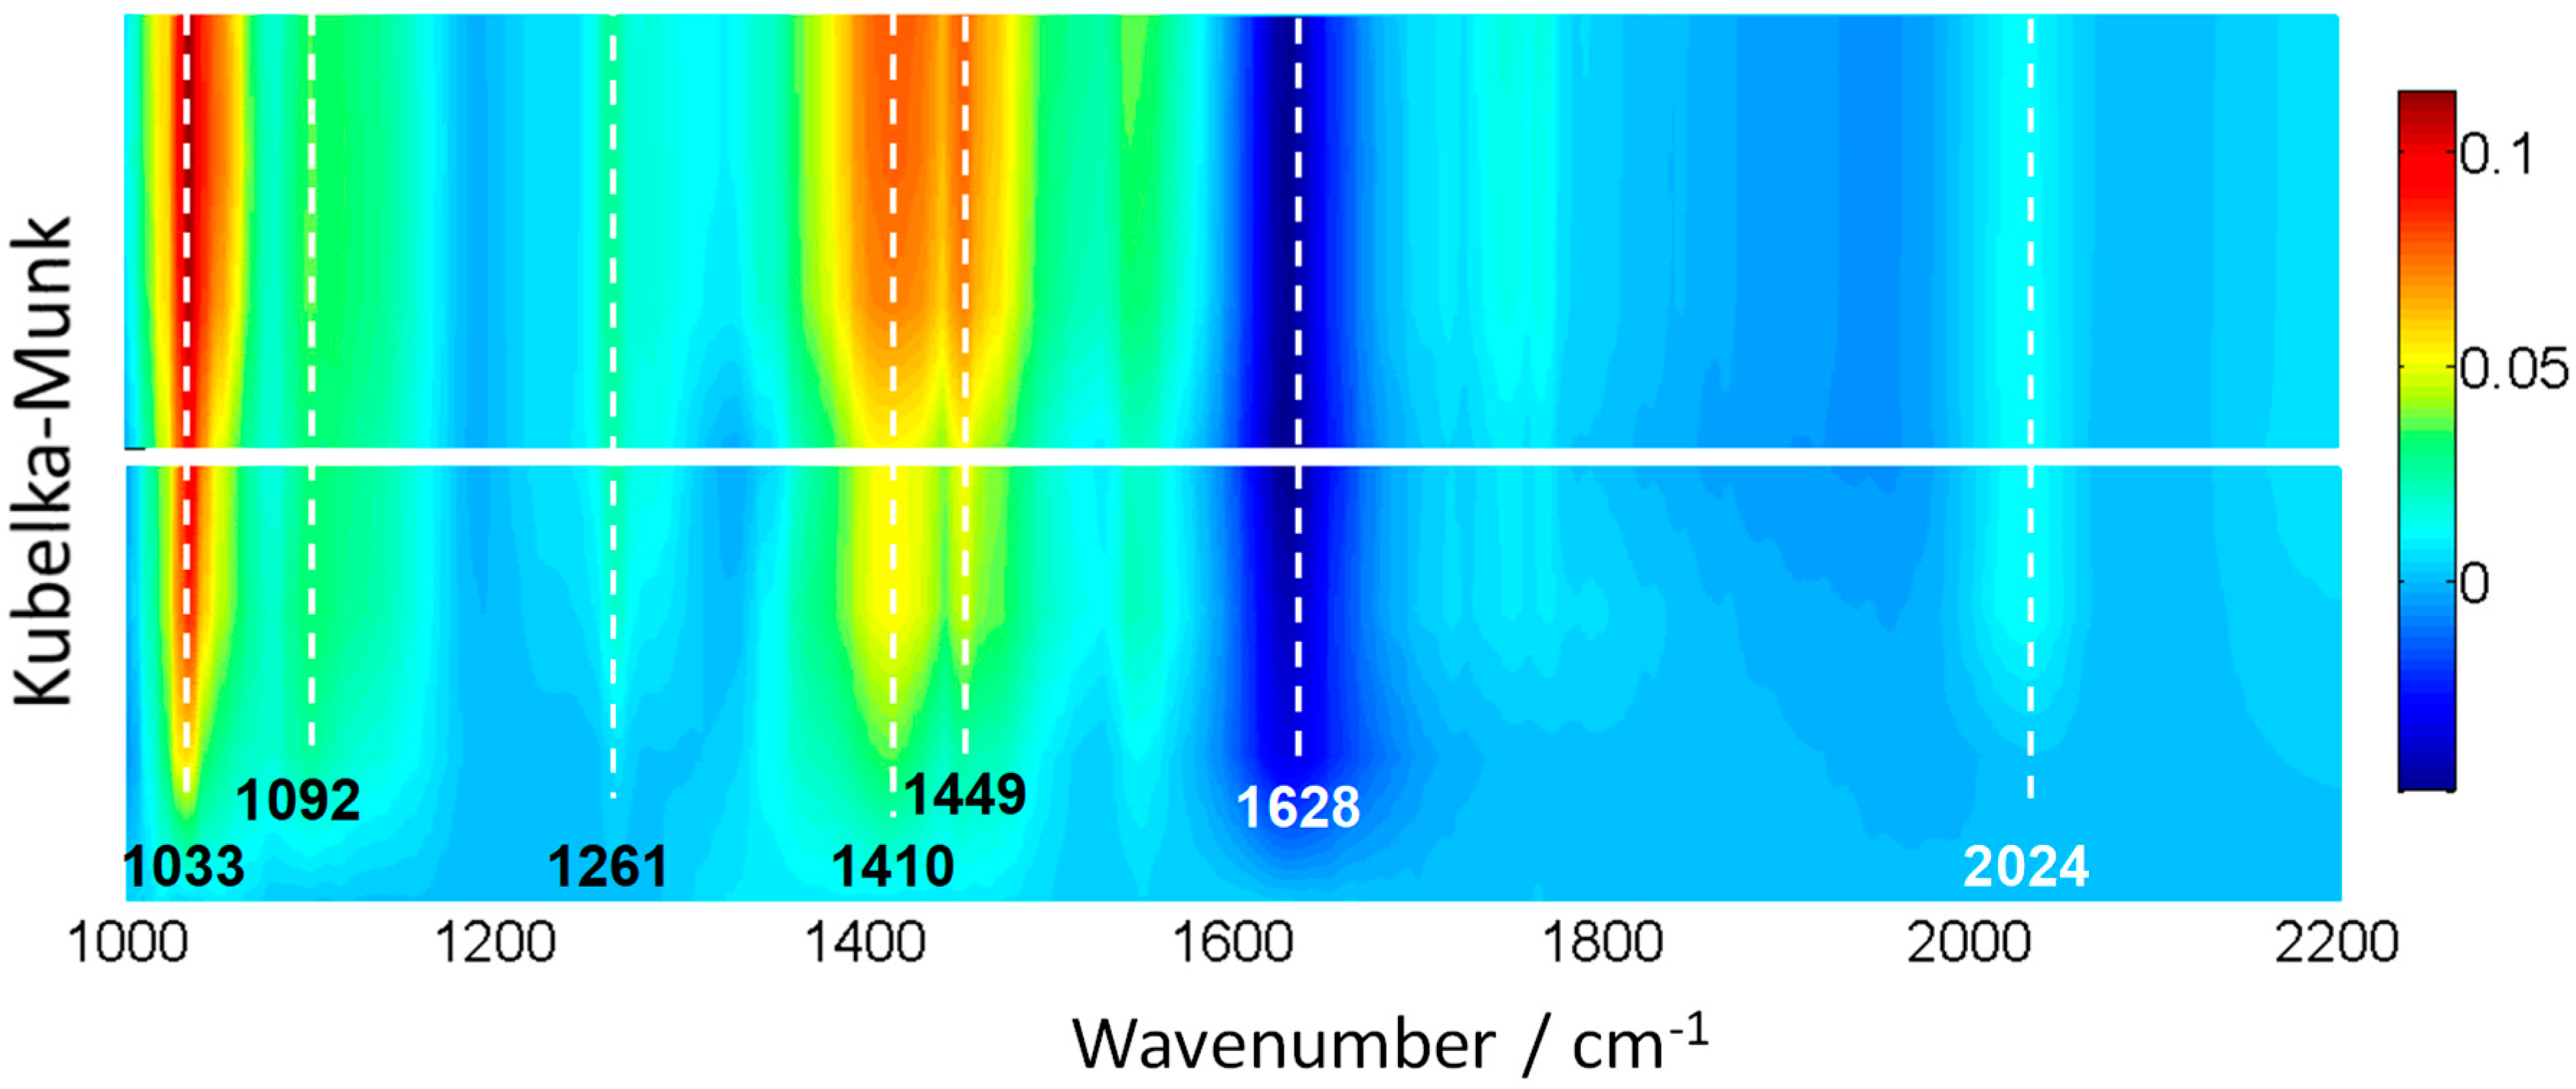
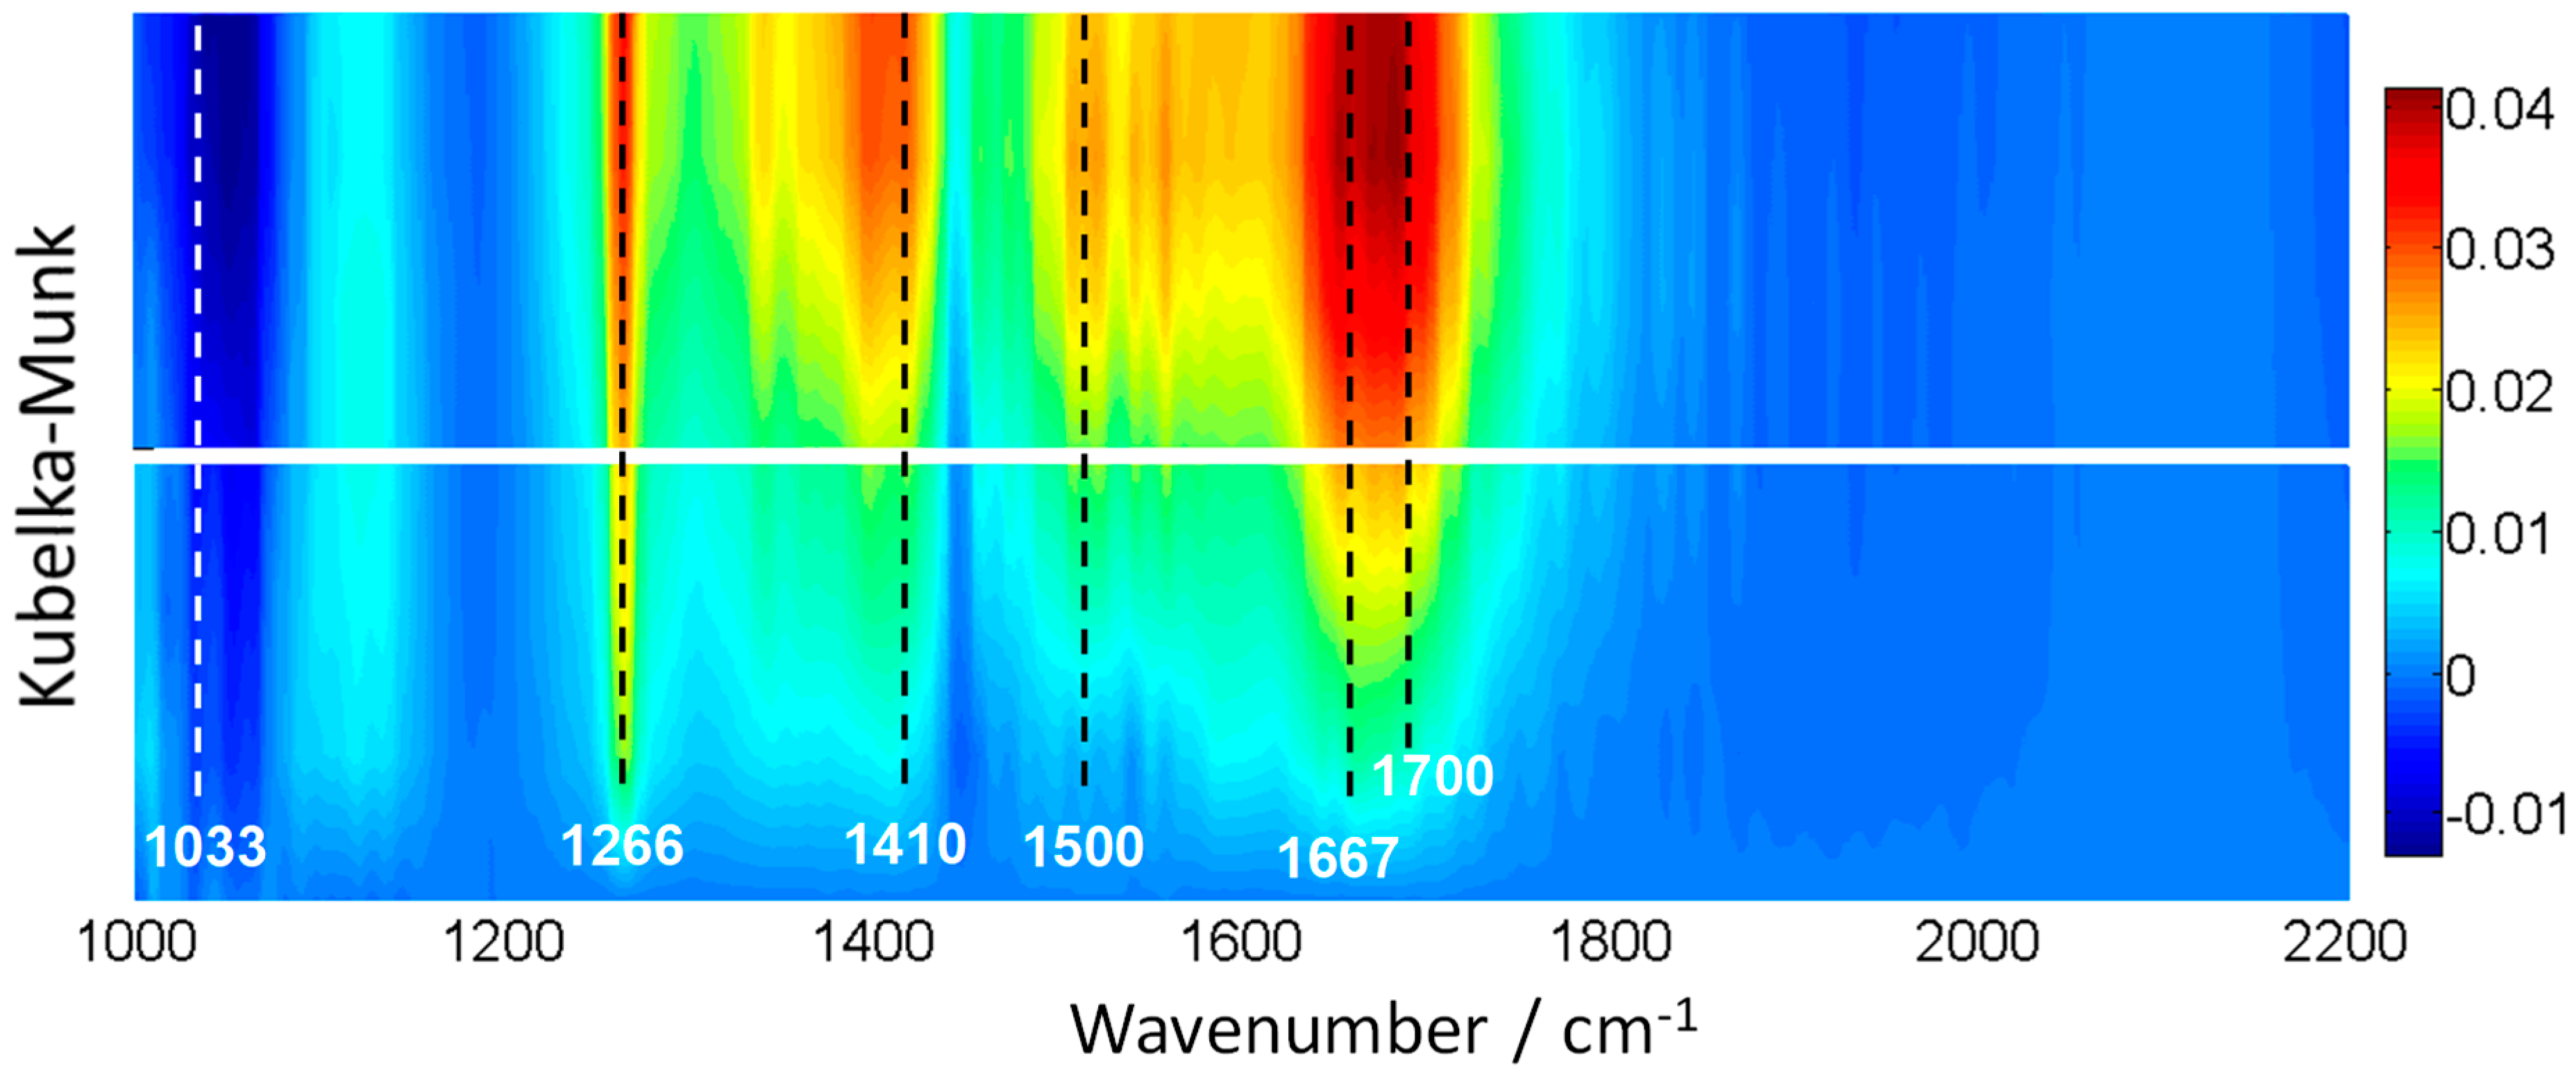
3.4. In Situ Infrared Experiments
4. Conclusions
Author Contributions
Funding
Data Availability Statement
Acknowledgments
Conflicts of Interest
Nomenclature
| position vector (cm) | |
| x | x coordinate (cm) |
| y | y coordinate (cm) |
| z | z coordinate (cm) |
| radial coordinate (cm) | |
| specific radiation intensity (Einstein cm−3 s−1 sr−1) | |
| asymmetry factor of the Henyey–Greentein’s phase function (dimensionless) | |
| local volumetric rate of photon absorption (Einstein cm−3 s−1) | |
| emission power (W) | |
| volume (cm3) | |
| weight (dimensionless) | |
| phase function (dimensionless) | |
| S | selectivity factor (dimensionless) |
| Greek Letters | |
| wavelength (nm) | |
| specific extinction coefficient (cm2 g−1) | |
| specific absorption coefficient (cm−1) | |
| specific scattering coefficient (cm−1) | |
| direction cosine (dimensionless) | |
| direction cosine (dimensionless) | |
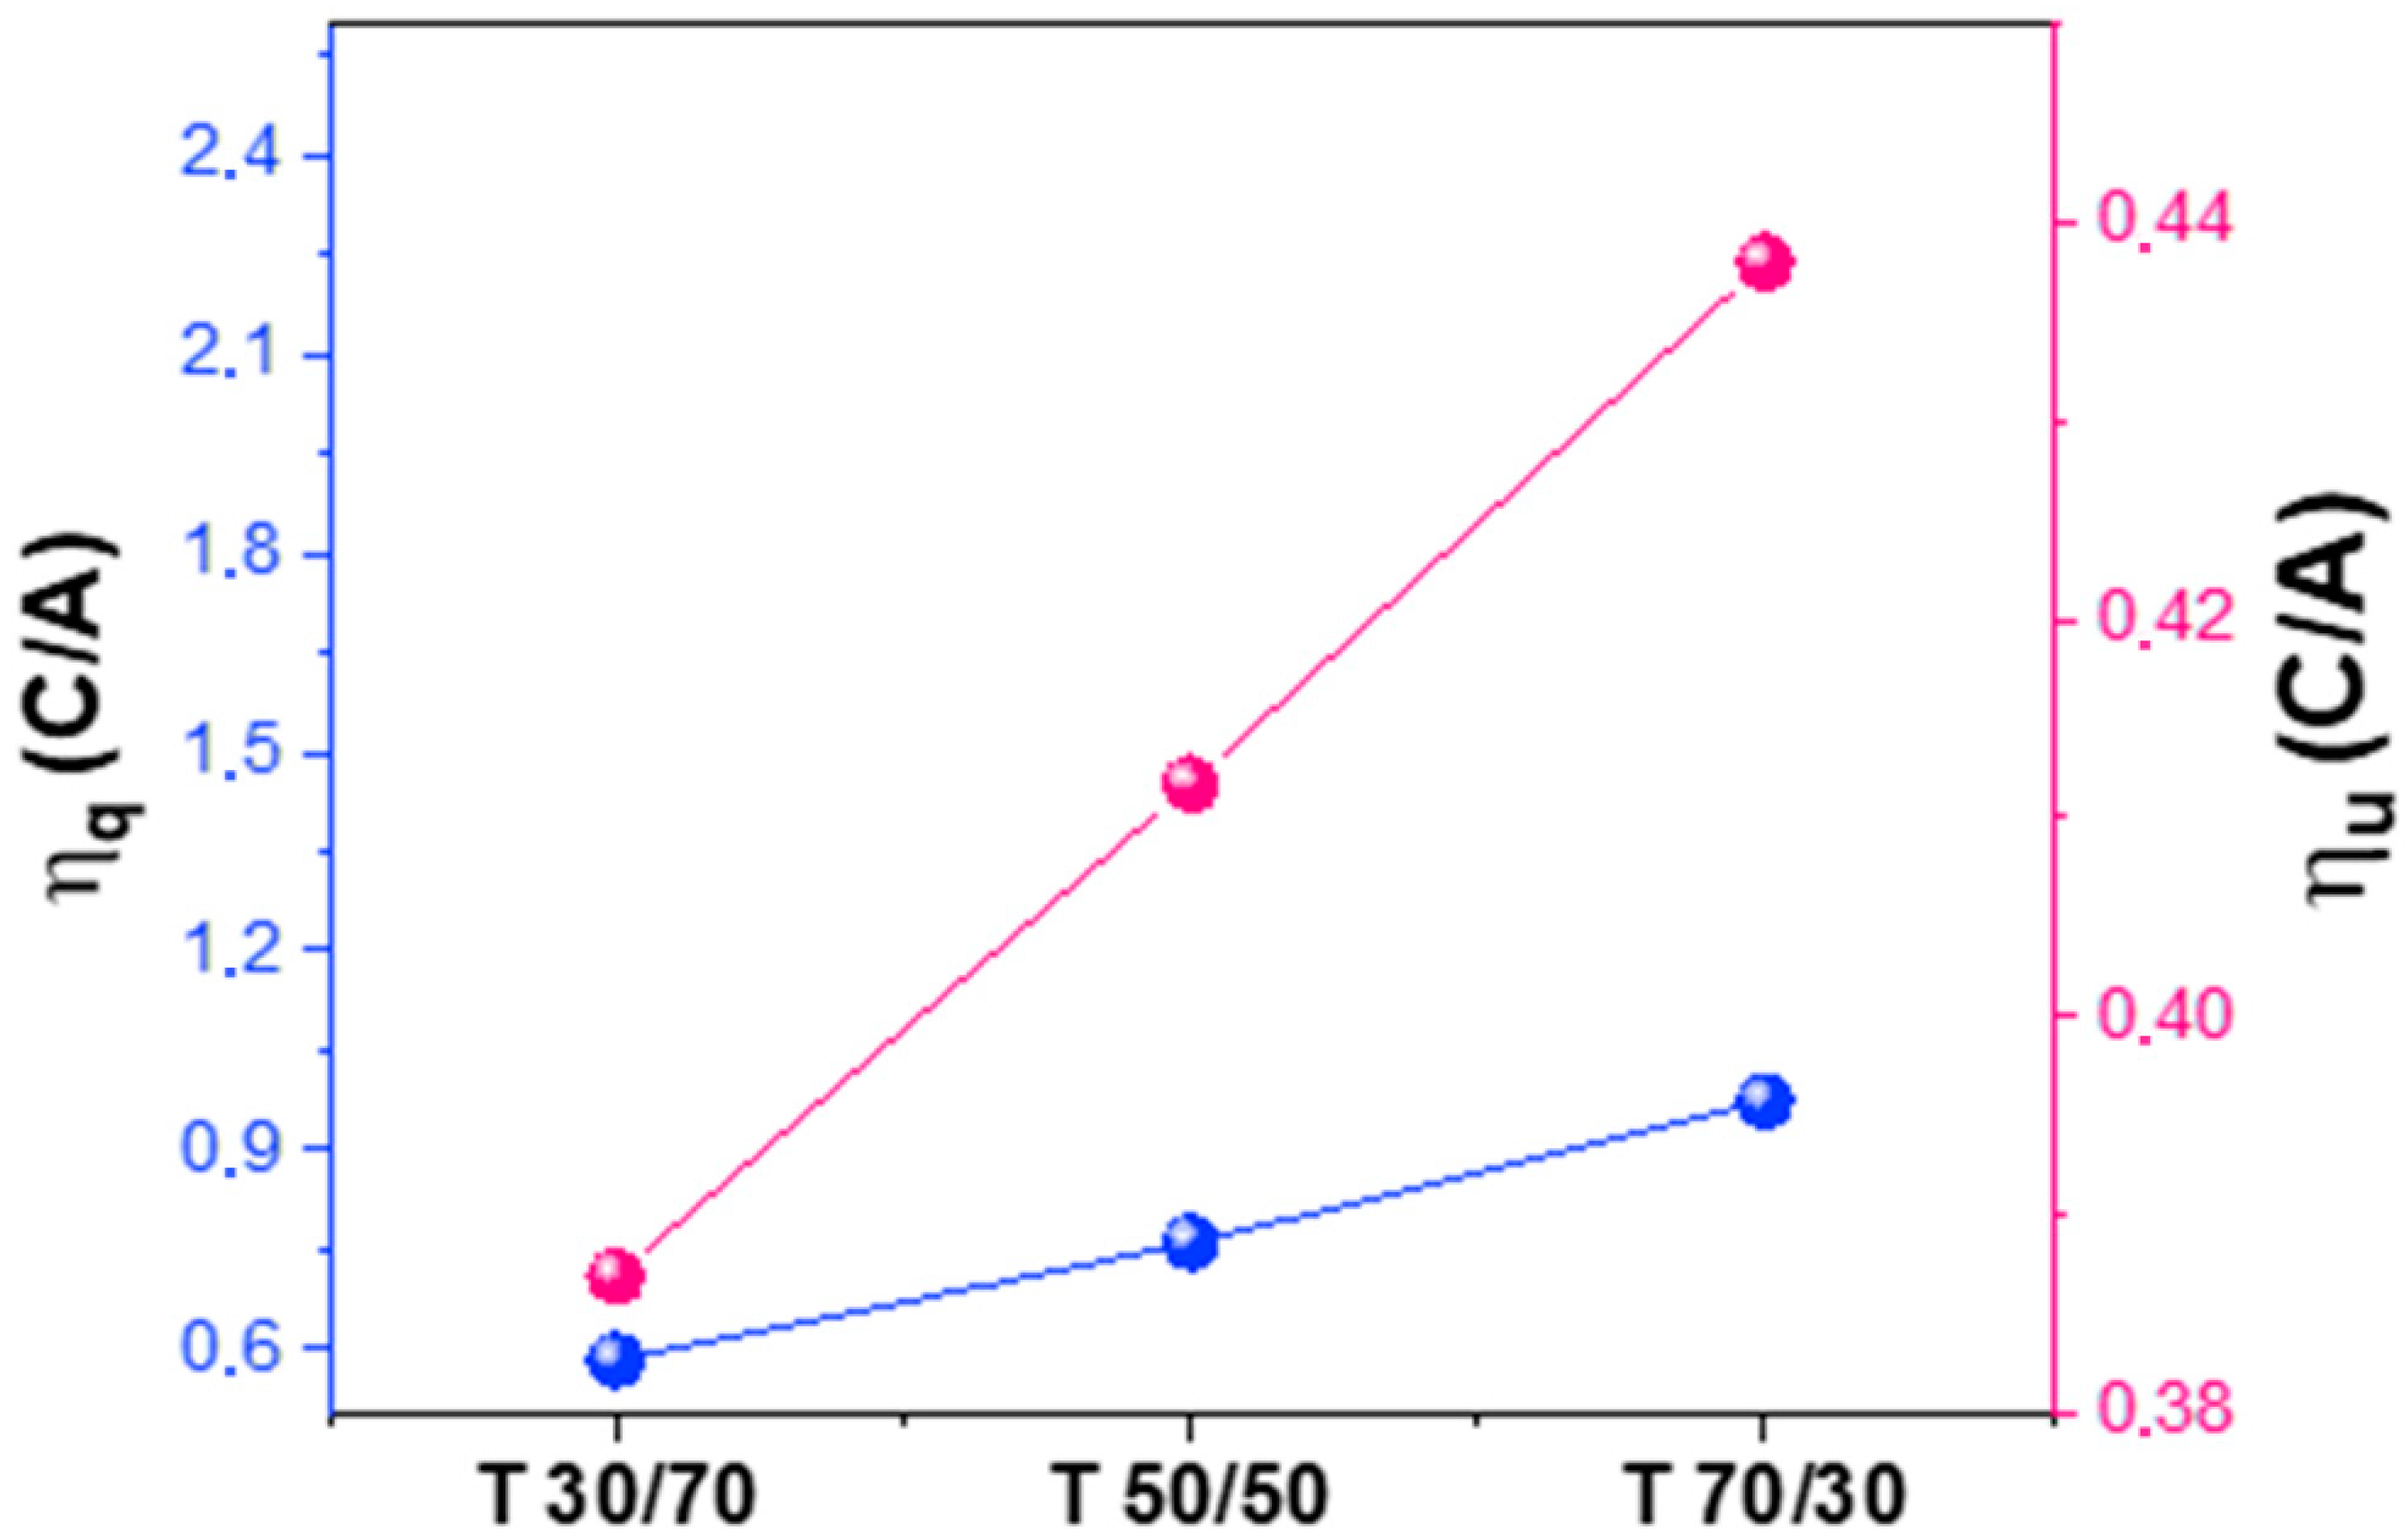
| quantum efficiency | |
| useful photon fraction | |
| Ω | solid angle (sr) |
| Ω | unit vector in the direction of radiation propagation |
| spherical coordinate (rad) | |
| spherical coordinate (rad) | |
| volumetric extinction coefficient (cm−1) | |
| volumetric absorption coefficient (cm−1) | |
| volumetric scattering coefficient (cm−1) | |
| effective area for angular fluxes (cm2) | |
| Subscripts | |
| denotes wavelength dependence | |
| m | demotes m position in a mesh |
| Special Symbols | |
| denotes vector | |
| average value over a defined space |
References
- Chen, X.; Shen, S.; Guo, L.; Mao, S.S. Semiconductor-based Photocatalytic Hydrogen Generation. Chem. Rev. 2010, 110, 6503–6570. [Google Scholar] [CrossRef] [PubMed]
- Do, H.H.; Nguyen, D.L.T.; Nguyen, X.C.; Le, T.-H.; Nguyen, T.P.; Trinh, Q.T.; Ahn, S.H.; Vo, D.-V.N.; Kim, S.Y.; Le, Q.V. Recent progress in TiO2-based photocatalysts for hydrogen evolution reaction: A review. Arab. J. Chem. 2020, 13, 3653–3671. [Google Scholar] [CrossRef]
- Fajrina, N.; Tahir, M. A critical review in strategies to improve photocatalytic water splitting towards hydrogen production. Int. J. Hydrogen Energy 2019, 44, 540–577. [Google Scholar] [CrossRef]
- Imizcoz, M.; Puga, A.V. Assessment of Photocatalytic Hydrogen Production from Biomass or Wastewaters Depending on the Metal Co-Catalyst and Its Deposition Method on TiO2. Catalysts 2019, 9, 584. [Google Scholar] [CrossRef] [Green Version]
- Braslavsky, S.E.; Braun, A.M.; Cassano, A.E.; Emeline, A.V.; Litter, M.I.; Palmisano, L.; Parmon, V.N.; Serpone, N. Glossary of terms used in photocatalysis and radiation catalysis (IUPAC recommendations 2011). Pure Appl. Chem. 2011, 83, 931–1014. [Google Scholar] [CrossRef] [Green Version]
- Kubacka, A.; Barba-Nieto, I.; Caudillo-Flores, U.; Fernández-García, M. Interpreting quantum efficiency for energy and environmental applications of photo-catalytic materials. Curr. Opin. Chem. Eng. 2021, 33, 100712. [Google Scholar] [CrossRef]
- Muñoz-Batista, M.J.; Kubacka, A.; Hungría, A.B.; Fernández-García, M. Heterogeneous photocatalysis: Light-matter interaction and chemical effects in quantum efficiency calculations. J. Catal. 2015, 330, 154–166. [Google Scholar] [CrossRef]
- Muñoz-Batista, M.J.; Caudillo-Flores, U.; Ung-Medina, F.; Chávez-Parga, M.d.C.; Cortés, J.A.; Kubacka, A.; Fernández-García, M. Gas phase 2-propanol degradation using titania photocatalysts: Study of the quantum efficiency. Appl. Catal. B Environ. 2017, 201, 400–410. [Google Scholar] [CrossRef]
- Fontelles-Carceller, O.; Muñoz-Batista, M.J.; Rodríguez-Castellón, E.; Conesa, J.C.; Fernández-García, M.; Kubacka, A. Measuring and interpreting quantum efficiency for hydrogen photo-production using Pt-titania catalysts. J. Catal. 2017, 347, 157–169. [Google Scholar] [CrossRef]
- Caudillo-Flores, U.; Muñoz-Batista, M.J.; Cortés, J.A.; Fernández-García, M.; Kubacka, A. UV and visible light driven H2 photo-production using Nb-doped TiO2: Comparing Pt and Pd co-catalysts. Mol. Catal. 2017, 437, 1–10. [Google Scholar] [CrossRef]
- Caudillo-Flores, U.; Muñoz-Batista, M.J.; Hungría, A.B.; Haro, M.L.; Fernández-García, M.; Kubacka, A. Toluene and styrene photo-oxidation quantum efficiency: Comparison between doped and composite tungsten-containing anatase-based catalysts. Appl. Catal. B Environ. 2019, 245, 49–61. [Google Scholar] [CrossRef]
- Caudillo-Flores, U.; Avilés-García, O.; Alonso-Núñez, G.; Kubacka, A.; Fernández-García, M. Assessing quantitatively charge carrier fate in 4-chlorophenol photocatalytic degradation using globular titania catalysts: Implications in quantum efficiency calculation. J. Environ. Chem. Eng. 2021, 9, 106074. [Google Scholar] [CrossRef]
- Fontelles-Carceller, O.; Muñoz-Batista, M.J.; Conesa, J.C.; Fernández-García, M.; Kubacka, A. UV and visible hydrogen photo-production using Pt promoted Nb-doped TiO2 photo-catalysts: Interpreting quantum efficiency. Appl. Catal. B Environ. 2017, 216, 133–145. [Google Scholar] [CrossRef]
- Guayaquil-Sosa, J.F.; Serrano-Rosales, B.; Valadés-Pelayo, P.J.; Lasa, H.d. Photocatalytic hydrogen production using mesoporous TiO2 doped with Pt. Appl. Catal. B Environ. 2017, 211, 337–348. [Google Scholar] [CrossRef]
- Kumaravel, V.; Imam, M.; Badreldin, A.; Chava, R.; Do, J.; Kang, M.; Abdel-Wahab, A. Photocatalytic Hydrogen Production: Role of Sacrificial Reagents on the Activity of Oxide, Carbon, and Sulfide Catalysts. Catalysts 2019, 9, 276. [Google Scholar] [CrossRef] [Green Version]
- Chiarello, G.L.; Ferri, D.; Selli, E. Effect of the CH3OH/H2O ratio on the mechanism of the gas-phase photocatalytic reforming of methanol on noble metal-modified TiO2. J. Catal. 2011, 280, 168–177. [Google Scholar] [CrossRef]
- Caudillo-Flores, U.; Muñoz-Batista, M.J.; Fernández-García, M.; Kubacka, A. Bimetallic Pt-Pd co-catalyst Nb-doped TiO2 materials for H2 photo-production under UV and Visible light illumination. Appl. Catal. B Environ. 2018, 238, 533–545. [Google Scholar] [CrossRef]
- Xie, S.; Shen, Z.; Deng, J.; Guo, P.; Zhang, Q.; Zhang, H.; Ma, C.; Jiang, Z.; Cheng, J.; Deng, D.; et al. Visible light-driven C−H activation and C–C coupling of methanol into ethylene glycol. Nat. Commun. 2018, 9, 1181. [Google Scholar] [CrossRef]
- Zhang, H.; Xie, S.; Hu, J.; Wu, X.; Zhang, Q.; Cheng, J.; Wang, Y. C–H activations of methanol and ethanol and C–C couplings into diols by zinc–indium–sulfide under visible light. Chem. Commun. 2020, 56, 1776–1779. [Google Scholar] [CrossRef]
- Rusinque, B.; Escobedo, S.; Lasa, H.d. Hydrogen Production via Pd-TiO2 Photocatalytic Water Splitting under Near-UV and Visible Light: Analysis of the Reaction Mechanism. Catalysts 2021, 11, 405. [Google Scholar] [CrossRef]
- Barba-Nieto, I.; Christoforidis, K.C.; Fernández-García, M.; Kubacka, A. Promoting H2 photoproduction of TiO2-based materials by surface decoration with Pt nanoparticles and SnS2 nanoplatelets. Appl. Catal. B Environ. 2020, 277, 119246. [Google Scholar] [CrossRef]
- Satuf, M.L.; Brandi, R.J.; Cassano, A.E.; Alfano, O.M. Experimental method to evaluate the optical properties of aqueous titanium dioxide suspensions. Ind. Eng. Chem. Res. 2005, 44, 6643–6649. [Google Scholar] [CrossRef]
- Du, Y.; Liu, M.; Guo, L. Numerical investigation on the optical properties of TiO2 photocatalyst suspension by light scattering model of particulate aggregates. J. Photonics Energy 2021, 11, 016501. [Google Scholar] [CrossRef]
- Song, D.; Hatami, M.; Wang, Y.; Jing, D.; Yang, Y. Prediction of hydrodynamic and optical properties of TiO2/water suspension considering particle size distribution. Int. J. Heat Mass Transf. 2016, 92, 864–876. [Google Scholar] [CrossRef]
- Muñoz-Batista, M.J.; Ballari, M.M.; Kubacka, A.; Alfano, O.M.; Fernández-García, M. Braiding kinetics and spectroscopy in photo-catalysis: The spectro-kinetic approach. Chem. Soc. Rev. 2019, 48, 637–682. [Google Scholar] [CrossRef]
- Platero, F.; López-Martín, A.; Caballero, A.; Colón, G. Mechanistic Considerations on the H2 Production by Methanol Thermal-assisted Photocatalytic Reforming over Cu/TiO2 Catalyst. ChemCatChem 2021, 13, 3878–3888. [Google Scholar] [CrossRef]
- Berto, T.F.; Sanwald, K.E.; Eisenreich, W.; Gutiérrez, O.Y.; Lercher, J.A. Photoreforming of ethylene glycol over Rh/TiO2 and Rh/GaN:ZnO. J. Catal. 2016, 338, 68–81. [Google Scholar] [CrossRef]
- Ouyang, W.; Muñoz-Batista, M.J.; Kubacka, A.; Luque, R.; Fernández-García, M. Enhancing photocatalytic performance of TiO2 in H2 evolution via Ru co-catalyst deposition. Appl. Catal. B Environ. 2018, 238, 434–443. [Google Scholar] [CrossRef]
- Yamakata, A.; Ishibashi, T.; Onishi, H. Electron- and Hole-Capture Reactions on Pt/TiO2 Photocatalyst Exposed to Methanol Vapor Studied with Time-Resolved Infrared Absorption Spectroscopy. J. Phys. Chem. B 2002, 106, 9122–9125. [Google Scholar] [CrossRef]
- Halasi, G.; Schubert, G.; Solymosi, F. Comparative study on the photocatalytic decomposition of methanol on TiO2 modified by N and promoted by metals. J. Catal. 2012, 294, 199–206. [Google Scholar] [CrossRef] [Green Version]
- Liu, X.; Bao, C.; Zhu, Z.; Zheng, H.; Song, C.; Xu, Q. Thermo-photo synergic effect on methanol steam reforming over mesoporous Cu/TiO2–CeO2 catalysts. Int. J. Hydrogen Energy 2021, 46, 26741–26756. [Google Scholar] [CrossRef]
- Walenta, C.A.; Courtois, C.; Kollmannsberger, S.L.; Eder, M.; Tschurl, M.; Heiz, U. Surface Species in Photocatalytic Methanol Reforming on Pt/TiO2 (110): Learning from Surface Science Experiments for Catalytically Relevant Conditions. ACS Catal. 2020, 10, 4080–4091. [Google Scholar] [CrossRef]
- Al-Azri, Z.H.N.; Chen, W.-T.; Chan, A.; Jovic, V.; Ina, T.; Idriss, H.; Waterhouse, G.I.N. The roles of metal co-catalysts and reaction media in photocatalytic hydrogen production: Performance evaluation of M/TiO2 photocatalysts (M = Pd, Pt, Au) in different alcohol–water mixtures. J. Catal. 2015, 329, 355–367. [Google Scholar] [CrossRef]
- Zhao, Y.; Li, Y.; Sun, L. Recent advances in photocatalytic decomposition of water and pollutants for sustainable application. Chemosphere 2021, 276, 130201. [Google Scholar] [CrossRef]
- Estahbanati, M.R.K.; Babin, A.; Feilizadeh, M.; Nayernia, Z.; Mahinpey, N.; Iliuta, M.C. Photocatalytic conversion of alcohols to hydrogen and carbon-containing products: A cleaner alcohol valorization approach. J. Clean. Prod. 2021, 318, 128546. [Google Scholar] [CrossRef]
- Zhao, J.; Shi, R.; Li, Z.; Zhou, C.; Zhang, T. How to make use of methanol in green catalytic hydrogen production? Nano Sel. 2020, 1, 12–29. [Google Scholar] [CrossRef]
- Huang, H.; Feng, J.; Zhang, S.; Zhang, H.; Wang, X.; Yu, T.; Chen, C.; Yi, Z.; Ye, J.; Li, Z.; et al. Molecular-level understanding of the deactivation pathways during methanol photo-reforming on Pt-decorated TiO2. Appl. Catal. B Environ. 2020, 272, 118980. [Google Scholar] [CrossRef]
- Wu, X.; Xie, S.; Zhang, H.; Zhang, Q.; Sels, B.F.; Wang, Y. Metal Sulfide Photocatalysts for Lignocellulose Valorization. Adv. Mater. 2021, 33, 2007129. [Google Scholar] [CrossRef]
- Ismael, M. Latest progress on the key operating parameters affecting the photocatalytic activity of TiO2-based photocatalysts for hydrogen fuel production: A comprehensive review. Fuel 2021, 303, 121207. [Google Scholar] [CrossRef]
- Siegel, R.; Pinar, M.; Howell, J.R. Thermal Radiation Heat Transfer; CRC Press: Boca Raton, FL, USA, 2015; ISBN 978-1466593268. [Google Scholar]
- Romero, R.L.; Alfano, O.M.; Cassano, A.E. Cylindrical Photocatalytic Reactors. Radiation Absorption and Scattering Effects Produced by Suspended Fine Particles in an Annular Space. Ind. Eng. Chem. Res. 1997, 36, 3094–3109. [Google Scholar] [CrossRef]
- Duderstadt, J.J.; Martin, W.R. Transport Theory; Whiley: New York, NY, USA, 1979; ISBN 047104492X/9780471044925. [Google Scholar]
- Marugán, J.; Grieken, R.V.; Cassano, A.; Alfano, O. Intrinsic kinetic modeling with explicit radiation absorption effects of the photocatalytic oxidation of cyanide with TiO2 and silica-supported TiO2 suspensions. Appl. Catal. B Environ. 2008, 85, 48–60. [Google Scholar] [CrossRef]


| Molecule | Balance Equation | |
|---|---|---|
| Formic acid | CH3OH + H2O + 4h+ + 4e− → CH2O2 + 2 H2 | (18) |
| Methyl formate | 2 CH3OH + 4h+ + 4e− → C2H4O2 + 2 H2 | (19) |
| Ethylene glycol | 2 CH3OH + 2h+ + 2e− → C2H6O2 + H2 | (20) |
| Acetaldehyde | 2 CH3OH + 2h+ + 2e− → CH3CHO + H2O + H2 | (21) |
| Acetic acid | 2 CH3OH + 4h+ + 4e− → CH3COOH + 2 H2 | (22) |
| 2-methoxyacetaldehyde | 3 CH3OH + 4h+ + 4e− → C3H6O2 + H2O + 2 H2 | (23) |
| Carbon dioxide | CH3OH + H2O + 6h+ + 6e− → CO2 + 3 H2 | (24) |
Publisher’s Note: MDPI stays neutral with regard to jurisdictional claims in published maps and institutional affiliations. |
© 2022 by the authors. Licensee MDPI, Basel, Switzerland. This article is an open access article distributed under the terms and conditions of the Creative Commons Attribution (CC BY) license (https://creativecommons.org/licenses/by/4.0/).
Share and Cite
Barba-Nieto, I.; Colón, G.; Kubacka, A.; Fernández-García, M. H2 Photoproduction Efficiency: Implications of the Reaction Mechanism as a Function of the Methanol/Water Mixture. Catalysts 2022, 12, 402. https://0-doi-org.brum.beds.ac.uk/10.3390/catal12040402
Barba-Nieto I, Colón G, Kubacka A, Fernández-García M. H2 Photoproduction Efficiency: Implications of the Reaction Mechanism as a Function of the Methanol/Water Mixture. Catalysts. 2022; 12(4):402. https://0-doi-org.brum.beds.ac.uk/10.3390/catal12040402
Chicago/Turabian StyleBarba-Nieto, Irene, Gerardo Colón, Anna Kubacka, and Marcos Fernández-García. 2022. "H2 Photoproduction Efficiency: Implications of the Reaction Mechanism as a Function of the Methanol/Water Mixture" Catalysts 12, no. 4: 402. https://0-doi-org.brum.beds.ac.uk/10.3390/catal12040402