

Evaluation of ·OH Production Potential of Particulate Matter (PM2.5) Collected on TiO2-Supporting Quartz Filters

1
Graduate School of Earth and Environmental Sciences, Tokai University, Hiratsuka 259-1292, Japan
2
Graduate School of Science, Tokai University, Hiratsuka 259-1292, Japan
*
Author to whom correspondence should be addressed.
Catalysts 2022, 12(9), 1016; https://0-doi-org.brum.beds.ac.uk/10.3390/catal12091016
Submission received: 9 August 2022
/
Revised: 1 September 2022
/
Accepted: 5 September 2022
/
Published: 7 September 2022
(This article belongs to the Special Issue Advanced Catalytic Technology for Environmental Pollution Control and Energy Recovery)
Abstract
:Oxidative stress induced by fine particulate matter 2.5 (PM2.5) is a potential cause of adverse health effects owing to the production of reactive oxygen species (ROS). Air filtration is a key technology for preventing exposure to particulate contaminations; however, particulate matter trapped by filters has the potential risk of human contact with condensed PM2.5. Thus, this study aims to reduce the hydroxyl radical (·OH) production potential of PM2.5 collected on such TiO2-supporting quartz filters. The ·OH production potential was evaluated for PM2.5, which was collected in Kanagawa, Japan, using a terephthalate assay coupled with flow injection analysis. Although the PM2.5 levels at the sampling site were not severe, the PM2.5 samples exhibited ·OH production potential, which was mostly attributed to organic aerosols. The effect was verified using a TiO2-supporting quartz filter for the collection and subsequent degradation of PM2.5. The ·OH production potential was significantly reduced from 0.58 ± 0.40 pmol/(min m3) to 0.22 ± 0.13 pmol/(min m3) through ultraviolet irradiation for 24 h. This suggests that the photocatalytic reaction of the TiO2 filter is effective in reducing the ·OH production potential of PM2.5.
1. Introduction
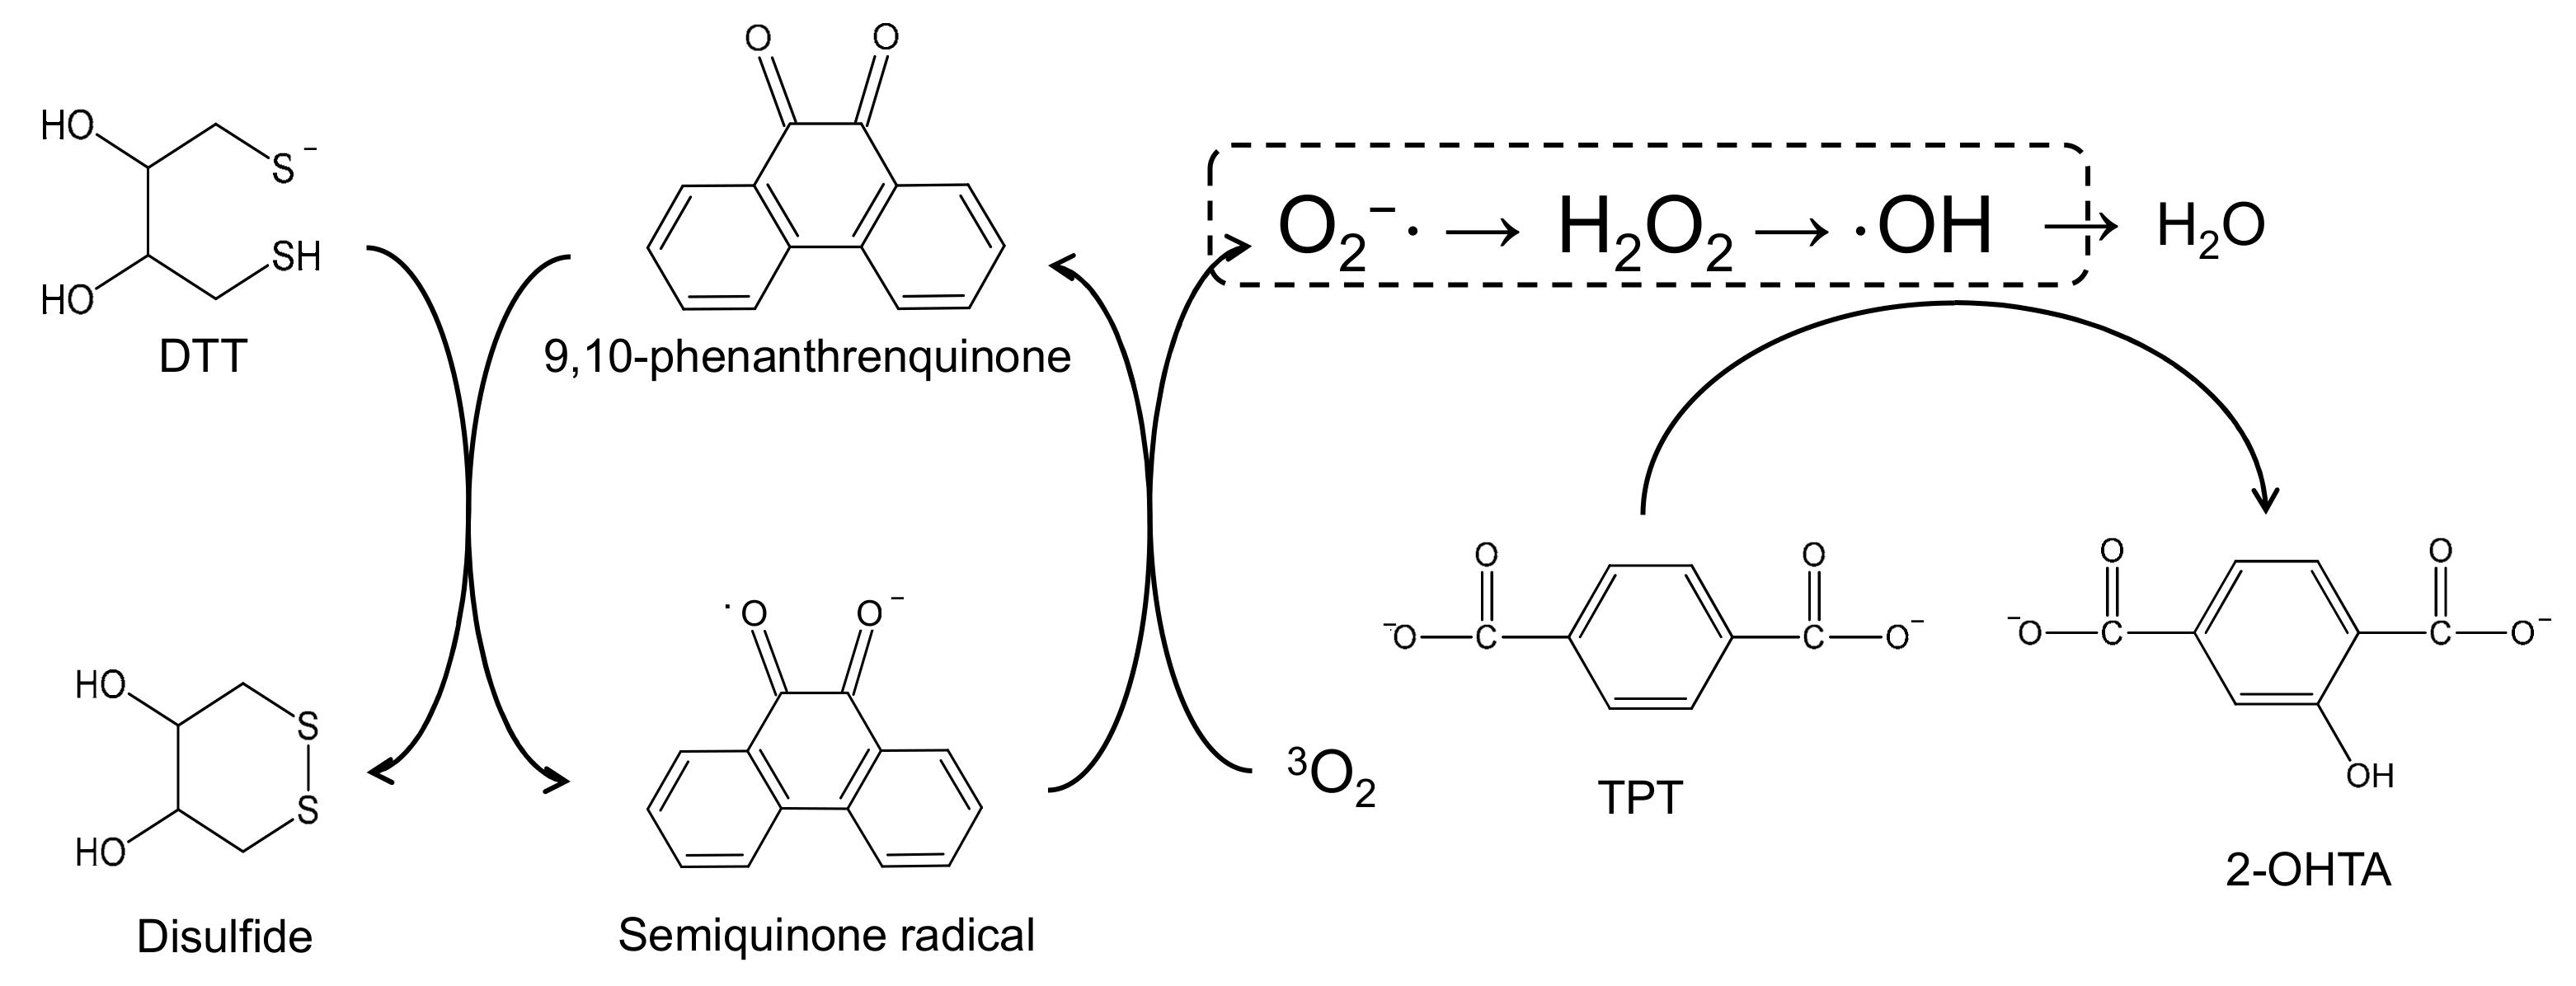
Various epidemiological studies on pulmonary and cardiovascular diseases have reported increased mortality associated with exposure to particulate matter 2.5 (PM2.5) [1,2,3,4,5,6,7]. The toxicity of PM2.5 is presumably due to the oxidative stress induced by reactive oxygen species (ROS), such as superoxide anion radicals (O2−·), hydrogen peroxide (H2O2), and hydroxyl radicals (·OH). ROS are a group of oxygen-containing free radicals and reactive molecules with strong oxidizing abilities in the human body. Generally, redox-active substances such as quinoid polycyclic aromatic hydrocarbons (PAH quinones) promote ROS production when taken into cells [8,9,10]. Excessive oxidative stress induced by such redox-active substances may cause DNA damage and protein oxidation, and it is considered one of the factors that causes various disorders in the human body, including cancer, diabetes, and aging [11,12,13]. Several epidemiological studies have evaluated the ROS production potential of PM2.5 samples in vitro, and the dithiothreitol (DTT) assay has been widely used to evaluate the oxidative potential of O2−· [14,15,16]. As illustrated in Figure 1, when certain redox-active substances in a PM2.5 sample are applied to DTT, O2−· is formed from triplet oxygen (3O2) via the redox cycle, and DTT is converted to its disulfide form. Figure 1 shows 9,10-phenanthrenequinone as an example of PAH quinones. The linear rate of DTT loss is used as a measure of the O2−· production potential of a PM2.5 sample.
Air filtration used for filtration masks and air-cleaning devices is a key technology for preventing personal exposure to particulate contamination. However, owing to their potentially toxic constituents, the particulate matter trapped on the surface of filters can still be hazardous if not subsequently treated. Therefore, there is a potential risk of human contact with condensed PM2.5 when replacing or cleaning filter units [17,18,19]. Photocatalysis has been receiving considerable attention worldwide for its diverse potential applications to solve the global energy crisis and environmental problems in a sustainable and ecologically friendly manner [20,21,22]. Titanium dioxide (TiO2) is by far the most studied photocatalytic material for the decomposition of organic pollutants [23,24], removal of heavy metal ions [25,26], and production of hydrogen [27]. In our previous study, a TiO2-supporting quartz filter (TiO2 filter) was developed for the collection of PM2.5 and the subsequent photo-induced degradation of carbonaceous components in PM2.5 [28,29,30]. The carbonaceous components in PM2.5 were successfully converted to CO2 by irradiating ultraviolet (UV) rays on the surface of PM2.5 collected on the TiO2 filter [28]. The TiO2 filter also degraded the polycyclic aromatic hydrocarbons in PM2.5, which are potential precursors of PAH quinones [29] and reduced the O2−·production potential of PM2.5 [30].
Once O2−· is produced, it triggers a rapid cascade of events generating other ROS and eventually terminating them during the formation of H2O (Figure 1). The DTT assay does not capture the most important step of the ROS cascade, that is, the generation of ·OH [31], which is the most damaging ROS to nearly all types of macromolecules. Although ·OH is produced from O2−·, no significant correlation between the O2−· production potential of PM2.5 evaluated by the DTT assay and the ·OH production potential of PM2.5 evaluated by disodium terephthalate (TPT) assay has been reported [31]. This could be due to the contribution of other co-existing species to the ROS cascade. When TPT is added to the reaction vial to scavenge the ·OH generated in the DTT assay, it forms 2-hydroxyterephthalic acid (2-OHTA) as a fluorescent probe (Figure 1). Since the formation of 2-OHTA is proportional to the generation of ·OH, the linear increase in 2-OHTA can be used as a measure of the ·OH production potential of PM2.5 samples [31,32,33]. In this study, we aimed to investigate the effect of a photocatalytic reaction on the ·OH production potential of PM2.5 collected on a TiO2 filter, using the TPT assay coupled with flow injection analysis (FIA). The result showed the photocatalytic reaction of the TiO2 filter is effective in reducing the ·OH production potential of PM2.5 and will be useful for controlling environmental pollution caused by PM2.5.
Various abbreviations frequently used in the manuscript are listed in Table 1 along with their full forms for quick reference.
2. Results and Discussion
2.1. ·OH Production Potential of PM2.5
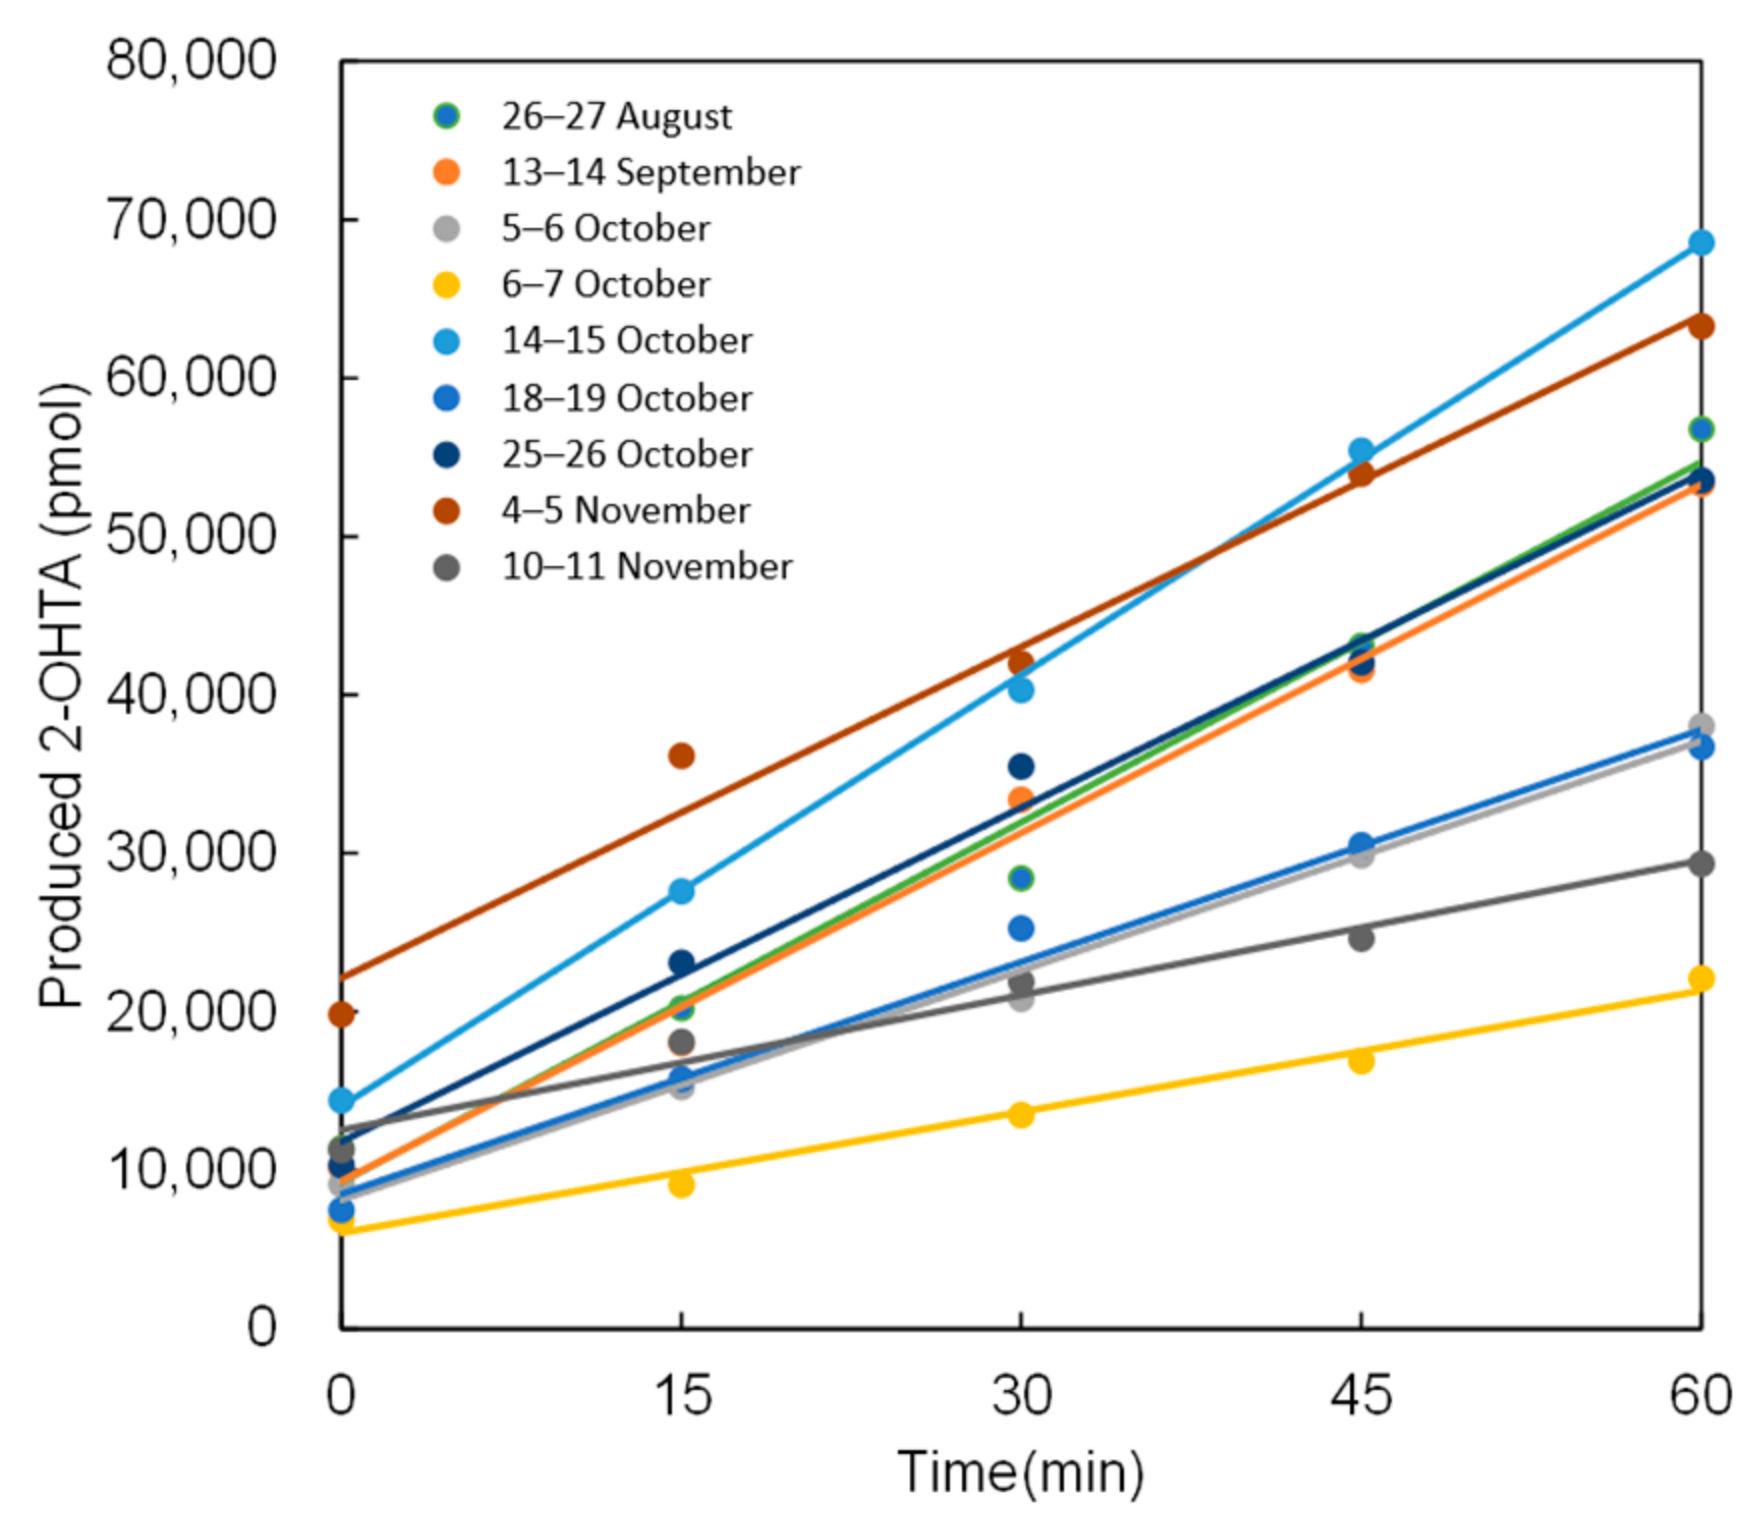
First, the ·OH production potential was evaluated in PM2.5 samples collected for 24 h in Kanagawa, Japan. The mean atmospheric concentration of PM2.5 was 14 ± 6.9 µg/m3 (n = 9), which was less than the environmental quality standard of Japan for PM2.5 (35 µg/m3). Therefore, air pollution due to PM2.5 at the study site was not severe. Subsequently, the TPT assay with FIA was used on these samples. Figure 2 shows the changes in the amount of produced 2-OHTA (pmol) for the PM2.5 samples over time. Since the formation rate of 2-OHTA is proportional to the generation of ·OH, the ·OH production potential can be obtained from the slope of the linear fitting through the points in Figure 2. For all samples, the produced 2-OHTA increased linearly with time (R2 ≥ 0.98). The slope was then normalized by the total sampling volume (m3) of air for easy comparison with other PM2.5 samples collected under different sampling conditions. The ·OH production potential of the Kanagawa samples ranged from 0.35 to 1.3 pmol/(min m3) with an average of 0.82 ± 0.29 pmol/(min m3). As a reference, the ·OH production potential was compared with previously reported values. This level of ·OH production potential is greater than that observed in Illinois, United States (<0.25 pmol/(min m3)) [31]; slightly less than that observed in Hong Kong, China (2.1 ± 1.4 pmol/(min m3)) [32]; and significantly less than that in Beijing, China (64 ± 91 pmol/(min m3)) [33].
2.2. Attribution of ·OH Production Potential
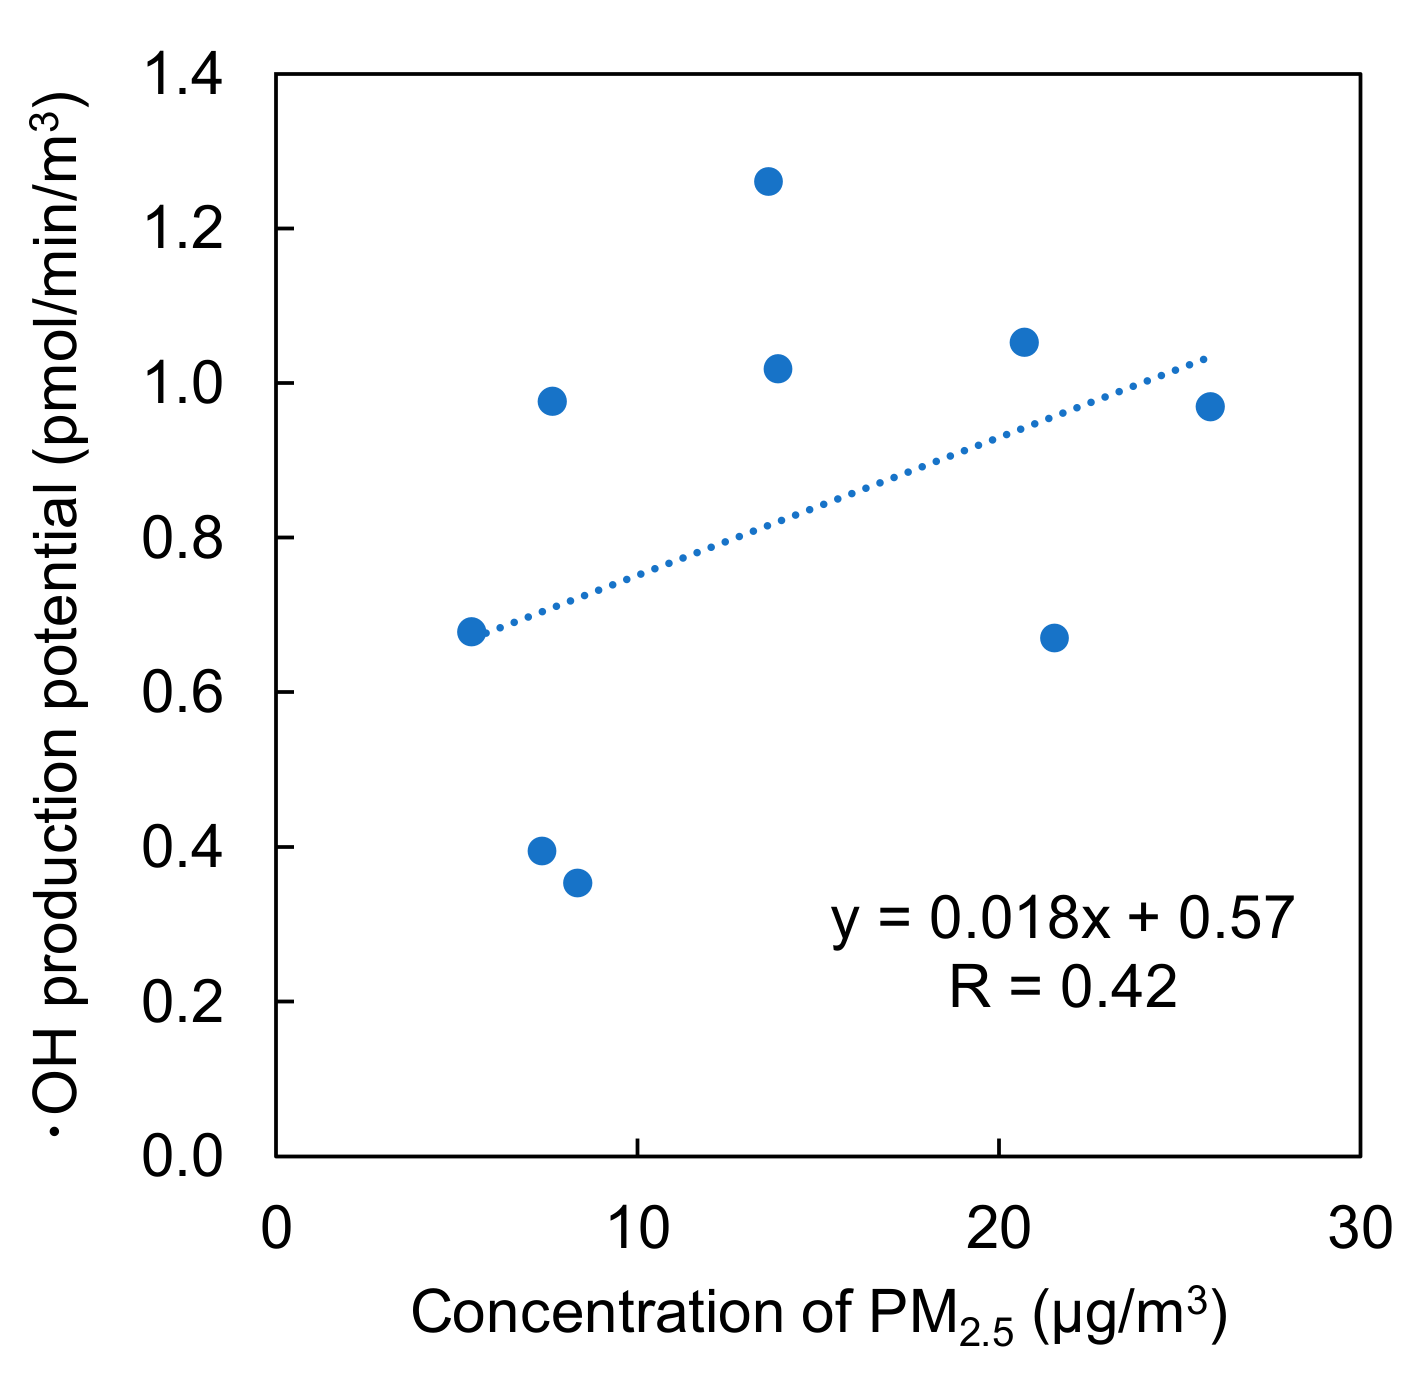
Figure 3 shows the scattered diagram of the ·OH production potentials and PM2.5 concentrations in Kanagawa. The diagram suggests no apparent relationship between the two variables (Pearson’s correlation coefficient, r = 0.42, p = 0.26); thus, the ·OH production potential does not depend on the level of PM2.5. We then focused on the carbonaceous components of PM2.5, which mainly consist of organic carbon (OC) and elemental carbon (EC) [34,35]. The constituents of OC mostly consist of organic compounds, including PAH quinones, which volatilize under heating in an inert atmosphere. On the other hand, EC contains graphitic carbon, which can only be converted into gas by oxidation at high temperatures. Thus, OC/EC analysis was performed for nine PM2.5. The results showed that the mean OC and EC concentrations were 2.6 ± 0.93 µg/m3 and 0.39 ± 0.18 µg/m3, respectively. Cheng et al. [32] reported that the ·OH production potential of PM2.5 in Hong Kong significantly correlates with OC concentrations but not with EC concentrations. In contrast, the ·OH production potential in this study showed significant correlations with both OC (r = 0.68, p < 0.05) and EC (r = 0.69, p < 0.05) concentrations. However, the mean OC concentration was seven times higher than that of EC. This indicates that the ·OH production potential of PM2.5 at the Kanagawa site was mostly attributed to organic aerosols.
Applying the interagency monitoring of protected visual environments (IMPROVE) protocol as described in Section 3.3, OC and EC were further fractioned into seven categories: OC1, OC2, OC3, OC4, EC1, EC2, and EC3. Table 2 shows atmospheric concentration and Pearson’s correlation coefficient between the concentration and ·OH production potential of each fraction in PM2.5. The average weight percentage of total carbon (OC + EC) in these fractions was in the following order: EC1 (40%) > OC2 (23%) ≒ OC3 (22%) > EC2 (5.7%) ≒ OC4 (5.4%) > OC1 (2.1%) ≒ EC3 (0.94%). According to Misawa et al. [28], the photocatalysis of TiO2 filters under UV irradiation (365 nm, 1.1 mW/cm2) is effective for the degradation of OC1, OC2, OC3, OC4, and EC1. Moreover, the irradiation is inert for EC2 and EC3. The fractions OC3, OC4, and EC1, accounting for 68% of the total carbon content, have significant correlation coefficients (Table 2); thus, the ·OH production potential of PM2.5 can be attributed to these fractions. Therefore, under UV irradiation, the TiO2 filter was expected to reduce the ·OH production potential of PM2.5 collected at the Kanagawa site.
2.3. Reducing the ·OH Production Potential of PM2.5 through UV Irradiation on the TiO2 Filter
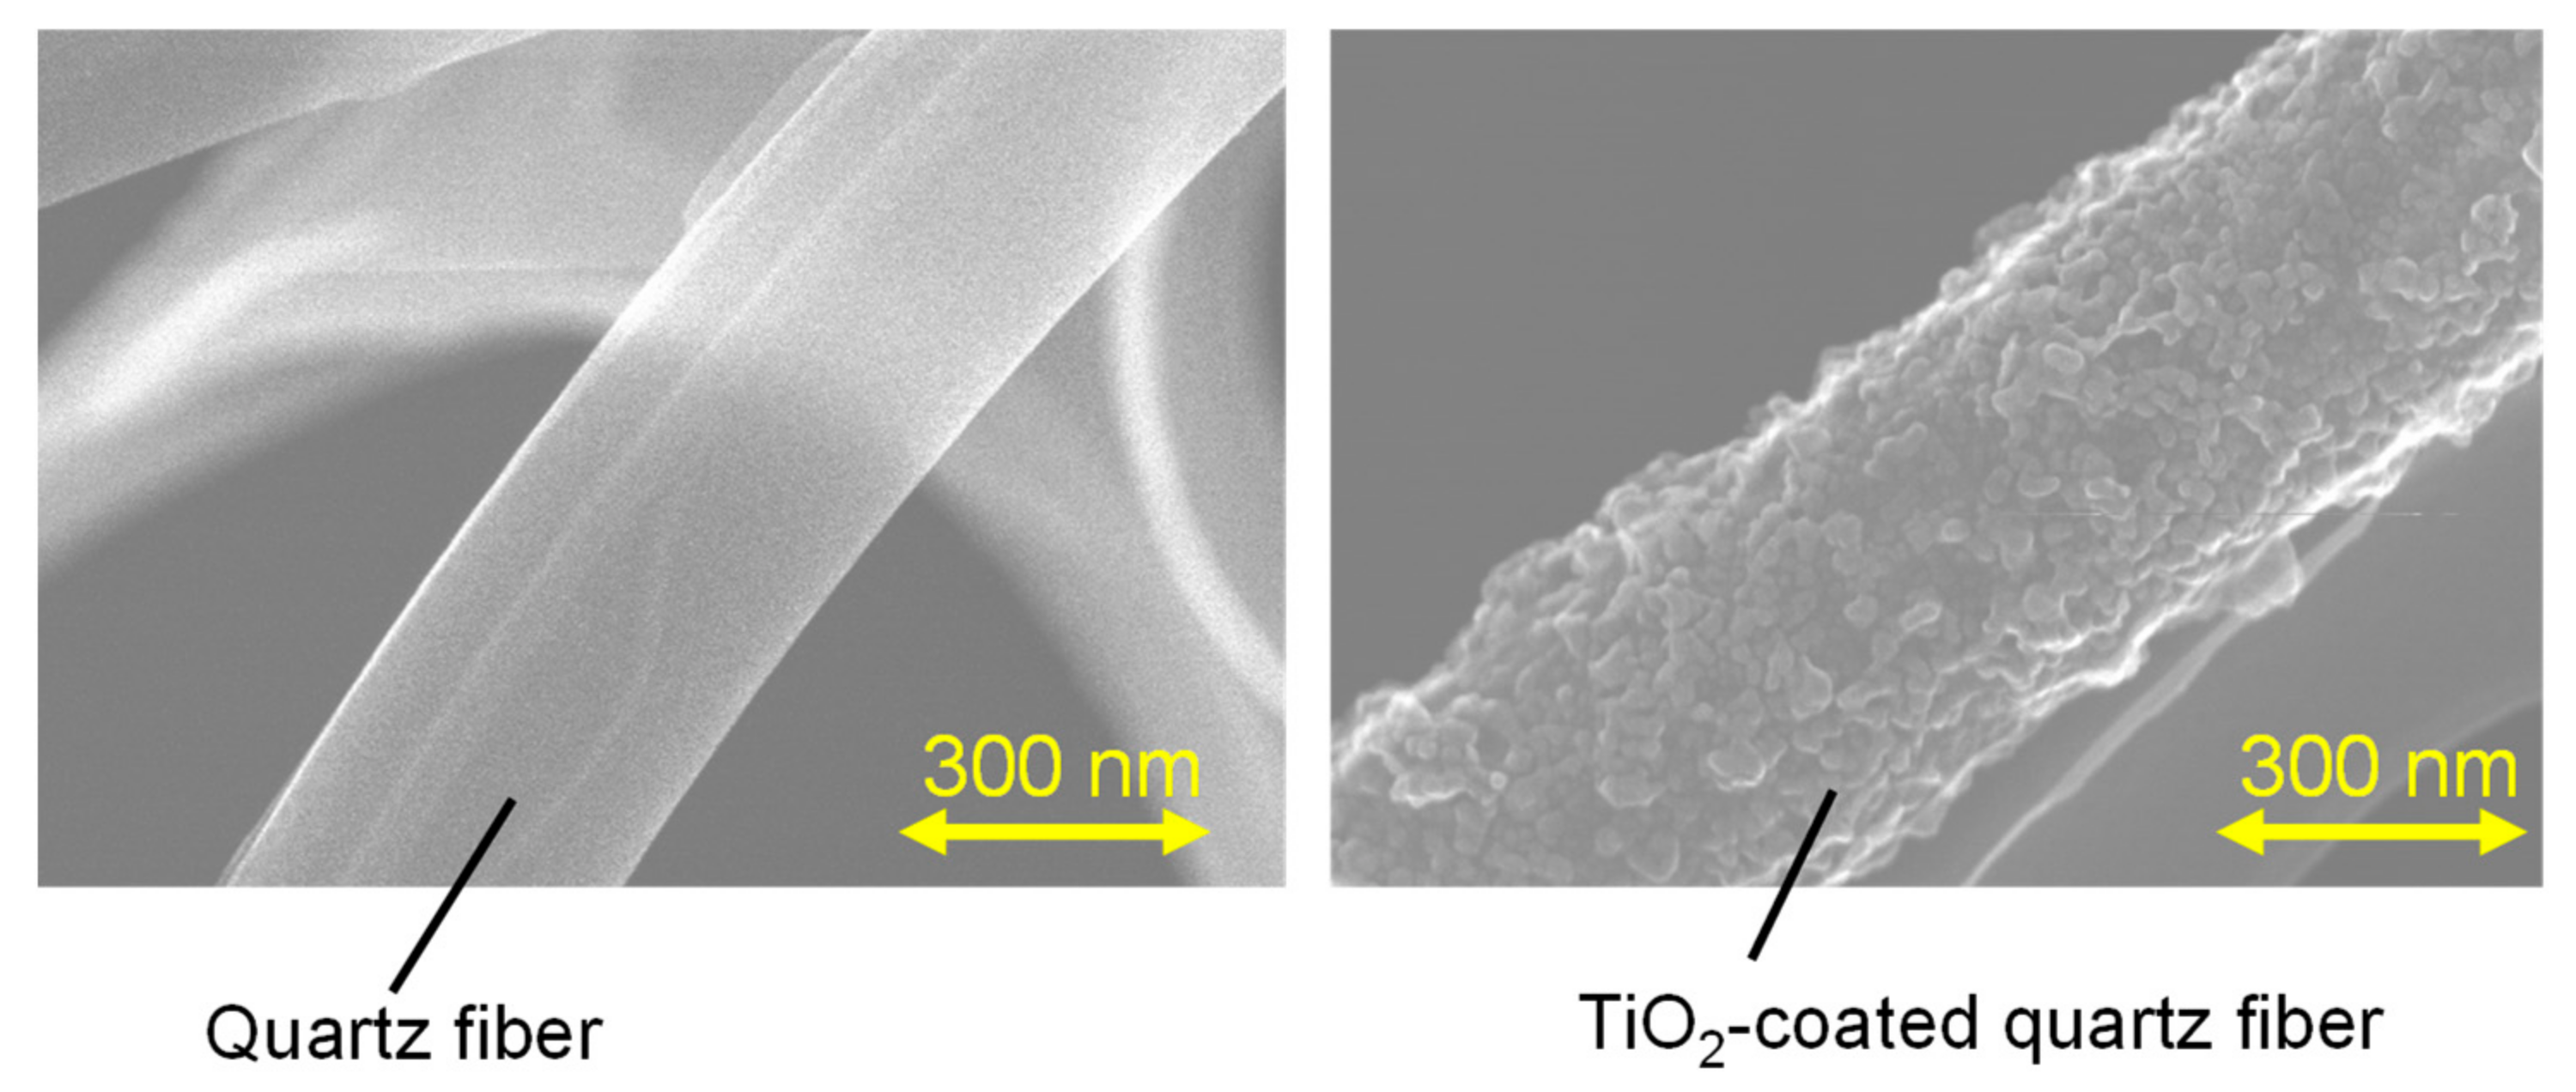
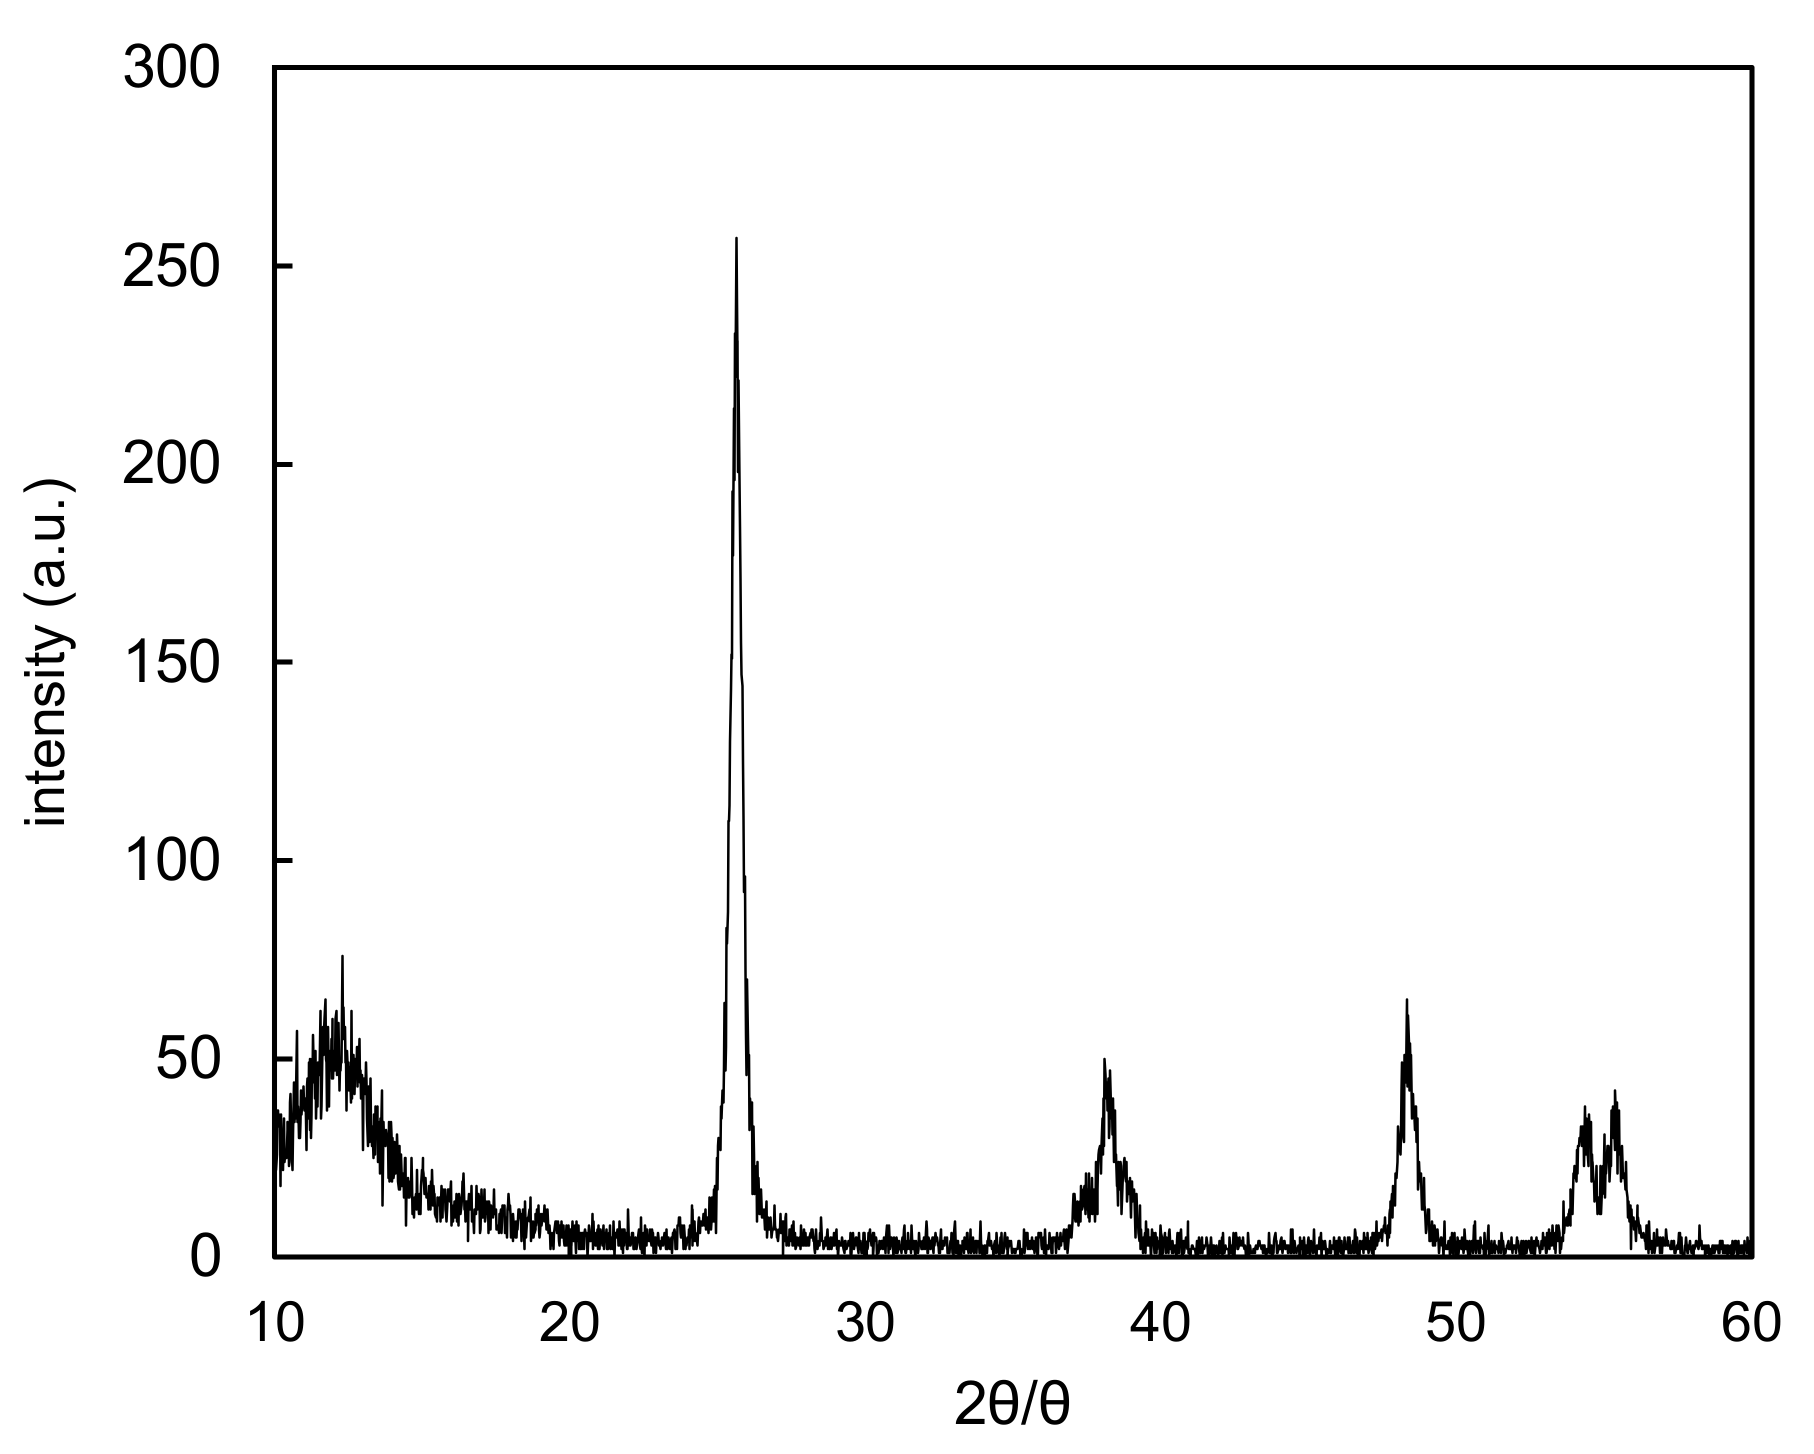
Figure 4 shows images of the quartz filter before and after depositing TiO2, observed by a field-emission scanning electron microscope (FE-SEM). The TiO2 layer was formed on the surface of the quartz fiber without constant morphology, and its crystalline structure was identified as anatase using an X-ray diffraction (XRD) analysis as shown in Figure 5. The amount of TiO2 supported on the quartz filter was 0.049 ± 0.0011 g (n = 5). Simultaneous sampling of PM2.5 was conducted using two co-located high-volume air samplers with TiO2 and quartz (non-TiO2 coated) filters. Concentrations of PM2.5 collected on the TiO2 and quartz filters were 7.9 ± 4.0 µg/m3 (n = 5) and 8.0 ± 4.2 µg/m3 (n = 5), respectively, and no significant difference in the collection amount of PM2.5 between the two filters was found.
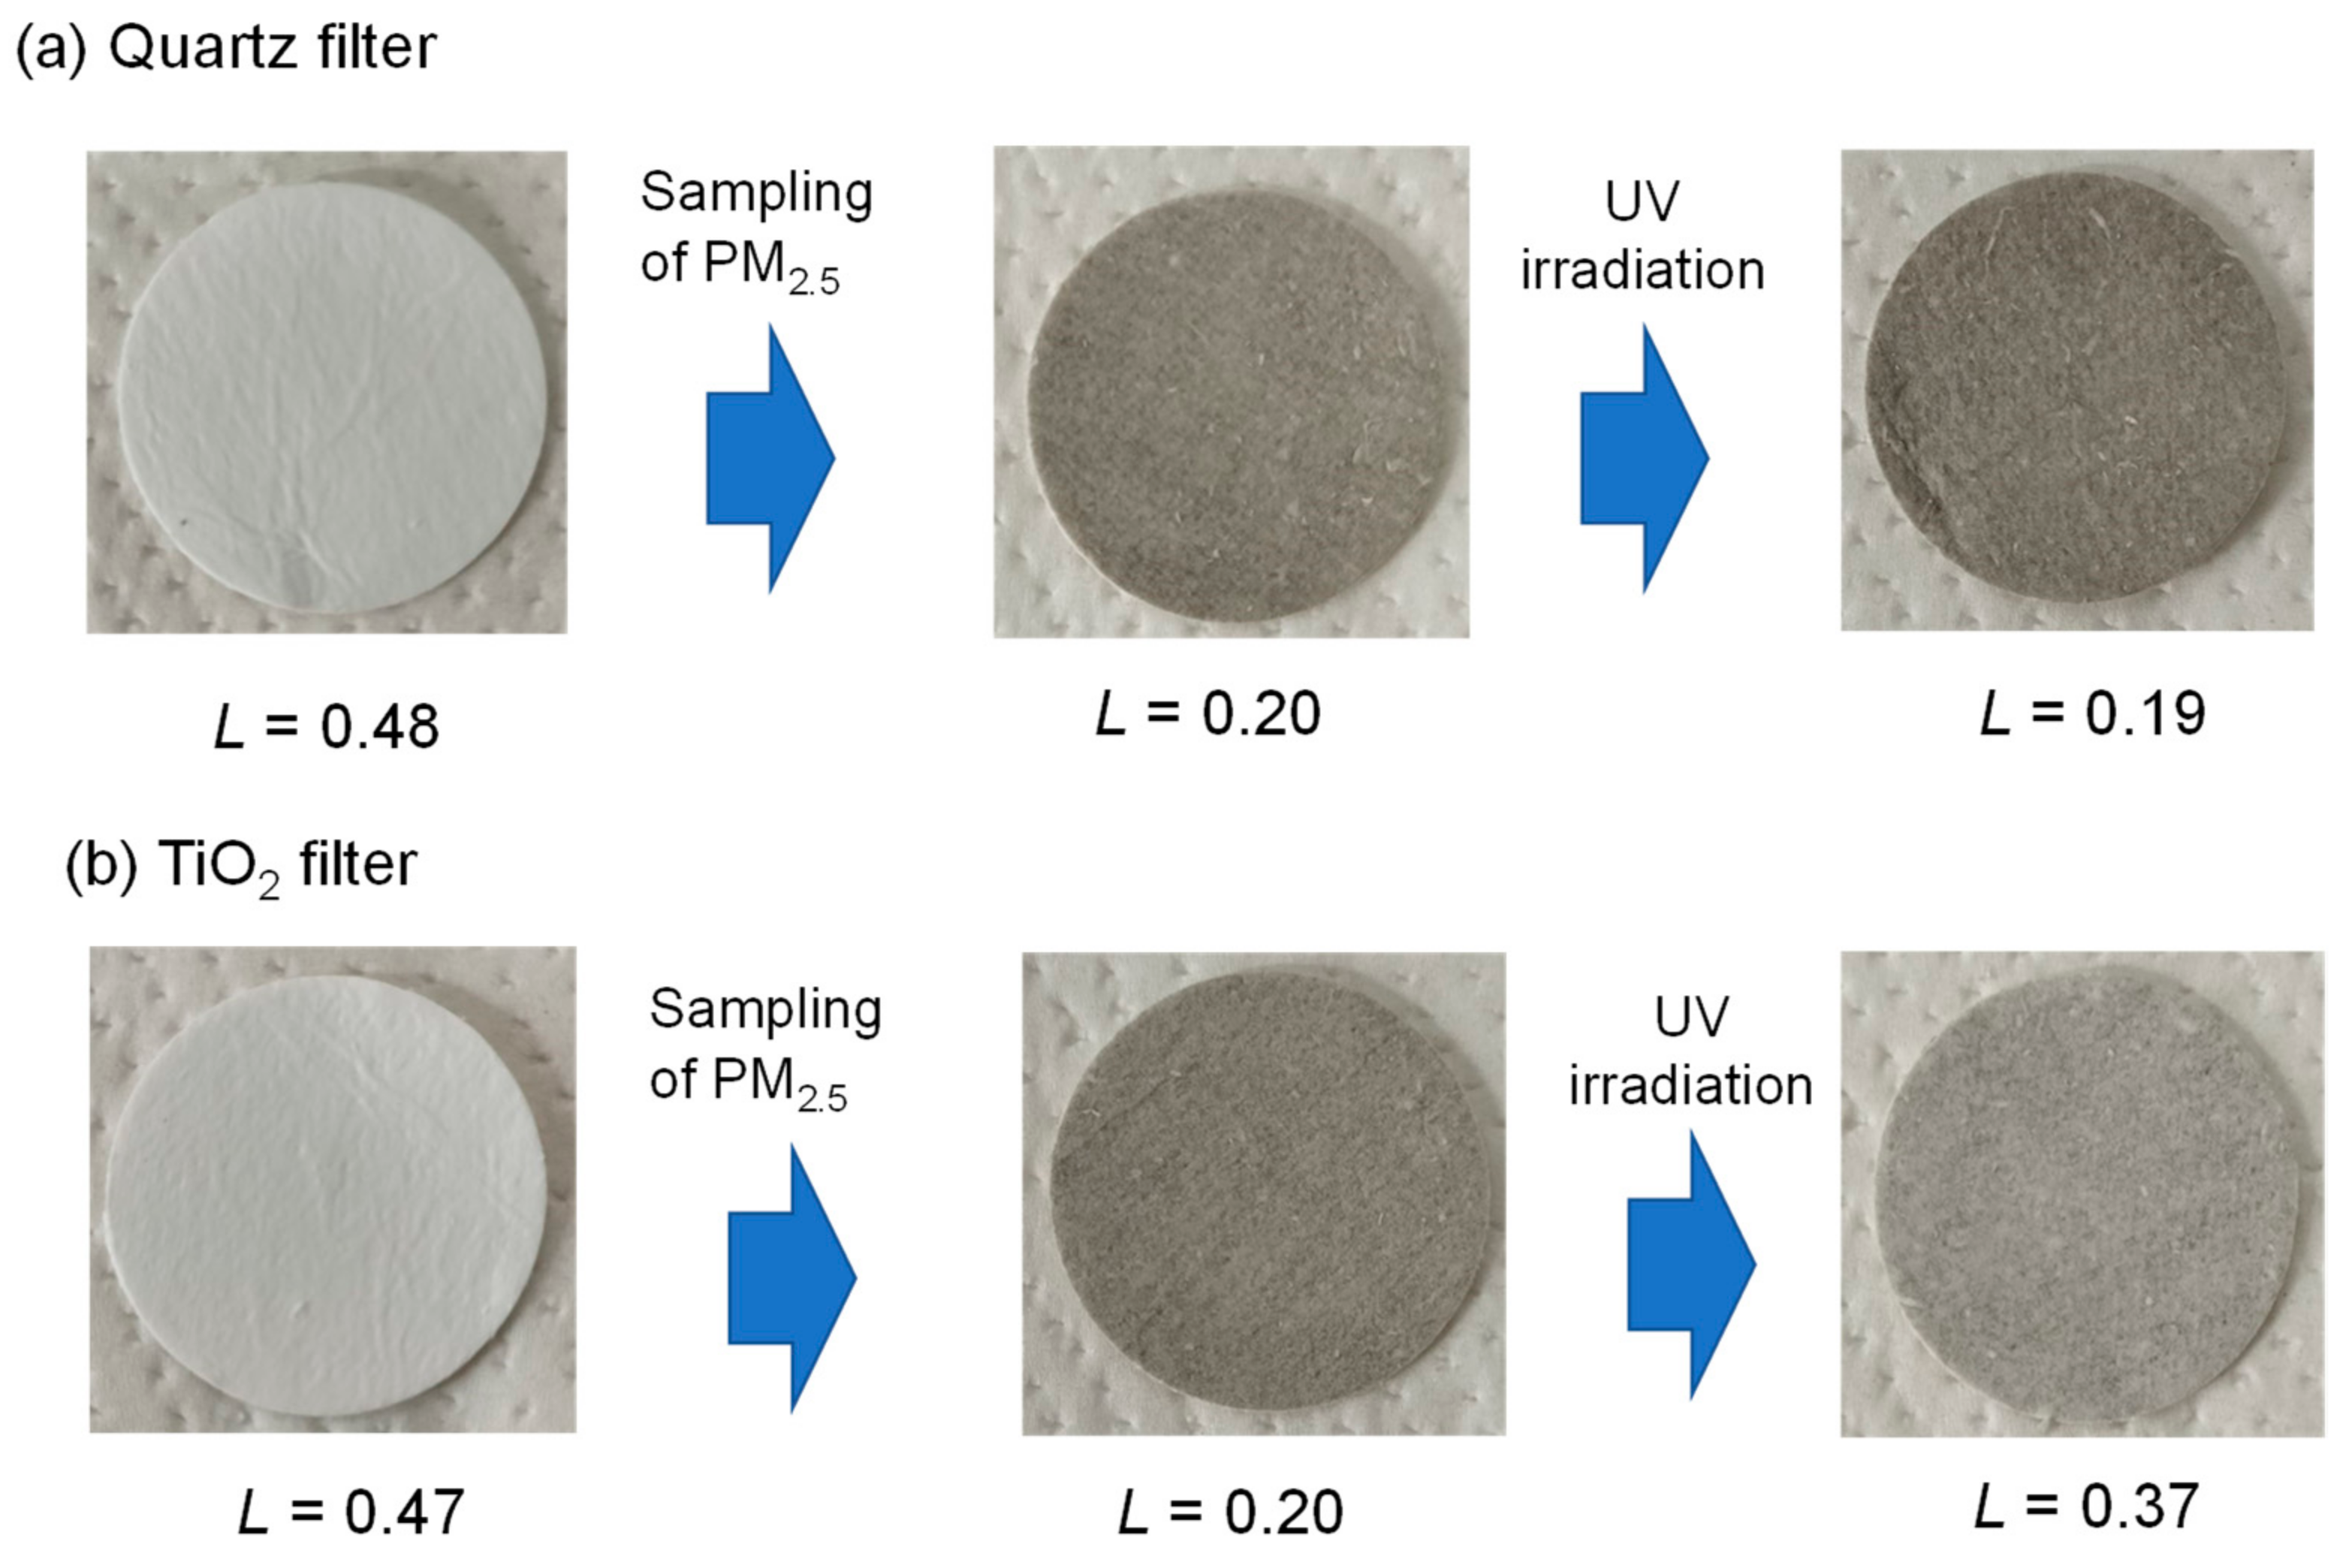
As shown in Figure 6, the color of the collection filters was originally white, with a relative luminance (L) of 0.48 for the quartz filter and 0.47 for the TiO2 filter. After trapping PM2.5, the color turned black with a relative luminance of 0.20, partly owing to the carbonaceous components in PM2.5. Subsequently, UV irradiation was performed for both the PM2.5 samples. After UV irradiation for 24 h, no remarkable change in the color was observed for PM2.5 collected on the quartz filter. In contrast, a remarkable color degradation from black to gray with increased relative luminance was observed for PM2.5 collected on the TiO2 filter. This visual change suggests the successful degradation of carbonaceous components in PM2.5 by this photocatalytic reaction.
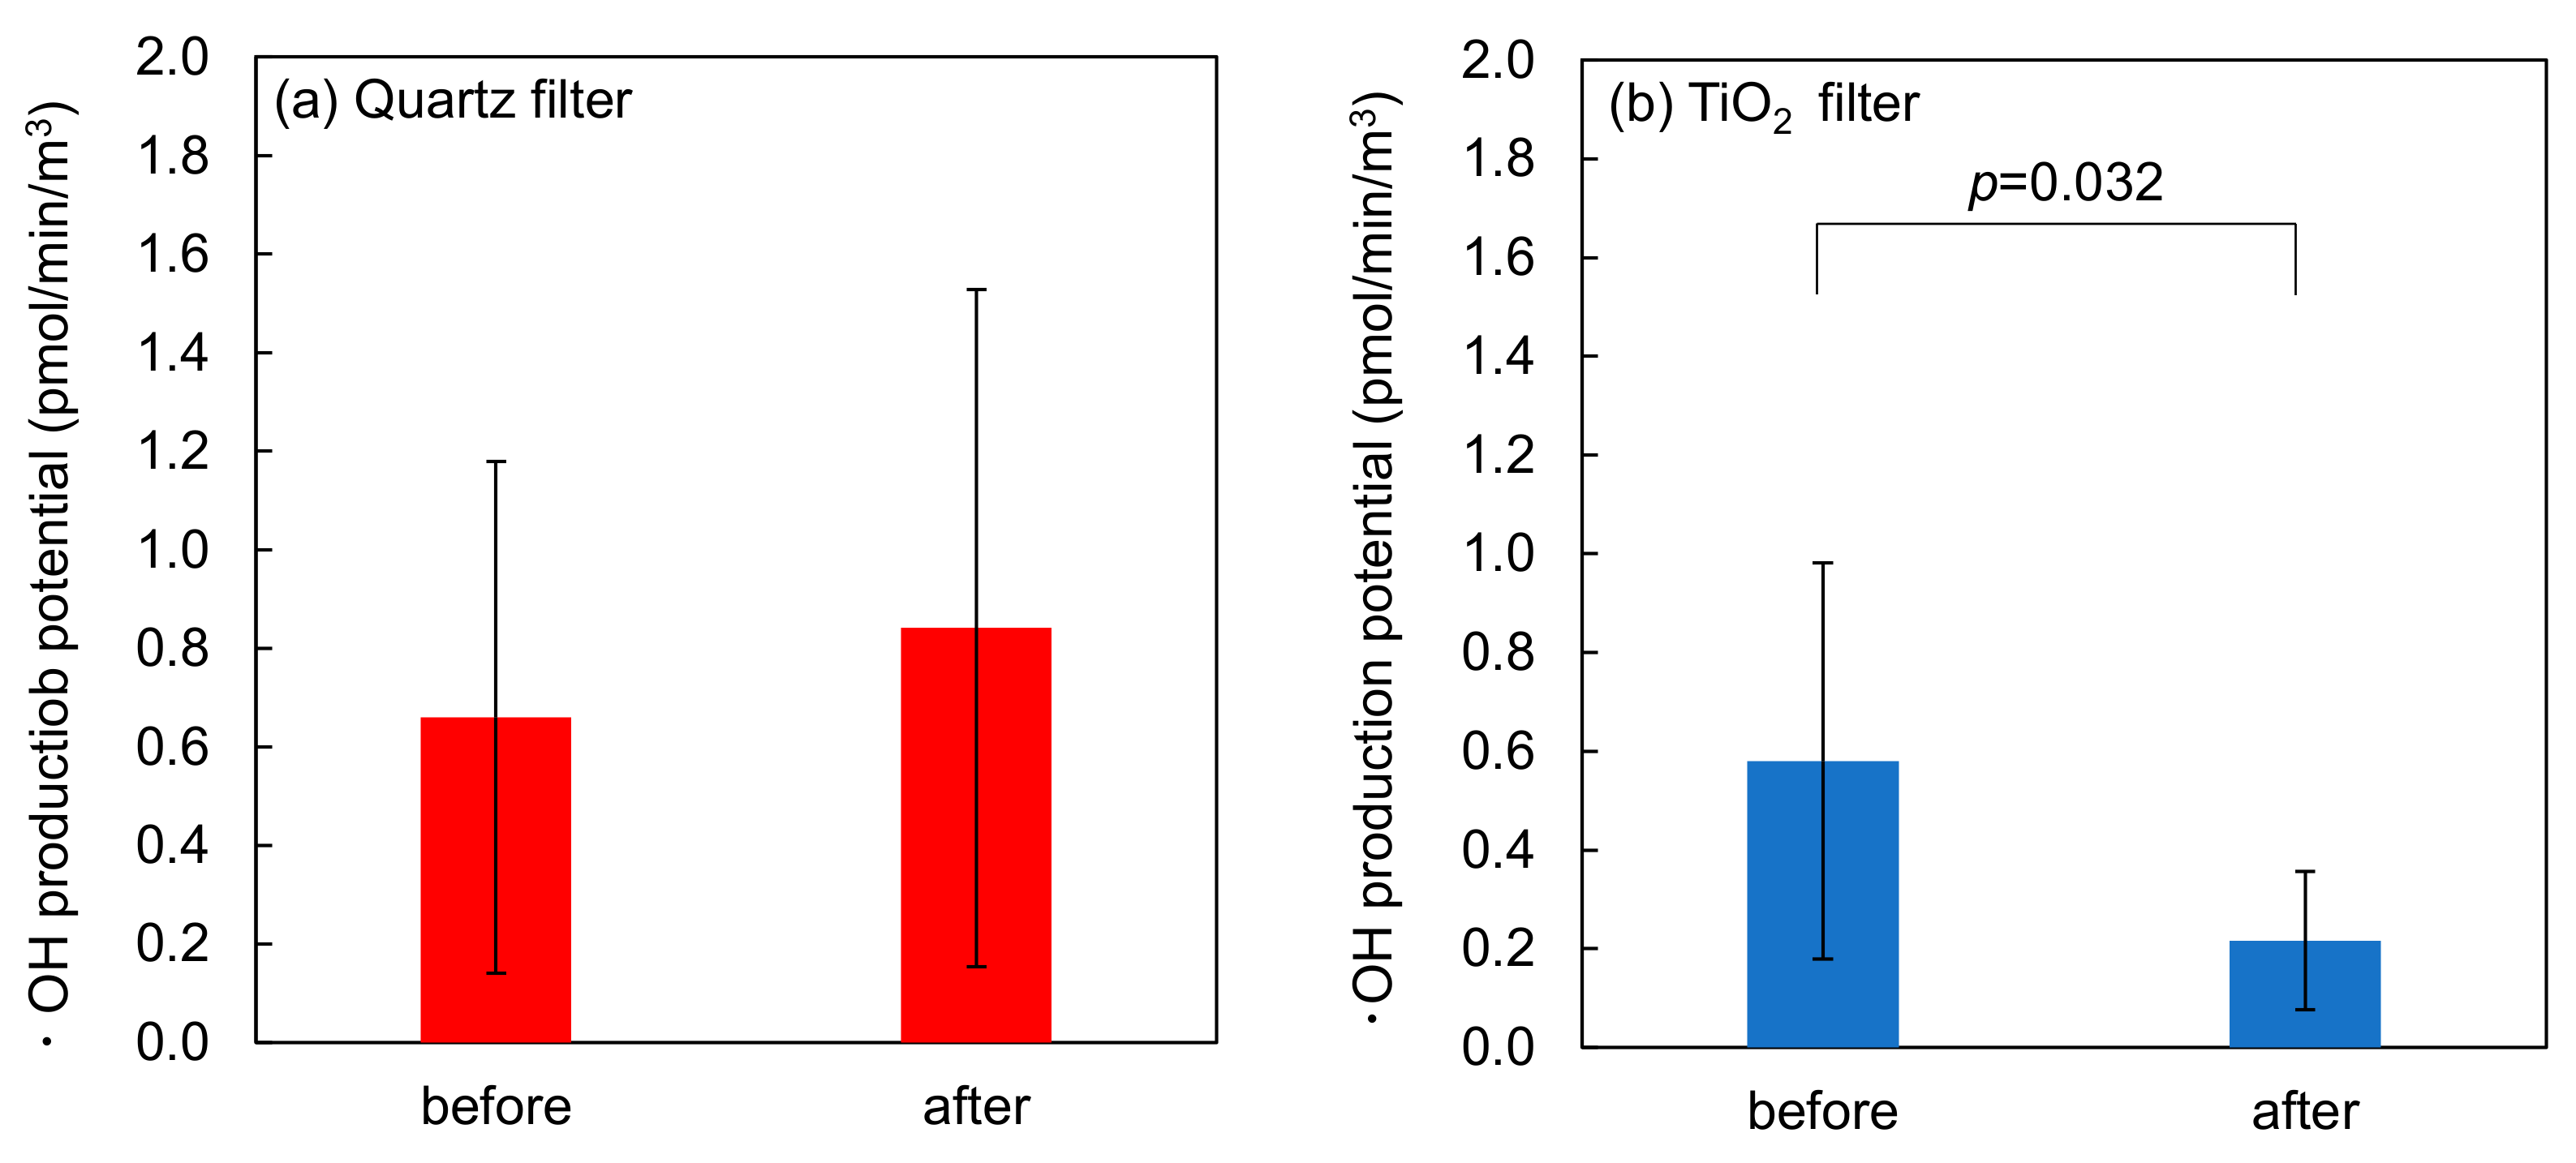
The FIA-TPP assay was applied to five pairs of the PM2.5 samples collected on the quartz and TiO2 filters before and after UV irradiation for 24 h. Since the concentration of 2-OHTA increased with time and good linearity was found for every sample with R2 ≥ 0.95, the ·OH production potentials were obtained from the slopes of the curves and air sampling volume, and the results are shown in Figure 7. No significant changes in the ·OH production potential of PM2.5 collected on the quartz filter were observed before or after UV irradiation. On the other hand, the ·OH production potential of PM2.5 on the TiO2 filter significantly reduced from 0.58 ± 0.40 pmol/(min m3) to 0.22 ± 0.13 pmol/(min m3) with a rate of 62% upon UV irradiation for 24 h (p = 0.032, paired t-test). This shows that the photocatalytic reaction of the TiO2 filter is effective in reducing the ·OH production potential of PM2.5.
3. Materials and Methods
3.1. Reagents
All reagents were obtained from commercial sources: K2HPO4 (Kanto Chemical, Tokyo, Japan; Cica-reagent), KH2PO4 (Kanto Chemical; Cica-reagent), DTT (Tokyo Chemical Industrial, Tokyo, Japan; Guaranteed reagent), TPT (Tokyo Chemical Industrial; Extra pure reagent), 2-OHTA (Tokyo Chemical Industrial; >98.0%), 9,10-phenanthrenequinone (Tokyo Chemical Industrial; Guaranteed reagent), tris(hydroxymethyl)aminomethane (Tokyo Chemical Industrial; Guaranteed reagent), titanium tetraisopropoxide (Kanto Chemical; Cica-reagent), and 2-propanol (Fujifilm Wako Pure Chemical, Osaka, Japan; Guaranteed reagent). The 0.1 M phosphate buffer (pH = 7.4) was prepared from 0.1 M K2HPO4 and 0.1 M KH2PO4 (8:2).
3.2. Measurement of the ·OH Production Potential of PM2.5
3.2.1. Sampling PM2.5 on the Quartz Filter
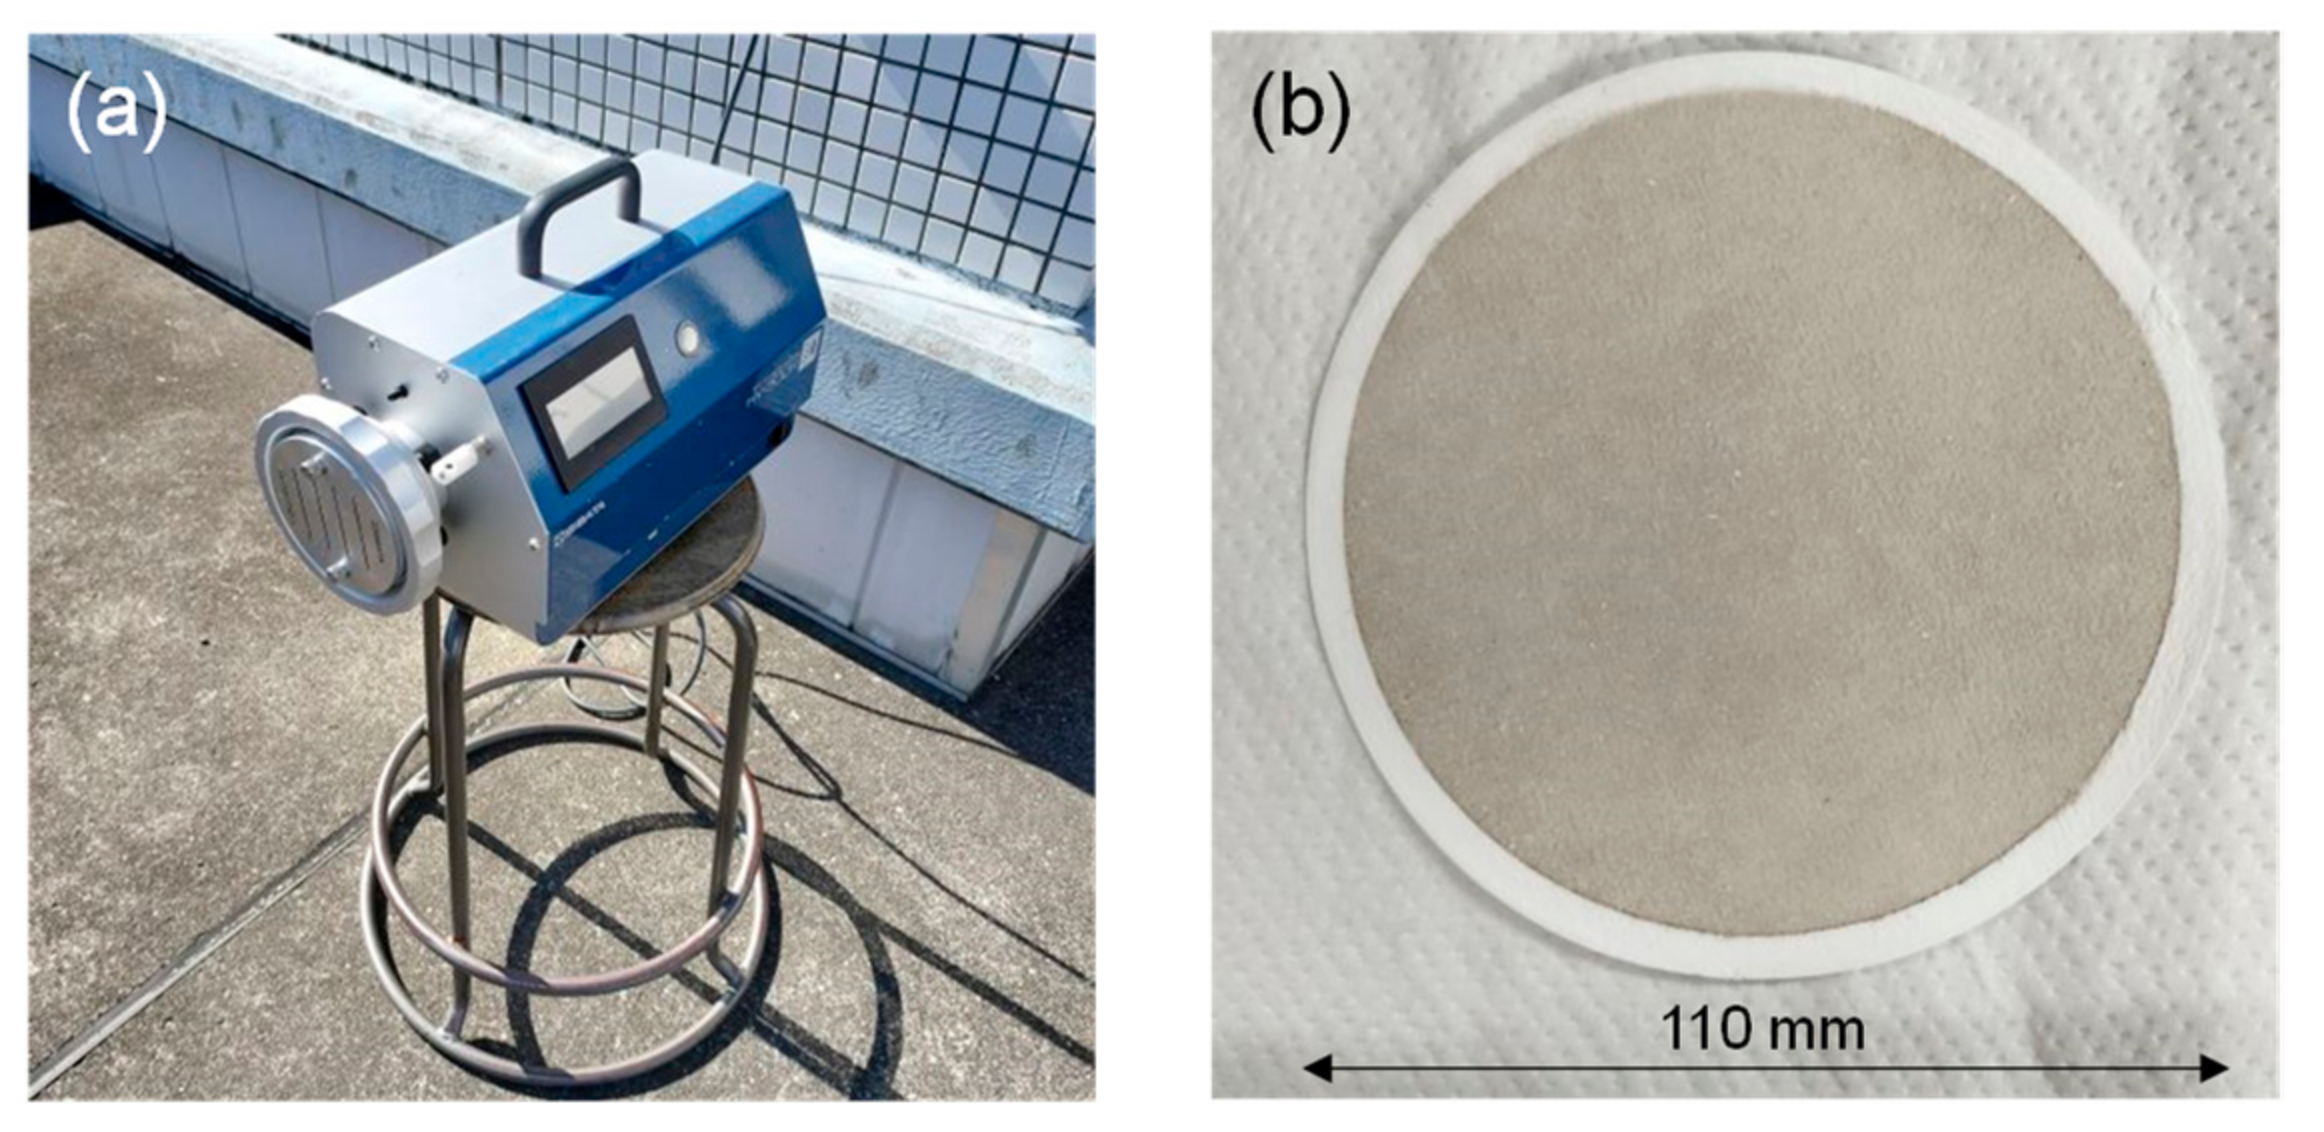
PM2.5 in the air was collected on a quartz filter (Advantec Toyo; diameter = 110 mmφ, thickness = 0.38 mm, SiO2 > 99%) using a high-volume air sampler (Shibata, Tokyo, Japan; HV-500R attached with a particle size selector for PM2.5). It was collected at a flow rate of 500 L/min for 24 h at the roof of the school building of Tokai University, Kanagawa, Japan (35°21′42.4″ N, 139°16′29.0″ E, approximately 20 m above the ground). Figure 8 shows the high-volume air samplers used and the typical appearance of PM2.5 collected on the quartz filter. Sampling was conducted from August to November 2021. Before and after sampling, the filters were conditioned for more than 24 h under constant temperature (21 °C) and relative humidity (40 ± 4%), and, thereafter, the weight of the filter was measured using a microbalance (Shimadzu, Kyoto, Japan; ATX224). The concentration of PM2.5 was determined from the weight difference and total sampling volume of air.
3.2.2. FIA-TPT Assay
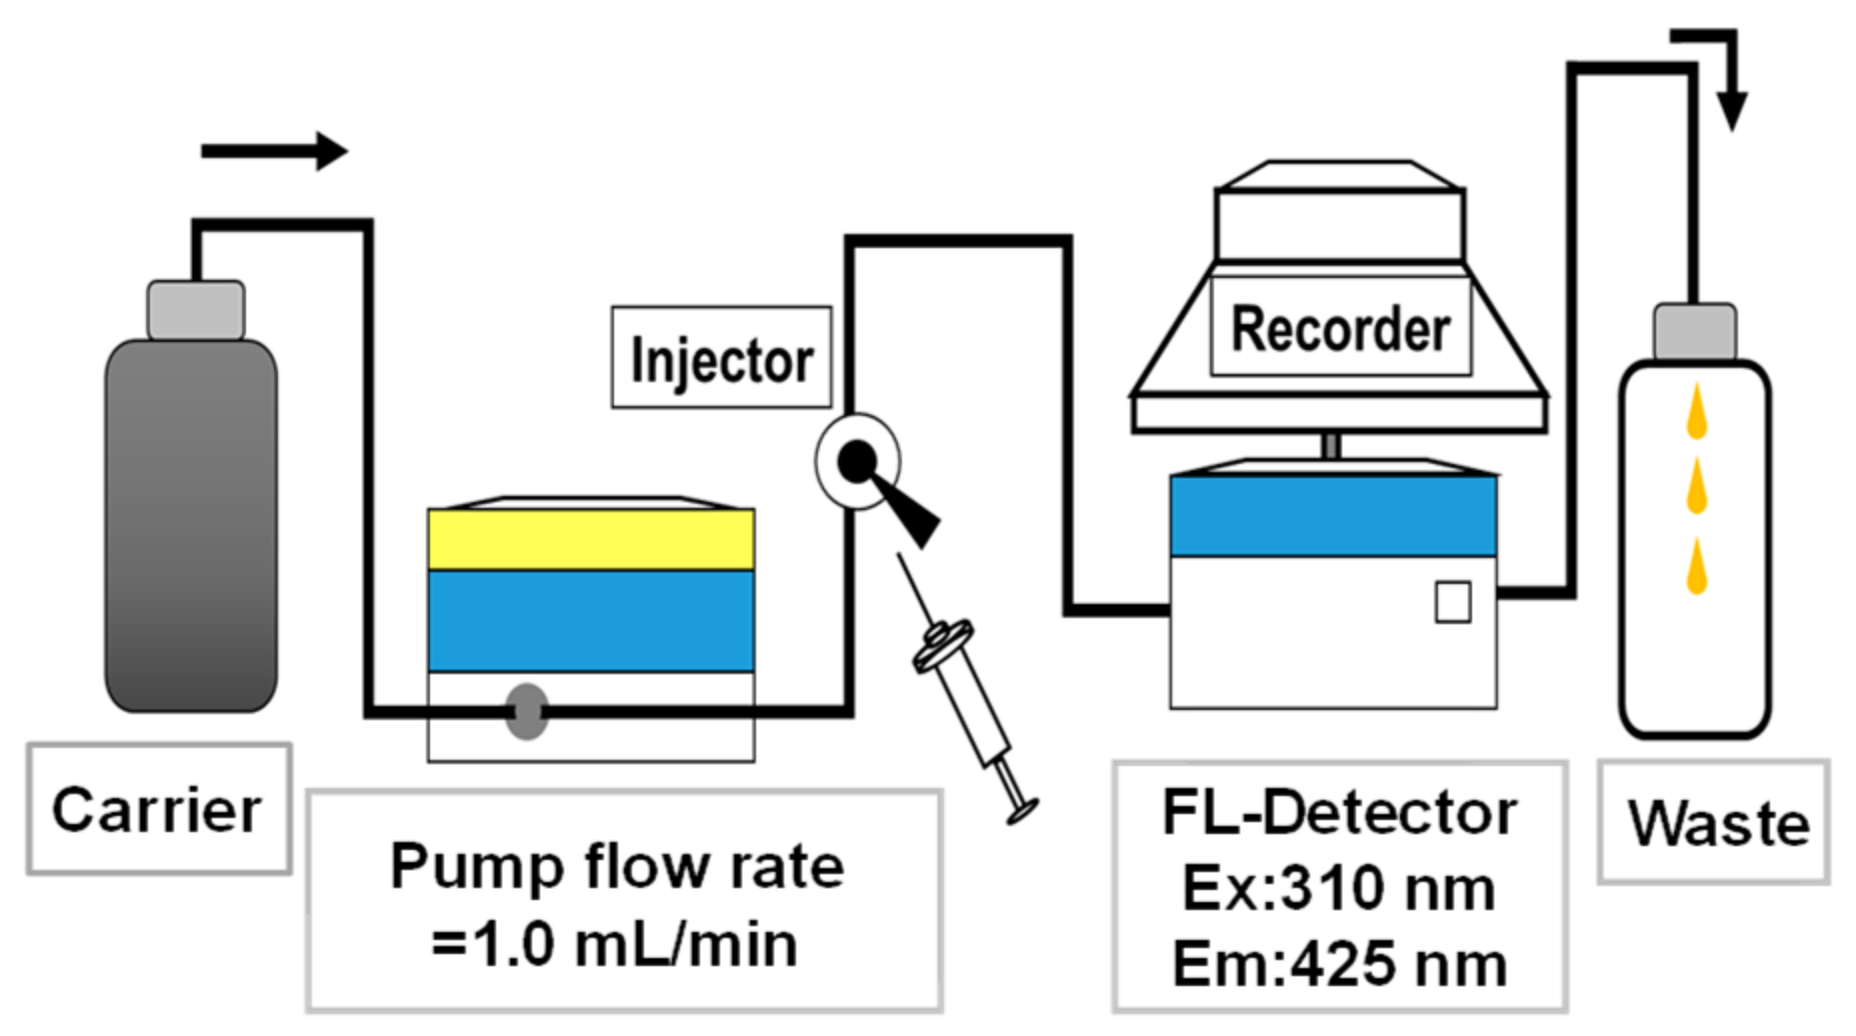
The TPT assay described by Xiong et al. [31] was used for the evaluation of the ·OH production potential of PM2.5 with a minor modification; that is, FIA was applied to the assay. In our previous study [30], FIA was successfully applied to the DTT assay for the easy handling of photodegradable reagents and rapid measurement. The FIA system for the TPP assay was established based on a previous study, as shown in Figure 9. The system consisted of a reservoir of carrier solution, an L-6000 isocratic pump (Hitachi, Tokyo, Japan), an injector (IDEX Health & Science, Rohnert Park, CA, United States; 7725 Sample Injector), an RF-20A fluorescence detector, a C-R6A recorder (Shimadzu), and a waste bottle.
For the measurement of the ·OH production potential of PM2.5, two pieces of 25 mmφ aliquot of the filters were cut into small fragments and transferred into a centrifuge tube. The chemical components were extracted in 10 mL of Milli-Q water for 30 min using an ultrasonic bath to ensure their extraction from the filter fragments. The extracts were filtered using a disposable cellulose acetate membrane filter (Advantec Toyo; DISMIC-25CS, pore size = 0.20 µm). Then, 3.2 mL of the extract was mixed with 1 mL of 0.1 M-phosphate buffer, 0.6 mL of 1 mM DTT in phosphate buffer, and 1.2 mL of 50 mM TPT in phosphate buffer in a shading vial stored in an incubator at 37 °C. Furthermore, 20 µL of the sample solution was immediately injected into the FIA system for the measurement of 2-OHTA. The following analytical conditions were set for the FIA system: carrier solution: 0.4 M-tris buffer (pH = 8.9), flow rate: 1 mL/min (isocratic), injection volume: 20 µL, excitation wavelength: 310 nm, and emission wavelength: 425 nm. The detection wavelength of 2-OHTA was referred to in Page et al. [36]. Five repeated injections were conducted for each analysis, and 2-OHTA was measured for 60 min at 15 min intervals. Each sample was analyzed using the corresponding blank filter extracts, and the blank reading was subtracted from the sample readings. Five-point calibration was conducted using a dilution series of 2-OHTA in phosphate buffer. The correlation coefficient (r) for linear regressions of the calibration curve was >0.99. The analysis was performed in a dark room, and the shading vial was covered with aluminum foil because of the photodegradable property of DTT [37]. Typical chromatograms are shown in Figure 10.
3.3. OC/EC Analysis
To determine the ·OH production potential of PM2.5, the OC/EC concentrations in the PM2.5 samples collected on the quartz filters were determined using Carbon Aerosol Analyzer Model 5 (Sunset Laboratory, Portland, OR, United States) following the IMPROVE protocol [38]. An aliquot of the sample filter (1.5 cm × 1.0 cm) was heated stepwise at temperatures 120 °C (OC1), 240 °C (OC2), 450 °C (OC3), and 550 °C (OC4) in a pure helium atmosphere, which was converted to carbon dioxide in an oxidizing oven. Furthermore, carbon dioxide evaporated at each temperature was reduced to methane for quantification using a flame ionization detector. Thereafter, EC was desorbed in an oxygen blend carrier gas (98% He + 2% O2) at temperatures 550 °C (EC1), 700 °C (EC2), and 800 °C (EC3) and quantified in the same way as OC. When the temperature in inert helium increased, some of the OC was pyrolyzed into black carbon. The pyrolyzed OC, Pyro, was determined separately to correct the OC/EC content. Consequently, OC1, OC2, OC3, OC4, EC1, EC2, EC3, and Pyro were obtained separately. The IMPROVE protocol defines OC as OC1 + OC2 + OC3 + OC4 + Pyro and EC as EC1 + EC2 + EC3 – Pyro. A correlation analysis was conducted for the atmospheric concentrations and the ·OH production potentials of the seven fractions.
3.4. Reducing the ·OH Production Potential of PM2.5
The TiO2 filter was prepared according to the method described by Misawa et al. [28]. Briefly, a piece of quartz filter (Advantec Toyo; diameter = 110 mmφ, thickness = 0.38 mm, SiO2 > 99%) was dipped into 2% titanium tetraisopropoxide in 2-propanol for 1 h. After drying in ambient air, the filter was calcined at 500 °C for 2 h in an electronic furnace (Thermo Scientific, Waltham, MA, United States; FB1400) to obtain a TiO2 layer supported on a quartz filter. The morphology of TiO2 on the quartz fiber was observed using FE-SEM (Hitachi, S-4800) after being coated with a thin Au/Pt film to achieve higher quality secondary electron images. The crystalline structure of TiO2 was observed using XRD (Rigaku Denki, Tokyo, Japan, Geiger Flex RAD-C). After PM was collected on the TiO2 filter, the filter was subjected to photocatalytic degradation.
Simultaneous samplings were conducted five times using two collocated high-volume air samplers with the TiO2 and quartz filters because the concentration and chemical composition of PM2.5 may vary from day to day. All samplings were conducted at a flow rate of 500 L/min for 24 h on the roof of the school building of Tokai University, Kanagawa, Japan, from September to November 2021. The photocatalytic degradation of PM2.5 was performed under ambient air at room temperature (~20 °C). UV light from three black lights (Toshiba Lighting & Technology, Kanagawa, Japan; FL15BLB; peak wavelength of 365 nm) lined up in parallel was uniformly irradiated onto PM2.5 collected on the TiO2 or quartz filter 10 cm above the surface. The UV intensity measured using a UVA-365 monitor (Custom, Tokyo, Japan) at the surface of the filters was 1.1 mW/cm2.
To quantify the color change of PM2.5, the color was converted to a relative luminance according to the red (R), green (G), and blue (B) color model. A digital image of the PM2.5 samples was taken using a digital camera (Richo, Tokyo, Japan; Caplio R5) positioned 40 cm above the sample under constant light, and the relative luminance was obtained from the color values of R, G, and B to yield a range from 0 (black) to 1 (white) by editing the image.
The ·OH production potential was measured using the FIA-TPT assay before and after UV irradiation for 24 h. Furthermore, a paired t-test was applied to test the differences.
4. Conclusions
The production potential of the most damaging ROS, ·OH, was evaluated in PM2.5 samples collected in Kanagawa, Japan. The ·OH production potential was mostly attributed to organic aerosols, which were found to be degradable by the photocatalytic reaction with a TiO2 layer. This effect was verified using a TiO2-supporting quartz filter for the collection and subsequent degradation of PM2.5. The ·OH production potential of PM2.5 collected on the TiO2 filter was significantly reduced from 0.58 ± 0.40 pmol/(min m3) to 0.22 ± 0.13 pmol/(min m3) through UV irradiation for 24 h. This shows that the photocatalytic reaction of the TiO2 filter is effective in reducing the ·OH production potential of PM2.5 and will be useful for reducing the potential risk of human contact with PM2.5 condensed on the filter units. Moreover, the composition and toxicity of PM2.5 vary by sampling sites. Therefore, as for the scope of future studies, PM2.5 sampling will be carried out in many sites to verify the effect of photocatalytic reaction of the ·OH production potential.
Author Contributions
Conceptualization, K.S. and Y.S.; methodology, K.S.; data curation, K.S. and K.Y.; writing—original draft preparation, K.S.; writing—review and editing, Y.S.; supervision, Y.S. All authors have read and agreed to the published version of the manuscript.
Funding
This research received no external funding.
Data Availability Statement
Acknowledgments
The authors are extremely grateful to Takumi Yamamoto and Michihito Todaka, Tokai University, for their help.
Conflicts of Interest
The authors declare no conflict of interest.
References
- Lelieveld, J.; Pozzer, A.; Pöschl, U.; Fnais, M.; Haines, A.; Müzel, T. Loss of life expectancy from air pollution compared to other risk factors: A worldwide perspective. Cardiovasc. Res. 2020, 116, 1910–1917. [Google Scholar] [CrossRef] [PubMed]
- Dockery, D.W.; Pope, C.A., III; Xu, X.; Spengler, J.D.; Ware, J.H.; Fay, M.E.; Ferris, B.G.; Speizer, F.E. An Association between Air Pollution and Mortality in Six US Cities. N. Engl. J. Med. 1993, 329, 1753–1759. [Google Scholar] [CrossRef]
- Krewski, D.; Burnett, R.T.; Goldberg, M.S.; Hoover, K.; Siemiatycki, J.; Abrahamowicz, M.; White, W.H. Validation of the Harvard Six Cities Study of particulate air pollution and mortality. N. Engl. J. Med. 2004, 350, 198–199. [Google Scholar] [CrossRef] [PubMed]
- Laden, F.; Schwartz, J.; Speizer, F.E.; Dockery, D.W. Reduction in fine particulate air pollution and mortality: Extended follow-up of the Harvard Six Cities study. Am. J. Respir. Crit. Care Med. 2006, 173, 667–672. [Google Scholar] [CrossRef]
- Pope, C.A., III; Thun, M.J.; Namboodiri, M.M.; Dockery, D.W.; Evans, J.S.; Speizer, F.E.; Heath, C.W., Jr. Particulate air pollution as a predictor of mortality in a prospective study of U.S. adults. Am. J. Respir. Crit. Care Med. 1995, 151, 669–674. [Google Scholar] [CrossRef] [PubMed]
- Pope, C.A., III; Burnett, R.T.; Thun, M.J.; Calle, E.E.; Krewski, D.; Ito, K.; Thurston, G.D. Lung cancer, cardiopulmonary mortality, and long-term exposure to fine particulate air pollution. J. Am. Med. Assoc. 2002, 287, 1132–1141. [Google Scholar] [CrossRef]
- Pope, C.A., III; Burnett, R.T.; Thurston, G.D.; Thun, M.J.; Calle, E.E.; Krewski, D.; Godleski, J.J. Cardiovascular mortality and long-term exposure to particulate air pollution—Epidemiological evidence of general pathophysiological pathways of disease. Circulation 2004, 109, 71–77. [Google Scholar] [CrossRef] [PubMed]
- Kishikawa, N.; Ohkubo, N.; Ohyama, K.; Nakashima, K.; Kuroda, N. Chemiluminescence assay for quinones based on generation of reactive oxygen species through the redox cycle of quinone. Anal. Bioanal. Chem. 2008, 393, 1337–1343. [Google Scholar] [CrossRef]
- Motoyama, Y.; Bekki, K.; Chung, S.W.; Tang, N.; Toriba, A.; Taguchi, K.; Hayakawa, K. Oxidative stress more strongly induced by ortho- than para-quinoid polycyclic aromatic hydrocarbons in A549 cells. J. Health Sci. 2009, 55, 845–850. [Google Scholar] [CrossRef]
- Sugimoto, R.; Kumagai, Y.; Nakai, Y.; Ishii, T. 9,10-phenanthrenequinone in diesel exhaust particle downregulates Cu, Zn-SOD and HO-1 in human pulmonary epithelial cells: Intracellular ion scavenger 1,10-phenanthroline affords protection against apoptosis. Free Radical Bio. Med. 2005, 38, 388–395. [Google Scholar] [CrossRef]
- Hirano, S.; Furuyama, A.; Koike, E.; Kobayashi, T. Oxidative-stress potency of organic extracts of diesel exhaust and urban fine particles in rat heart microvessel endothelial cells. Toxicology 2003, 187, 161–170. [Google Scholar] [CrossRef]
- Li, N.; Sioutas, C.; Cho, A.; Schmitz, D.; Misra, C.; Sempf, J.; Wang, M.; Oberley, T.; Froines, J.; Nel, A. Ultrafine particulate pollutants induce oxidative stress and mitochondrial damage. Envron. Health Perspect. 2003, 111, 455–460. [Google Scholar] [CrossRef] [PubMed]
- Finkel, T.; Holbrook, N.J. Oxidants, oxidative stress and the biology of ageing. Nature 2000, 408, 239–247. [Google Scholar] [CrossRef]
- Squadrito, G.L.; Cueto, R.; Dellinger, B.; Pryor, W.A. Quinoid redox cycling as a mechanism for sustained free radical generation by inhaled airborne particulate matter. Free Radic. Biol. Med. 2001, 31, 1132–1138. [Google Scholar] [CrossRef] [PubMed]
- Cho, A.K.; Sioutas, C.; Miguel, A.H.; Kumagai, Y.; Schmitz, D.A.; Signgh, M.; Eiguren-Fernadez, A.; Froines, J.R. Redox activity of airborne particulate matter at different sites in the Los Angeles Basin. Environ. Res. 2005, 99, 40–47. [Google Scholar] [CrossRef] [PubMed]
- Charrier, J.G.; Anastasio, C. On dithiothreitol (DTT) as a measure of oxidative potential for ambient particles: Evidence for the importance of soluble transition metals. Atmos. Chem. Phys. 2012, 12, 11317–11350. [Google Scholar] [CrossRef]
- Jankowska, E.; Reponen, T.; Willeke, K.; Grinshpun, S.A.; Choi, K. Collection of fungal spores on air filters and spore reentrainment from filters into air. J. Aerosol Sci. 2000, 31, 969–978. [Google Scholar] [CrossRef]
- Maddineni, A.K.; Das, D.; Damodaran, R.M. Inhibition of particle bounce and re-entrainment using oil-treated filter media for automotive engine intake air filtration. Powder Technol. 2017, 322, 369–377. [Google Scholar] [CrossRef]
- Motta, O.; Pironti, C.; Venier, M.; Proto, A. An innovative filtering system for the handling of asbestos-based products: Improvement of safety and quality of work in analysis laboratories. Toxics 2022, 10, 281. [Google Scholar] [CrossRef]
- Pedanekar, R.S.; Shaikh, S.K.; Rajpure, K.Y. Thin film photocatalysis for environmental remediation: A status review. Curr. Appl. Phys. 2020, 20, 931–952. [Google Scholar] [CrossRef]
- Muscetta, M.; Russo, D. Photocatalytic Applications in Wastewater and Air Treatment: A Patent Review (2010–2020). Catalysts 2021, 11, 834. [Google Scholar] [CrossRef]
- Chen, Y.; Xin, X.; Zhang, N.; Xu, Y. Aluminium-Based Plastic Photocatalysis. Part. Part. Syst. Charact. 2017, 34, 1600357. [Google Scholar] [CrossRef]
- Chen, D.; Cheng, Y.; Zhou, N.; Chen, P.; Wang, Y.; Li, K.; Huo, S.; Cheng, P.; Peng, P.; Zhang, R.; et al. Photocatalytic degradation of organic pollutants using TiO2-based photocatalysts: A review. J. Clean. Prod. 2020, 268, 121725. [Google Scholar] [CrossRef]
- Ceglie, C.D.; Pal, S.; Murgolo, S.; Licciulli, A.; Mascolo, G. Investigation of Photocatalysis by Mesoporous Titanium Dioxide Supported on Glass Fibers as an Integrated Technology for Water Remediation. Catalysts 2022, 12, 41. [Google Scholar] [CrossRef]
- Shawky, A.; Alsheheri, A.Z.; Alsaggaf, W.T.; Al-Hajji, L.A.; Zaki, Z.I. Promoted hexavalent chromium ion photoreduction over visible-light active RuO2/TiO2 heterojunctions prepared by solution process. J. Photochem. Photobiol. A 2022, 429, 113906. [Google Scholar] [CrossRef]
- Alsheheri, S.Z.; Shawky, A.; Alsaggaf, W.T.; Zaki, Z.I. Visible-light responsive ZnSe-anchored mesoporous TiO2 heterostructures for boosted photocatalytic reduction of Cr(VI). Nanotechnology 2022, 33, 305701. [Google Scholar] [CrossRef]
- Rusinque, B.; Escobedo, S.; de Lasa, H. Hydrogen Production via Pd-TiO2 Photocatalytic Water Splitting under Near-UV and Visible Light: Analysis of the Reaction Mechanism. Catalysts 2021, 11, 405. [Google Scholar] [CrossRef]
- Misawa, K.; Sekine, Y.; Ksukubo, Y.; Sohara, K. Photocatalytic degradation fine particulate matter (PM2.5) collected on TiO2 supporting quartz fibre filter. Environ. Technol. 2020, 41, 1266–1277. [Google Scholar] [CrossRef]
- Sohara, K.; Yamauchi, K.; Sun, X.; Misawa, K.; Sekine, Y. Photocatalytic degradation of polycyclic aromatic hydrocarbons in fine particulate matter (PM2.5) collected on TiO2-supporting quartz fibre filters. Catalyst 2021, 11, 400. [Google Scholar] [CrossRef]
- Misawa, K.; Sohara, K.; Kumai, Y.; Kusukubo, Y.; Sekine, Y. Photocatalytic reduction of oxidative potential of particulate matter 2.5 (PM2.5). Indoor Environ. 2019, 22, 15–22. [Google Scholar] [CrossRef] [Green Version]
- Xiong, Q.; Yu, H.; Wang, R.; Wei, J.; Verma, V. Rethinking Dithiothreitol-Based Particulate Matter Oxidative Potential: Measuring Dithiothreitol Consumption versus Reactive Oxygen Species Generation. Environ. Sci. Technol. 2017, 51, 6507–6514. [Google Scholar] [CrossRef]
- Cheng, Y.; Ma, Y.; Dong, B.; Qiu, X.; Hu, D. Pollutants from primary sources dominate the oxidative potential of water-soluble PM2.5 in Hong Kong in terms of dithiothreitol (DTT) consumption and hydroxyl radical production. J. Hazard. Mater. 2021, 405, 124218. [Google Scholar] [CrossRef]
- Yu, Q.; Chen, J.; Qin, W.; Ahmad, M.; Zhang, Y.; Sun, Y.; Xin, K.; Ai, J. Oxidative potential associated with water-soluble components of PM2.5 in Beijing: The important role of anthropogenic organic aerosols. J. Hazard. Mater. 2022, 433, 128839. [Google Scholar] [CrossRef] [PubMed]
- Bae, M.; Schauer, J.J.; DeMinter, J.T.; Turner, J.J.; Smith, D.; Cary, R.A. Validation of a semi-continuous instrument for elemental carbon and organic carbon using a thermal-optical method. Atmons. Environ. 2004, 38, 2885–2893. [Google Scholar] [CrossRef]
- Sekine, Y. Human health effect of particulate matter 2.5 (PM2.5). Indoor Environ. 2014, 17, 19–35. [Google Scholar] [CrossRef]
- Page, S.E.; Arnold, W.A.; McNeill, K. Terephthalate as a probe for photochemically generated hydroxyl radical. J. Environ. Monit. 2010, 12, 1658–1665. [Google Scholar] [CrossRef] [PubMed]
- Damodaran, S. Estimation of disulfide bonds using 2-nitro-5-thiosulfobenzoic acid: Limitations. Anal. Biochem. 1985, 145, 200–204. [Google Scholar] [CrossRef]
- Chow, J.C.; Watson, J.G.; Crow, D.; Lowenthal, D.H.; Merrifield, T. Comparison of IMPROVE and NIOSH Carbon Measurements. Aerosol Sci. Technol. 2001, 34, 23–34. [Google Scholar] [CrossRef]
Figure 1.
Production of O2−· by the reaction of certain redox-active substances with DTT and the measurement of ·OH production potential using TPT. Herein, 9,10-phenanthrenequine is shown as an example of a typical redox-active substance in PM2.5.
Figure 1.
Production of O2−· by the reaction of certain redox-active substances with DTT and the measurement of ·OH production potential using TPT. Herein, 9,10-phenanthrenequine is shown as an example of a typical redox-active substance in PM2.5.

Figure 2.
Changes in the amount of produced 2-OHTA with time upon applying the FIA-TPT assay to the PM2.5 samples collected in Kanagawa, Japan, from August to November 2021 (chart legend: sampling date).
Figure 2.
Changes in the amount of produced 2-OHTA with time upon applying the FIA-TPT assay to the PM2.5 samples collected in Kanagawa, Japan, from August to November 2021 (chart legend: sampling date).

Figure 3.
Relationship between concentration and ·OH production potential of PM2.5. The samples were collected in Kanagawa, Japan, from August to November 2021.
Figure 3.
Relationship between concentration and ·OH production potential of PM2.5. The samples were collected in Kanagawa, Japan, from August to November 2021.

Figure 4.
SEM images of a piece of fiber of the quartz and TiO2 filters.

Figure 5.
XRD pattern of the TiO2 filter prepared in this study.

Figure 6.
Changes in the relative luminance (L) of the PM2.5 samples collected on the (a) quartz and (b) TiO2 filters before sampling, after sampling/before UV irradiation, and after UV irradiation for 24 h.
Figure 6.
Changes in the relative luminance (L) of the PM2.5 samples collected on the (a) quartz and (b) TiO2 filters before sampling, after sampling/before UV irradiation, and after UV irradiation for 24 h.

Figure 7.
Comparison of the ·OH production potential of PM2.5 collected on the (a) quartz and (b) TiO2 filters before and after UV irradiation (paired t-test).
Figure 7.
Comparison of the ·OH production potential of PM2.5 collected on the (a) quartz and (b) TiO2 filters before and after UV irradiation (paired t-test).

Figure 8.
(a) High-volume air sampler and (b) a typical PM2.5 sample collected on the quartz filter.
Figure 8.
(a) High-volume air sampler and (b) a typical PM2.5 sample collected on the quartz filter.

Figure 9.
Schematic illustration of the FIA system for the TPT assay.

Figure 10.
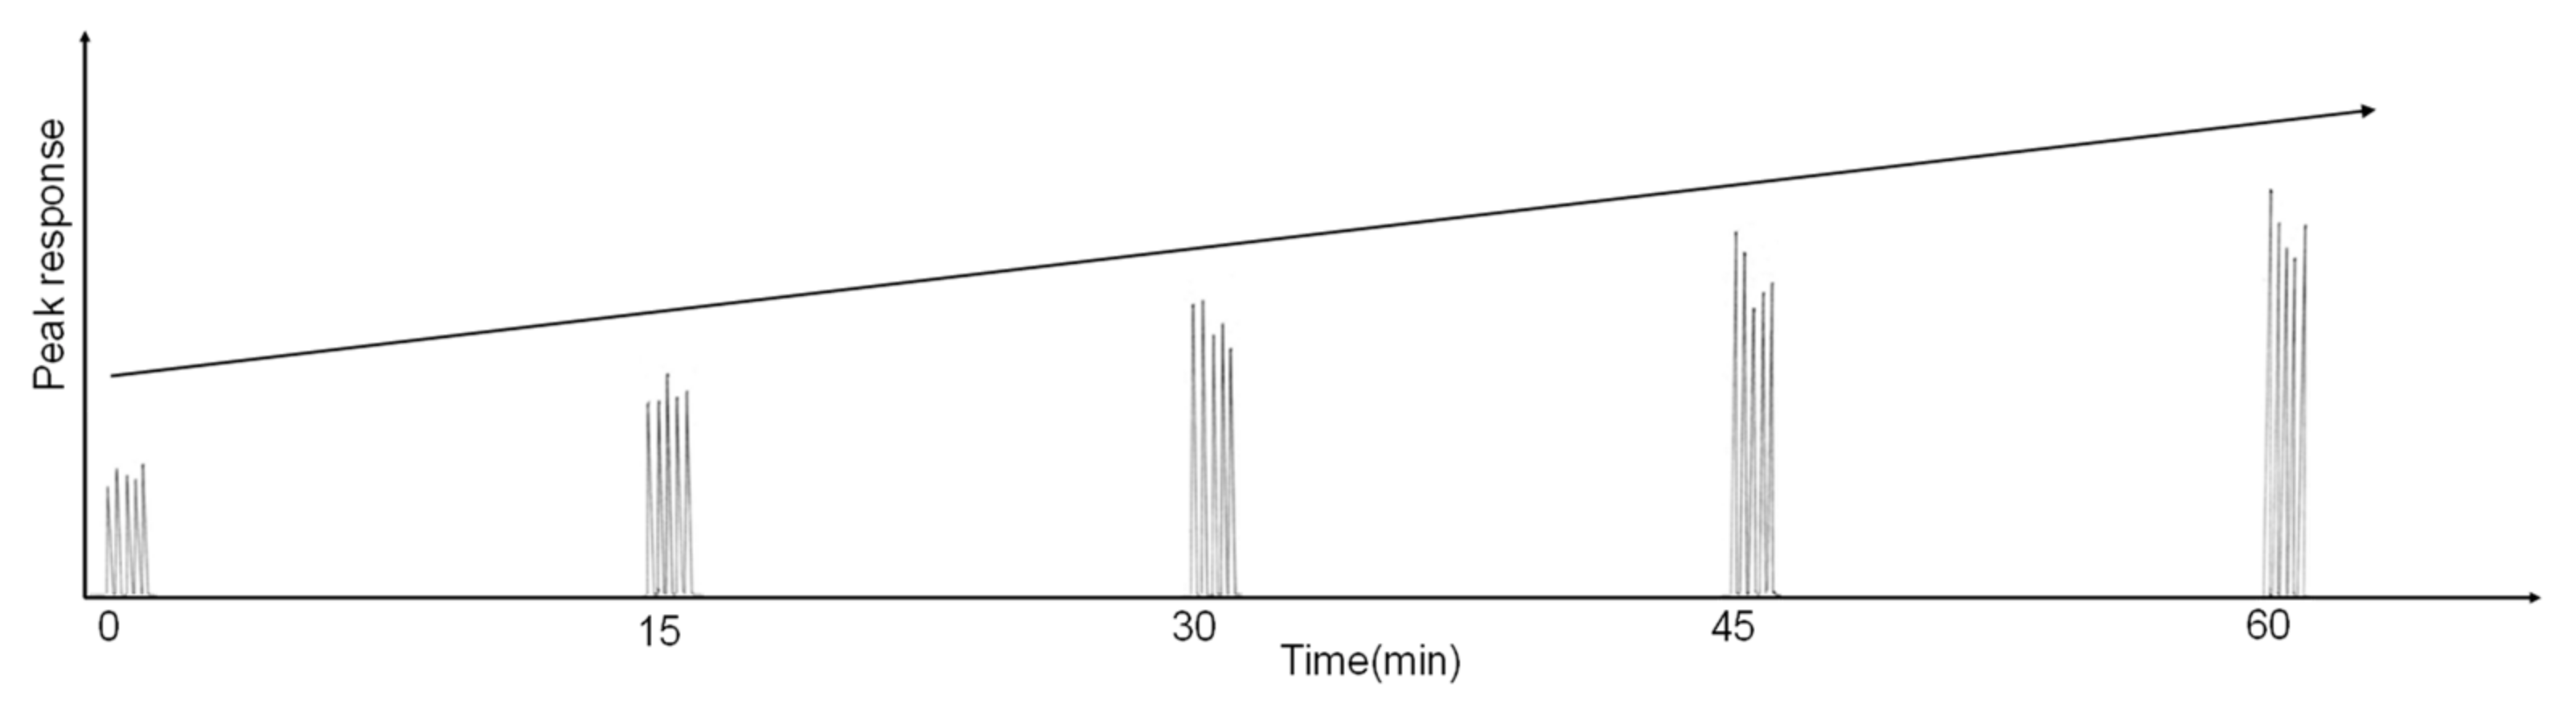
Linear increase in the peak response of 2-OHTA produced in the PM2.5 sample (Sampling date: 6–7 October 2021). For one analysis, five repeated injections were performed within 90 s.
Figure 10.
Linear increase in the peak response of 2-OHTA produced in the PM2.5 sample (Sampling date: 6–7 October 2021). For one analysis, five repeated injections were performed within 90 s.


Table 1.
List of abbreviations used in the manuscript.
| Abbreviation | Definition |
|---|---|
| 2-OHTA | 2-hydroxyterephtalic acid |
| DTT | Dithiothreitol |
| EC | Elemental carbon |
| FE-SEM | Field-emission scanning electron microscope |
| FIA | Flow injection analysis |
| IMPROVE | Interagency monitoring of protected visual environments |
| OC | Organic carbon |
| PAH quinones | Quinoid polycyclic aromatic hydrocarbons |
| PM2.5 | Particulate matter 2.5 |
| ROS | Reactive oxygen species |
| TPT | Disodium terephthalate |
| TiO2 filter | TiO2-supporting quartz filter |
| UV | Ultraviolet |
| XRD | X-ray diffraction |
Table 2.
Concentrations of the carbonaceous components collected on the quartz filter (µg/m3) and Pearson’s correlation coefficient (r) between atmospheric concentrations and ·OH production potentials of the seven fractions. * p < 0.01, ** p < 0.05.
Table 2.
Concentrations of the carbonaceous components collected on the quartz filter (µg/m3) and Pearson’s correlation coefficient (r) between atmospheric concentrations and ·OH production potentials of the seven fractions. * p < 0.01, ** p < 0.05.
| Fraction | Concentration (µg/m3) | Pearson’s Correlation Coefficient between Concentration and ·OH Production Potential (r) |
|---|---|---|
| OC1 | 0.063 ± 0.014 | −0.41 |
| OC2 | 0.68 ± 0.26 | 0.60 |
| OC3 | 0.67 ± 0.22 | 0.81 * |
| OC4 | 0.16 ± 0.047 | 0.78 ** |
| EC1 | 1.2 ± 0.50 | 0.72 ** |
| EC2 | 0.17 ± 0.051 | 0.48 |
| EC3 | 0.028 ± 0.0076 | 0.75 ** |
Publisher’s Note: MDPI stays neutral with regard to jurisdictional claims in published maps and institutional affiliations. |
© 2022 by the authors. Licensee MDPI, Basel, Switzerland. This article is an open access article distributed under the terms and conditions of the Creative Commons Attribution (CC BY) license (https://creativecommons.org/licenses/by/4.0/).
Share and Cite
MDPI and ACS Style
Sohara, K.; Yamauchi, K.; Sekine, Y. Evaluation of ·OH Production Potential of Particulate Matter (PM2.5) Collected on TiO2-Supporting Quartz Filters. Catalysts 2022, 12, 1016. https://0-doi-org.brum.beds.ac.uk/10.3390/catal12091016
AMA Style
Sohara K, Yamauchi K, Sekine Y. Evaluation of ·OH Production Potential of Particulate Matter (PM2.5) Collected on TiO2-Supporting Quartz Filters. Catalysts. 2022; 12(9):1016. https://0-doi-org.brum.beds.ac.uk/10.3390/catal12091016
Chicago/Turabian StyleSohara, Koki, Katsuya Yamauchi, and Yoshika Sekine. 2022. "Evaluation of ·OH Production Potential of Particulate Matter (PM2.5) Collected on TiO2-Supporting Quartz Filters" Catalysts 12, no. 9: 1016. https://0-doi-org.brum.beds.ac.uk/10.3390/catal12091016
Note that from the first issue of 2016, this journal uses article numbers instead of page numbers. See further details here.