Article

Evaluation of Porous Honeycomb-Shaped CuO/CeO2 Catalyst in Vapour Phase Glycerol Reforming for Sustainable Hydrogen Production

by
Adrian Chun Minh Loy
*,
Shanthi Priya Samudrala
and
Sankar Bhattacharya
*
Department of Chemical and Biological Engineering, Faculty of Engineering, Monash University, Clayton, VIC 3800, Australia
*
Authors to whom correspondence should be addressed.
Submission received: 28 July 2022 / Revised: 19 August 2022 / Accepted: 22 August 2022 / Published: 24 August 2022
(This article belongs to the Special Issue Catalysts for Biofuel and Bioenergy Production)

Abstract

:
This study presented an optimisation study of two-stage vapour-phase catalytic glycerol reforming (VPCGR) using response surface methodology (RSM) with a central composite experimental design (CCD) approach. Characterisation through Brunauer–Emmett–Teller analysis (BET), small-angle X-ray scattering (SAXS), scanning electron microscopy coupled with energy dispersive X-ray analysis (SEM-EDX), atomic force microscopy (AFM) and particle X-ray diffraction (PXRD) were carried out to understand the physiochemical activity of the honeycomb morphology CuO/CeO2 catalyst. Notably, in this study, we achieved the desired result of glycerol conversion (94%) and H2 production (81 vol.%) under the reaction condition of Cu species loading (10 wt.%), reaction temperature (823 K), WHSV (2 h−1) and glycerol concentration (15 wt.%). From the RSM analysis, an optimum predicted model for VPCGR was obtained and further integrated into Microsoft Excel and Aspen Plus to perform an energy analysis of the VPCGR plant at a scale of 100 kg h−1 of glycerol feed. As a whole, this study aimed to provide an overview of the technical operation and energy aspect for a sustainable frontier in glycerol reforming.

1. Introduction

Global warming and fossil fuel depletion are two of the greatest challenges of the humankind. Due to the acceleration of climate change’s effect, the need for a paradigm shift from the use of conventional fossil fuels toward renewable energy in the global arena is becoming more important. The measures include developing energy legislation, supporting carbon credit programs and giving renewable energy tax credits and subsidies [1]. In this context, the urge for seeking an alternative renewable and environmentally friendly clean source, aligning to the 7th UN sustainable development goal “affordable and clean energy”, is imperative to achieve a sustainable energy matrix [2,3,4].
Hydrogen (H2) is one of the potential alternatives in reducing the society’s reliance on fossil fuels, owing to its clean combustion characteristics and high calorific values [2,5]. Moreover, H2 is a highly sought-after industrial commodity that can be utilised in applications ranging from power generation to chemical refineries [6,7]. Currently, most of the H2 production is from unsustainable routes, more indicatively, from mature technologies such as hydrocarbon reforming and natural gas reforming [8]. Even though a huge amount of H2 can be produced at a lower cost in these processes, the consumption of fossil resources is still contributing a huge amount of greenhouse gas emissions. Thus, developing a green, sustainable and efficient strategy for H2 production is critical.
On the other hand, glycerol, one of the promising renewable top 12 building-block chemicals, has emerged as an attractive alternative for petroleum-based-product substitution [9,10]. By comparing with other renewable feedstock such as methanol and ethanol, glycerol (a) is less flammable and safer to handle due to a higher flashpoint (technical standpoint), (b) is less hazardous and toxic (environmental standpoint), (c) is more thermodynamically favourable (energy standpoint) and (d) has higher H2 production on the same basis of 1 mol of feedstock conversion [11,12,13]. Amongst all the possible routes of glycerol utilisation is the thermal transformation of glycerol to hydrogen via steam reforming (GSR). GSR is considered as one of the most economically feasible methods as compared with other thermal and biological counterparts [14,15]. From a circular carbon economy standpoint, GSR not only helps in lowering the production cost of biodiesel refinery but also plays an important role in the field of energy and fuels, which provides a blueprint for the development of the National Renewable Hydrogen Industry Plan and International Hydrogen Policy [16,17].
Based on the potential reactions of glycerol decomposition Equations (1)–(12) (see Table 1), GSR is highly favourable for H2 production where 7 mol H2 will be produced with the consumption of 1 mol glycerol molecule Equation (1). However, there are still many possible side reactions that might happen during thermal decomposition, including methanation, carbon deposition, glycerol oxidation and carbon gasification [18,19,20]. In order to eliminate the unfavourable side reactions, heterogeneous catalysts have been introduced into the reforming system such as catalysts based on Ni [21], Cu [22,23], Co [24,25], Pt [26,27] and Pd [28,29] to enhance the C–C and C–O cleavage. Amongst all the reforming’s catalysts, the Cu-based catalyst can be considered as one of the cheapest with high effectiveness in breaking the C–O bonds of glycerol and inducing the water gas shift reaction due to the high polarisation Lewis acid active sites [30]. However, Cu metallic sites are prone to sintering and metal agglomeration at high temperatures (>723 K) and, consequently, cause the loss of active sites and catalyst deactivation [31,32]. To overcome these shortcomings, researchers tend to use high surface area, tunable physiochemical properties and high meta-stability materials as support to enhance its catalytic activity and lifespan (i.e., Al2O3, SiO2 and CeO2) [33,34]. To date, the literature reported on the influence of CeO2 nanoparticle doping onto the Cu active sites is still limited, especially on engendering the glycerol reforming activity. For instance, in 2022, Wu et al. reported that the impregnation of Cu species onto the mesoporous CeO2 can enhance the water gas shift reaction and inhibits methanation, leading to a high H2 production; notably, the H2 production rate has increased from 125.08 (Ni/CeO2) to 195.57 µmol min−1 g cat−1 (Cu–Ni/CeO2) [35]. Furthermore, the intrinsic oxygen vacancies or defect sites of the CeO2 can induce the hydrogen spillover effect, which improves the glycerol conversion to H2 production [36].
Response surface methodology (RSM) is a well-established mathematical and statistical tool used to design empirical experimental models, build regression equations that describe the relative significance of each independent variable and determine the optimum reaction conditions based on the fit of the empirical model to a set of experimental data [37,38]. Under the RSM design-of-experiments central composite design (CCD) approach, a constant prediction of the variance at all points that are equidistant from the design centre can be attained, allowing a high precision of the predicted optimisation model. With its inherent orthogonality feature, central composite designs can create orthogonal blocks, letting model terms and block effects be independently estimated and minimising the variation in the regression coefficients. Furthermore, its rotatable designs provide constant prediction of the variance at all points that are equidistant from the design centre, which further enhance the quality of predication [39]. Unlike a three-level full-factorial design, both linear and quadratic models are able to be determined. It can significantly reduce the number of experimental runs required and variability of the multifactor studies without compromising on the accuracy and reliability of the model experiments. Generally, a conventional factorial design approach is used for screening purposes instead of optimisation purposes via the linear model (less precise) [40]. On the contrary, the RSM-CCD approach is used as an optimisation tool to model the nonlinear relationship between the input factors and output responses. Over the years, many researchers have adopted this statistical tool in various fields, not limited to dry reforming [41], methanation [42], electrolysis [43] and hydrothermal liquefaction [44].
Herein, the present paper aimed to provide an insight on the vapour-phase catalytic glycerol reforming (VPCGR) using a highly porous honeycomb-shaped CuO/CeO2 catalyst for sustainable H2 production. The main objectives of this study were as follows: (a) developing an easy handling synthesis method for a highly porous CuO/CeO2 catalyst; (b) analysing the textual structure properties of CuO/CeO2 using various characterisation techniques (i.e., BET, SAXS, SEM-EDX, AFM, PXRD and Sy-PXRD); (c) performing an optimisation analysis to attain the highest glycerol conversion and H2 production by varying the four different parameters (i.e., Cu loading, reaction temperature, weight hourly space velocity and glycerol concentration); and (d) evaluating the energy required for the VPCGR plant at a scale of 100 kg h−1 of glycerol feedstock.

2. Results

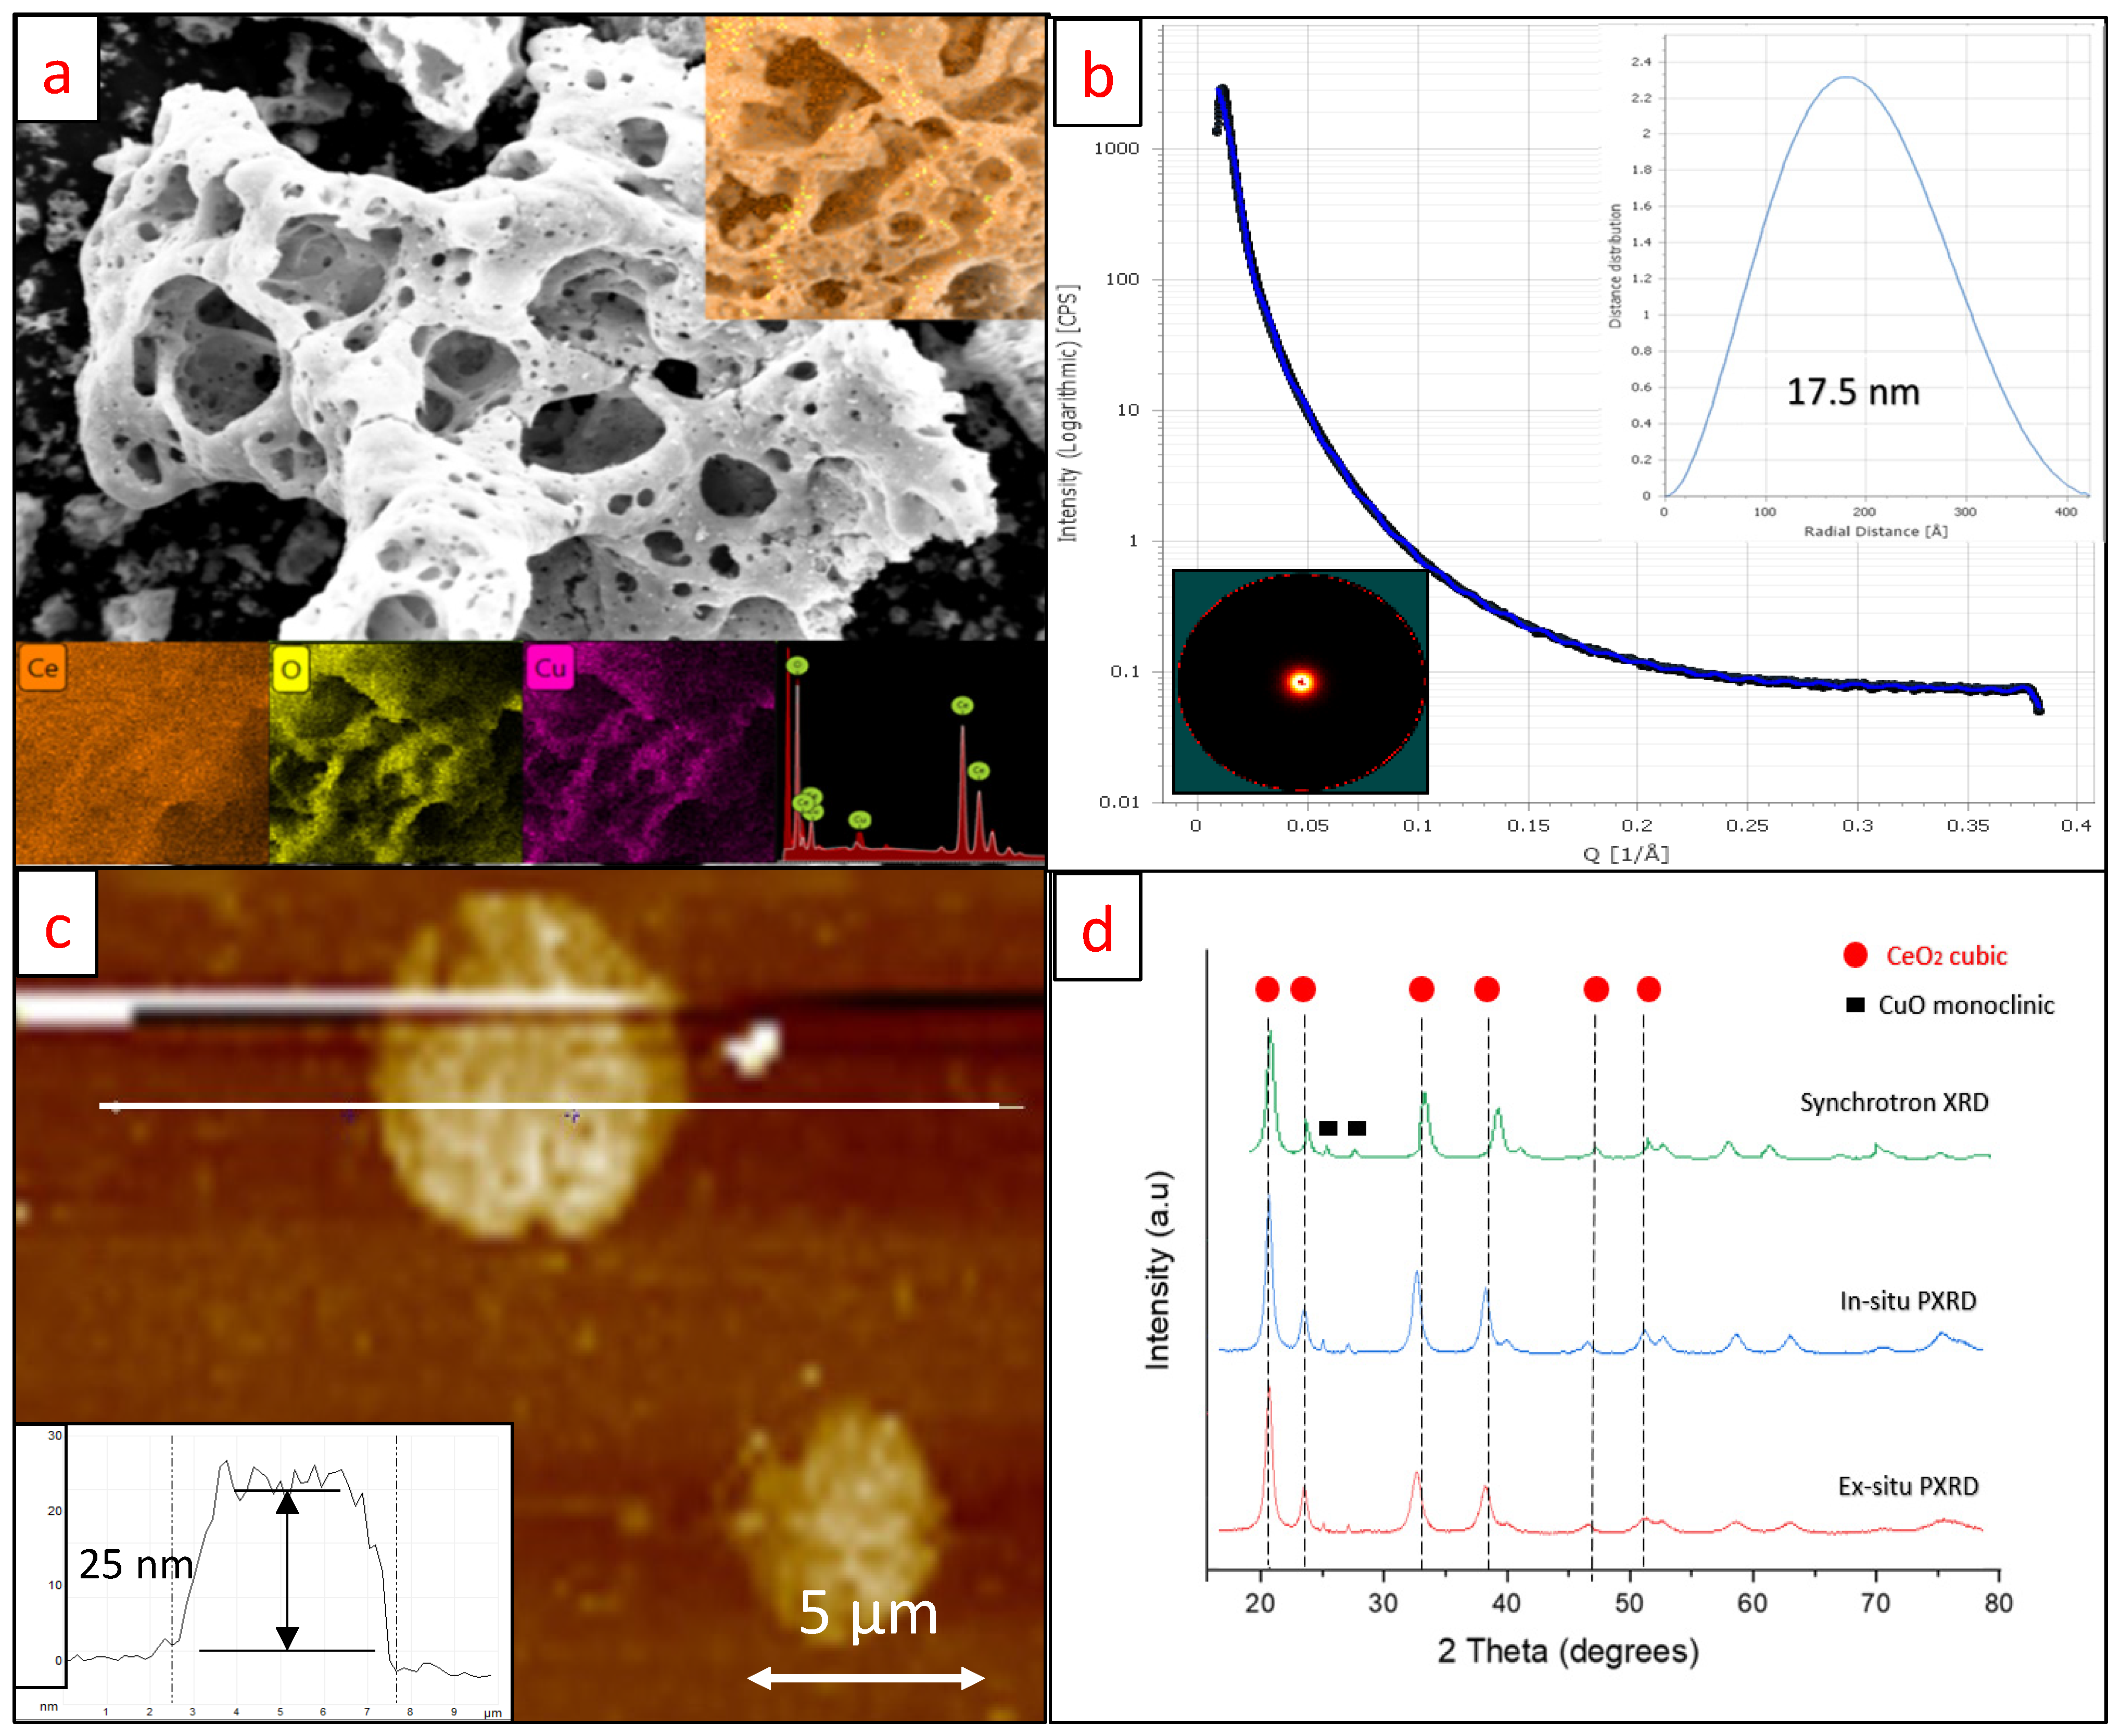
2.1. Textual and Physicochemical Properties of the Catalyst

Table 2 shows the textual and physicochemical properties of the 10 wt.% CuO/CeO2 nanoparticles (best case), including the actual Cu loading, crystalline size, surface area and height of the catalysts. Based on the SEM-EDX and XRF analyses, it is proven that the Cu particles were successfully impregnated on the surface of catalysts, forming a porous honeycomb-shaped morphology. In addition, from the SEM mapping analysis (Figure 1a), it can be seen that the Cu nanoparticles were homogeneously dispersed on the ceria support, indicating that the growth of the primary Cu nanoparticles was controlled and there was no agglomeration formation [45]. The observation is in good agreement with the SAXS (Figure 1b) and AFM (Figure 1c) analyses, corroborating that the average thickness (the lateral grain size) and particle size of CuO/CeO2 were 17.50 and 25.00 nm, respectively, confirming the consistency of the homogeneous formation of CuO particulates on the surface of CeO2.
Notably, via this impregnation-vacuum drying synthesis method, a small crystalline size of CeO2 in the range of 6.89–7.41 nm with the lattice constant in between 5.38 and 5.40 Å assigned to the (111) plane of the cubic-phase structure of CeO2 was attained. The CeO2 crystalline size obtained in CuO/CeO2 was much smaller as compared with other synthesis methods such as precipitation (9.5 nm) [46], incipient wetness impregnation (16.0 nm) [47] and hydrothermal methods (29.6 nm) [48]. Moreover, highly significant CuO (111) monoclinic peaks at 36.5 and 38.7 were observed in synchrotron PXRD compared with that in in situ and ex situ lab-scale PXRD, providing better reliability and higher precision for the material insight towards nano- or sub-atomic-level catalytic mechanism [49].

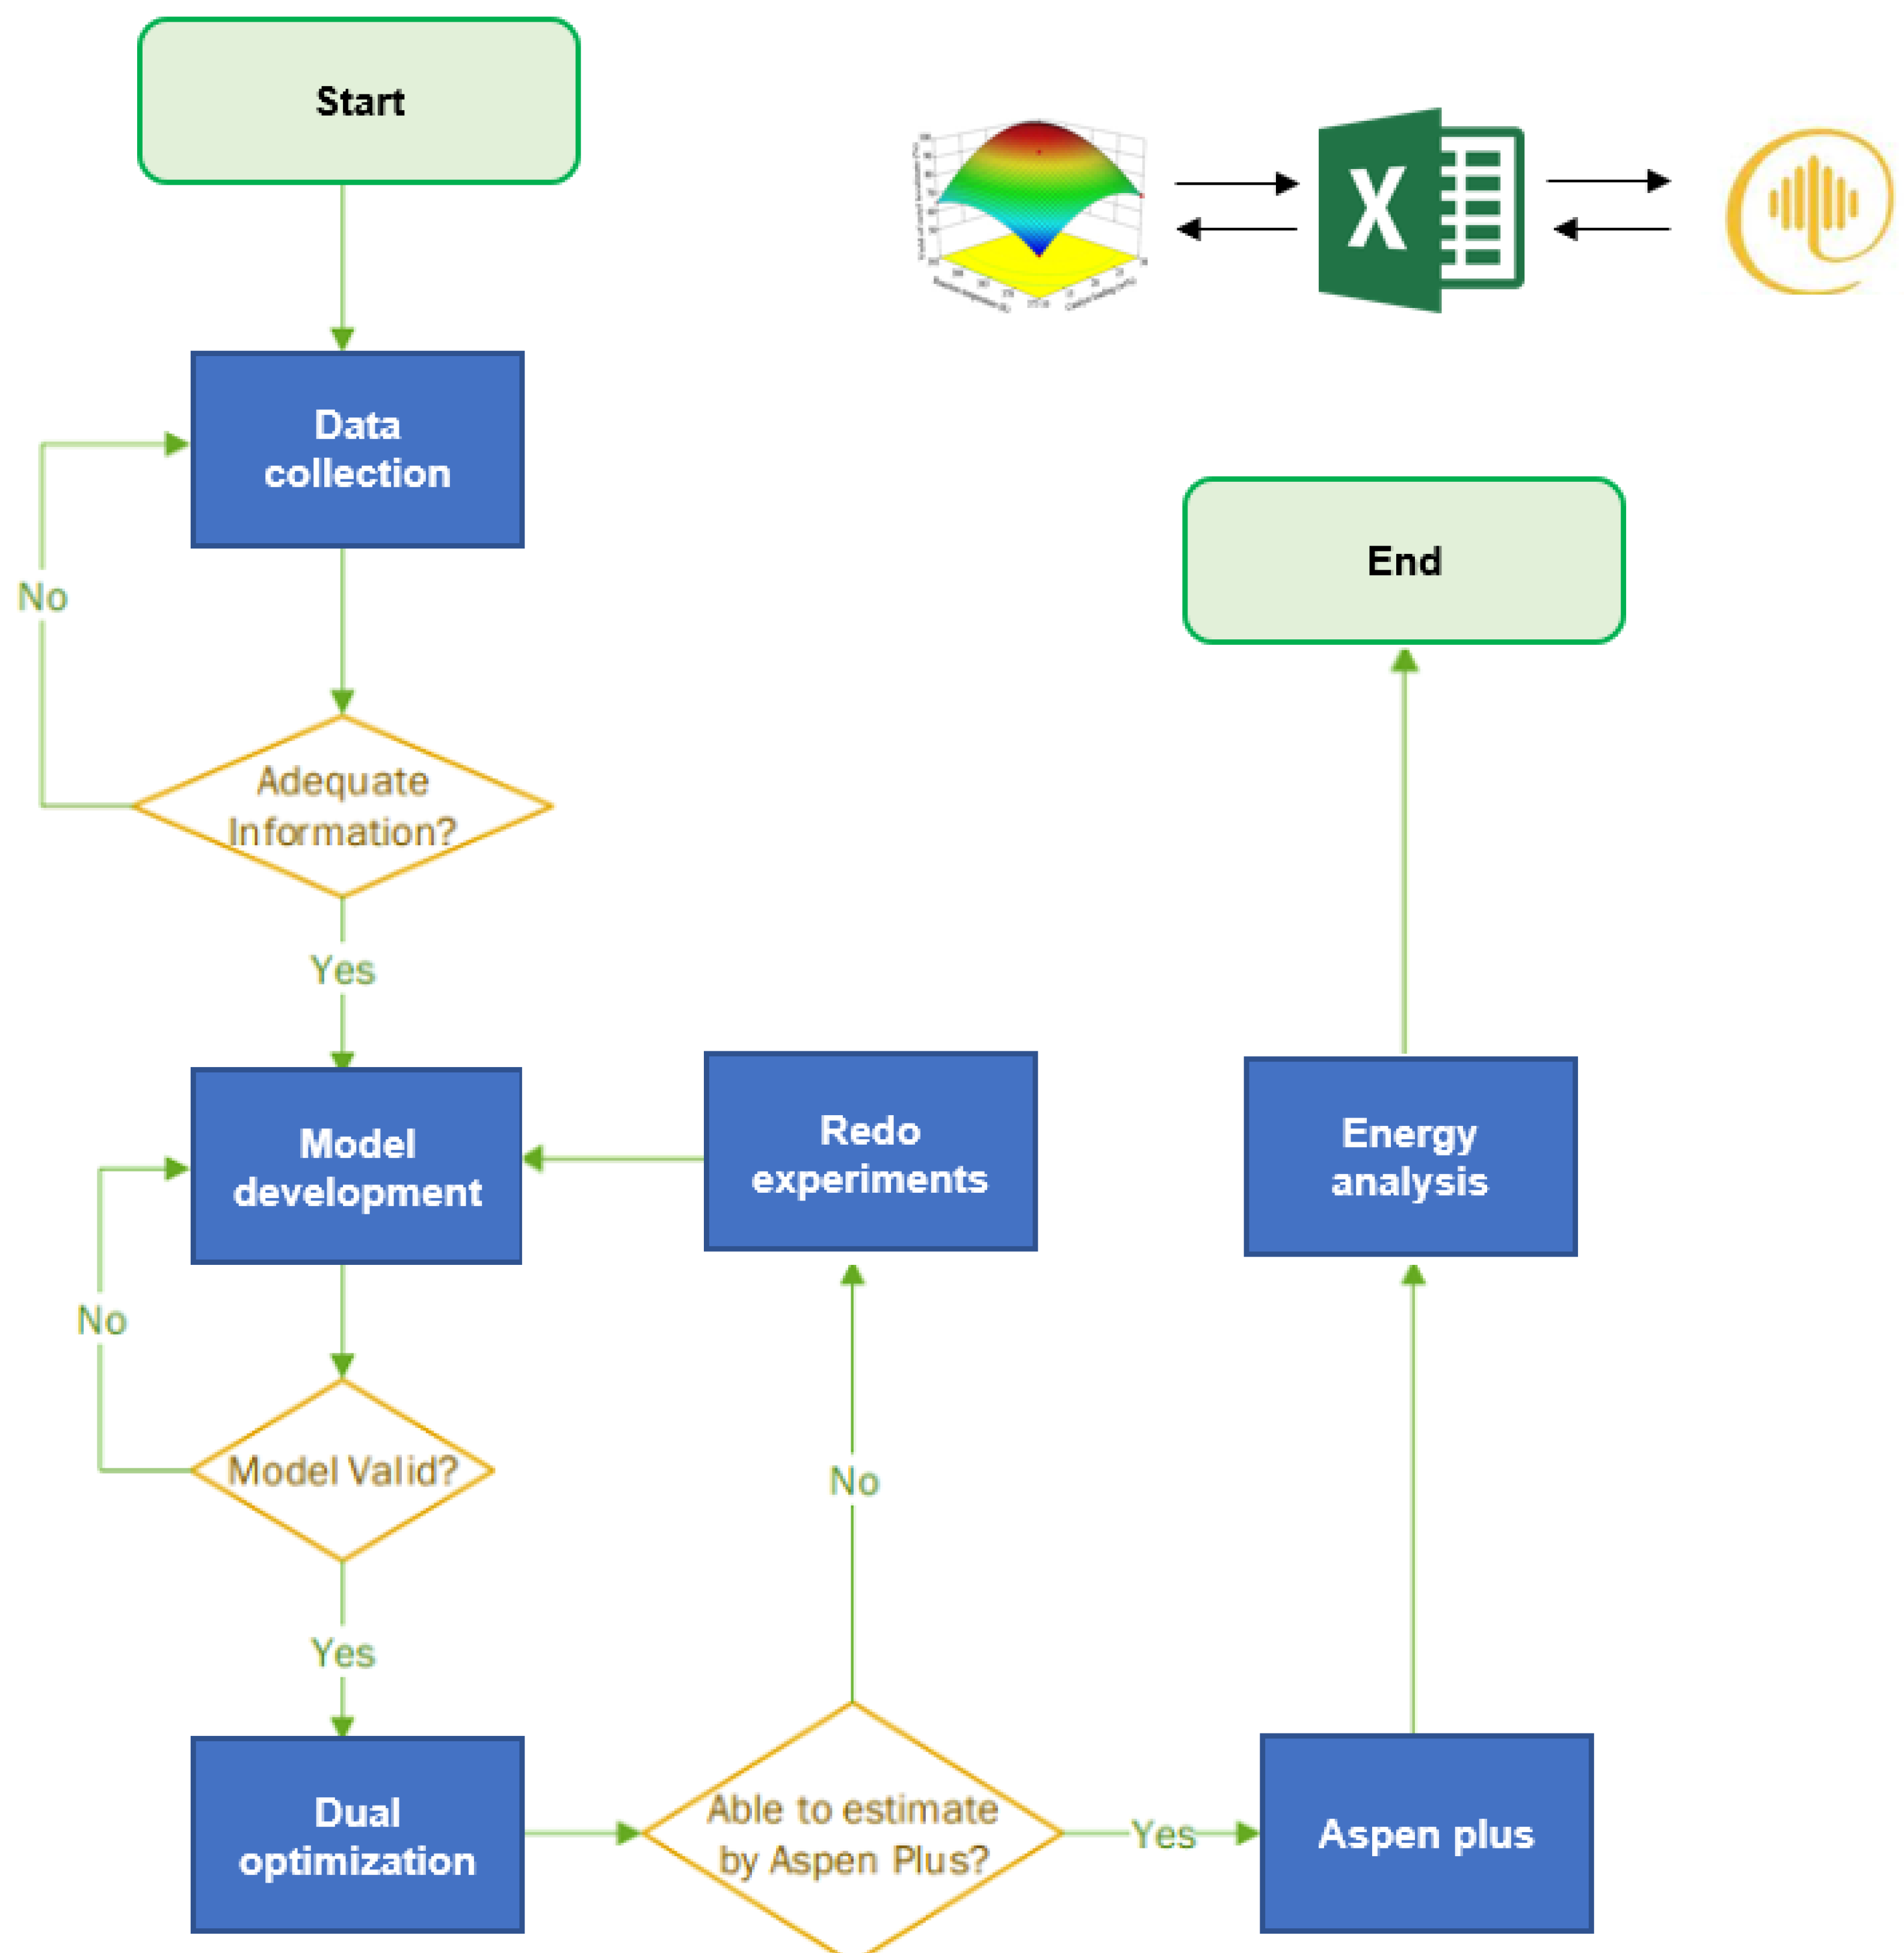
2.2. Dual-Criteria Joint Optimisation Approach

The dual-criteria joint optimisation for VPCGR was based on the objective function of maximising the glycerol conversion (%) and hydrogen production (vol.%). The best-fit optimised model was chosen based on the highest R2adj and R2pred, ensuring that the response variables are reliable and aligned with the model; obtaining the optimised model with the lowest standard deviation (SD), mean and Adeq precision was also incorporated as an analysis criterion to avoid the issue of multicollinearity between predictors and responses [50].

2.2.1. Mathematical Regression Model

The ANOVA regression responses on both rates of glycerol conversion (Y1) and hydrogen production (Y2) are shown in Table 3 and Table 4, respectively. The significance of each regression coefficient was determined using a p-value, and notably, the p-value for both models developed (<0.0001) was far less than 0.05, which indicates the significance of the model [51]. Apart from that, the regression analysis also shows that Y1 and Y2 were following different models, which are quadratic and linear, respectively. The equations of the significant terms obtained for the rate of glycerol conversion (Y1) and hydrogen production (Y2) are stated in Equations (13) and (14):
Rate of glycerol conversion, Y1 = 81.39 + 2.54 A + 8.88B + 2.12C + 1.95D − 0.5625AB − 1.56AC + 1.19AD + 0.8125BC − 0.9375BD − 0.4375CD + 0.6A2 − 1.28B2 − 1.4C2 + 1.1 D2
Rate of hydrogen production, Y2 = 70.78 + 1.54 A + 3.88 B + 1.79 C + 0.5342 D
On the other hand, the F-value Y1 (38.88) and Y2 (53.60) further confirmed the significance of both models where there was only a 0.01% chance that an F-value this large could occur due to noise [52]. From Figure S1, the values of R2 and Adeq precision for both models were above 0.85 and 4, respectively, which implies that the model is reliable and can be used to precisely navigate the design space under adequate noise conditions [53]. Lastly, the coefficient of variation (C.V.), or known as the standard deviation divided by the mean obtained for both models, was less than 5, which signifies the accuracy of the models, in which there is a lower degree of variation to the mean value [54].

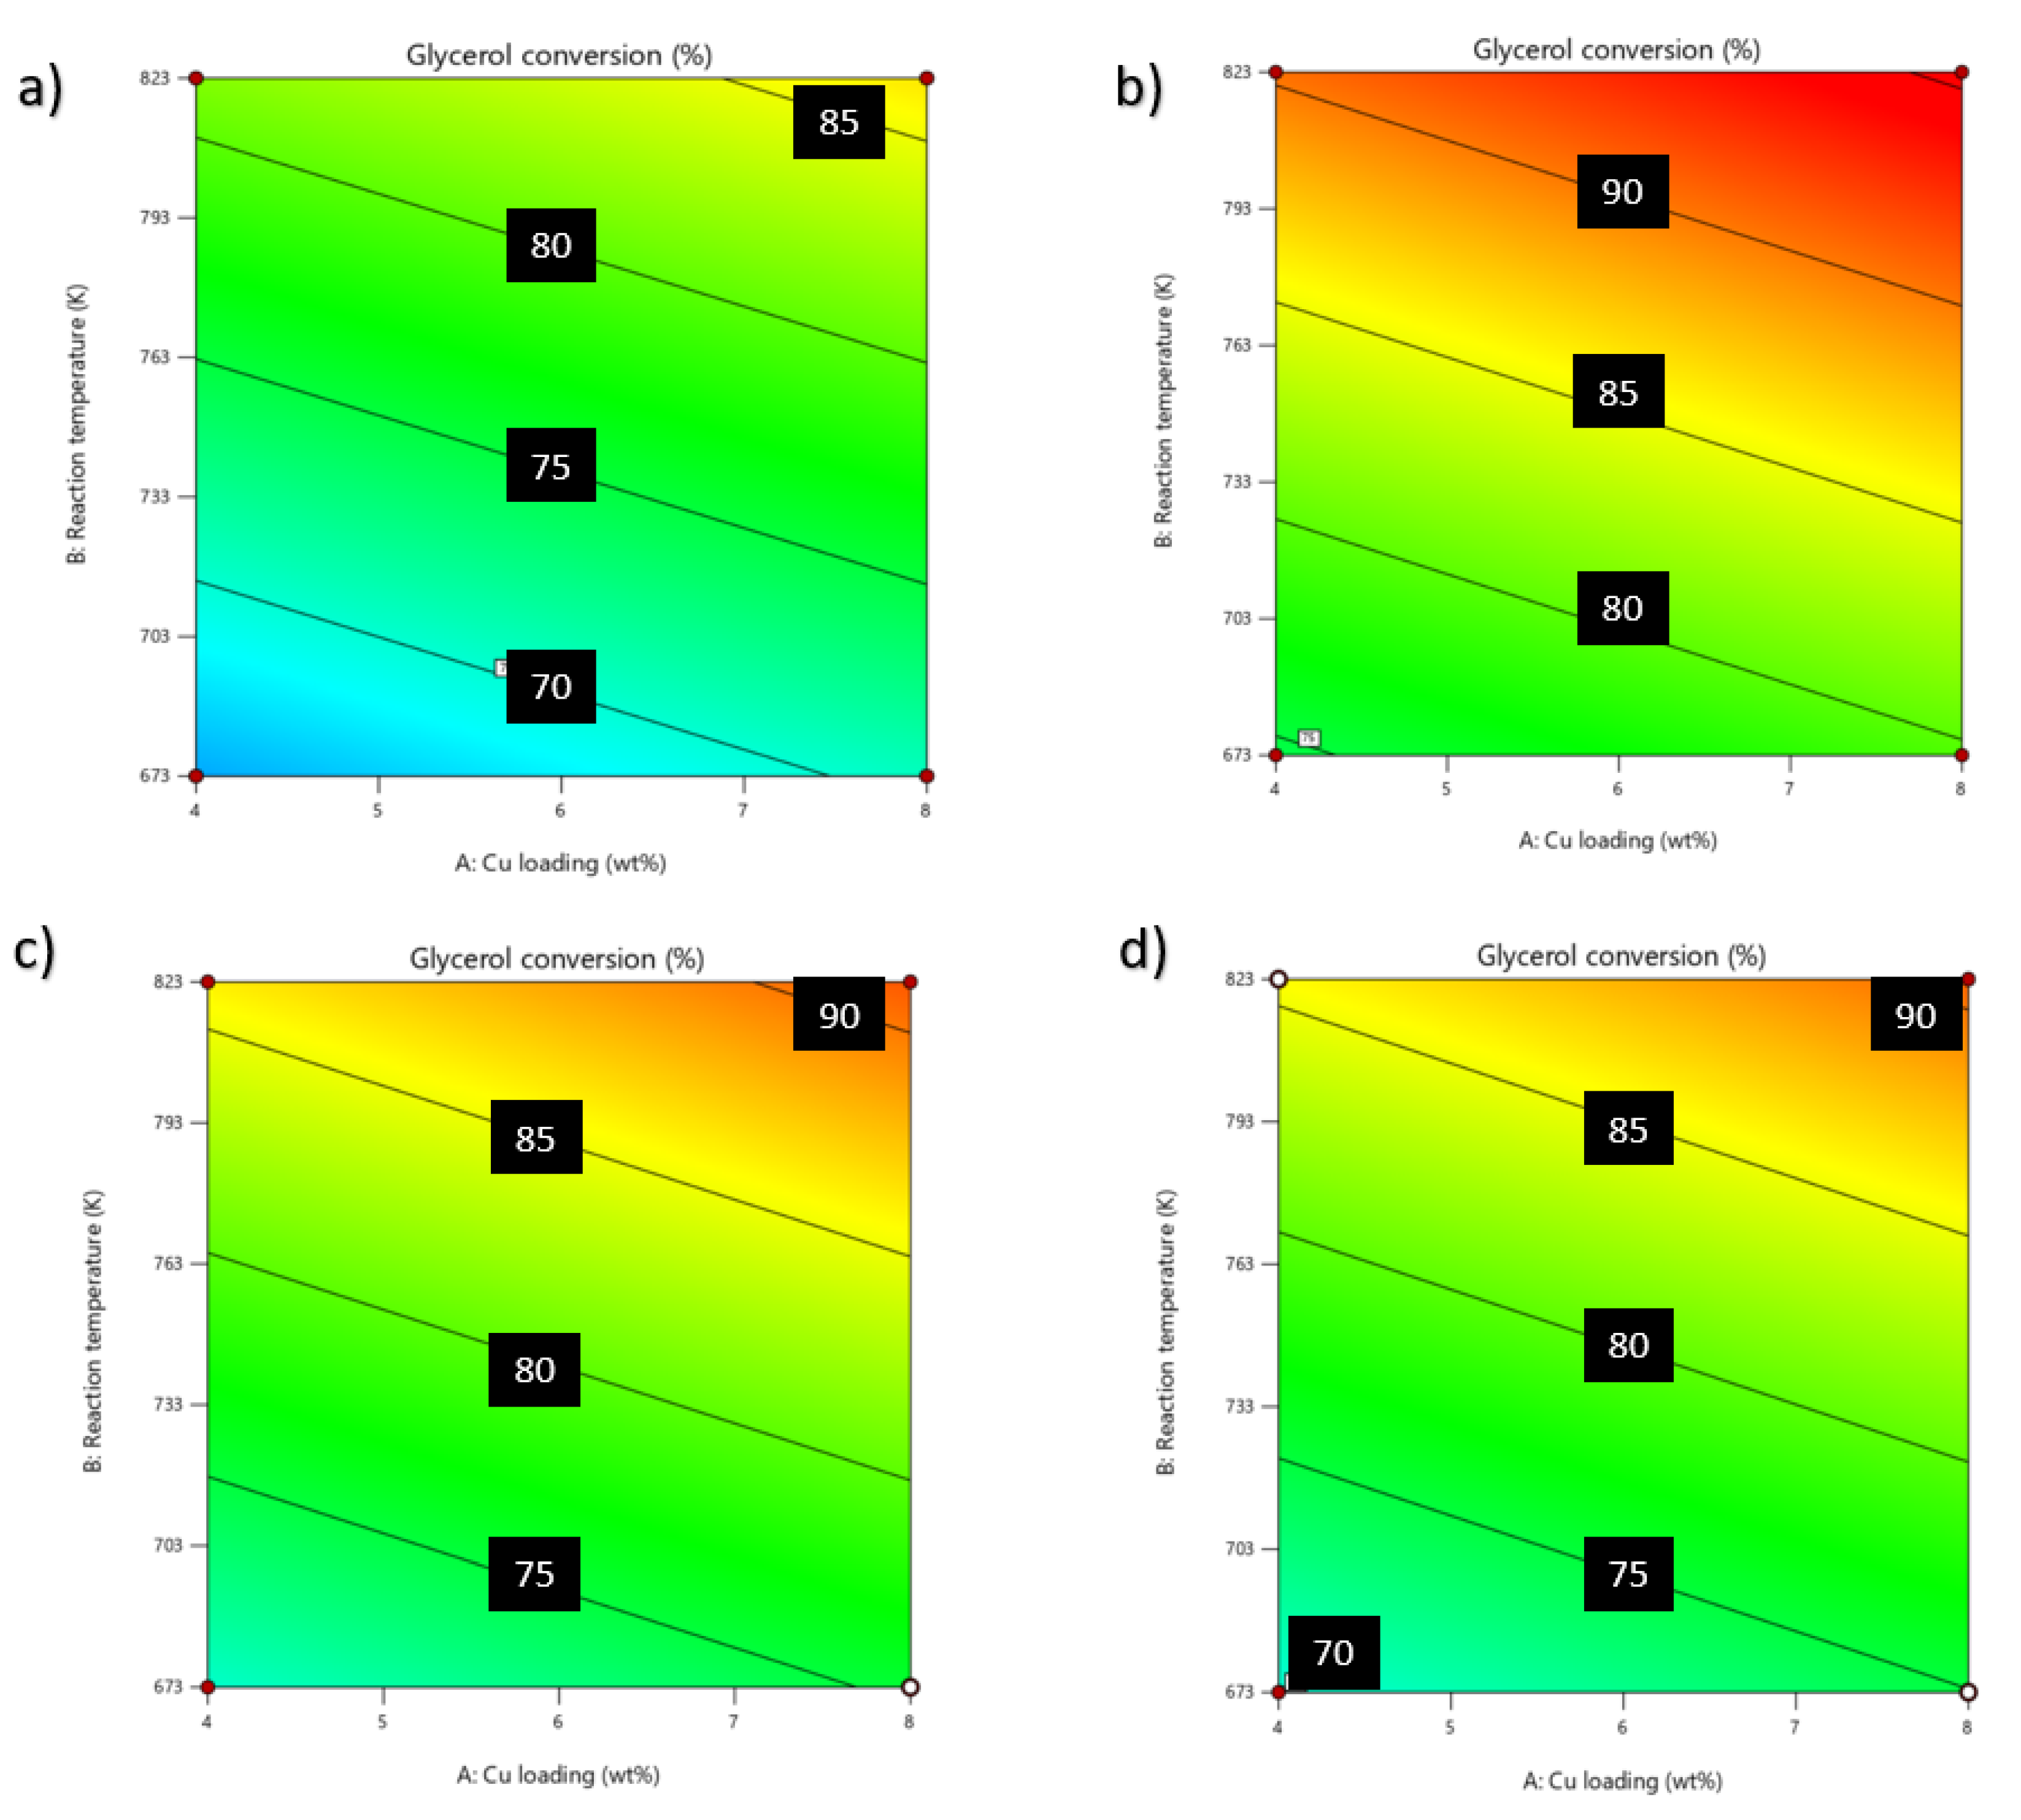
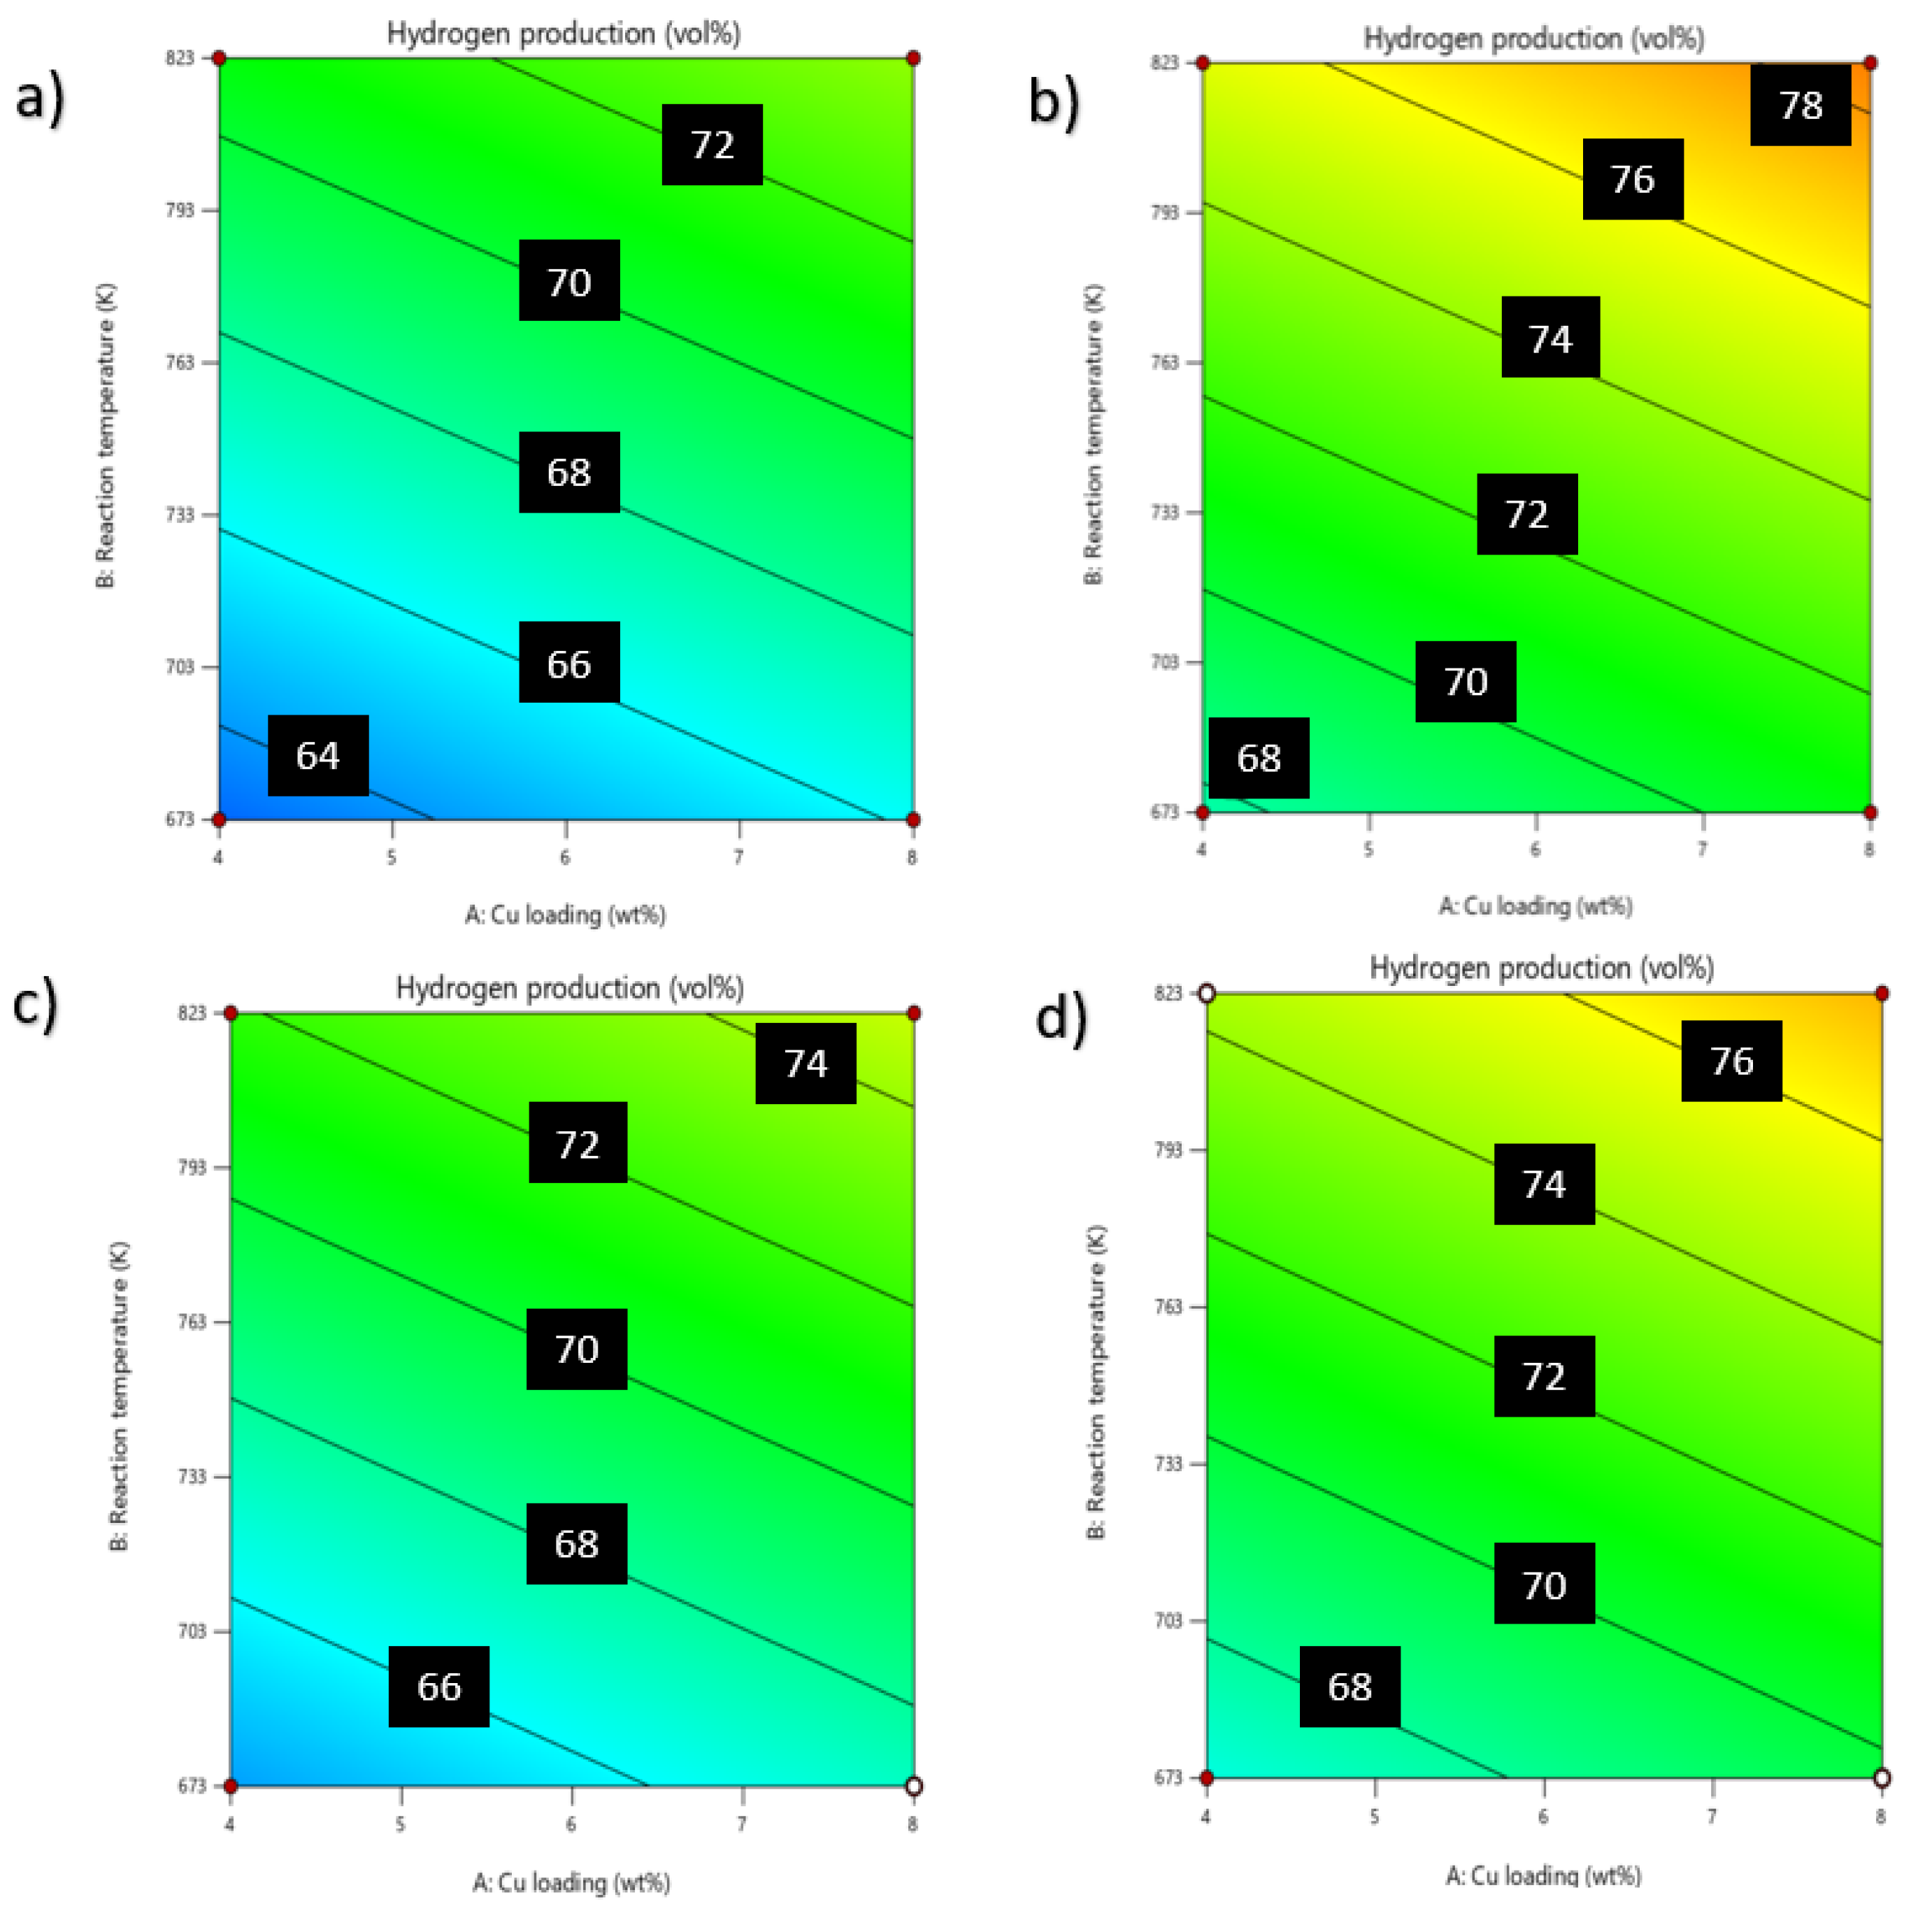
2.2.2. Parametric Analysis

The relationship of each independent variable was illustrated in contour plots as shown in Figure 2 (Y1) and Figure 3 (Y2). Each response surface was plotted against another response, which represents the combination of two reaction variables with another two-variable response fixed at a central level.

Effect of Cu Loading on CuO/CeO2 Catalyst (wt.%)

Cu-based catalysts have been widely reported as effective active sites in bi- or multimetallic-site catalysts due to the superior performance for selective C–O bond cleavage as compared with its non-noble metal counterparts (i.e., Ni and Co), thus enhancing the selectivity towards H2 production from glycerol [12,55]. Expectedly, the effect of Cu loading was directly proportional to the glycerol conversion, as there are more active sites available for C–C and C–O bond cleavage of glycerol molecules with an increase in Cu loadings. However, the Cu concentration on the CuO/CeO2 catalyst was found to be not the most predominant factor as compared with the reaction temperature in terms of glycerol conversion. On the other hand, remarkably, although with a high loading of Cu on the CeO2 support (10 wt.%), no sign of a negative trend in the reduction of H2 selectivity was observed. This phenomenon indicates that the prepared CuO/CeO2 via this impregnation-vacuum drying synthesis method has suppressed the agglomeration of Cu clusters (i.e., inhomogeneity) during the nucleation process, which affects their catalytic cracking activity [56]. In all likelihood, a stronger interaction between Cu species and CeO2 was developed by the impregnation-vacuum drying method, leading to better Cu species dispersion on CeO2 [57].

Effect of Reaction Temperature (K)

From Figure 2 and Figure 3, it can be observed that temperature was the most dominant factor in enhancing the glycerol conversion. Even though in a low WHSV (i.e., 1 h−1) and Cu loading (i.e., 4 wt.%) experimental condition, a positive effect in glycerol conversion can still be observed with an increase in the reaction temperature. This phenomenon can be explained through the Le Chatelier principle where an increase in the reaction temperature for an endothermic reversible reaction would favour the forward reaction; therefore, an increase in the reaction temperature above 773 K will significantly enhance both glycerol reforming Equation (1) and WGS Equation (2) reactions. Likewise, the elevation of the reaction temperature also shows a significant positive effect on the H2 composition. From Figure 4, it can be seen that the production of H2 was more significant as the reaction temperature increased above 723 K. For instance, the H2 selectivity increased by 4 vol.% when the reaction temperature elevated from 623 to 723 K, whereas it increased by 7 vol.% when the reaction temperature elevated from 723 to 823 K. This phenomenon is in good agreement with previous studies and might be due to the side reactions such as glycerol oxidation Equations (5)–(8) and CO2 reforming of methane Equation (10), which further enhances the cracking of the volatile matter of glycerol to yield hydrogen [58].

Effect of Weight Hourly Space Velocity (h−1)

From the previous literature, an observation was reported in which the product gas composition, especially in glycerol reforming, was far from the equilibrium values, indicating that there is a need for an effective catalyst for the conversion of glycerol at a lower operating temperature [59,60]. On this basis, WHSV plays a crucial role in enhancing not only glycerol conversion but also H2 selectivity. It can be seen from Figure 3a,b and Figure 4a,b that both H2 selectivity and glycerol conversion rapidly increased with the increase in the WHSV (or known as the water–carbon ratio as the catalyst loading is fixed). However, when the WHSV was above 2 h−1, the increase in H2 selectivity and glycerol conversion becomes slower. This is because when the WHSV ratio was low (<1), the increase in the WHSV was favourable towards the glycerol reforming reaction. At the same phase, the increase in WHSV was also favourable towards the endothermic reactions such as WGS reaction Equation (2) and methane reforming reaction Equations (3) and (4). However, when the WHSV was above 2, most reactions almost reached equilibrium (a theoretical water–carbon ratio of 3 is the most optimum to complete the glycerol reforming reaction with water) [61]. On this basis, the optimum WHSV was found to be 2 h−1; in future work, this number can be set as a reference for other researchers working in similar field.

Effect of Glycerol Concentration (wt.%)

Based on the plots in both Figure 2 and Figure 3, it can be deduced that the effect of glycerol concentration on the glycerol conversion rate and H2 production was less significant as compared with other variables. In addition, the increase in glycerol concentration will only enhance the H2 production but will not be prominent towards the rate of glycerol conversion. Although at a high glycerol reaction condition of 20 wt. % at the reaction temperature of 748 K, Cu loading of 6 wt.% and WHSV of 1.5 h−1 can yield 72 vol.% of H2, glycerol conversion was below 85%, which is not feasible for industrial-scale glycerol reforming. Furthermore, much literature has reported that a high concentration of glycerol (>20 wt.%) will cause a decrease in the number of active sites of the catalyst due to the increase in surface coverage, thus hindering a steady flow mass transfer [26,62]. This is because the increase in the viscosity of glycerol will reduce the mass transfer performance between the glycerol and liquid product on the catalyst surface (an immiscible three-phase system, which has a low mass transfer rate), thereby lowering the H2 selectivity and glycerol conversion [63,64].

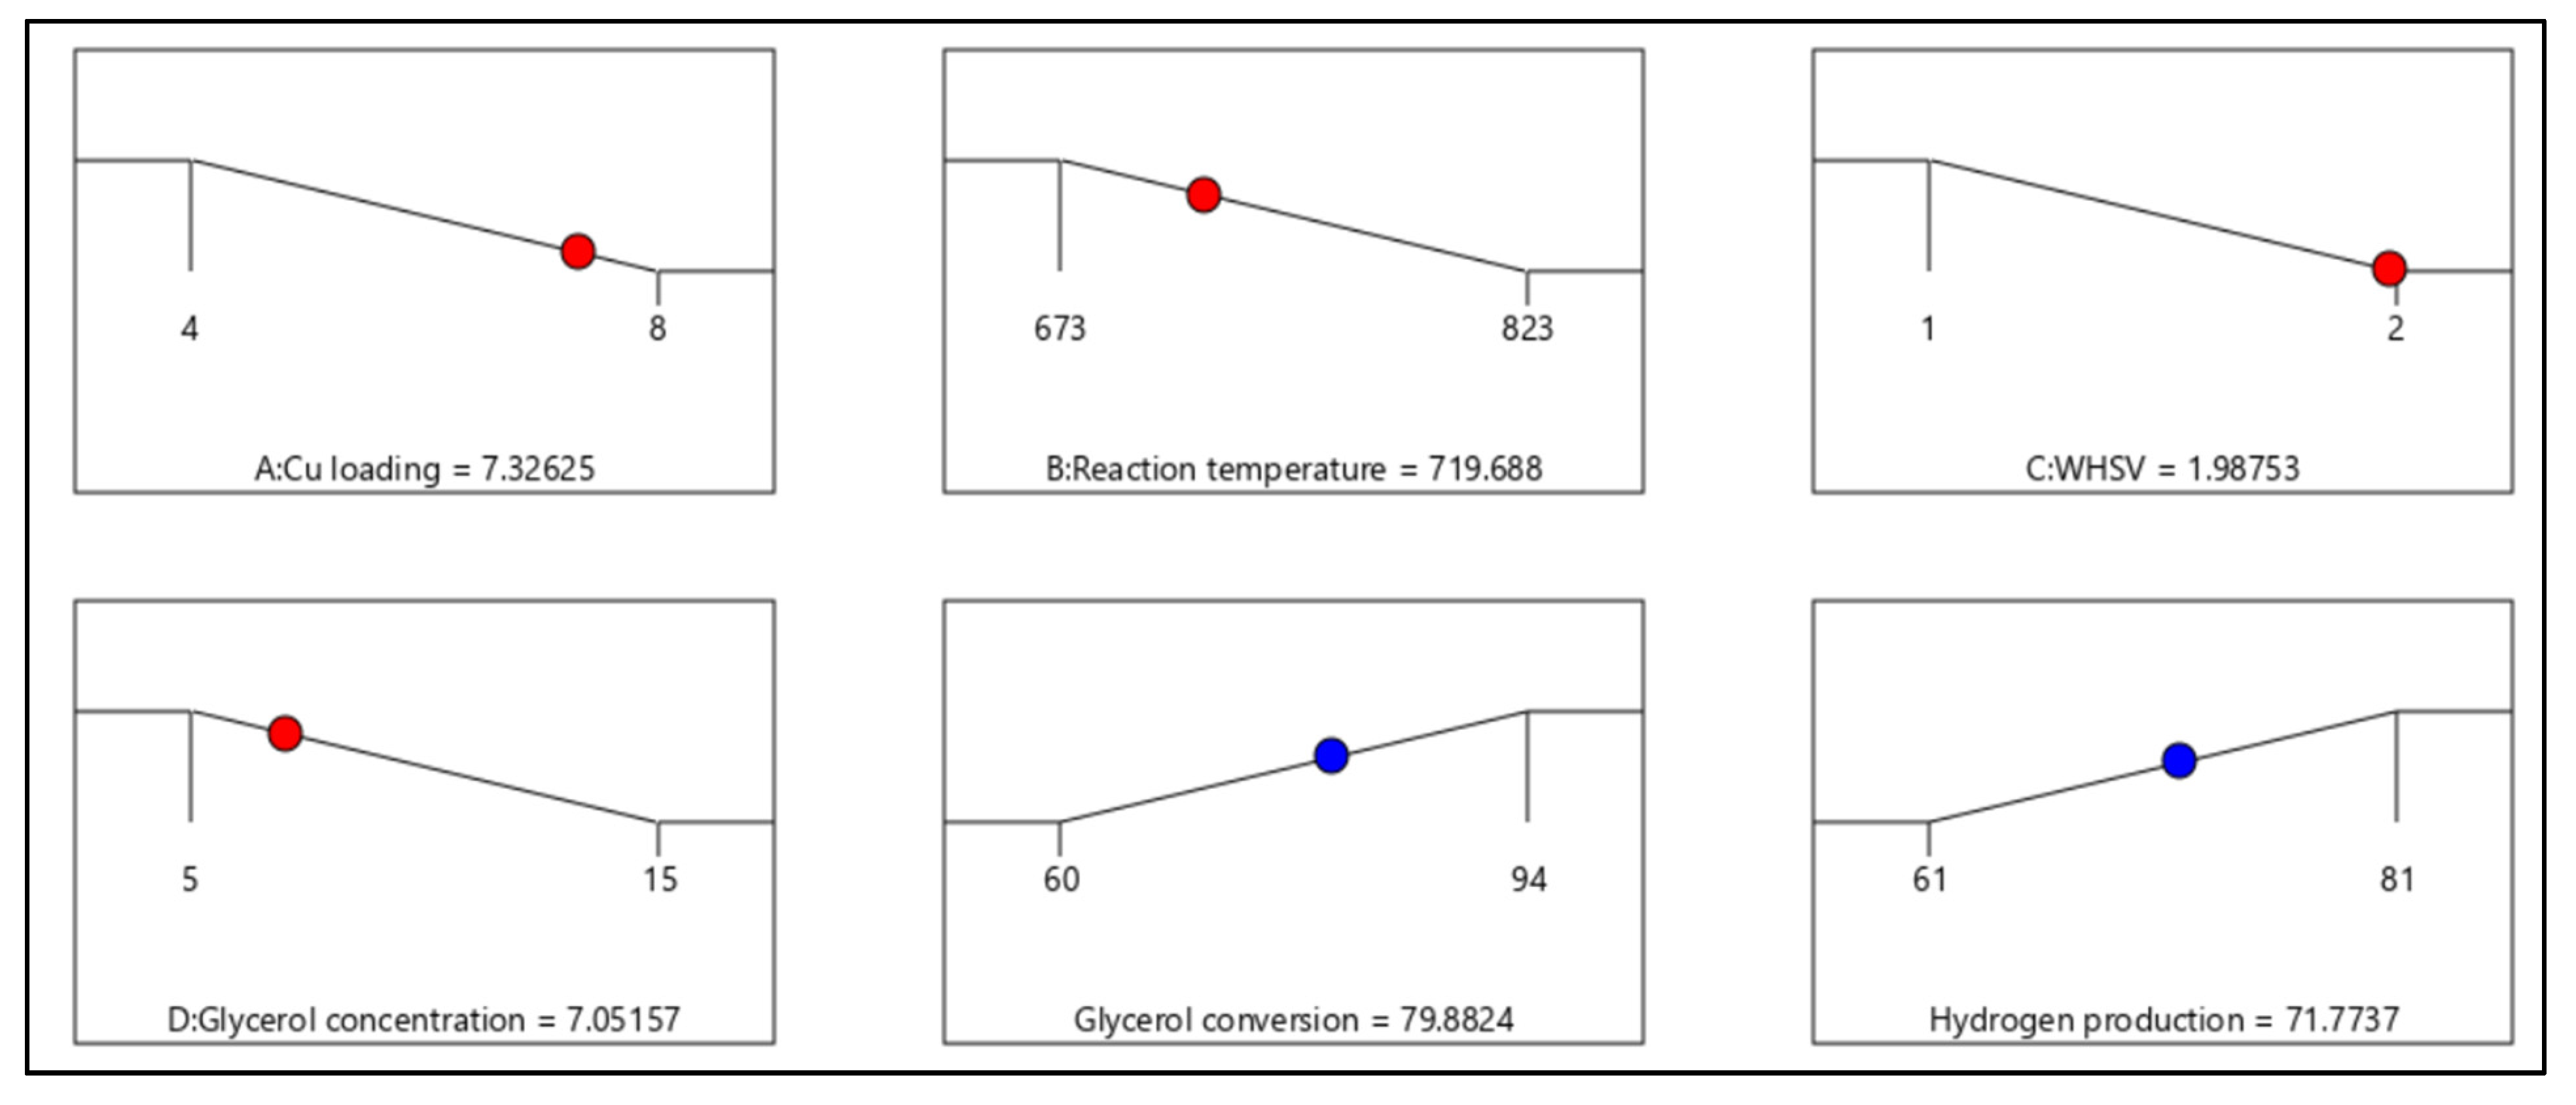
2.2.3. Post Confirmation Run Analysis

The confirmation test was conducted based on the predicted optimal reaction condition from the model (reaction condition: Cu loading = 7.3 wt%, reaction temperature = 719.7 K, WHSV = 1.99 h−1 and glycerol concentration 7.05 vol%) (see Figure 4). Notably, based on the three-post-confirmation runs, very close results were attained under the optimal condition with a standard deviation of 3.38 and 1.53 for glycerol conversion and hydrogen production, respectively. Moreover, the 95% predicted intervals (i.e., both low and high 95% PI) were in a satisfying range, suggesting that this model is highly accurate, which can be used as a reference for future work (see Table 5).

2.3. Energy Analysis via IAMD Approach

The optimisation of the heat and energy integration networks of the VPGGR plant at a scale of 100 kg h−1 of glycerol (reaction condition: Cu loading = 7.3 wt.%, reaction temperature = 719.7 K, WHSV = 1.99 h−1 and glycerol concentration = 7.05 vol.%) was conducted using the Aspen Energy Analyzer. The heat and cooling utilities were found to be 158.2 MJ/h and −36.7 MJ/h, respectively, before implementing the heat exchanger network synthesis (HENS) modification. Notably, after the implementation of the heat recovery system, they were reduced to 111.3 MJ/h and −14.7 MJ/h for heat and cooling utilities, indicating that 68.9 MJ/h of energy reduction was achieved.

3. Materials and Methods

Figure 5 shows the research flow adopted for the work, starting from (a) catalyst synthesis, (b) design of experiment (DOE) for VPCGR, (c) response surface methodology optimisation, and (d) energy analysis via the integrated “Aspen Plus V12-Microsoft Excel- Design-Expert (IAMD) approach.

3.1. Samples and Catalyst Preparation

The analytical-grade pure glycerol (98%), cerium (III) nitrate hexahydrate and copper (II) acetate hydrate were obtained from Sigma Aldrich (St. Louis, MI, USA). The glycerol was used as a feedstock without further pretreatment, whereas the highly porous honeycomb-shaped CuO/CeO2 was synthesised using a modified preparation method reported in previous studies [65,66]. Firstly, a mixture of 2.5 g cerium (iii) nitrate hexahydrate with 80 mL ethylene glycol and 15 mL of distilled water was placed in a beaker and stirred for 12 h at 353 K. After that, the slurry was vacuum-dried and calcined at 293 K and 673 K, respectively. To synthesise the honeycomb-shaped CuO/CeO2, a predetermined Cu loading of between 2 and 0 wt.% was added into the aqueous dispersion solution of CeO2 at a reaction temperature of 353 K for 12 h with continuous stirring at 600 rpm. Lastly, the remaining samples were centrifuged and washed with ethanol before annealing at 200 °C for 6 h in a 5 mol.% H2/N2 environment.

3.2. Catalyst Characterisation

A series of characterisation was performed to further elucidate the intrinsic physicochemical properties of the highly porous honeycomb-shaped CuO/CeO2, including scanning electron microscopy (SEM; Phenom XL Desktop SEM, Thermo Scientific, Waltham, MA, USA), small-angle X-ray scattering analysis (SAXS; N8 horizon, Bruker, Germany) and atomic force microscopy (AFM; Dimension Icon, Bruker, Germany); carried out using the AFM probe of diluted “CuO/CeO2”/isopropanol by a simple dispersion method). Ex situ XRD and in situ PXRD (inert N2 atmosphere) were performed using D8 Advance (Bruker, Germany), and synchrotron PXRD coupled with a diffraction beamline of 10BM-1 at a wavelength of 22 keV (0.56 Å) was used to analyse the crystallite phases of the samples (ANSTO, Sydney, Australia).

3.3. Vapour Phase Catalytic Glycerol Reforming

The VPCGR experiments were carried out in a fixed-bed-reactor system (see Figure S2). Firstly, a predetermined loading of the CuO/CeO2 catalyst was placed in the middle of the fixed-bed reactor (Reactor:Shikoku Instrumentation μ Reactor EX, 2.45 GHz, maximum power 1 kW, length = 500 mm and internal diameter = 13 mm) in between the silica bed materials. The catalysts were being reduced using 5 mol.% H2/N2 stream (50 mL/min) at 573 K for 3 h, followed by purging of pure N2 at 50 mL/min to remove the remaining H2 inside the system. Afterward, the vapour-phase glycerol (first stage—100 g of glycerol solution was heated above 523 K) was subjected into the fixed-bed reactor to induce a secondary cracking of the volatile matter of glycerol. Subsequently, the non-condensable gases were collected and analysed using gas chromatography utilising an online micro gas chromatograph (MicroGC 3000A) equipped with a TCD detector using a Molecular Sieve 5A column (10 m × 320 μm × 12 μm) with Ar as the carrier gas. Meanwhile, the glycerol concentration was measured using gas chromatography (GC 2010, Shimadzu, Australia) equipped with a flame ionisation detector (FID) and a column of Agilent DB-WAX, USA (Agilent, 30 m × 0.32; mm × 0.50 ID).

3.4. Optimisation Study

The optimisation of the VPCGR process was performed using a composite experimental design (CCD) response surface approach (Design-Expert® software version 13.0.1.0, State-Ease, Minneapolis, MN, USA) [52]. The independent variables (V), namely (a) the amount of Cu loaded on CeO2 (2–10 wt.%), (b) reaction temperature (598–898 K), (c) weight hourly space velocity (0.5–2.5 h−1), and (d) glycerol concentration (5–20 wt.%) were chosen to be optimised, and the response variables were (Y1) glycerol conversion (%) and (Y2) H2 production (vol%) (see Table 6). To fit a second-order polynomial model with the experimental data through a response surface regression protocol, Equation (15) was adopted:
Y = β0 + ∑j = 1nβjXj + ∑j = 1nβjjX2j + ∑j=1n − 1∑I = 1nβjiXjXi
where Y is the response variable (glycerol conversion or H2 production); n denotes the number of analysed factors; Xi and Xj are the uncoded independent variables; and β0, βi, βii and βij are the model coefficients.

3.5. Energy Analysis

To further investigate the feasibility of glycerol reforming in an industrial scale, energy assessment is an important criterion in decision-making, specifically to improve the facility energy performance [67]. In this study, the IAMD approach was adopted to assess the energy required from the VPGSR to provide a preliminary overview of VPGSR at a large industry scale. The VPCGR model is simulated using Aspen Plus V12, which comprises 6 units, namely mixer (B1), heat exchanger (H1, H2), reformer (R1, R2) and pump (P1) (see Figure S3). Firstly, the predicted experimental data obtained from the mathematical model were normalised in Microsoft Excel 2020 to obtain a complete 100% carbon balance (i.e., sum of CO2, CO and CH4). Then, the block named “VPCGR”, known as the “black box model”, was used in Aspen Plus V12 (NRTL-RK was used as the thermodynamic package) to link Microsoft Excel 2020. Lastly, to achieve an economically energy-saving plant, the Heat Exchanges Networks Synthesis (HENS) study was performed using the built-in Aspen Plus Energy Analyzer (Aspen Technology, Bedford, MA, USA). To follow the chemical industrial energy application boundary, 10 K was set as the minimum temperature difference ΔTmin, ensuring an effective and feasible analysis.

4. Conclusions

In this work, we presented a new synthetic route to develop a honeycomb morphology CuO/CeO2 catalyst with a highly effective catalytic reforming activity. Under the reaction conditions of Cu loading 8 wt.%, reaction temperature 823 K, WHSV 2hr−1 and glycerol concentration 15 wt.%, the prepared CuO/CeO2 managed to yield high glycerol concentration and H2 production of 94% and 81 vol.%, respectively. Below are some of the key takeaways from this work:
(a)
A small crystalline size of CeO2 in the range of 6.89–7.41 nm was observed in PXRD, which is much lower compared with other synthesis methods, suggesting that the prepared impregnation-vacuum drying synthesis method is feasible to be adopted to a large-scale process.
(b)
No Cu agglomeration was observed in the catalyst even at high Cu loading, suggesting that the Cu elements were homogeneously dispersed throughout the CeO2 support.
(c)
From the experimental work, the highest glycerol conversion (94%) and H2 production (81 vol.%) can be obtained under the reaction conditions of the amount of Cu species loading (10 wt.%), reaction temperature (823 K), WHSV (2hr−1) and glycerol concentration (15 wt.%).
(d)
The predicted optimised condition with the lowest standard deviation (reaction condition: Cu loading = 7.3 wt%, reaction temperature = 719.7 K, WHSV = 1.99 hr−1 and glycerol concentration 7.05 vol%) was deduced from the RSM CCD model, suggesting that this model can be applied in a large bench-scale study for benchmarking purposes.
(e)
Principal component analysis (PCA) can be performed as a future work to identify the main correlations between the domain factors that enhance the H2 production.
(f)
Under the optimum condition, the HENS analysis shows that the VPCGR plant (scale: 100 kg hr−1) requires 111.3 MJ/h and −14.7 MJ/h for heat and cooling utilities, respectively; this result can be set as a reference for scale-up purposes.

Supplementary Materials

The following supporting information can be downloaded at: https://0-www-mdpi-com.brum.beds.ac.uk/article/10.3390/catal12090941/s1, Figure S1: Predicted vs. actual data: (a) glycerol conversion and (b) hydrogen production. Figure S2: Schematic diagram of the VPCGR experimental set-up. Figure S3: Aspen Plus Flow diagram for VPCGR.

Author Contributions

A.C.M.L.: original draft, data curation, formal analysis, investigation and Software. S.P.S.: formal analysis and writing—review and editing. S.B.: formal analysis, supervision, writing—review and editing and investigation. All authors have read and agreed to the published version of the manuscript.

Funding

L.A.C.M. would like to thank the Australian Government for providing financial support (Australia Commonwealth Research Training Program) to this project. In addition, the authors would also like to acknowledge the Melbourne Centre for Nanofabrication (MCN) in the Victorian Node of the Australian National Fabrication Facility (ANFF) and Australian Nuclear Science and Technology (ANSTO) for AFM and synchrotron PXRD characterisations.

Conflicts of Interest

The authors declare no conflict of interest.

References

  1. Corral-Montoya, F.; Telias, M.; Malz, N. Unveiling the political economy of fossil fuel extractivism in Colombia: Tracing the processes of phase-in, entrenchment, and lock-in. Energy Res. Soc. Sci. 2022, 88, 102377. [Google Scholar] [CrossRef]
  2. Liu, W.; Zuo, H.; Wang, J.; Xue, Q.; Ren, B.; Yang, F. The production and application of hydrogen in steel industry. Int. J. Hydrogen Energy 2021, 46, 10548. [Google Scholar] [CrossRef]
  3. Mehrpooya, M.; Habibi, R. A review on hydrogen production thermochemical water-splitting cycles. J. Clean. Prod. 2020, 275, 123836. [Google Scholar] [CrossRef]
  4. Habib, M.A.; Harale, A.; Paglieri, S.; Alrashed, F.S.; Al-Sayoud, A.; Rao, M.V.; Nemitallah, M.A.; Hossain, S.; Hussien, M.; Ali, A.; et al. Palladium-Alloy Membrane Reactors for Fuel Reforming and Hydrogen Production: A Review. Energy Fuels 2021, 35, 5558. [Google Scholar] [CrossRef]
  5. Zhang, B.; Zhang, S.-X.; Yao, R.; Wu, Y.-H.; Qiu, J.-S. Progress and prospects of hydrogen production: Opportunities and challenges. J. Electron. Sci. Technol. 2021, 19, 100080. [Google Scholar] [CrossRef]
  6. Kalamaras, C.M.; Efstathiou, A.M. Hydrogen Production Technologies: Current State and Future Developments. Conf. Pap. Energy 2013, 2013, 690627. [Google Scholar] [CrossRef]
  7. Noussan, M.; Raimondi, P.P.; Scita, R.; Hafner, M. The Role of Green and Blue Hydrogen in the Energy Transition—A Technological and Geopolitical Perspective. Sustainability 2021, 13, 298. [Google Scholar] [CrossRef]
  8. Megía, P.J.; Vizcaíno, A.J.; Calles, J.A.; Carrero, A. Hydrogen Production Technologies: From Fossil Fuels toward Renewable Sources. A Mini Review. Energy Fuels 2021, 35, 16403. [Google Scholar] [CrossRef]
  9. Chun Minh, A.L.; Samudrala, S.P.; Bhattacharya, S. Valorisation of glycerol through catalytic hydrogenolysis routes for sustainable production of value-added C3 chemicals: Current and future trends. Sustain. Energy Fuels 2022, 6, 596–639. [Google Scholar] [CrossRef]
  10. Yang, Y.; Chen, Y.; Jin, Y.; Liu, J.; Qin, X.; Liu, W.; Guo, L. Highly efficient fermentation of glycerol and 1,3-propanediol using a novel starch as feedstock. Food Biosci. 2022, 46, 101521. [Google Scholar] [CrossRef]
  11. Xu, W.; Liu, Z.; Johnston-Peck, A.C.; Senanayake, S.D.; Zhou, G.; Stacchiola, D.; Stach, E.A.; Rodriguez, J.A. Steam Reforming of Ethanol on Ni/CeO2: Reaction Pathway and Interaction between Ni and the CeO2 Support. ACS Catal. 2013, 3, 975. [Google Scholar] [CrossRef]
  12. Ye, R.; Xiao, S.; Lai, Q.; Wang, D.; Huang, Y.; Feng, G.; Zhang, R.; Wang, T. Advances in Enhancing the Stability of Cu-Based Catalysts for Methanol Reforming. Catalysts 2022, 12, 747. [Google Scholar] [CrossRef]
  13. Bepari, S.; Kuila, D. Steam reforming of methanol, ethanol and glycerol over nickel-based catalysts-A review. Int. J. Hydrogen Energy 2020, 45, 18090. [Google Scholar] [CrossRef]
  14. Macedo, M.S.; Soria, M.A.; Madeira, L.M. Process intensification for hydrogen production through glycerol steam reforming. Renew. Sustain. Energy Rev. 2021, 146, 111151. [Google Scholar] [CrossRef]
  15. Dehghanpoor-Gharashah, A.; Rezaei, M.; Meshkani, F. Preparation and improvement of the mesoporous nanostructured nickel catalysts supported on magnesium aluminate for syngas production by glycerol dry reforming. Int. J. Hydrogen Energy 2021, 46, 22454. [Google Scholar] [CrossRef]
  16. IEA. The Future of Hydrogen, IEA, Paris. 2019. Available online: https://www.iea.org/reports/the-future-of-hydrogen (accessed on 10 March 2022).
  17. IEA. International Energy Agency. 2021. Available online: https://www.iea.org/fuels-and-technologies/bioenergy (accessed on 3 September 2020).
  18. Loy, A.C.M.; Yusup, S.; Lam, M.K.; Chin, B.L.F.; Shahbaz, M.; Yamamoto, A.; Acda, M.N. The effect of industrial waste coal bottom ash as catalyst in catalytic pyrolysis of rice husk for syngas production. Energy Convers. Manag. 2018, 165, 541. [Google Scholar] [CrossRef]
  19. Qingli, X.; Zhengdong, Z.; Kai, H.; Shanzhi, X.; Chuang, M.; Chenge, C.; Huan, Y.; Yang, Y.; Yongjie, Y. Ni supported on MgO modified attapulgite as catalysts for hydrogen production from glycerol steam reforming. Int. J. Hydrogen Energy 2021, 46, 27380. [Google Scholar] [CrossRef]
  20. Rocha, D.H.D.; de Souza, T.A.Z.; Coronado, C.J.R.; Silveira, J.L.; Silva, R.J. Exergoenvironmental analysis of hydrogen production through glycerol steam reforming. Int. J. Hydrogen Energy 2021, 46, 1385. [Google Scholar] [CrossRef]
  21. Roslan, N.A.; Abidin, S.Z.; Ideris, A.; Vo, D.-V.N. A review on glycerol reforming processes over Ni-based catalyst for hydrogen and syngas productions. Int. J. Hydrogen Energy 2020, 45, 18466. [Google Scholar] [CrossRef]
  22. Moogi, S.; Nakka, L.; Potharaju, S.S.P.; Ahmed, A.; Farooq, A.; Jung, S.-C.; Rhee, G.H.; Park, Y.-K. Copper promoted Co/MgO: A stable and efficient catalyst for glycerol steam reforming. Int. J. Hydrogen Energy 2021, 46, 18073. [Google Scholar] [CrossRef]
  23. Polychronopoulou, K.; Dabbawala, A.A.; Sajjad, M.; Singh, N.; Anjum, D.H.; Baker, M.A.; Charisiou, N.D.; Goula, M.A. Hydrogen production via steam reforming of glycerol over Ce-La-Cu-O ternary oxide catalyst: An experimental and DFT study. Appl. Surf. Sci. 2022, 586, 152798. [Google Scholar] [CrossRef]
  24. Menezes, J.P.d.S.Q.; Duarte, K.R.; Manfro, R.L.; Souza, M.M.V.M. Effect of niobia addition on cobalt catalysts supported on alumina for glycerol steam reforming. Renew. Energy 2020, 148, 864. [Google Scholar] [CrossRef]
  25. Reynoso, A.J.; Ayastuy, J.L.; Iriarte-Velasco, U.; Gutiérrez-Ortiz, M.A. Cobalt aluminate spinel-derived catalysts for glycerol aqueous phase reforming. Appl. Catal. B Environ. 2018, 239, 86. [Google Scholar] [CrossRef]
  26. Reynoso, A.J.; Ayastuy, J.L.; Iriarte-Velasco, U.; Gutiérrez-Ortiz, M.A. Aqueous-phase reforming of glycerol over Pt-Co catalyst: Effect of process variables. J. Environ. Chem. Eng. 2022, 10, 107402. [Google Scholar] [CrossRef]
  27. Reynoso, A.J.; Iriarte-Velasco, U.; Gutiérrez-Ortiz, M.A.; Ayastuy, J.L. Highly stable Pt/CoAl2O4 catalysts in Aqueous-Phase Reforming of glycerol. Catal. Today 2021, 367, 278. [Google Scholar] [CrossRef]
  28. Ozden, M.; Say, Z.; Kocak, Y.; Ercan, K.E.; Jalal, A.; Ozensoy, E.; Avci, A.K. A highly active and stable Ru catalyst for syngas production via glycerol dry reforming: Unraveling the interplay between support material and the active sites. Appl. Catal. A Gen. 2022, 636, 118577. [Google Scholar] [CrossRef]
  29. Roslan, N.A.; Zainal Abidin, S.; Osazuwa, O.U.; Chin, S.Y.; Taufiq-Yap, Y.H. Enhanced syngas production from glycerol dry reforming over Ru promoted -Ni catalyst supported on extracted Al2O3. Fuel 2022, 314, 123050. [Google Scholar] [CrossRef]
  30. Chimentão, R.J.; Hirunsit, P.; Torres, C.S.; Ordoño, M.B.; Urakawa, A.; Fierro, J.L.G.; Ruiz, D. Selective dehydration of glycerol on copper based catalysts. Catal. Today 2021, 367, 58. [Google Scholar] [CrossRef]
  31. Ay, S.; Ozdemir, M.; Melikoglu, M. Effects of metal promotion on the performance, catalytic activity, selectivity and deactivation rates of Cu/ZnO/Al2O3 catalysts for methanol synthesis. Chem. Eng. Res. Des. 2021, 175, 146. [Google Scholar] [CrossRef]
  32. Qing, S.; Hou, X.; Li, L.; Feng, G.; Wang, X.; Gao, Z.; Fan, W. Deactivation feature of Cu/SiO2 catalyst in methanol decomposition. Int. J. Hydrogen Energy 2019, 44, 16667. [Google Scholar] [CrossRef]
  33. Zheng, L.; Li, X.; Du, W.; Shi, D.; Ning, W.; Lu, X.; Hou, Z. Metal-organic framework derived Cu/ZnO catalysts for continuous hydrogenolysis of glycerol. Appl. Catal. B Environ. 2017, 203, 146. [Google Scholar] [CrossRef]
  34. Zhao, J.; Zhang, G.; Liu, H.; Shu, Q.; Zhang, Q. Improved charge transfer and morphology on Ti-modified Cu/γ-Al2O3/Al catalyst enhance the activity for methanol steam reforming. Int. J. Hydrogen Energy 2022, 47, 18294. [Google Scholar] [CrossRef]
  35. Wu, K.; Dou, B.; Zhang, H.; Liu, D.; Chen, H.; Xu, Y. Aqueous phase reforming of biodiesel byproduct glycerol over mesoporous Ni-Cu/CeO2 for renewable hydrogen production. Fuel 2022, 308, 122014. [Google Scholar] [CrossRef]
  36. Smith, L.R.; Sainna, M.A.; Douthwaite, M.; Davies, T.E.; Dummer, N.F.; Willock, D.J.; Knight, D.W.; Catlow, C.R.A.; Taylor, S.H.; Hutchings, G.J. Gas Phase Glycerol Valorization over Ceria Nanostructures with Well-Defined Morphologies. ACS Catal. 2021, 11, 4893. [Google Scholar] [CrossRef]
  37. Nawaz, A.; Kumar, P. Optimization of process parameters of Lagerstroemia speciosa seed hull pyrolysis using a combined approach of Response Surface Methodology (RSM) and Artificial Neural Network (ANN) for renewable fuel production. Bioresour. Technol. Rep. 2022, 18, 101110. [Google Scholar] [CrossRef]
  38. Quirino, P.P.S.; Amaral, A.F.; Manenti, F.; Pontes, K.V. Mapping and optimization of an industrial steam methane reformer by the design of experiments (DOE). Chem. Eng. Res. Des. 2022, 184, 349. [Google Scholar] [CrossRef]
  39. Pashaei, H.; Ghaemi, A.; Nasiri, M.; Karami, B. Experimental Modeling and Optimization of CO2 Absorption into Piperazine Solutions Using RSM-CCD Methodology. ACS Omega 2020, 5, 8432. [Google Scholar] [CrossRef]
  40. Pardeshi, C.V.; Rajput, P.V.; Belgamwar, V.S.; Tekade, A.R.; Surana, S.J. Novel surface modified solid lipid nanoparticles as intranasal carriers for ropinirole hydrochloride: Application of factorial design approach. Drug Deliv. 2013, 20, 47. [Google Scholar] [CrossRef]
  41. Fan, M.-S.; Abdullah, A.Z.; Bhatia, S. Hydrogen production from carbon dioxide reforming of methane over Ni–Co/MgO–ZrO2 catalyst: Process optimization. Int. J. Hydrogen Energy 2011, 36, 4875. [Google Scholar] [CrossRef]
  42. Fatah, N.A.A.; Jalil, A.A.; Salleh, N.F.M.; Hamid, M.Y.S.; Hassan, Z.H.; Nawawi, M.G.M. Elucidation of cobalt disturbance on Ni/Al2O3 in dissociating hydrogen towards improved CO2 methanation and optimization by response surface methodology (RSM). Int. J. Hydrogen Energy 2020, 45, 18562. [Google Scholar] [CrossRef]
  43. Kahveci, E.E.; Taymaz, I. Hydrogen PEMFC stack performance analysis through experimental study of operating parameters by using response surface methodology (RSM). Int. J. Hydrogen Energy 2022, 47, 12293. [Google Scholar] [CrossRef]
  44. Rajagopal, J.; Gopinath, K.P.; Neha, R.; Aakriti, K.; Jayaraman, R.S.; Arun, J.; Pugazhendhi, A. Processing of household waste via hydrothermal gasification and hydrothermal liquefaction for bio-oil and bio-hydrogen production: Comparison with RSM studies. J. Environ. Chem. Eng. 2022, 10, 107218. [Google Scholar] [CrossRef]
  45. Shavandi, M.; Massoudi, A.; Khanlarkhani, A.; Moradi, M. Size-tunable Ni-Cu nanoparticles using nucleation and growth control of Polyol Reduction Method. Mater. Today Proc. 2018, 5, 15761. [Google Scholar] [CrossRef]
  46. Gu, Y.-J.; Kim, J.-H.; Jang, W.-J.; Jeong, D.-W. A comparison of Cu/CeO2 catalysts prepared via different precipitants/digestion methods for single stage water gas shift reactions. Catal. Today 2022, 388–389, 237. [Google Scholar] [CrossRef]
  47. Ouyang, B.; Tan, W.; Liu, B. Morphology effect of nanostructure ceria on the Cu/CeO2 catalysts for synthesis of methanol from CO2 hydrogenation. Catal. Commun. 2017, 95, 36. [Google Scholar] [CrossRef]
  48. Wang, B.; Zhang, H.; Xu, W.; Li, X.; Wang, W.; Zhang, L.; Li, Y.; Peng, Z.; Yang, F.; Liu, Z. Nature of Active Sites on Cu–CeO2 Catalysts Activated by High-Temperature Thermal Aging. ACS Catal. 2020, 10, 12385. [Google Scholar] [CrossRef]
  49. Bak, S.-M.; Shadike, Z.; Lin, R.; Yu, X.; Yang, X.-Q. In situ/operando synchrotron-based X-ray techniques for lithium-ion battery research. NPG Asia Mater. 2018, 10, 563. [Google Scholar] [CrossRef]
  50. Liew, J.X.; Loy, A.C.M.; Chin, B.L.F.; AlNouss, A.; Shahbaz, M.; Al-Ansari, T.; Govindan, R.; Chai, Y.H. Synergistic effects of catalytic co-pyrolysis of corn cob and HDPE waste mixtures using weight average global process model. Renew. Energy 2021, 170, 948. [Google Scholar] [CrossRef]
  51. Yahya, H.S.M.; Abbas, T.; Amin, N.A.S. Optimization of hydrogen production via toluene steam reforming over Ni–Co supported modified-activated carbon using ANN coupled GA and RSM. Int. J. Hydrogen Energy 2021, 46, 24632. [Google Scholar] [CrossRef]
  52. Loy, A.C.M.; Quitain, A.T.; Lam, M.K.; Yusup, S.; Sasaki, M.; Kida, T. Development of high microwave-absorptive bifunctional graphene oxide-based catalyst for biodiesel production. Energy Convers. Manag. 2019, 180, 1013. [Google Scholar] [CrossRef]
  53. Cheah, K.W.; Yusup, S.; Kyriakou, G.; Ameen, M.; Taylor, M.J.; Nowakowski, D.J.; Bridgwater, A.V.; Uemura, Y. In-situ hydrogen generation from 1,2,3,4-tetrahydronaphthalene for catalytic conversion of oleic acid to diesel fuel hydrocarbons: Parametric studies using Response Surface Methodology approach. Int. J. Hydrogen Energy 2019, 44, 20678. [Google Scholar] [CrossRef]
  54. Cifuentes, B.; Figueredo, M.; Cobo, M. Response Surface Methodology and Aspen Plus Integration for the Simulation of the Catalytic Steam Reforming of Ethanol. Catalysts 2017, 7, 15. [Google Scholar] [CrossRef]
  55. Ploner, K.; Delir Kheyrollahi Nezhad, P.; Watschinger, M.; Schlicker, L.; Bekheet, M.F.; Gurlo, A.; Gili, A.; Doran, A.; Schwarz, S.; Stöger-Pollach, M.; et al. Steering the methanol steam reforming performance of Cu/ZrO2 catalysts by modification of the Cu-ZrO2 interface dimensions resulting from Cu loading variation. Appl. Catal. A Gen. 2021, 623, 118279. [Google Scholar] [CrossRef]
  56. Seadira, T.W.P.; Masuku, C.M.; Scurrell, M.S. Solar photocatalytic glycerol reforming for hydrogen production over Ternary Cu/THS/graphene photocatalyst: Effect of Cu and graphene loading. Renew. Energy 2020, 156, 84. [Google Scholar] [CrossRef]
  57. Chen, Y.; Li, S.; Lv, S.; Huang, Y. A novel synthetic route for MOF-derived CuO-CeO2 catalyst with remarkable methanol steam reforming performance. Catal. Commun. 2021, 149, 106215. [Google Scholar] [CrossRef]
  58. Ismaila, A.; Chen, H.; Shao, Y.; Xu, S.; Jiao, Y.; Chen, X.; Gao, X.; Fan, X. Renewable hydrogen production from steam reforming of glycerol (SRG) over ceria-modified γ-alumina supported Ni catalyst. Chin. J. Chem. Eng. 2020, 27, R713–R715. [Google Scholar] [CrossRef]
  59. Chakinala, N.; Chakinala, A.G. Catalytic hydrothermal reforming of glycerol for hydrogen production with nickel catalysts. Mater. Today Proc. 2022, 57, 1484. [Google Scholar] [CrossRef]
  60. Chakinala, A.G.; Brilman, D.W.F.; van Swaaij, W.P.M.; Kersten, S.R.A. Catalytic and Non-catalytic Supercritical Water Gasification of Microalgae and Glycerol. Ind. Eng. Chem. Res. 2010, 49, 1113. [Google Scholar] [CrossRef]
  61. Qingli, X.; Zhengdong, Z.; Lifang, L.; Ping, L.; Rui, W.; Shoutao, C.; Pize, L.; Chenyang, Z. Hydrogen production by glycerol reforming in a two-fixed-bed reactor. Int. J. Hydrogen Energy 2022, 47, 16805. [Google Scholar] [CrossRef]
  62. Alipour-Dehkordi, A.; Neek, S.J.; Shahnazar, A. Sustainable H2 production from glycerol steam reforming in the heat-integrated reactor: Using reforming-side by-products as feed for the catalytic combustion-side. J. Ind. Eng. Chem. 2022, 113, 264–274. [Google Scholar] [CrossRef]
  63. Samudrala, S.P.; Kandasamy, S.; Bhattacharya, S. Turning Biodiesel Waste Glycerol into 1,3-Propanediol: Catalytic Performance of Sulphuric acid-Activated Montmorillonite Supported Platinum Catalysts in Glycerol Hydrogenolysis. Sci. Rep. 2018, 8, 7484. [Google Scholar] [CrossRef] [PubMed]
  64. Tapah, B.F.; Santos, R.C.D.; Leeke, G.A. Processing of glycerol under sub and supercritical water conditions. Renew. Energy 2014, 62, 353. [Google Scholar] [CrossRef]
  65. Wang, S.; Yan, L.; Zhao, Y.; Ma, Y.; Wu, G.; Wu, J.; Zeng, S. Honeycomb porous carbon frameworks from wheat flour as supports for CuxO-CeO2 monolithic catalysts. Appl. Surf. Sci. 2019, 464, 294. [Google Scholar] [CrossRef]
  66. Zhao, G.; Li, C.; Zhang, H. Honeycomb nano cerium oxide fabricated by vacuum drying process with sodium alginate. IOP Conf. Ser. Mater. Sci. Eng. 2017, 207, 012001. [Google Scholar] [CrossRef]
  67. Akan, M.M.; Fung, A.S.; Kumar, R. Process energy analysis and saving opportunities in small and medium size enterprises for cleaner industrial production. J. Clean. Prod. 2019, 233, 43. [Google Scholar] [CrossRef]
Figure 1. (a) Morphology of CuO/CeO2 at 5000× magnification (insert: enlarged cross-section area at 20,000× magnification); (b) SAXS analysis: pair distance distribution function analysis; (c) lateral height analysis using AFM (insert: height and roughness of the catalyst); and (d) PXRD analysis of the catalyst.
Catalysts 12 00941 g001
Figure 2. Counter plot for Y1 on reaction temperature vs. Cu loading: (a) WHSV and glycerol concentration are in minimum conditions; (b) WHSV and glycerol concentration are in maximum conditions; (c) WHSV is at minimum and glycerol concentration is at maximum; and (d) WHSV is at maximum and glycerol concentration is at minimum. (The black box indicates that the highest glycerol conversion can be obtained in the selected boundaries.)
Catalysts 12 00941 g002
Figure 3. Counter plot for Y2 on reaction temperature vs. Cu loading: (a) WHSV and glycerol concentration are in minimum conditions; (b) WHSV and glycerol concentration are in maximum conditions; (c) WHSV is in minimum condition and glycerol concentration is in maximum condition; and (d) WHSV is in maximum condition and glycerol concentration is in minimum condition. (The black box indicates that the highest hydrogen production can be obtained in the selected boundaries.)
Catalysts 12 00941 g003
Figure 4. Predicted dual criteria optimisation results for the model (red: independent variable; blue: predicted results).
Catalysts 12 00941 g004
Figure 5. Research methodology flowchart of this study.
Catalysts 12 00941 g005
Table 1. Possible reactions in vapor phase glycerol reforming.
Glycerol Reforming C 3 H 8 O 3 + 3 H 2 O   3CO2 + 7H2 Equation (1)
Water gas shift reaction: CO + H 2 O   CO2 + H2Equation (2)
Methanation: CO + 3 H 2   CH4 + H2OEquation (3)
CO 2 + 4 H 2   CH4 + 2H2OEquation (4)
Glycerol oxidation: C 3 H 8 O + 0.5 O 2   2CO2 + 4H2Equation (5)
C 3 H 8 O 3 + O 2   CO + 2CO2 + 4H2Equation (6)
C 3 H 8 O 3 + 1.5 O 2   3CO2 + 4H2Equation (7)
C 3 H 8 O 3 + 3.5 O 2   3CO2 + 4H2OEquation (8)
Decomposition of water 2 H 2 O 2 H 2 +   O 2 Equation (9)
CO2 reforming of methane CO 2 +   CH 4 2 H 2 + 2 CO Equation (10)
Boudouard’s reaction C   +   CO 2   2 CO Equation (11)
Carbon gasification C   + 2 H 2 O   CO 2 + 2 H 2 Equation (12)
Table 2. Textual and physicochemical properties of the catalyst.
CatalystCu Loading (wt.%) aCuxO Loading b (wt%)CuO (111) Crystalline Size (nm)CeO2 (111) Crystalline Size (nm)Lattice Constant (Å)Average Particle Size (nm) fSBET
(m2g−1)
Lateral Height of Catalyst (nm) g
10 wt.%-CuO/CeO28.5211.1235.6 c, 39.2 d, 42.1 e6.89 c, 7.13 d, 7.41e5.38 c, 5.39 d, 5.40 e17.5014.2825.00
a Determined using SEM-EDX analysis; b Determined using XRF analysis; c Determined using ex situ PXRD analysis; d Determined using in situ PXRD in N2 atmosphere; e Determined using in situ synchrotron PXRD in N2 atmosphere; f Determined using SAXS analysis; g Determined using AFM analysis.
Table 3. Analysis of variance (ANOVA) for response surface of quadratic model for Equation (14).
SourceSum of SquaresdfMean SquareF-Valuep-Value
Model2097.5614149.8338.88<0.0001
A-Cu loading155.041155.0440.23<0.0001
B-reaction temperature1488.3711488.37386.23<0.0001
C-WHSV108.371108.3728.12<0.0001
D-glycerol concentration71.14171.1418.460.0006
AB5.0615.061.310.2697
AC39.06139.0610.140.0062
AD22.56122.565.850.0287
BC10.56110.562.740.1186
BD14.06114.063.650.0754
CD3.0613.060.79470.3868
A210.05110.052.610.1271
B245.39145.3911.780.0037
C254.73154.7314.200.0019
D219.88119.885.160.0383
Residual57.80153.85
Lack of Fit46.47104.652.050.2216
Pure error11.3352.27
Cor total2155.3729
Std. dev.1.96 R20.9732
Mean80.57 Adjusted R20.9482
C.V. %2.44 Predicted R20.8594
Adeq precision23.6774
Table 4. Analysis of variance (ANOVA) for response surface of linear model for Equation (15).
SourceSum of SquaresdfMean SquareF-Valuep-Value
Model500.444125.1153.60<0.0001
A-Cu loading57.04157.0424.44<0.0001
B-reaction temperature360.371360.37154.38<0.0001
C-WHSV77.04177.0433.00<0.0001
D-glycerol concentration5.9815.982.560.1220
Residual58.36252.33
Lack of fit53.03202.652.490.1586
Pure error5.3351.07
Cor total558.8029
Std. dev.1.53 R20.8956
Mean70.80 Adjusted R20.8789
C.V. %2.16 Predicted R20.8454
Adeq precision24.8499
Table 5. Confirmation Post Analysis of Experimental Work.
RunGlycerol Conversion (%)Hydrogen Production (Vol%)
18169
27970
38373
Std Dev95% PI low95% PI high
Glycerol conversion (%)3.3875.284.5
Hydrogen production (vol%)1.5369.673.8
Table 6. Set of design of experiments based on CCD plot.
RunA: (Cu Loading, wt.%)B: (Reaction Temperature, K)C: (WHSV, h−1)D: (Glycerol Concentration, vol.%)Y1: (Glycerol Conversion, %)Y2:(Hydrogen Production, vol.%)
146731156863
265981.5106261
327481.5108167
44823157971
58823259079
667481.5108270
7107481.5108773
886731158469
986732158168
108823158872
1168981.5109378
1248232158875
138673157366
144673257268
154823259174
16108232159481
1767481.5108271
1846732157269
1967481.5208073
2067481.558169
2167481.5107972
2267481.5108073
2367481.5108272
2448231158470
2567482.5108172
2667481.5108372
274673156464
2867480.5107168
298673257270
3088231159074
Publisher’s Note: MDPI stays neutral with regard to jurisdictional claims in published maps and institutional affiliations.

