
Molecular Dynamics Simulations for the Michaelis Complex of Ectoine Synthase (EctC)

1
Jerzy Haber Institute of Catalysis and Surface Chemistry, Polish Academy of Sciences, 30-239 Kraków, Poland
2
Department of Biology, Philipps-Universität Marburg, 35043 Marburg, Germany
*
Author to whom correspondence should be addressed.
Catalysts 2023, 13(1), 124; https://0-doi-org.brum.beds.ac.uk/10.3390/catal13010124
Submission received: 11 November 2022
/
Revised: 30 December 2022
/
Accepted: 1 January 2023
/
Published: 6 January 2023
(This article belongs to the Special Issue Mechanism/Kinetic Modeling Study of Catalytic Reactions)
Abstract
:Ectoine is a chemical chaperone synthesised and used by bacteria to defend against osmotic stress. Although it has already gained attention from the pharmaceutical and cosmetic industries, thanks to its hydrating and cell-protecting properties, the reaction mechanism of its final synthesis step is still not fully understood. The ultimate step of ectoine biosynthesis is catalysed by the ectoine synthase enzyme (EctC), which requires an iron ion for substrate binding and overall enzymatic activity. Even though a crystal structure for Paenibacillus lautus EctC—substrate complex is available (PDB: 5ONN), it is not very informative with respect to the geometry of the active site because: (1) the crystal was obtained at a pH value far from the enzyme’s pH optimum, (2) the electron density at the Fe position is weak, and (3) the Fe-ligand distances are too long. To fill this gap, in this work we have used classical molecular dynamics simulations to model the enzyme-substrate (N-gamma-acetyl-L-2,4-diaminobutyric acid) complex of Paenibacillus lautus EctC (PlEctC). Since PlEctC is a homodimeric protein, MD simulations were carried out for a dimer with various plausible occupancies by the substrate and for two plausible coordination geometries around the catalytic Fe ion: tetrahedral and octahedral. MD results revealed that the presence of the ligand has a stabilising effect on the protein structure, most notably on a short helix 112–118, which flanks the entrance to the active site. The most important amino acids for substrate binding are Trp21, Arg25, Asn38, Thr40, and Tyr52, which were also identified in the crystal structure. Importantly, the substrate can easily adopt a conformation suitable for the progress of the catalytic reaction, and it does so spontaneously for the octahedral 6-coordinate geometry of the iron cofactor or with a low energy penalty (ca. 3 kcal/mol) in the case of 4-coordinate tetrahedral geometry. Simulations for different substrate occupancy states did not reveal any signs of cooperativity between the two monomers.
1. Introduction
Ectoine synthase (EctC) is an enzyme from the cupin protein superfamily [1,2,3,4]. It is found in many organisms from the domains of Bacteria and Archaea, and even in some eukaryotes [3,4,5,6], with the most profound biochemical studies carried out for the orthologues from psychrophilic Sphingopyxis alaskensis [2] and thermophilic Paenibacillus lautus [1]. The enzyme catalyses the ultimate step of the ectoine biosynthesis pathway at an iron ion in its active site, which is the elimination of water from the substrate N-γ-acetyl-L-2,4-diaminobutyric acid (N-γ-ADABA) to affect ring closure (Figure 1) [3,4]. The reaction product is ectoine, a kosmotropic compound known for its cytoprotective, inflammatory-reducing, and moisturising properties [3,4,7,8,9,10,11,12]. It is synthesised by cells facing hyperosmotic stress in substantial amounts, up to 2-molar concentrations [13], which are exploited for biotechnological ectoine production [14,15,16,17,18,19]. Ectoine protects the cells from drying out by its osmotic properties [3,4] and additionally provides a protective hydration shield around macromolecules, saving them from denaturation [10,11,12]. Thanks to these properties, ectoine is already a popular ingredient in many pharmaceutical products used for the treatment of eye irritation [20,21], sore throat [22], or even inflammatory skin diseases [23].
The monomer of the EctC enzyme has the form of a β-barrel with two additional α-helices (Figure 2A). The barrel is built by two antiparallel β-sheets, one consisting of 6, the other of 5 β-strands. At the bottom of the barrel, the metal cofactor is bound. The α-II helix, which spans from residues 112 to 118 and is located between β-11 and β-12, is thought to play a role in controlling access to the active site [2].
Results of previous experimental studies indicate that ectoine synthase is a metal dependent enzyme [1,2]. Interestingly, the metal binding motifs found in EctC sequences are different from those conserved among cupin proteins (Figure 3). The first difference is that the metal ion in the EctC is coordinated in a different manner. Usually, cupin proteins coordinate a metal ion via three conserved histidines and one glutamic acid and the typical metal binding motifs are: G(X)5HXH(X)3,4E(X)6G and G(X)5PXG(X)2H(X)3N [24]. In contrast, EctC binds the metal ion via three different amino acids: Glu57, Tyr84 and His92. Only the first one is conserved among EctC and other metal-dependent proteins from the cupin superfamily. The metal binding motifs of EctC are: G(X)5WY(X)4E(X)6G and G(X)6PG(X)2Y(X)3G(X)3H. To confirm the importance of Glu57, Tyr84 and His92 (Figure 2B) in catalysis, Widderich et al. [2] performed site-directed mutagenesis where they individually substituted all these amino acids with alanine residues. In all cases, the enzyme activity dropped significantly to levels of 9%, 23% and 10%, respectively, which indicated their active role in enzyme’s catalysis. Furthermore, the N-γ-ADABA molecule also contributes a ligand to coordinate the metal ion, via an oxygen atom of the carboxyl group [1] (Figure 2B). The metal binding residues are located on three β-strands: β6 (Glu57), β9 (Tyr84) and β10 (His92) and are highly conserved among ectoine synthases found in different organisms [1,2].
The nature of the metal ion bound in the active site of the crystal structure of EctC is not certain, and the enzyme still shows some activity when the Fe2+ is replaced by other divalent metal ions or even by Fe3+ [2]. However, previous experimental studies showed that the enzyme exhibits the highest activity with Fe2+ [2], and variants carrying substitutions of metal binding residues showed a concomitant drop in their iron content along with their enzymatic activity [1,2]. Hence, the “standard” metal involved in the enzymatic activity of EctC is most likely Fe2+ [1,2,3,4].
According to Czech et al. [1], the amino acids that directly participate in substrate binding are: Trp21, Arg25, Asn38, Thr40 and Tyr52, (Figure 2C). Trp21 was observed to adopt two different conformations in the crystal structure of the holo form of EctC (PDB: 5ONM) and in the enzyme-substrate complex (5ONN) (Figure 2C). The role of Trp21 for the enzymatic activity was confirmed by site-directed mutagenesis, i.e., a Trp/Ala substitution resulted in 90.3% drop-in activity [1]. Ligand binding amino acids are mostly parts of β-strands: β3 (Trp21 and Arg25) and β4 (Asn38 and Thr40). The exception is Tyr52, which is located in the loop region between β5 and β6. Among the ligand binding residues, Trp21, Arg25, Thr40 and Tyr52 are highly conserved in EctC proteins, whereas Asn38 is replaced by histidine in some organisms [1,2,3,4] (Figure 3).
In the crystal structure, the substrate adopts a conformation close to the near attack conformation (NAC), with the alpha-amino nitrogen located 3.8 Å away from the carbonyl carbon of the acetyl moiety. Since these atoms will form a covalent bond during the progress of the reaction, we assume that the substrate conformation observed in the crystal structure (5ONN) is close, but not identical to the reactive one.
In solution, the functional protein occurs in the form of a symmetric dimer [2]. Upon dimerization, an unstructured N-terminal region, located between the 2nd and 5th residues, assumes the conformation of a β strand (β1) (Figure 2D), which creates an antiparallel β1/β9 dimeric interface (Figure S1). Up to now, there are no experimental data concerning whether or to what extent cooperativity occurs in substrate binding or turnover by the two monomers.
The main goal of this study was to test the already existing hypotheses concerning the EctC structural features and also to provide new insight into the EctC structure-function dependency. More specifically, the goals included: (1) gaining insights into the dynamics of the protein at physiological conditions (pH, ionic strength, temperature and pressure), (2) testing whether there is any plausible cooperativity between the two monomers in forming a Michaelis complex, (3) analysing interactions between the substrate and the active site residues, specifically when the substrate can adopt NAC, (4) testing whether the binding of ligands has any influence on the enzyme overall structure, (5) modelling two plausible coordination geometries of the iron cofactor in EctC: tetrahedral and octahedral and finally (6) modelling the two alternative conformations of Trp21 (Figure 2C: Trp21-A/Trp21-B), as observed in the EctC crystal structure (PDB: 5ONM, 5ONN), and analysing their effects on the reaction process.
2. Results
2.1. Molecular Dynamics for EctC with Four-Coordinate Fe2+
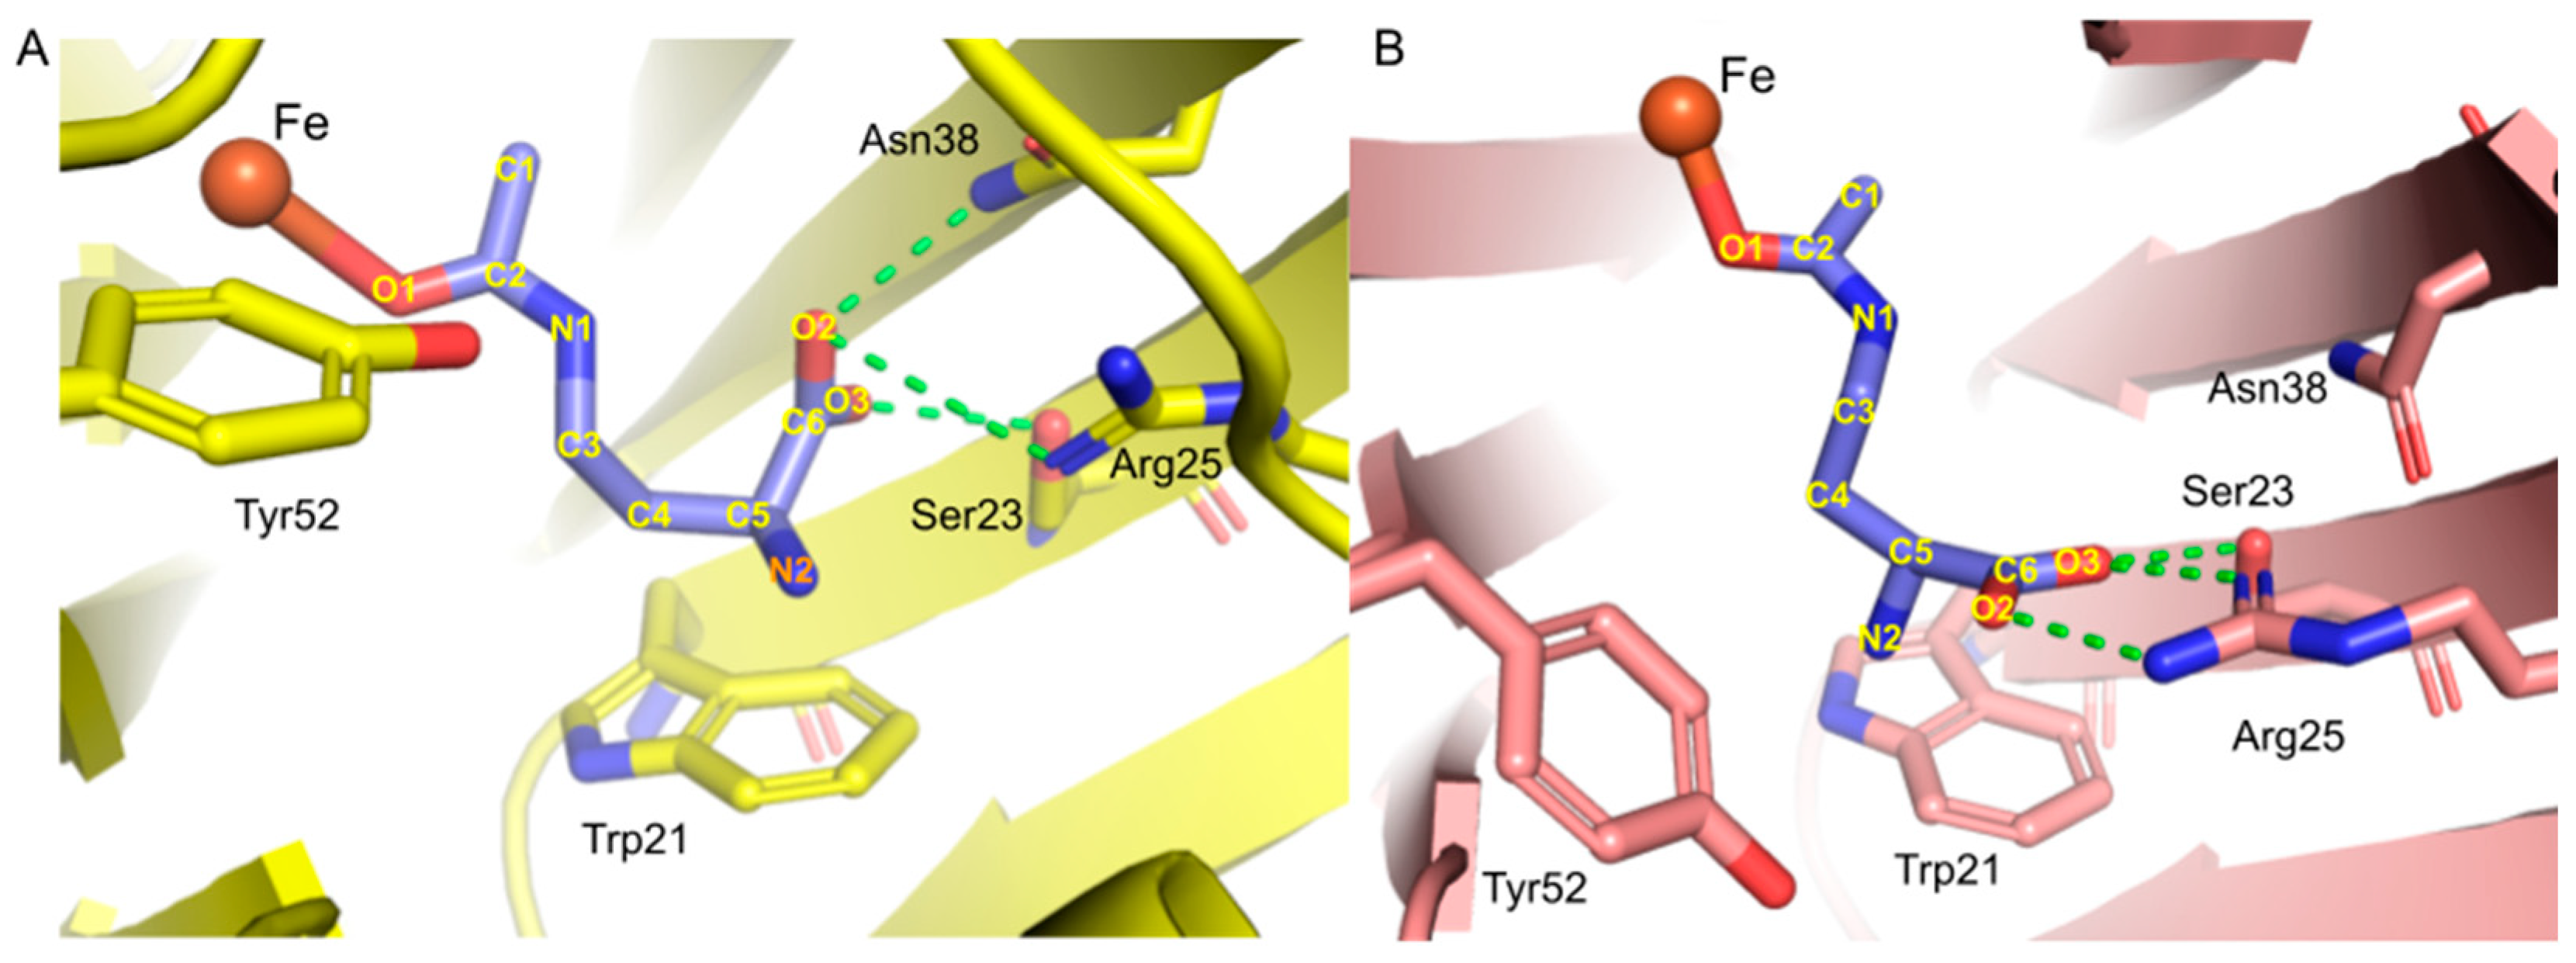
To model the dynamic behaviour of the EctC dimer with a four-coordinate Fe2+ ion bonded to its protein ligands and the substrate, 100-ns-long molecular dynamics simulations were performed. The RMSD values calculated for the whole backbone of the dimer oscillate at approximately ~3.8 Å, which suggests considerable mobility of the protein structure. However, visual inspection revealed that the conformations of the N-terminus and the β-barrel domain are rather stable, in contrast to the highly mobile 13 amino acid-long C-terminal domain; indeed, the RMSD value drops by almost 3 Å to ~0.9 Å (monomer 1) and ~1.1 Å (monomer 2) when the C-terminus is excluded from the RMSD calculations. Concerning the bound substrate molecule, we first focused on the distance between the carbonyl-C atom of the acetyl residue (C2) and the N2 atom representing the alpha-amino group in the N-γ-ADABA molecule (Figure 1 and Figure S4), which is crucial for the reaction’s progress as the C2 and N2 atoms eventually form a covalent bond. In the case of the EctC-substrate complex with a four-coordinate Fe2+ ion, as described by the bonded force-field model, the C2-N2 distance is rather large in both monomers, with an average of 5.16 Å in the first monomer and 5.33 Å in the second one (Figure S4 top). Furthermore, throughout the whole MD trajectory (Figure S4 top), the spontaneous formation of near attack conformations (NAC, defined as a geometry with C2-N2 distances <3.6 Å) was only observed sporadically and very short lasting. To better analyse the active site geometries within both monomers, clustering was performed based on RMSD for N-γ-ADABA and the key active site residues interacting with the substrate (Trp21, Arg25, Asn38, Tyr52). For monomer 1, the dominant cluster obtained covers over 90% of the MD trajectory frames and the geometry of its centroid shows the carboxyl group of the substrate in hydrogen bond interactions with Arg25, Ser23 and Asn38 (Figure 4A). The indole ring of Trp21 is in close proximity to the substrate C4 and C5 atoms (~3.8 Å), and the C2 and N2 atoms of the substrate are 5.5 Å apart. For monomer 2, the dominant cluster also covers the great majority of the MD trajectory frames (~95%). In this case, N-γ-ADABA forms two hydrogen bonds with Arg25 and one with Ser23, while no other hydrogen bonds can be identified (Figure 4B). The indole ring of the Trp21 is in close proximity to the alpha-amino group (N2) of the substrate (~3.8 Å), and the distance between C2 and N2 atoms is 5.3 Å. Moreover, no spontaneous switch of Trp21 to the other possible conformation (Trp21-B in Figure 2C) was observed in any of the two active sites of the dimer (Figure S5 left), as monitored by the value of the Cα-Cβ-Cγ-Nε dihedral angle in Trp21 (Figure S5 right).
Potential of Mean Force for Folding the Substrate into the Near Attack Conformation
Due to the fact that the unconstrained MD simulation did not bring us closer to the answer as to how the NAC state occurs, an umbrella sampling was conducted with the aim of calculating the free energy penalty needed for reaching a NAC conformation in the EctC-N-γ-ADABA complex. More specifically, the distance between the C2 and N2 atoms in the substrate molecule was treated as probed coordinate (Figure S2). Based on a series of constrained MD simulations, with a harmonic restraining potential applied to the C2-N2 distance, potentials of mean force (PMF) were calculated using the weighted histogram analysis method (WHAM) (Figure 5). As the C2-N2 distance was sampled back and forth from bent to extended conformation of the substrate, two curves have been obtained on the profile: the one shown in red represents stretching of the substrate molecule (sampling C2-N2 distance from 2.7 to 5.7 Å), and the one in blue represents compressing the N-γ-ADABA molecule (sampling C2-N2 distance from 5.7 to 2.7 Å). It is noticeable that the two curves are not perfectly aligned, but the degree of hysteresis is regarded as acceptable, since the distances between the curves are within 1 kcal/mol. The red curve shows one maximum and two minima, corresponding to distances of 4.3, 3.3 (NAC) and 5.3 Å, respectively. Most importantly, the calculated PMF profile shows that the obtained NAC is formed with a modest free energy increase (1–2 kcal/mol) and by crossing a low activation barrier of 2.5–3.0 kcal/mol.
To observe the structural differences associated with these three states, we analysed three MD “windows” (with average C2-N2 distance of 5.45 Å, 4.68 Å and 3.45 Å) from the backward sampling with average C2-N2 distances closest to the ones obtained for stationary points in the PMF plot.
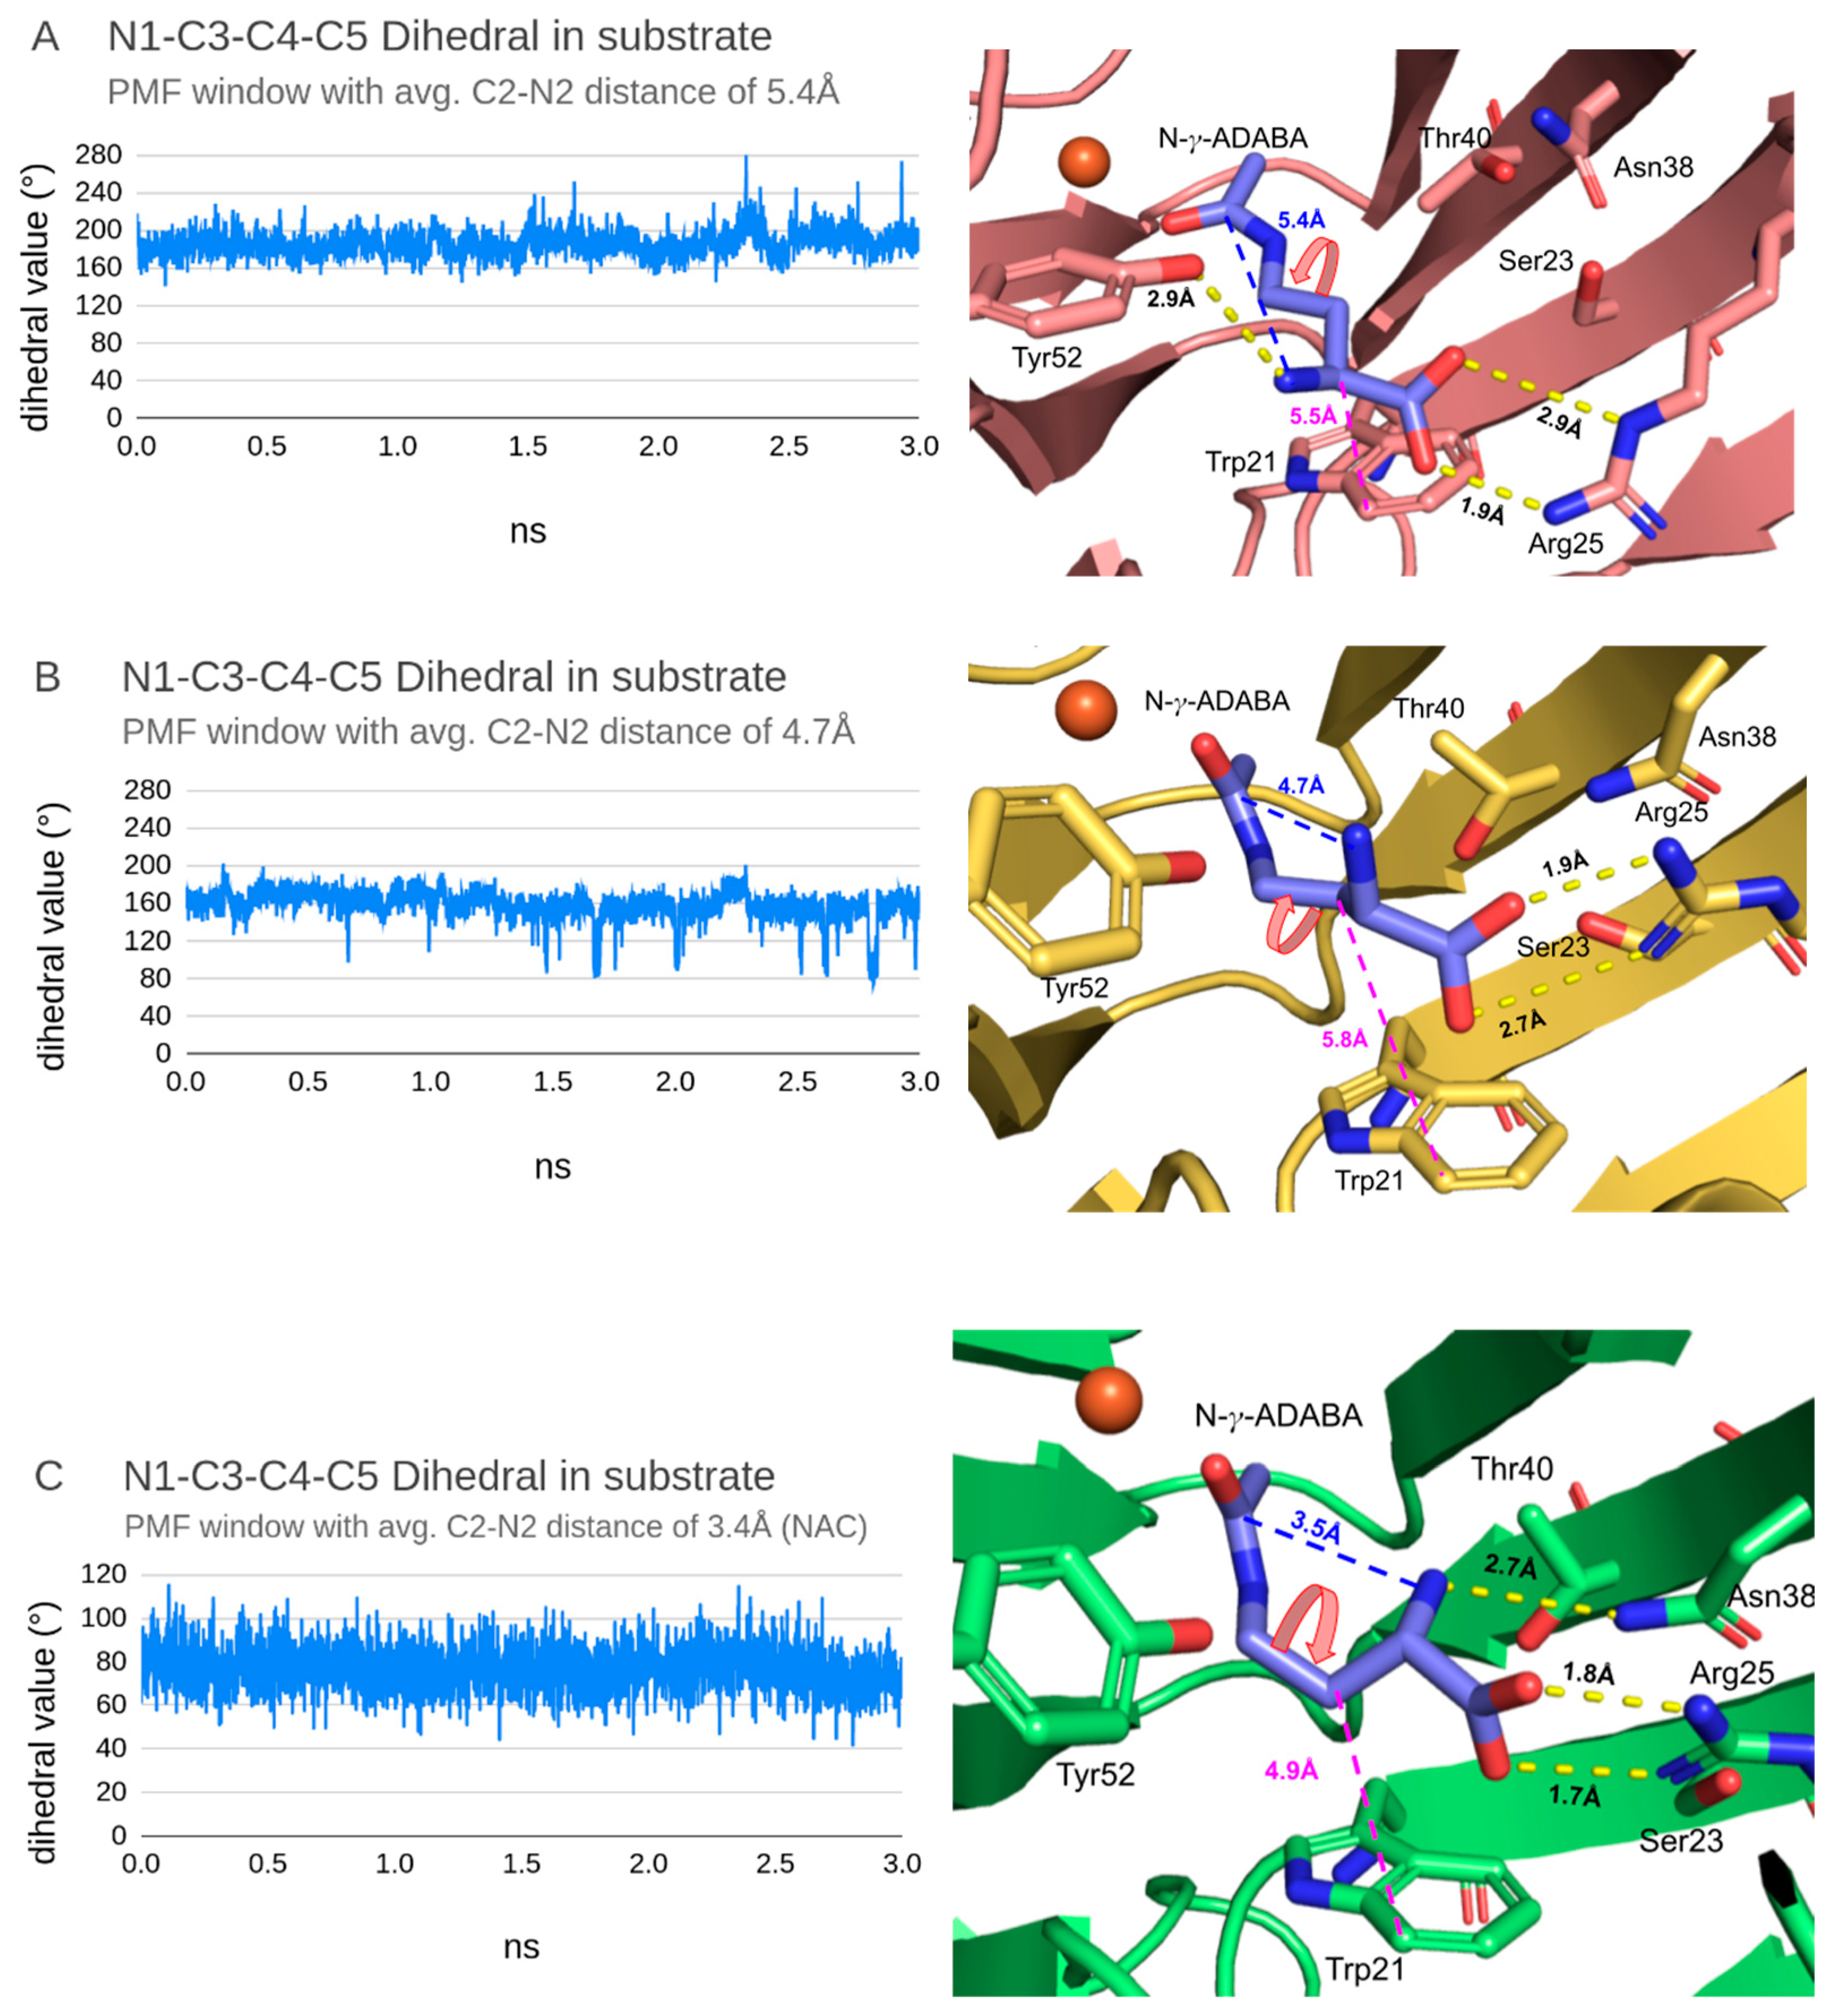
First, the N1-C3-C4-C5 dihedral angle of N-γ-ADABA (Figure S2) was measured to observe the structural dynamics of the substrate (Figure 6 left column). It is noticeable that with decreasing C2-N2 distance, the dihedral angle values oscillated around progressively smaller averages (from ~190/200° when the molecule is extended through ~160° with sporadic switches to ~80/100° in the maximum to ~80/100° in the NAC minimum).
As the NAC in an enzyme-substrate complex does not only depend on the substrate geometry but also on interactions between the substrate and active site residues, the approximate active site-geometries were extracted from the considered three states of the energy profile described above and compared: The approximate geometry of the complex in the NAC minimum was extracted from the MD window with an average C2-N2 distance of 3.45 Å, the approximate geometry of the complex in the maximum was extracted from the MD window with an average C2-N2 distance of 4.68 Å and the approximate geometry of the minimum associated with the extended conformation of the N-γ-ADABA molecule was extracted from the MD window with an average C2-N2 distance of 5.45 Å. These geometries are the centroids of the most populated clusters from each MD window, grouped by the structural similarities of an active site (Figure 6 right column).
Looking at the structural differences between these three geometries, it is noticeable that in the NAC conformation, the N-γ-ADABA carboxyl group forms two direct, strong (as judged based on the H-X distance) hydrogen bonds with Arg25 and the alpha-amino group of the substrate forms one weak hydrogen bond with Asn38 (Figure 6 right bottom). Furthermore, the indole ring of Trp21 is close to the C4 carbon atom of N-γ-ADABA (~4.2 Å) and can interact with the substrate. In the geometry representing the maximum on the PMF profile, the carboxyl group of N-γ-ADABA forms just one strong hydrogen bond with Arg25, the other one being much weaker (Figure 6 right middle). Apart from that, no other hydrogen bonds were observed and the Trp21 indole ring is noticeably farther away from C4 (~5.8 Å). Finally, in the structure harbouring an extended N-γ-ADABA conformation, the carboxyl group of the substrate forms one strong and one weak hydrogen bond with Arg25, which is oriented laterally towards the substrate. Another hydrogen bond is formed between Tyr52 and the alpha-amino group of the substrate, and the indole ring of Trp21 is ~5.5 Å away from the substrate C4 carbon (Figure 6 right top). In all three geometries, Trp21 has the same conformation, i.e., Trp21-A (Figure 2C), which is coherent with the observation from the unconstrained MD analysis that it does not adopt the Trp21-B conformation.
In the obtained NAC state, the carboxyl group of the substrate interacts with Arg25, its alpha-amino group with Asn38 and C4 with Trp21. The energetic barrier of ~3 kcal/mol associated with the maximum on the free energy plot is the result of losing strong hydrogen bonds with Arg25 and nonbonding interactions with Trp21. The second minimum on PMF is associated with a fully extended N-γ-ADABA molecule, which can form hydrogen bonds with Arg25 and sporadically with other residues of the EctC active site, namely Tyr52 and Asn38. Therefore, a potential reaction path may proceed from a low-energy conformation containing an extended substrate molecule via a transition state of higher energy to another low-energy conformation with a bent substrate molecule in the NAC state, that is ready to undergo water elimination.
2.2. Molecular Dynamics for EctC with Six-Coordinate Fe2+
2.2.1. Presence of the Ligand Stabilizes the Position of the α-II Helix
For the structural analysis of EctC with octahedral coordination of Fe2+, four models of the Fe2+-containing EctC dimers (“holoenzyme”) were prepared: a dimer with both active sites empty (denoted as EE, Figure S7A), a dimer with both active sites occupied with substrates (OO, Figure S7B) and two reciprocal dimers with one empty and one substrate-bound active site (EO and OE, Figure S7C,D). For each model, three independent MD simulations were performed, each lasting 100 ns. All twelve MD trajectories were analysed in order to spot similarities and differences in the dynamic behaviour of these models.
Visual inspection of whole trajectories as well as representative structures of dominating clusters did not reveal any systematic structural changes between the substrate-bound models that may provide evidence for cooperative effects in substrate binding by the two monomers, in accordance with the previous steady-state kinetics data, which indicate substrate inhibition effects, but no cooperativity in EctC [1].
However, we noticed that the presence of the substrate molecule had a stabilising effect on the structure of the binding monomer. More specifically, each MD trajectory was clustered to identify the prevailing geometry of the backbone of the monomers, then the geometries of both monomers were aligned and compared (Figure 7). Visual inspection showed that, besides the C-terminus and several loop regions, which are intrinsically mobile, the position of the α-II helix is the least stable of all secondary structure elements in EctC monomers. From the RMSF (root mean square fluctuation) values calculated for the backbone atoms in this region (Table 1), we infer that the position of the α-II helix is more stable in monomers that contain bound substrate, regardless of whether one or both monomers are occupied. This is reflected in both lower average RMSF values and smaller standard deviations. For occupied monomers in dimers with single occupied active sites (Table 1 O in EO/OE) the RMSF is 1.84 ± 0.36 Å vs. 2.34 ± 0.75 Å in empty monomers in dimers with single occupied active sites (Table 1 E in EO/OE) and for dimers with both monomers occupied (Table 1 O in OO) or empty (Table 1 E in EE), the RMSFs are: 1.87 ± 0.29 Å and 3.28 ± 0.65 Å. Hence, it can be concluded that the presence of N-γ-ADABA in the EctC active site stabilises the position of the α-II helix by decreasing its mobility.
2.2.2. Arginine 25 Causes the Structural Disruption of the α-II Helix in the Absence of the Substrate
In the analysed trajectories no direct interactions between the residues of the α-II helix and the N-γ-ADABA molecule bound in the active site were observed, yet it was noted that Arg25, whose side chain points towards the active site and forms strong hydrogen bonds with the carboxyl group of the substrate, adopts a different conformation in the absence of the substrate. Its side chain then points towards the protein surface and interacts with backbone oxygen atoms of amino acids located in the protein chain close to the α-II helix (Pro109, Leu110, Thr111, Gly112 and Glu118). Figure S3A presents representative superimposed structures extracted from various MD simulations for the EctC dimer, with at least one of its monomers occupied by a substrate. It is obvious that except for the highly mobile C-terminal part of the protein, the rest of the monomer backbone is stable and very well aligned.
A quite different picture arises for the centroids extracted from various MD simulations for dimers in which at least one of the monomers was in the empty form, i.e., without the substrate bound (Figure S3B). In this case, the α-II helix is found in various positions. Moreover, the structure of the loop region connecting the β3 with β4 also looks disturbed and is not present in a fixed position, as was the case for the Michaelis complexes, but in many different orientations during the MD runs.
2.2.3. NAC Forms Spontaneously for Six-Coordinate Fe2+ Models
During analysis of the substrate conformations in MD trajectories of the models with octahedral coordination, it was noted that the N-γ-ADABA molecule spontaneously adopt a NAC state with the C2-N2 distance oscillating at approximately 3.2 Å. NAC states persisting over several ns of the simulation were observed in 5 out of 9 analysed MD trajectories in which the substrate was present: in some of them this conformation of the substrate was relatively short-lived, but in some it remained present for an extended segment of the MD trajectory (Figure S8). The NAC and not-NAC states are quite easy to distinguish/cluster, as there are only a few frames with C2-N2 distances between those correlated to these two states, and the transitions to NAC occur rapidly (Figure S8).
To gain insight into how the spontaneously forming NAC is stabilised, the MD models in which the substrate was observed to adopt a NAC state were clustered and their centroid geometries were compared (Figure 8). It is noticeable that a common interaction pattern occurs in most NAC geometries: Tyr52 interacts with the carboxyl group of the substrate along with Arg25, and the Trp21 indole ring interacts with the C4 substrate atom. Additionally, in some of the NAC centroid geometries, a hydrogen bond between Ser23 and the carboxyl group of the substrate is present (Figure 8), while no interactions are noticed between Asn38 and N-γ-ADABA. As for the conformation of Trp21, it was only present in conformation A and does not adopt the other possible conformation in any of the analysed MD trajectories, neither when the substrate is present in the monomer’s active site nor when it is absent (Figure S9).
2.3. Molecular Dynamics Simulation for the Alternative Trp21 Conformation
According to Czech et al. [1], the reorientation of the Trp21 side chain might play an active role in catalysis. To test this hypothesis, we have analysed the dynamic behaviour of the Michaelis complex in models with the alternative Trp21 conformation, which was observed in the crystal structure (Figure 2C, “Trp21-B”, Figure S10 right), for both possible geometries around Fe2+: tetrahedral (4-) and octahedral (6-coordinate).
2.3.1. MD and PMF for a 4-Coordinate Model
Similar to the case of unconstrained MD for the 4-coordinate Fe2+ model featuring Trp21 in the Trp21-A conformation, no NAC state of the substrate (C2-N2 distance <3.6 Å), was observed in MD simulations with the Trp21-B conformation (Figure S4 bottom). Notably, with EctC in the Trp21-B conformation, the NAC state did not even occur in sporadic, short-lived events. Average C2-N2 distances in the EctC dimer were 4.43 Å for the substrate bonded to monomer 1 and 4.49 Å for the substrate in monomer 2. Even though both average values of C2-N2 are smaller than those in the model with the Trp21-A conformation (Figure S4 top), this does not translate to achieving the NAC state. Furthermore, no change in the conformation of Trp21 was observed, as monitored by the value of the Cα-Cβ-Cγ-Nε dihedral (Figure S10 left), although the dihedral values in general fluctuated more significantly than for the analogous model with the Trp21-A conformation (Figure S5 left), suggesting lower stability of the side chain. Clustering the MD geometries based on heavy atom positions of N-γ-ADABA, Trp21, Arg25, Asn38 and Tyr52, and comparing the centroids of the largest clusters (covering 94% and 81% of the MD trajectory, respectively), shows that the carboxyl group of N-γ-ADABA forms two hydrogen bonds with Arg25 and one with Ser23 in both monomers (Figure 9A,B). No other hydrogen bonds between the substrate and amino acids are present, and the indole ring of Trp21 is near atoms C3 and C4 of the substrate (4.0 Å) in both monomers.
Since once again no NAC state was observed during the unconstrained MD, the potential mean force calculations with umbrella sampling for the C2-N2 distance were conducted. Most relevantly, no energy minimum corresponding to a NAC state (~3.4 Å C2-N2 distance) was observed on the PMF profile for the model with the Trp21-B conformation (Figure 10). Moreover, forcing the C2 and N2 atoms to adopt distances below 4.0 Å resulted in a gradual increase in the energy, which might suggest that the Trp21-B conformation blocks the substrate from adopting the NAC state.
In an attempt to elucidate the origin of the energetic barrier that prevents adopting the NAC state in the Trp21-B conformation of EctC, the MD “window” approximating the minimum on the plot, observed for a C2-N2 distance of circa 4.0 Å (Figure 11A) and the MD “window” approximating NAC states from other simulations with ~3.3 Å N2-C2 distance (Figure 11B) were clustered and analysed. Active site geometry for the 4.0 Å state (Figure 11A) shows hydrogen bonds formed between the carboxyl group of N-γ-ADABA and Arg25 and Ser23, while its alpha-amino group forms a hydrogen bond with Asn38. The C2-N2 distance is 4.1 Å and Trp21 is in close proximity to the C4 atom in the substrate. The geometry of a (hypothetical) NAC state with 3.1 Å C2-N2 distance (Figure 11B) shows that the substrate lost the hydrogen bonds with Asn38 and Ser23 and its carboxyl group has only two rather weak hydrogen bonds with Arg25. The indole ring of Trp21 is also close to the C4 atom of N-γ-ADABA.
2.3.2. MD for a 6-Coordinate Model
To test the impact of Trp21 adopting the alternative conformation (Trp21-B) on the active site geometry in the 6-coordinate Fe2+ models, MD simulations, as described in the “Molecular dynamics for EctC with six-coordinate Fe2+” section, were repeated for the Trp21-B conformation.
The first relevant observation from the analysis of the MD trajectories was that no spontaneous NAC formation was observed in any of the trajectories/models. This suggests that the Trp21-B conformation does not comply with the progress of the reaction, as was previously observed for the 4-coordinate model. From the analysis of the Cα-Cβ-Cγ-Nε dihedral angle of Trp21, it follows that Trp21 does switch its conformation in the simulated time range (100 ns) when the monomer is empty (Figure S11). We also observed one flip from Trp21-B to Trp21-A for one monomer in a complex with the substrate, but it lasted only ~10 ns and did not result in forming a NAC state. However, spontaneous switching from Trp21-B to Trp21-A suggests that Trp21-A is a more stable conformation, as there were no observed flips from Trp21-A to Trp21-B. Furthermore, because Trp21-B naturally rotates into Trp21-A conformation and does it more often when the substrate is absent, it is likely that binding of the N-γ-ADABA molecule restrains the rotational freedom of Trp21.
2.3.3. Trp21 in the B-Conformation Prevents the Substrate from Adopting NAC
In all MD runs, both for 4-coordinate and 6-coordinate models, the indole ring of Trp21 is closer to the substrate molecule in the alternative orientation (Trp21-B) than in the previously analysed models with the Trp21-A conformation. Although the 4-coordinate Fe2+ models did not yield any spontaneous formation of NAC in either conformation of Trp21, the Trp21-B conformation even prevented forming a stable NAC state in forced PMF-umbrella sampling simulations, while the Trp21-A conformation produced an energetic minimum corresponding to the NAC. Models with the Trp21-B conformation also result in a loss of the hydrogen bonds between the substrate and Ser23, Tyr52 and Asn38 in the NAC conformation, compared to the model with the Trp21-A conformation. Since the mutual orientation of the active site residues and the substrate is not optimal, a severe energetic barrier was observed. In addition, the average distances between the indole ring and the substrate are shorter for models with the Trp21-B conformation than for Trp21-A models. Therefore, we conclude that the Trp21-B conformation prevents the substrate molecule from adopting a reactive NAC state.
3. Discussion
The results presented above show that the binding of the substrate N-γ-ADABA into the active site of EctC has a stabilising impact on the overall structure. Most notably, the α-II helical region and the β3/β4 loop are stabilised, likely due to the direct involvement of Arg25 in substrate binding. In the absence of the substrate, this arginine residue disrupts the folding of this region by interacting with backbone oxygen atoms.
Thanks to the umbrella sampling simulations for four-coordinate Fe2+ models and standard MD simulations performed for six-coordinate Fe2+ models, it was possible to show that in order to form a stable, catalytically competent version (NAC) of the Michaelis complex of EctC, the following conditions need to be satisfied: (1) The carboxyl group of the substrate forms two strong hydrogen bonds with Arg25, (2) the carboxyl group of the substrate forms one hydrogen bond with Tyr52, and (3) the substrate has a conformation in which its C4 atom interacts with the indole ring of Trp21. Moreover, there is also a strong hydrogen bond that forms sporadically between the carboxyl group of the substrate and Ser23. The importance of Trp21, Ser23, Arg25 and Tyr52 in forming the Michaelis complex of EctC might explain why these residues are highly conserved among EctC-type protein sequences and their replacement results in severe activity losses [1,2]. Notably, the above-mentioned conditions were not met in the models with the alternative conformation of Trp21 (Trp21-B). Hence, no spontaneous formation of NAC was observed in these models as the substrate was not able to form NAC-stabilising interactions with active site residues. Czech et al. hypothesised that the reorientation of Trp21 might help in enabling the EctC-catalysed reaction [1]. Here, we show that Trp21 does not spontaneously switch from the A to B conformation within the simulated time ranges, but it does switch in the opposite direction (from B to A). As the simulation time is limited (100 ns), it does not mean the A→B transition is not possible at all, but based on a very rough estimate from transition state theory for the simulation time, it is endoergic by at least 7 kcal/mol. Furthermore, we show that the B conformation of Trp21 is most likely nonproductive by contributing to the occurrence of an energetic barrier associated with the formation of NAC. Finally, we show that there is a higher chance of NAC formation in an EctC model with 6-coordinate Fe2+ and Trp21 in conformation A than in a model with tetrahedral four-coordinate Fe2+. In the former model, NAC formation occurs spontaneously during the simulation, whereas in the latter, an umbrella sampling was required to enforce NAC formation and probe this region of conformational space. In summary, the results presented here suggest the catalytic reaction of EctC most likely proceeds for six-coordinate Fe2+ and Trp21 in the A conformation, the latter being consistent with the crystal structure for the EctC-ectoine complex (PDB: 5ONO).
The information concerning EctC-N-γ-ADABA interactions gained in this study will inform further studies on EctC, including ongoing structural and QM/MM investigations into its reaction mechanism.
4. Materials and Methods
4.1. Molecular Modelling Models
The starting point for the calculations was the crystal structure of EctC from P. lautus (PDB code: 5ONN) [1], which is so far the only structure of the enzyme in complex with the substrate, i.e., N-γ-ADABA.
To overcome the lack of the 5ONN crystal structure in dimeric form, homology modelling was performed, in which the crystal structure of EctC from Sphingopyxis alaskensis (SaEctC) was used as a template (PDB code: 5BXX) [2]. The latter structure has an apo form of a homodimer with a 16-aa-long part of the C-terminus unresolved in each monomer. Even though the sequence identity between PlEctC and SaEctC is just 43.4%, the structural similarity is remarkably high: after aligning the template dimer with a newly modelled dimer in PyMOL, the RMSD value of the structural alignment was 0.5 Å (Figure S6).
The model of the 5ONN dimer was prepared as a basis for building two other models with ionised Tyr84 and Fe2+, the latter being the most probable oxidation state according to the available experimental results [1,2]. The only difference between the models was the conformation of Trp21: the first model contains the prevailing Trp21 conformation (Figure 2C, “Trp-A”), and the second one contains the alternative conformation of Trp21 (Figure 2C, “Trp-B”). Each model served as a starting point for molecular dynamics simulations. The protonation states of amino acids at pH = 8, the optimum for the enzymatic activity of EctC, were calculated with the use of PropKa software [28,29].
4.2. Model with 4-Coordinate Fe2+
The first model of the EctC dimer was created using the bonded force field approach for describing the tetrahedral Fe2+ binding sites; tetrahedral geometry around the metal ion was observed in the 5ONN crystal structure. However, the bond lengths between iron and its ligands in the 5ONN crystal structure are too long for an effective coordination, i.e., they equal: 2.93 Å (Fe-Glu57), 2.75 Å (Fe-Tyr84), 2.82 Å (Fe-His92) and 2.78 Å (Fe-N-γ-ADABA), while the typical Fe-ligand bond lengths should be close to 2 Å [30] (Figure 12). Hence, the geometries around the iron atoms in both monomers needed to be corrected prior to performing molecular dynamics simulation for the bonded model. To achieve this, the force field parameters for Fe2+-ligand bonds, valence angles and atomic partial charges were taken from our previous work [31]. The substrate molecule was described with the GAFF2 force field, with charges fitted with the RESP procedure.
4.3. Models with 6-Coordinate Fe2+
Nonheme iron enzymes with iron ions bound to O- and N-ligands typically feature a 6-coordinated metal ion in octahedral geometry. As the Fe occupancy in the 5ONN crystal structure is rather low (0.38), there is a possibility that the tetrahedral coordination of Fe2+ noticed in this structure is not representative for the holo form of the enzyme. Hence, in parallel to the 4-coordinate model, we decided to build and use for the MD simulations a model with 6-coordinate metal ions. Apart from Glu57, Tyr84 and His92, no other protein residues were close enough to the metal ion that they could possibly coordinate the Fe2+ ion. Therefore, to form a 6-coordination geometry, two water molecules were added as Fe2+-coordinating ligands in positions trans to Tyr84(-) and His92. In the new, octahedral geometry of the iron, the metal ion was coordinated by the N-γ-ADABA substrate, Glu57, Tyr84, His92 and two water molecules (Figure 13). In the case of the unoccupied monomers lacking the N-γ-ADABA substrate, a third water molecule was added to coordinate the Fe2+ ion. Here, a nonbonded approach was used, in which no explicit parameters for the bonds and angles involving metal ions were required as the metal-ligand interactions were treated by electrostatic and van der Waals force field terms. There are few nonbonded models for describing the metal ion and here the 12-6-4 LJ type of nonbonded model from the AMBER force field was applied [32,33,34]. The nonbonded approach was a natural choice for a coordinatively saturated Fe2+ site, as it works well for such systems and allows for ligand exchange. Four versions of the EctC dimer with 6-coordinate Fe2+ geometry were prepared (Figure S7).
4.4. Classical MD Simulations
Prior to MD simulations, each protein model was placed in a virtual box with 10 Åmargin between the protein and the box walls. Then, in order to mimic the physiological fluid, explicit TIP3P water molecules were added to the box, amounting to the following numbers: 14,641 (4-coordinate model), 13,129 (6-coordinate model with both monomers in the form of a Michaelis complex with substrate), 13,123 (6-coordinate model with both monomers empty) and 13,129 (6-coordinate model with one empty monomer and one monomer in complex with the substrate). To neutralise the system charge and create ionic strength, such as the one of physiological fluid, Na+ and Cl− ions were added. All of the steps described above were taken with the tleap programme from the AmberTools package [32]. Thus, prepared and charge-neutralised EctC models were subjected to energy minimisation during four consecutive stages: first, just the water molecules and ions underwent relaxation (with atomic positions of the protein complex restrained with a force constant of 500 kcal/mol·Å2), then protein complexes were relaxed by gradually decreasing the force constant of positional restraints: from 20 through 10 to 0 kcal/mol·Å2. After energy minimization, heating was simulated from 0 to 300 K during a 50-ps-long MD simulation under constant volume conditions with a Langevin thermostat and the system then underwent a second, 500-ps-long equilibration at a constant pressure of 1 bar. Thus, the models were ready for the production stage of the molecular dynamics simulations. During this stage of the MD, pressure and temperature were kept constant at 1 bar and 300 K, respectively, the frequency of saving current geometry to a data file was set to once per every 5000 steps, and the SHAKE algorithm was used to constrain values of valence bonds and angles, including hydrogen atoms. The time step of the simulation was set to 2 fs and each production MD simulation was run for 100 ns in total. The pmemd programme from the AMBER package was selected for running the simulations [32].
The bonded model with 4-coordination geometry around the Fe2+ ion underwent one 100-ns-long molecular dynamics simulation, while each 6-coordinate nonbonded model (Figure 7) underwent three MD simulations in order to gain enough data for structural studies.
To analyse the MD trajectories, the cpptraj programme from AmberTools was used [32], particularly for the following purposes: (1) to cluster the MD geometries according to structural similarities using the HierAgglo algorithm; (2) to calculate the RMSF values (root-mean-square fluctuations) of atoms, which depict the stability of protein regions across the trajectory, (3) to analyse the hydrogen bond formation between the substrate and amino acids from any of the active sites and (4) to analyse the native contacts between certain residues.
4.5. PMF from an Umbrella Sampling Simulation
For the performed umbrella sampling simulations, the free energy profile along the reaction coordinate was assessed by calculating the PMF (potential of mean force). Here, the distance between the C2 and N2 atoms of N-γ-ADABA was defined as the reaction coordinate used for scanning the progress of the reaction (Figure S2). The PMF calculations were applied to the bonded model with tetrahedral geometry around the Fe2+ ion. Each PMF simulation was run with a constraint of 20 kcal/mol·Å2 on the N2-C2 distance, which was scanned back and forth from 2.7 Å (bent geometry, NAC) to 5.7 Å (extended conformation of the substrate) with 16 intermediate sample distances between these two boundary values, amounting to 18 MD reaction “windows” along the N2-C2 coordinate. For each window, a 1-ns-long equilibration of the system was performed first, followed by a 3-ns-long “production” MD simulation period. Relative free energies of the substrate-enzyme complexes were calculated with the use of the WHAM programme (weighted histogram analysis method) [35]. The time step of the molecular dynamic procedure was set to 2 fs, with geometries saved to file once every 500 steps using the SHAKE algorithm for bonds and angles created by hydrogen atoms. Temperature and pressure were kept constant, at 300 K and 1 bar, respectively. The PMEMD programme was used for MD simulations, including its GPU implementation [36,37].
Supplementary Materials
The following supporting information can be downloaded at: https://0-www-mdpi-com.brum.beds.ac.uk/article/10.3390/catal13010124/s1. Figure S1: Ectoine synthase dimer from P. Lautus (PDB: 5ONN) with both monomers occupied by the ligand molecules. Interface of dimerization marked with labels of interacting β-strands; Figure S2: The substrate geometry from the 5ONN crystal structure. Atoms labelled and PMF reaction coordinate (C2-N2 distance) indicated with blue dotted line. N1-C3-C4-C5 dihedral marked with a red bent arrow; Figure S3: Structural alignment of five centroid geometries for the occupied (A) and empty (B) EctC monomers. A: Zoom into the Arg25-N-𝛾-ADABA mutual orientation. B: zoom into the multiple orientations of Arg25; Figure S4: Graph of the C2-N2 distance in N-𝛾-ADABA molecules bonded to both monomers in the EctC dimer for the model with the Trp21-A or Trp21-B conformation. Top: Graph of the C2-N2 distance in N-𝛾-ADABA molecules bonded to both monomers in the EctC dimer for the model with the Trp21-A conformation. Bottom: Graph of the C2-N2 distance in N-𝛾-ADABA molecules bonded to both monomers in the EctC dimer for the model with the Trp21-B conformation. The measurements were extracted from the 100 ns long MD simulations for the bonded model with tetrahedral geometry around Fe2+; Figure S5: Conformation of Trp21 in MD for 4-coordinate bonded model. Left: the C𝛼-Cβ-C𝛾-Nε dihedral values calculated for Trp21 in both monomers in MD for 4-coordinate bonded model. Right: Trp21 in the Trp21-A conformation with the C𝛼-Cβ-C𝛾-Nε dihedral marked with red bent arrow; Figure S6: The homology modelling of P/EctC dimer. (A) The homology modelling template, EctC from S. alaskensis. PDB:5BXX [2](DOI:10.2210/pdb5BXX/pdb). (B) Structural alignment of the template (blue) and new model (yellow). (C) Two 5ONN monomers sequentially aligned with both monomers from the 5BXX dimer resulting in a new 5ONN dimer; Figure S7: 6-coordinate Fe2+ models of EctC dimer with different monomer occupations: (A) both monomers empty, (B) both monomers occupied, (C) monomer A occupied; monomer B empty, (D) monomer A empty; monomer B occupied; Figure S8: Graphs of the C2-N2 distances for MD trajectories for the dimers with at least one monomer in a form of the Michaelis complex. Some NAC states (C2-N2 oscillates around 3.2 Å) persisted for long periods during the simulation (yellow, blue) and some lasted shorter (green, pink, orange); Figure S9: The C𝛼-Cβ-C𝛾-Nε dihedral values for Trp21 in MD simulations for the 6-coordinate Fe2+ models of EctC dimer. The C𝛼-Cβ-C𝛾-Nε dihedral values calculated for Trp21-A in both monomers in all twelve MD simulations for the 6-coordinate Fe2+ models of EctC dimer: first 3 MD for the model with both monomers empty, then 3 MD for the model with both monomers occupied, then 3 MD for the model with the first monomer occupied/second empty and last 3 MD for the model with the first monomer empty/second occupied. Trp-A conformation has values around −100 deg; Trp-B around +90 deg; Figure S10: Conformation of Trp21(B) in MD for 4-coordinate bonded model. Left: C𝛼-Cβ-C𝛾-Nε dihedral values for Trp21-B (both EctC monomers) in MD trajectories for 4-coordinate Fe2+ model. Right: Trp21 in the Trp21-B conformation with C𝛼-Cβ-C𝛾-Nε dihedral marked with the red bent arrow; Figure S11: The C𝛼-Cβ-C𝛾-Nε dihedral values for Trp21(B) in MD simulations for the 6-coordinate Fe2+ models of EctC dimer. The C𝛼-Cβ-C𝛾-Nε dihedral values calculated for Trp21(B) in both monomers in all twelve MDs for the 6-coordinate Fe2+ models of EctC dimer: first 3 MD for the model with both monomers empty, then 3 MD for the model with both monomers occupied, then 3 MD for the model with the first monomer in the complex occupied/second empty and last 3 MD for the model with the first monomer empty/second occupied. Trp-A conformation has values around −100 deg; Trp-B around +90 deg; Table S1: Force field (bonded model) parameters describing the geometry around Fe2+ ion with tetrahedral geometry. Reference (equilibrium) values and force constants of bonds between Fe2+ and its ligands are listed in the “Bond” section: O2 stands for the carboxyl oxygen of Glu57, OH for the tyrosyl oxygen of Tyr84, O for the substrate carbonyl oxygen and NB for the 𝜀-nitrogen atom of His92. Analogously, the “Angle’’ section refers to the angles involving Fe2+.
Author Contributions
J.A.-O., methodology, investigation, data curation, visualisation, writing—original draft; J.H., conceptualization, validation, writing—original draft; T.B., conceptualization, methodology, data curation, validation, writing—original draft, supervision, project administration, funding acquisition. All authors have read and agreed to the published version of the manuscript.
Funding
This research received no external funding.
Data Availability Statement
Refined structures of EctC-Fe-N-γ-ADABA complexes have been deposited in the modelarchive.org database. Two models of dimers fully occupied with substrate, one for four-coordinate Fe2+ and one for six-coordinate Fe2+. The geometries are centroids of dominating clusters of MD trajectories, clustering was conducted based on protein backbone geometry.
Acknowledgments
This research was supported in part by the PL-Grid Infrastructure. Computations were performed at Academic Computer Centre Cyfronet AGH. This research was funded by the statutory research fund of ICSC PAS.
Conflicts of Interest
Authors declare no conflict of interest.
References
- Czech:, L.; Höppner, A.; Kobus, S.; Seubert, A.; Riclea, R.; Dickschat, J.S.; Heider, J.; Smits, S.H.J.; Bremer, E. Illuminating the Catalytic Core of Ectoine Synthase through Structural and Biochemical Analysis. Sci. Rep. 2019, 9, 364. [Google Scholar] [CrossRef] [Green Version]
- Widderich, N.; Kobus, S.; Höppner, A.; Riclea, R.; Seubert, A.; Dickschat, J.S.; Heider, J.; Smits, S.H.J.; Bremer, E. Biochemistry and Crystal Structure of Ectoine Synthase: A Metal-Containing Member of the Cupin Superfamily. PLoS ONE 2016, 11, e0151285. [Google Scholar] [CrossRef] [Green Version]
- Hermann, L.; Mais, C.N.; Czech, L.; Smits, S.H.J.; Bange, G.; Bremer, E. The Ups and Downs of Ectoine: Structural Enzymology of a Major Microbial Stress Protectant and Versatile Nutrient. Biol. Chem. 2020, 401, 1443–1468. [Google Scholar] [CrossRef]
- Czech, L.; Hermann, L.; Stöveken, N.; Richter, A.; Höppner, A.; Smits, S.; Heider, J.; Bremer, E. Role of the Extremolytes Ectoine and Hydroxyectoine as Stress Protectants and Nutrients: Genetics, Phylogenomics, Biochemistry, and Structural Analysis. Genes 2018, 9, 177. [Google Scholar] [CrossRef] [Green Version]
- Czech, L.; Bremer, E. With a Pinch of Extra Salt—Did Predatory Protists Steal Genes from Their Food? PLoS Biol. 2018, 16, e2005163. [Google Scholar] [CrossRef] [PubMed] [Green Version]
- Fenizia, S.; Thume, K.; Wirgenings, M.; Pohnert, G. Ectoine from Bacterial and Algal Origin Is a Compatible Solute in Microalgae. Mar. Drugs 2020, 18, 42. [Google Scholar] [CrossRef] [PubMed] [Green Version]
- Ma, Z.; Wu, C.; Zhu, L.; Chang, R.; Ma, W.; Deng, Y.; Chen, X. Bioactivity Profiling of the Extremolyte Ectoine as a Promising Protectant and Its Heterologous Production. 3 Biotech 2022, 12, 331. [Google Scholar] [CrossRef] [PubMed]
- Graf, R.; Anzali, S.; Buenger, J.; Pfluecker, F.; Driller, H. The Multifunctional Role of Ectoine as a Natural Cell Protectant. Clin. Dermatol. 2008, 26, 326–333. [Google Scholar] [CrossRef] [PubMed]
- Schröter, M.A.; Meyer, S.; Hahn, M.B.; Solomun, T.; Sturm, H.; Kunte, H.J. Ectoine Protects DNA from Damage by Ionizing Radiation. Sci. Rep. 2017, 7, 1–7. [Google Scholar] [CrossRef] [Green Version]
- Kolp, S.; Pietsch, M.; Galinski, E.A.; Gütschow, M. Compatible Solutes as Protectants for Zymogens against Proteolysis. Biochim. Biophys. Acta. Proteins Proteom. 2006, 1764, 1234–1242. [Google Scholar] [CrossRef] [PubMed]
- Tanne, C.; Golovina, E.A.; Hoekstra, F.A.; Meffert, A.; Galinski, E.A. Glass-Forming Property of Hydroxyectoine Is the Cause of Its Superior Function as a Desiccation Protectant. Front. Microbiol. 2014, 5, 150. [Google Scholar] [CrossRef] [PubMed] [Green Version]
- Brands, S.; Schein, P.; Castro-Ochoa, K.F.; Galinski, E.A. Hydroxyl Radical Scavenging of the Compatible Solute Ectoine Generates Two N-Acetimides. Arch. Biochem. Biophys. 2019, 674, 108097. [Google Scholar] [CrossRef]
- Goraj, W.; Stępniewska, Z.; Szafranek-Nakonieczna, A. Biosynthesis and the Possibility of Using Ectoine and Hydroxyectoine in Health Care. Postępy Mikrobiol.-Adv. Microbiol. 2019, 58, 339–349. [Google Scholar] [CrossRef] [Green Version]
- Czech, L.; Poehl, S.; Hub, P.; Stöveken, N.; Bremer, E. Tinkering with Osmotically Controlled Transcription Allows Enhanced Production and Excretion of Ectoine and Hydroxyectoine from a Microbial Cell Factory. Appl. Environ. Microbiol. 2018, 84, e01772-17. [Google Scholar] [CrossRef] [PubMed] [Green Version]
- Liu, M.; Liu, H.; Shi, M.; Jiang, M.; Li, L.; Zheng, Y. Microbial Production of Ectoine and Hydroxyectoine as High-Value Chemicals. Microb. Cell Fact. 2021, 20, 76. [Google Scholar] [CrossRef] [PubMed]
- Pérez, V.; Moltó, J.L.; Lebrero, R.; Muñoz, R. Ectoine Production from Biogas in Waste Treatment Facilities: A Techno-Economic and Sensitivity Analysis. ACS Sustain. Chem. Eng. 2021, 9, 17371–17380. [Google Scholar] [CrossRef]
- Hobmeier, K.; Oppermann, M.; Stasinski, N.; Kremling, A.; Pflüger-Grau, K.; Kunte, H.J.; Marin-Sanguino, A. Metabolic Engineering of Halomonas Elongata: Ectoine Secretion Is Increased by Demand and Supply Driven Approaches. Front. Microbiol. 2022, 13, 968983. [Google Scholar] [CrossRef]
- Bestvater, T.; Louis, P.; Galinski, E.A. Heterologous Ectoine Production in Escherichia Coli: By-Passing the Metabolic Bottle-Neck. Saline Syst. 2008, 4, 12. [Google Scholar] [CrossRef] [Green Version]
- Sauer, T.; Galinski, E.A. Bacterial Milking: A Novel Bioprocess for Production of Compatible Solutes. Biotechnol. Bioeng. 1998, 57, 306–313. [Google Scholar] [CrossRef]
- Bilstein, A.; Heinrich, A.; Rybachuk, A.; Mösges, R. Ectoine in the Treatment of Irritations and Inflammations of the Eye Surface. Biomed. Res. Int. 2021, 2021, 8–10. [Google Scholar] [CrossRef]
- Nosch, D.S.; Joos, R.E.; Job, M. Prospective Randomized Study to Evaluate the Efficacy and Tolerability of Ectoin® Containing Eye Spray (EES09) and Comparison to the Liposomal Eye Spray Tears Again® (TA) in the Treatment of Dry Eye Disease. Contact. Lens Anterior. Eye 2021, 44, 101318. [Google Scholar] [CrossRef]
- Müller, D.; Lindemann, T.; Shah-Hosseini, K.; Scherner, O.; Knop, M.; Bilstein, A.; Mösges, R. Efficacy and Tolerability of an Ectoine Mouth and Throat Spray Compared with Those of Saline Lozenges in the Treatment of Acute Pharyngitis and/or Laryngitis: A Prospective, Controlled, Observational Clinical Trial. Eur. Arch. Oto-Rhino-Laryngol. 2016, 273, 2591–2597. [Google Scholar] [CrossRef] [Green Version]
- Marini, A.; Reinelt, K.; Krutmann, J.; Bilstein, A. Ectoine-Containing Cream in the Treatment of Mild to Moderate Atopic Dermatitis: A Randomised, Comparator-Controlled, Intra-Individual Double-Blind, Multi-Center Trial. Ski. Pharm. Physiol. 2014, 27, 57–65. [Google Scholar] [CrossRef] [PubMed]
- Dunwell, J.M.; Culham, A.; Carter, C.E.; Sosa-Aguirre, C.R.; Goodenough, P.W. Evolution of Functional Diversity in the Cupin Superfamily. Trends. Biochem. Sci. 2001, 26, 740–746. [Google Scholar] [CrossRef] [PubMed]
- Bateman, A.; Martin, M.J.; Orchard, S.; Magrane, M.; Agivetova, R.; Ahmad, S.; Alpi, E.; Bowler-Barnett, E.H.; Britto, R.; Bursteinas, B.; et al. UniProt: The Universal Protein Knowledgebase in 2021. Nucleic. Acids. Res. 2021, 49, D480–D489. [Google Scholar] [CrossRef]
- Sievers, F.; Wilm, A.; Dineen, D.; Gibson, T.J.; Karplus, K.; Li, W.; Lopez, R.; McWilliam, H.; Remmert, M.; Söding, J.; et al. Fast, Scalable Generation of High-Quality Protein Multiple Sequence Alignments Using Clustal Omega. Mol. Syst. Biol. 2011, 7, 539. [Google Scholar] [CrossRef]
- Waterhouse, A.M.; Procter, J.B.; Martin, D.M.A.; Clamp, M.; Barton, G.J. Jalview Version 2-A Multiple Sequence Alignment Editor and Analysis Workbench. Bioinformatics 2009, 25, 1189–1191. [Google Scholar] [CrossRef] [Green Version]
- Søndergaard, C.R.; Olsson, M.H.M.; Rostkowski, M.; Jensen, J.H. Improved Treatment of Ligands and Coupling Effects in Empirical Calculation and Rationalization of p Kavalues. J. Chem. Theory Comput. 2011, 7, 2284–2295. [Google Scholar] [CrossRef]
- Olsson, M.H.M.; Søndergaard, C.R.; Rostkowski, M.; Jensen, J.H. PROPKA3: Consistent Treatment of Internal and Surface Residues in Empirical p K a Predictions. J. Chem. Theory Comput. 2011, 7, 525–537. [Google Scholar] [CrossRef] [PubMed]
- Zheng, H.; Langner, K.M.; Shields, G.P.; Hou, J.; Kowiel, M.; Allen, F.H.; Murshudov, G.; Minor, W. Data Mining of Iron(II) and Iron(III) Bond-Valence Parameters, and Their Relevance for Macromolecular Crystallography. Acta. Cryst. D Struct. Biol. 2017, 73, 316–325. [Google Scholar] [CrossRef]
- Andrys, J.; Heider, J.; Borowski, T. Comparison of Different Approaches to Derive Classical Bonded Force-Field Parameters for a Transition Metal Cofactor. A Case Study for Non-Heme Iron Site of Ectoine Synthase. Theor. Chem. Acc. 2021, 140, 115. [Google Scholar] [CrossRef]
- Pearlman, D.A.; Case, D.A.; Caldwell, J.W.; Ross, W.S.; Cheatham, T.E.; DeBolt, S.; Ferguson, D.; Seibel, G.; Kollman, P. AMBER, a Package of Computer Programs for Applying Molecular Mechanics, Normal Mode Analysis, Molecular Dynamics and Free Energy Calculations to Simulate the Structural and Energetic Properties of Molecules. Comput. Phys. Commun. 1995, 91, 1–41. [Google Scholar] [CrossRef]
- Li, P.; Song, L.F.; Merz, K.M. Parameterization of Highly Charged Metal Ions Using the 12-6-4 LJ-Type Nonbonded Model in Explicit Water. J. Phys. Chem. B 2015, 119, 883–895. [Google Scholar] [CrossRef] [Green Version]
- Tian, C.; Kasavajhala, K.; Belfon, K.A.A.; Raguette, L.; Huang, H.; Migues, A.N.; Bickel, J.; Wang, Y.; Pincay, J.; Wu, Q.; et al. Ff19SB: Amino-Acid-Specific Protein Backbone Parameters Trained against Quantum Mechanics Energy Surfaces in Solution. J. Chem. Theory Comput. 2020, 16, 528–552. [Google Scholar] [CrossRef]
- Kumar, S.; Rosenberg, J.M.; Bouzida, D.; Swendsen, R.H.; Kollman, P.A. THE Weighted Histogram Analysis Method for Free-Energy Calculations on Biomolecules. I. The Method. J. Comput. Chem. 1992, 13, 1011–1021. [Google Scholar] [CrossRef]
- le Grand, S.; Götz, A.W.; Walker, R.C. SPFP: Speed without Compromise-A Mixed Precision Model for GPU Accelerated Molecular Dynamics Simulations. Comput. Phys. Commun. 2013, 184, 374–380. [Google Scholar] [CrossRef]
- Salomon-Ferrer, R.; Götz, A.W.; Poole, D.; le Grand, S.; Walker, R.C. Routine Microsecond Molecular Dynamics Simulations with AMBER on GPUs. 2. Explicit Solvent Particle Mesh Ewald. J. Chem. Theory Comput. 2013, 9, 3878–3888. [Google Scholar] [CrossRef]
Figure 1.
EctC-catalyzed cyclocondensation of N-γ-acetyl-L-2,4-diaminobutyric acid to ectoine with water elimination.
Figure 1.
EctC-catalyzed cyclocondensation of N-γ-acetyl-L-2,4-diaminobutyric acid to ectoine with water elimination.

Figure 2.
(A) EctC monomer from P. lautus with labelled secondary structure elements; iron ion in orange and N-γ-ADABA substrate molecule in purple. (B) Zoom into the iron binding site with Glu57, Tyr84, His92 and N-γ-ADABA (shown as sticks) coordinating the iron ion. Note that the bond lengths between the metal and its ligands are too long for effective coordination. (C) Zoom into the active site of EctC with Trp21 (two possible orientations, Trp-A/Trp-B), Arg25, Asn38, Thr40 and Tyr52 interacting with the ligand (purple). Orange dots mark hydrogen bonds between the substrate molecule and neighbouring amino acid residues in the crystal structure [1] (PDB code: 5ONN). (D) Zoom into the structure of the N-terminus, which changes from unordered in the monomer to a β structure upon dimerization (yellow—5ONN crystal structure—monomeric form; green—fragment of the dimeric model).

Figure 3.
Multiple sequence alignment (MSA) of randomly selected EctC protein sequences from the UniProt database [25], obtained with the Clustal Omega programme [26] and visualised with JalView [27]. The MSA result is coloured according to the amino acid conservation: from the most conserved residues (dark blue) to the least conserved (white). Red dots indicate the residues participating in substrate binding, while green dots indicate the metal-binding amino acids. Below the MSA is the conservation section prepared with JalView, which scales from 0 (deep brown) to 10 (bright yellow) the conservation of physio-chemical properties in the MSA.

Figure 4.
The centroid geometries for dominating clusters from 100-ns-long MD for the model with four-coordinate Fe2+ and Trp21-A: (A) centroid of an active site in monomer 1; (B) centroid of an active site in monomer 2. Hydrogen bonds are shown as green dashed lines.
Figure 4.
The centroid geometries for dominating clusters from 100-ns-long MD for the model with four-coordinate Fe2+ and Trp21-A: (A) centroid of an active site in monomer 1; (B) centroid of an active site in monomer 2. Hydrogen bonds are shown as green dashed lines.

Figure 5.
The free energy changes (PMF profile) for the C2-N2 distance: forward (from 5.7 to 2.7 Å) (blue) and backwards (from 2.7 to 5.7 Å) (red).
Figure 5.
The free energy changes (PMF profile) for the C2-N2 distance: forward (from 5.7 to 2.7 Å) (blue) and backwards (from 2.7 to 5.7 Å) (red).

Figure 6.
Time profiles of the N1-C3-C4-C5 dihedral angle values (left column) and representative correlated active site geometries extracted from three MD windows (right column). The dihedral angles are indicated by red, bent arrows on the graphics. Yellow dashed lines show hydrogen bonds present in given geometry of an active site, blue dotted line indicates the C2-N2 distance in the substrate and magenta dotted line shows the distance between the substrate (C4 carbon atom) and the indole ring of Trp21 (CZ2 carbon atom). The three MD windows approximate the two minima and one maximum on the free energy plot (see Figure 5). Top (A): the minimum with 5.32 Å C2-N2 distance, middle (B): maximum with 4.7 Å C2-N2 distance, bottom (C): NAC with 3.5 Å C2-N2 distance.

Figure 7.
Alignment of monomer centroids (all in the holo form with Fe2+) from: (A) MD in which both monomers are empty; (B) MD in which both monomers are occupied by the substrate; (C,D) MD in which one monomer is in complex with the substrate (monomer 1 in (C); monomer 2 in (D)) while the other is empty. Monomer 1 is in yellow, monomer 2 is in pink. Blue frames embrace the α-II helix.

Figure 8.
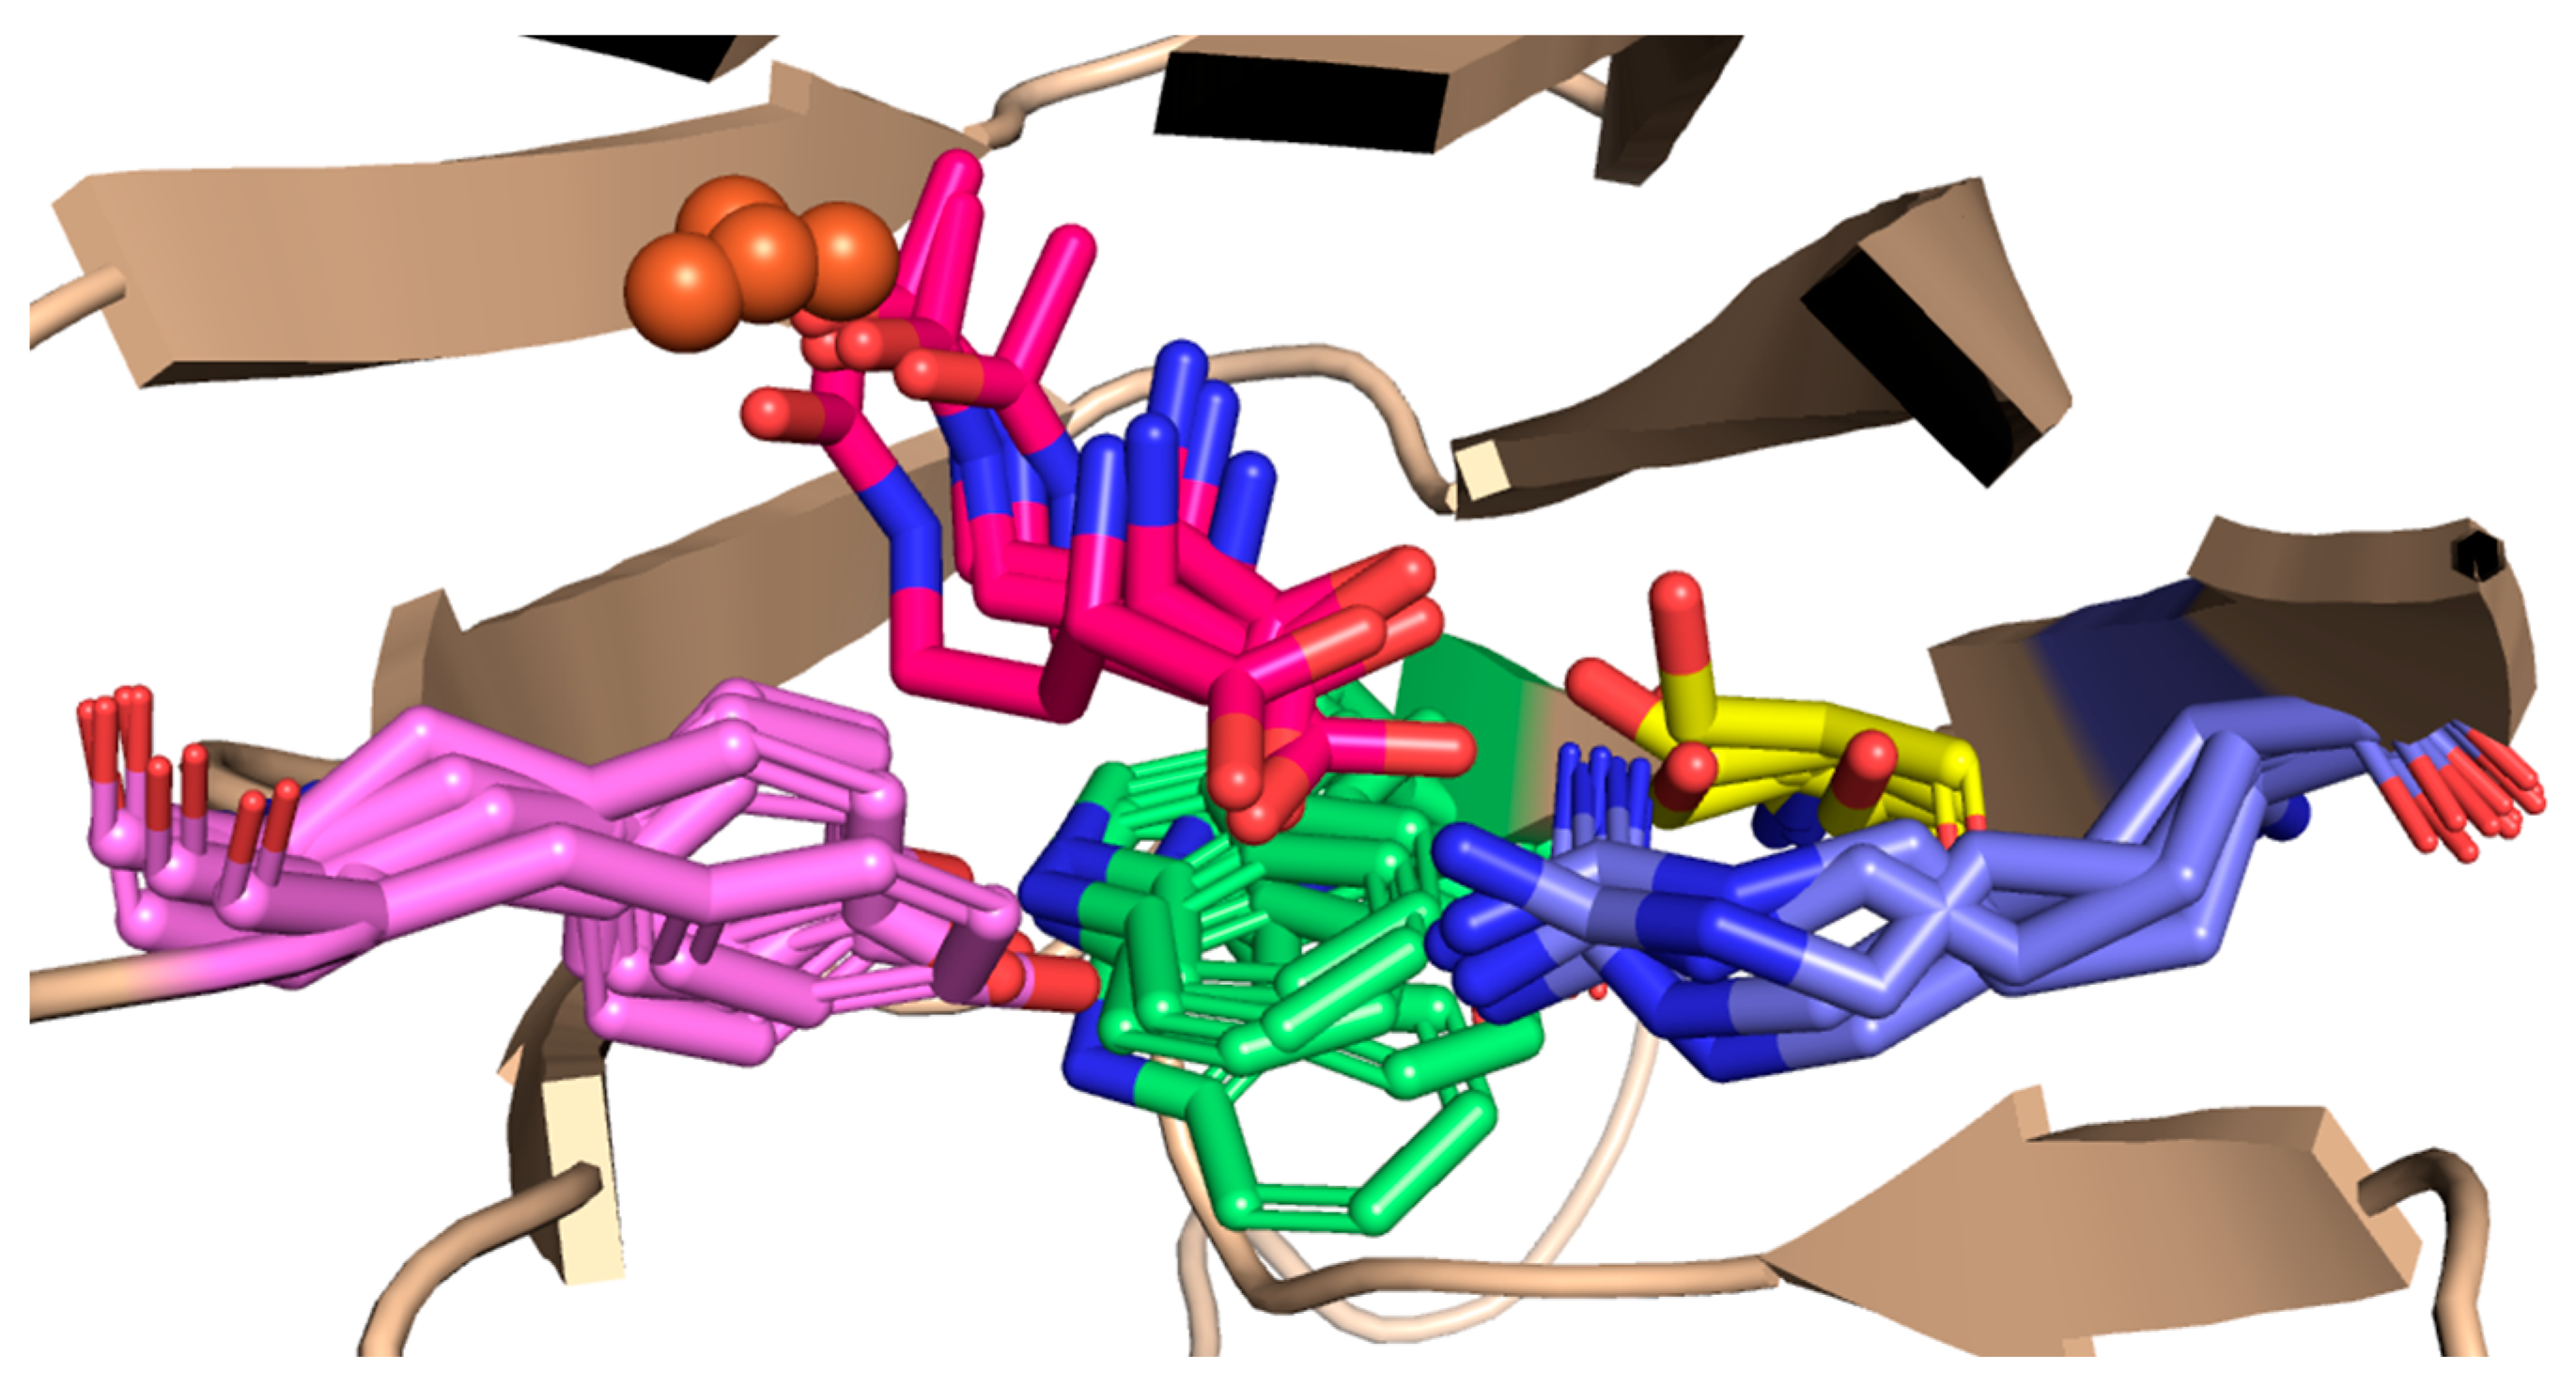
Structural alignment of representative structures correlated to the NAC state in octahedrally coordinated EctC; the substrate (magenta), Trp21 (green), Arg25 (purple), Tyr52 (pink) and Ser23 (yellow).
Figure 8.
Structural alignment of representative structures correlated to the NAC state in octahedrally coordinated EctC; the substrate (magenta), Trp21 (green), Arg25 (purple), Tyr52 (pink) and Ser23 (yellow).

Figure 9.
The centroid geometries for dominating clusters from 100-ns-long MD for the model with four-coordinate Fe2+ and Trp21-B: (A) active site in monomer 1; (B) active site in monomer 2. Hydrogen bonds are shown as green dashed lines.
Figure 9.
The centroid geometries for dominating clusters from 100-ns-long MD for the model with four-coordinate Fe2+ and Trp21-B: (A) active site in monomer 1; (B) active site in monomer 2. Hydrogen bonds are shown as green dashed lines.

Figure 10.
The free energy changes (PMF profile) for the C2-N2 distance for the model with the Trp21-B conformation: forward (from 5.7 to 2.7 Å) (blue) and backwards (from 2.7 to 5.7 Å) (red).
Figure 10.
The free energy changes (PMF profile) for the C2-N2 distance for the model with the Trp21-B conformation: forward (from 5.7 to 2.7 Å) (blue) and backwards (from 2.7 to 5.7 Å) (red).

Figure 11.
The representative geometries extracted from two MD windows: (A) centroid approximating the minimum on the plot, (B) centroid approximating a hypothetical NAC. Yellow dashed lines show hydrogen bonds present in given geometry of an active site, blue dotted line indicates the C2-N2 distance in the substrate and magenta dotted line shows the distance between the substrate (C4 carbon atom) and the indole ring of Trp21 (CZ2 carbon atom).

Figure 12.
Zoom view into the model with tetrahedral geometry around the Fe2+ ion; bonded force field model with parameters listed in Table S1.
Figure 12.
Zoom view into the model with tetrahedral geometry around the Fe2+ ion; bonded force field model with parameters listed in Table S1.

Figure 13.
Zoom into the octahedral geometry around the Fe2+ ion in a 12-6-4-LJ nonbonded model. Two water molecules, Wat1 and Wat2, added as Fe2+ coordinating ligands.
Figure 13.
Zoom into the octahedral geometry around the Fe2+ ion in a 12-6-4-LJ nonbonded model. Two water molecules, Wat1 and Wat2, added as Fe2+ coordinating ligands.


Table 1.
The RMSF values calculated for the α-II helix in: MDs for models with one monomer empty (E) and another one occupied (O) in dimers partially occupied (EO/OE, Figure S7C,D) (orange colour); and MDs for models with EctC monomers both occupied (OO, Figure S7B) or both empty (EE, Figure S7A) (purple colour).
| O in EO/OE | E in EO/OE | O in OO | E in EE | |
|---|---|---|---|---|
| avg. RMSF [Å] | 1.84 | 2.34 | 1.87 | 3.28 |
| stdev [Å] | 0.36 | 0.75 | 0.29 | 0.65 |
Disclaimer/Publisher’s Note: The statements, opinions and data contained in all publications are solely those of the individual author(s) and contributor(s) and not of MDPI and/or the editor(s). MDPI and/or the editor(s) disclaim responsibility for any injury to people or property resulting from any ideas, methods, instructions or products referred to in the content. |
© 2023 by the authors. Licensee MDPI, Basel, Switzerland. This article is an open access article distributed under the terms and conditions of the Creative Commons Attribution (CC BY) license (https://creativecommons.org/licenses/by/4.0/).
Share and Cite
MDPI and ACS Style
Andrys-Olek, J.; Heider, J.; Borowski, T. Molecular Dynamics Simulations for the Michaelis Complex of Ectoine Synthase (EctC). Catalysts 2023, 13, 124. https://0-doi-org.brum.beds.ac.uk/10.3390/catal13010124
AMA Style
Andrys-Olek J, Heider J, Borowski T. Molecular Dynamics Simulations for the Michaelis Complex of Ectoine Synthase (EctC). Catalysts. 2023; 13(1):124. https://0-doi-org.brum.beds.ac.uk/10.3390/catal13010124
Chicago/Turabian StyleAndrys-Olek, Justyna, Johann Heider, and Tomasz Borowski. 2023. "Molecular Dynamics Simulations for the Michaelis Complex of Ectoine Synthase (EctC)" Catalysts 13, no. 1: 124. https://0-doi-org.brum.beds.ac.uk/10.3390/catal13010124
Note that from the first issue of 2016, this journal uses article numbers instead of page numbers. See further details here.