Article

Effect of Pd-Doping Concentrations on the Photocatalytic, Photoelectrochemical, and Photoantibacterial Properties of CeO2

by
Shaidatul Najihah Matussin
1,
Fazlurrahman Khan
2,3,
Mohammad Hilni Harunsani
1,
Young-Mog Kim
2,3,4 and
Mohammad Mansoob Khan
1,*
1
Chemical Sciences, Faculty of Science, Universiti Brunei Darussalam, Jalan Tungku Link, Gadong BE 1410, Brunei
2
Marine Integrated Biomedical Technology Center, The National Key Research Institutes in Universities, Pukyong National University, Busan 48513, Republic of Korea
3
Research Center for Marine Integrated Bionics Technology, Pukyong National University, Busan 48513, Republic of Korea
4
Department of Food Science and Technology, Pukyong National University, Busan 48513, Republic of Korea
*
Author to whom correspondence should be addressed.
Submission received: 1 December 2022 / Revised: 22 December 2022 / Accepted: 25 December 2022 / Published: 3 January 2023
(This article belongs to the Special Issue Structured Semiconductors in Photocatalysis)

Abstract

:
Cerium oxide (CeO2) can exhibit good photocatalytic and photoantibacterial activities. However, its light-harvesting property is rather limited due to its large band gap. In order to boost these properties, doping with metal ions can improve light absorption and charge mobility. In this report, CeO2 and palladium−doped CeO2 (Pd−CeO2) NPs were synthesized via the microwave-assisted synthesis method. The structural, optical, and morphological studies of CeO2 and Pd−CeO2 NPs were carried out using various techniques. Mixed phases of CeO2/Ce2O3 were observed in pure CeO2 (S−CeO2) and Pd−CeO2. However, the Ce2O3 phase gradually disappeared upon doping with a higher percentage of Pd. Almost spherical particles were observed with average sizes between 6 and 13 nm. It was found that the incorporation of Pd reduced the particle size. Moreover, band gap energies of S−CeO2 and Pd−CeO2 NPs were reduced from 2.56 to 2.27 eV, and the PL intensities were also quenched with more Pd doping. The shifts in the conduction band and valence band were found to cause the reduction in the band gap energies of S−CeO2 and Pd−CeO2 NPs. In the case of photocatalytic degradation of methylene blue, photoelectrochemical, and photoantibacterial activities, Pd−CeO2 NPs showed enhanced activities under visible light irradiation. Therefore, Pd−CeO2 NPs have been shown to be a visible-light active material.

1. Introduction

Antibiotics have been used to treat bacterial infections that are major causes of chronic infections and mortality. However, studies found that the widespread use of antibiotics has led to the emergence of multidrug-resistant bacterial strains [1]. In general, the major groups of antibiotics that are currently in use have three bacterial targets, namely: cell wall synthesis, translational machinery, and DNA replication machinery [2]. However, bacterial resistance can develop at each mode of action. Nanoparticles (NPs) have demonstrated broad-spectrum antibacterial properties against Gram-positive and Gram-negative bacteria. Studies have revealed that NPs do not show antibiotic resistance mechanisms because NPs contact directly with the bacterial cell wall, which would be less prone to promoting resistance in bacteria. Therefore, NPs can be potentially used as an alternative antibiotic. According to research, the major processes underlying the antibacterial effects of NPs are disruption of the bacterial cell membrane, generation of ROS, penetration of bacterial cell membrane, and induction of intracellular antibacterial effects, including interactions with DNA and proteins [2,3].
Organic dyes, which generally consist of non-biodegradable, highly poisonous, and colored pigments, have been reported to be present and widely spread in industrial wastewater originating from the paper, textile, and apparel industries [4,5]. Even at low concentrations, dyes can be clearly seen and pollute various aquatic environments [6]. These dye-polluted effluents are harmful to living organisms [7]. Dyes such as methylene blue (MB) can also cause serious threats to humans, for example, abdominal disorders, respiratory problems, and digestive and mental disorders [8,9]. Hence, the removal of dyes from wastewater is important. Apart from that, redox reactions have shown promising water treatment activity as the reaction products can be conveniently separated and removed [10]. Owing to this, researchers have applied electrochemical systems to diverse functional applications, including photovoltaics [11], fuel cells [12], supercapacitors [13], as well as sensors [14]. It is reported that heterostructure exhibits interesting electrochemical properties owing to the possibility of a dual charge storage contribution from both materials [15]. Nevertheless, materials with high porosity and large surface areas are highly suitable for electrochemical applications [16].
Metal oxides such as TiO2 [17], ZnO [18], Fe2O3 [19], CeO2 [20], etc., have shown remarkable activities in biological and photocatalytic activities. Among these, CeO2 has shown extensive industrial applications in medicine, catalysis, solid oxide fuel cells, luminescence, optical, and sensor technologies [21,22,23,24,25]. Despite being a highly abundant material, its redox ability to change between Ce3+ ⇿ Ce4+ has also attracted significant attention. CeO2 has been synthesized using hydrothermal, sol-gel, precipitation, microwave, and green synthesis methods where multiple morphologies such as cube, rod, spherical, and flower-like particles have been produced [26,27,28,29,30]. In catalytic applications, the activity of CeO2 primarily arises from the reduction of Ce4+ to Ce3+ and the formation of oxygen vacancies [31,32]. The modification in shape and size results in the formation of surface defects such as Vo, which endows it with the ability to exist in either the Ce3+ or Ce4+ state on the surface of the particle [33,34].
In addition, dopants with different ionic states incorporated into CeO2 can generate more structural defects to gain charge neutrality, enhancing physical properties and biocompatibility. Many studies have emphasized a strong synergy between CeO2 and noble metals, which can significantly enhance catalytic activities [35]. Among the noble metals, palladium is increasingly used in electrical equipment, dental materials, implanted medical devices and automobiles as catalysts [36]. The incorporation of Pd2+ into the CeO2 crystal lattice has shown better catalytic activity than the palladium-supported CeO2 catalyst [37]. It is believed that the unique properties of Pd-doped CeO2 depend on the active components of palladium and the interaction between palladium and CeO2 [38].
Therefore, in this study, CeO2 (S−CeO2) and Pd−doped CeO2 (Pd−CeO2) NPs were synthesized using a microwave-assisted synthesis method. To the best of the authors’ knowledge, a study on Pd−CeO2 with mixed phases of CeO2 and Ce2O3 has not yet been explored. Moreover, studies on the photocatalytic degradation of methylene blue (MB) were conducted using synthesized-CeO2 (S−CeO2) and (0.5, 1, 3 and 5%) Pd−CeO2 under visible light irradiation for 5 h. The photoelectrochemical studies, namely, linear sweep voltammetry (LSV) and electrochemical impedance spectroscopy (EIS), were performed under dark and visible light conditions using NaCl as the electrolyte. Moreover, the photoantibacterial/antibacterial properties of S−CeO2 and (0.5, 1, 3 and 5%) Pd−CeO2 NPs were also carried out for 24 h using bacterial strain Staphylococcus aureus (S. aureus) KCTC 1916 (Gram-positive) and Pseudomonas aeruginosa (P. aeruginosa) KCTC 1637 (Gram-negative).

2. Results and Discussion

2.1. Structural Analysis of CeO2 and Pd−CeO2 NPs

XRD provides a broad range of information related to the crystallographic nature and chemical structure of materials. The XRD patterns of the S−CeO2 and Pd−CeO2 NPs are shown in Figure 1a, with diffraction peaks in the range of 20° to 80°. The peak positions at about 2θ = 28.56°, 33.27°, 47.36°, 56.40°, and 59.10° of each sample correspond to the (111), (200), (220), (311), and (222) planes of CeO2 cubic fluorite phase (JCPDS no. 00-004-0593) (Figure S1). In S−CeO2, the diffraction peak of Ce2O3 was observed, suggesting that mixed-phase CeO2/Ce2O3 (JCPDS no. 00-023-1048) was present. It was found that gradually, the peak corresponding to Ce2O3 decreased with higher Pd doping. Hence, the peak intensity at 28.56° was seen to increase. This suggests that Pd doping inhibited the formation of Ce2O3 and suggested that the incorporation of Pd2+ lowered the appearance of the Ce2O3 phase. The ionic radii of Pd2+ and Ce4+ are 86 and 101 pm, respectively. No other peaks were observed that contribute to the presence of PdO. Therefore, it can be concluded that Pd2+ was successfully incorporated into the CeO2 lattice.
Furthermore, the average crystallite sizes were estimated using Debye-Scherrer’s Formula (1):
D = 0.9 λ β c o s θ
where β is the full width at half maximum (FWHM), in radians, of the peak for a given (hkl) value, λ = 1.5406 Å for the CuKα radiation used, and θ is the diffracting angle. The average crystallite sizes were found to be 34.67, 37.25, 16.25, 23.03, and 19.17 nm for S−CeO2, 0.5%, 1%, 3%, and 5% Pd−CeO2 NPs, respectively (Table 1).
The average lattice strain was also calculated using Equation (2):
ε = β h k l 4 t a n θ
The lattice parameters of S−CeO2 and Pd−CeO2 were observed to be comparable with the bulk CeO2 (5.411 Å). The average lattice strain was decreased significantly when 0.5% and 1% Pd were incorporated. However, as more Pd2+ were incorporated into the lattice, it would cause higher lattice strain. This can also be seen that as more Pd was doped, the cell volume increased slightly.

2.2. Fourier Transform-Infrared Spectroscopy of CeO2 and Pd−CeO2 NPs

FT-IR spectroscopic studies of S−CeO2 and Pd−CeO2 NPs were carried out within the range of 450–4000 cm−1 at room temperature (Figure 1b). The broad band at approximately 3400 cm−1 for all samples is attributed to the stretching mode of absorbed O-H in the samples. A broad, intense peak at 450 cm−1 corresponds to the O-Ce-O stretching mode. At approximately 900 cm−1, a broad peak was observed in S−CeO2 and Pd−CeO2 NPs, which corresponds to the bending of the intercalated Ce-O [39]. Moreover, a peak at about 1730 cm−1 was also observed in all samples, and it could be assigned to the H-O-H bending mode.

2.3. X-ray Photoelectron Spectroscopy

XPS was performed at room temperature to investigate the chemical state and the electronic structure of the elements in S−CeO2 and 0.5 and 5% Pd−CeO2 NPs (Figure 2). Figure 2a shows the complete survey scan spectra of the samples, which confirmed the presence of Pd 3d, O 1s, and Ce 3d. Figure 2b shows the six typical peaks for Ce 3d. The peaks positioned at 883.43, 886.80, 896.26, 898.89, 905.59, and 914.75 eV is characteristic of Ce4+ [40]. Peaks at 898.89, 905.59, and 914.75 eV correspond to 3d3/2, whereas peaks at 883.43, 886.80, and 896.26 eV correspond to 3d5/2 [41]. No obvious shift in the binding energy of Ce 3d spectra was observed.
Figure 2c shows the Pd 3d spectra of 0.5% Pd−CeO2 and 5% Pd−CeO2 NPs. As a result of the spin-orbit coupling, the Pd 3d spectra are split into two peaks of 3d5/2 and 3d3/2 at 335.03:335.03 eV and 340.40:340.31 eV, respectively. The XPS spectrum of O 1s can be seen in Figure 2d, in which all peaks exhibit two asymmetrical peaks, indicating the presence of O2−, OH, and O at the surface of the nanostructures. The peak at higher binding energy, i.e., 531–532 eV, is attributed to O2− vacancies and adsorbed -OH or H2O, while the peak at lower binding energy, 529 eV, is attributed to the metal-oxygen binding [42]. S−CeO2 showed a dominant peak at 531–532 eV, suggesting that O2− vacancies or adsorbed -OH were mainly found in the sample. On the other hand, 0.5 and 5% Pd−CeO2 showed a dominant peak at 529 eV [42]. The difference might be due to the formation of the Ce2O3 phase in S−CeO2 and the gradual decrease of the Ce2O3 phase in both 0.5 and 5% Pd−CeO2, as shown in XRD. The typical C 1s were observed in the spectra (Figure 2e), which were derived from the carbon coating used in the analysis. The atomic concentration of C 1s, O 1s, Ce 3d, and Pd 2p can be found in Table 2. The estimated Pd content in both 0.5% and 5% Pd−CeO2 is lower than the expected value.
The band gap reduction of S−CeO2 and Pd−CeO2 NPs might be due to the development of mid-gap states either above the valence band (VB) or below the conduction band (CB). Therefore, to study the cause of the reduction of band gap energy, VB-XPS was carried out for S−CeO2 and Pd−CeO2 NPs (Figure 3a).
The zoomed area of VB-XPS is shown in Figure 3b. The VB maximum of S−CeO2, 0.5% Pd−CeO2, and 5% Pd−CeO2 NPs were found to be at 0.39, 0.16, and −1.63 eV, respectively (Figure 3b(i–iii)). The optical band gap energy obtained from the Tauc plot was 2.56, 2.50, and 2.27 eV for S−CeO2, 0.5% Pd−CeO2, and 5% Pd−CeO2 NPs, respectively. Consequently, based on the materials’ optical band gap and VB maxima, the CB minima would follow at −2.17, −2.34, and −3.90 eV for S−CeO2, 0.5% Pd−CeO2, and 5% Pd−CeO2 NPs, respectively. The shifts of VB and CB result in the band gap energy reduction, as proposed in Figure 3c.

2.4. Optical Studies of CeO2 and Pd−CeO2 Using UV-vis-DRS and Photoluminescence Spectroscopy

UV-Vis DRS analysis is used to estimate the band gap energies of S−CeO2 and Pd−CeO2 NPs. The Tauc plot derived from the Kubelka–Munk function is shown in Figure 4a. The band gap energies of all samples were estimated using the Kubelka–Munk Equation (3):
F ( R ) = ( ( 1 R ) 2 2 R × h ν ) 1 2
where R is the measured absolute reflectance of the samples. The band gap was obtained from the plots of [F(R)hv]1/2 versus hv, as the intercept of the extrapolated linear part of the plot at [F(R)hv]1/2 = 0, assuming that the absorption coefficient (α) is proportional to the Kubelka-Munk function F(R).
The band gap energy of C−CeO2, S−CeO2, 0.5% Pd−CeO2, 1% Pd−CeO2, 3% Pd−CeO2, and 5% Pd−CeO2 NPs were found to be decreasing (3.10 to 2.27 eV) as shown in Table 3. This shows that Pd doping is proven to decrease the band gap energy of the CeO2. Pd doping is reported to help in reducing the energy difference between a CB and VB of CeO2, which enhances the electronic conductivity of CeO2. Moreover, oxygen vacancies (Vo) might be produced at the interface between the grains of Pd−CeO2 NPs. Furthermore, the absorption edge of C−CeO2, S−CeO2, 0.5% Pd−CeO2, 1% Pd−CeO2, 3% Pd−CeO2, and 5% Pd−CeO2 NPs were greatly shifted into the visible region with the Pd doping as shown in Figure 4a.
PL is used to evaluate the optical study of the crystals, defects on the surface and excitation fine structure of the semi-conducting materials. PL intensity describes the lifetime of electron relaxation from the VB to the CB, as well as the separation efficiency of photogenerated e/h+ [43]. From Figure 4b, the PL intensity was decreased with more Pd doping concentration. This indicates that Pd doping can efficiently inhibit the e/h+ recombination process due to the electron or hole trap levels (in this case, Pd2+/Pd3+ or Pd+/Pd2+) in the band structure of CeO2. Moreover, the reduction in peak intensity might be due to the formation of more oxygen defects, increased surface defects, as well as maximum separation of charge carriers [44].

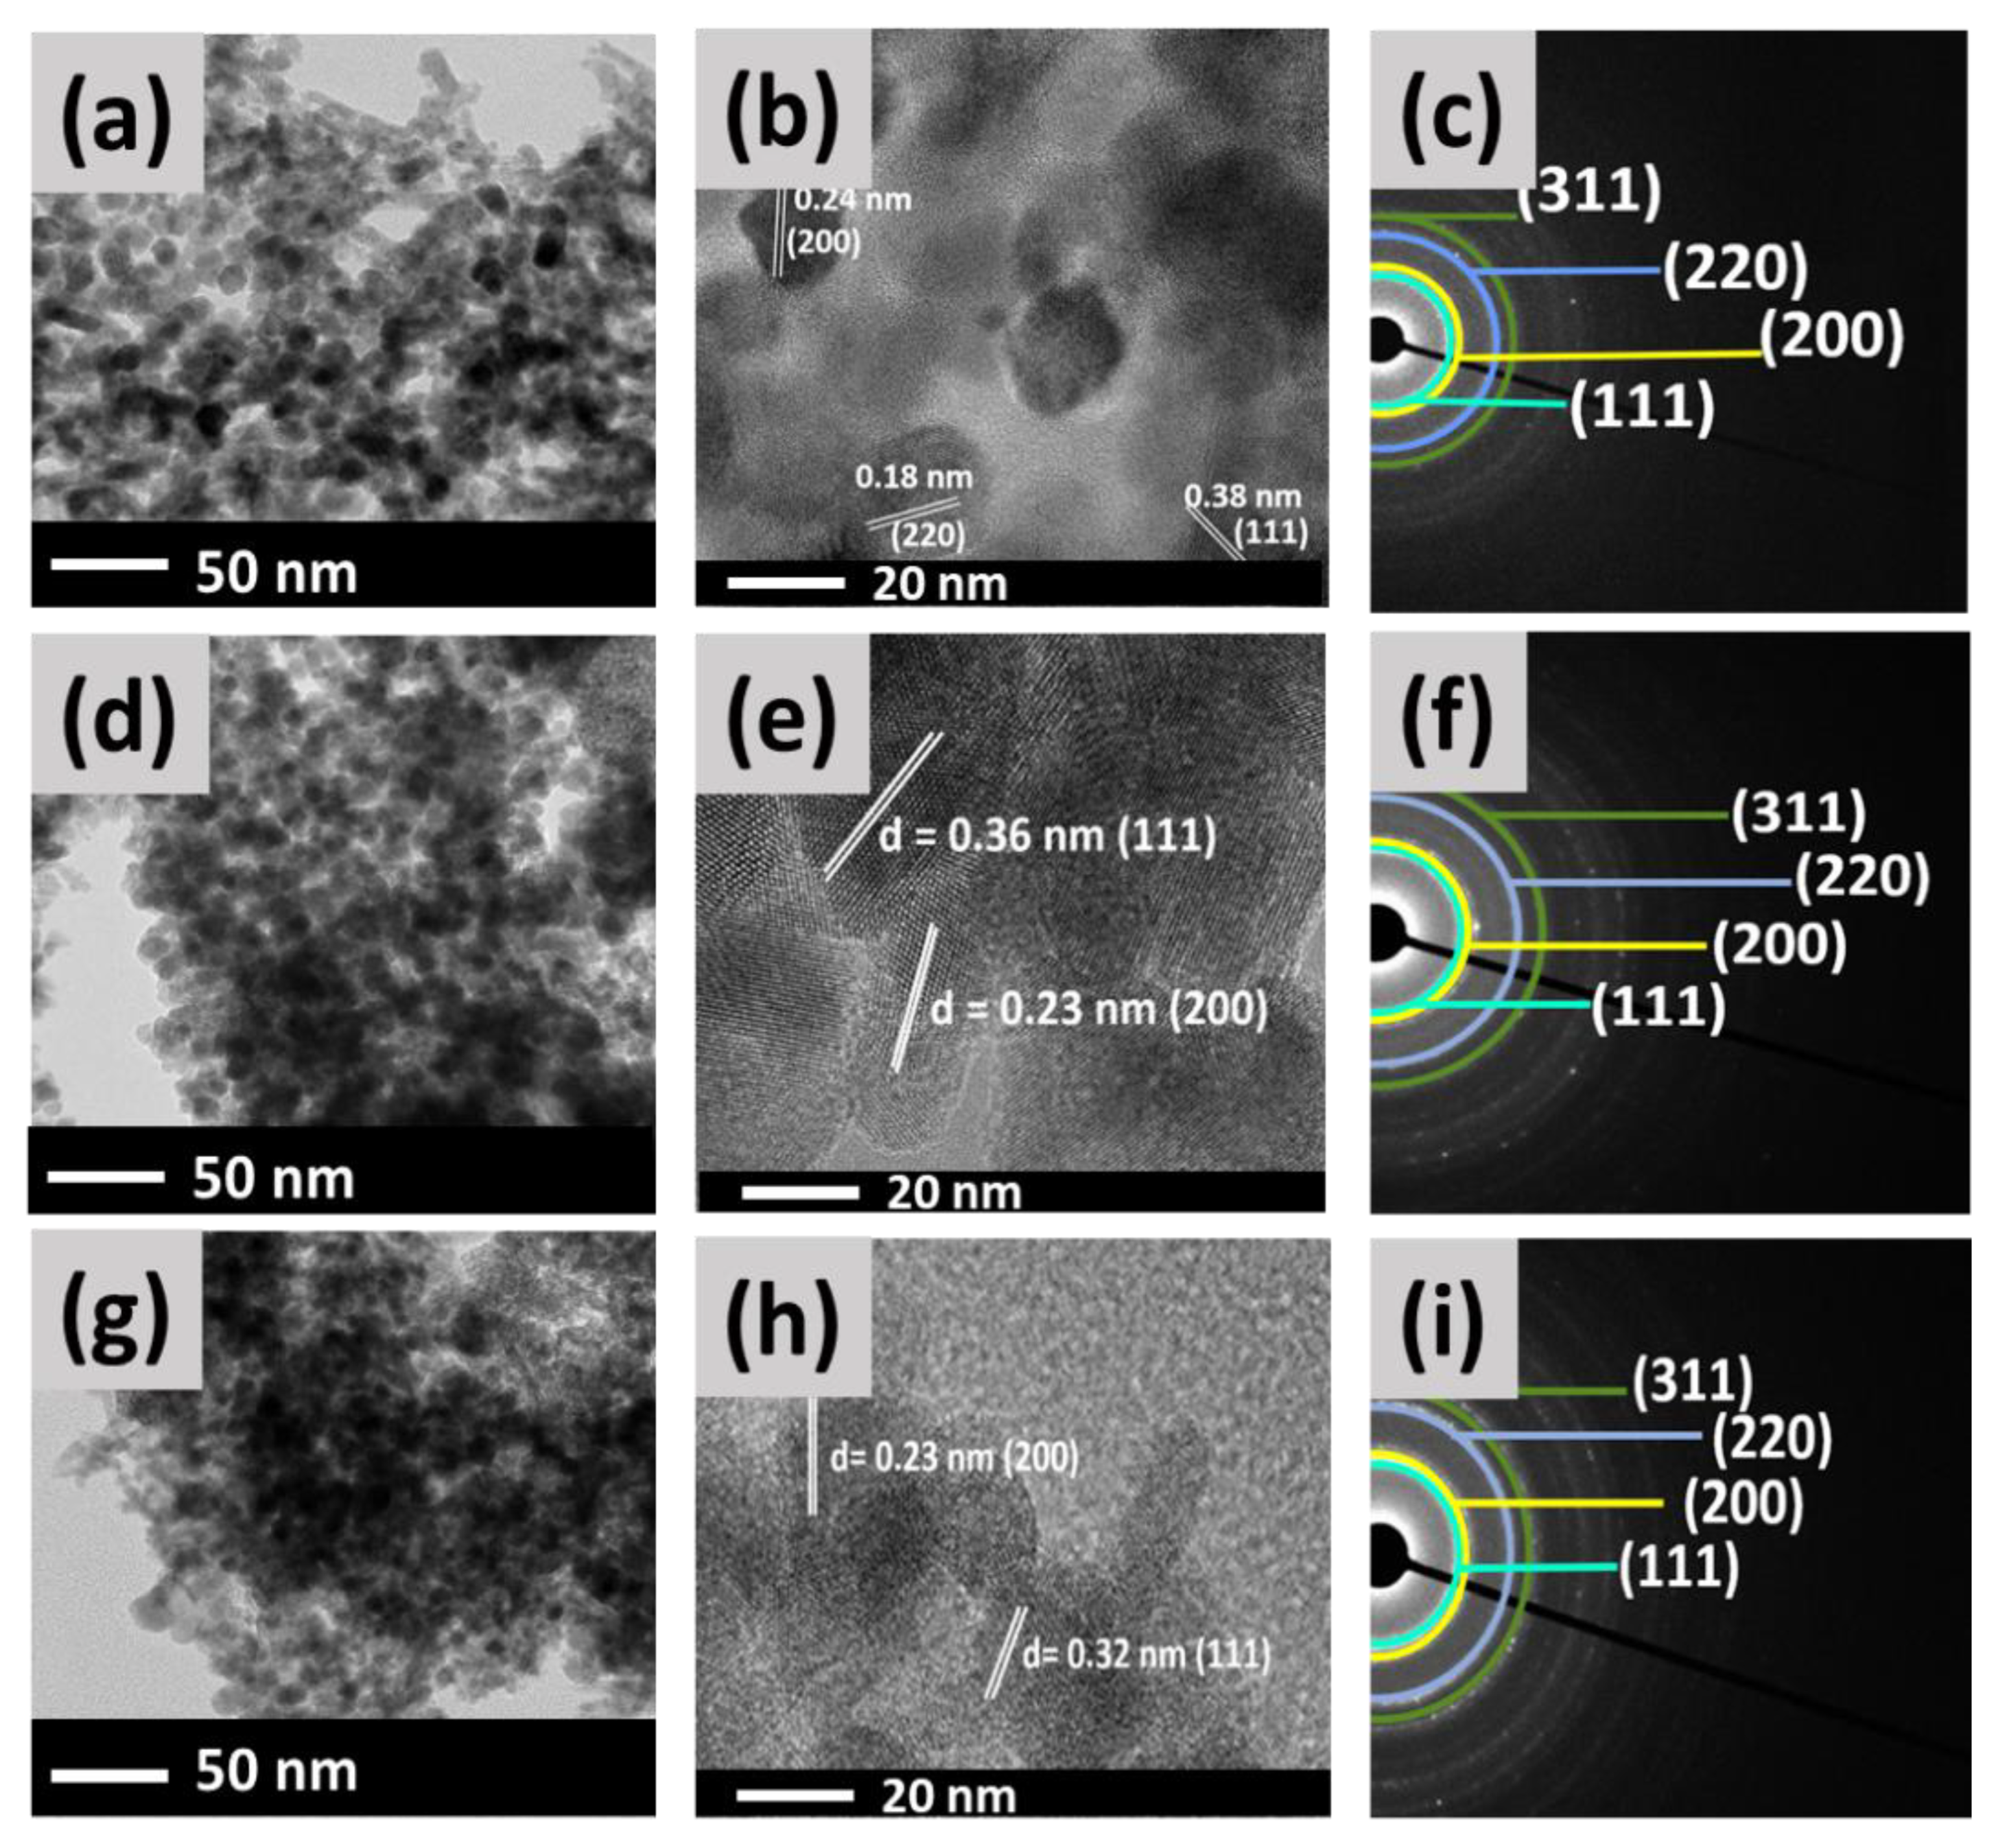
2.5. Transmission Electron Microscopy Analysis of CeO2 and Pd−CeO2 NPs

Figure 5 exhibits the TEM, HR-TEM, and SAED images of S−CeO2, 0.5%, and 5% Pd−CeO2 NPs. Both S−CeO2 and Pd−CeO2 (Figure 5a,d and g) have almost spherical morphology. At the same time, a rod-like structure was observed for S−CeO2 NPs only. The average particle sizes of S−CeO2, 0.5% Pd−CeO2, and 5% Pd−CeO2 are about 13, 9, and 6 nm, respectively. This shows that the incorporation of Pd into the lattice of CeO2 decreased the particle size. The d-spacing value of the lattice planes was also determined from the HR-TEM images (Figure 5b,e,h). The d-spacing values for S−CeO2, 0.5% Pd−CeO2, and 5% Pd−CeO2 NPs are estimated to be around 0.3, 0.2 and 0.1 nm, which corresponds to the (111), (200), and (220) planes of a fluorite-structure of cubic CeO2 [45]. This is in accordance with the XRD analysis (Section 2.1).
Moreover, the nano-crystallinity of S−CeO2 and Pd−CeO2 NPs were examined by selected area electron diffraction (SAED) analysis, as shown in Figure 5c,f and i. It was observed that S−CeO2, 0.5%, and 5% Pd−CeO2 exhibit four prominent broad rings, which can be attributed to the (111), (200), (220), and (311) reflections of the fluorite cubic CeO2 structure. This observation is supported by the XRD patterns reported earlier (Section 2.1).
The EDX mapping images shown in Figure S2a–c confirmed the presence of Ce, O, and Pd in S−CeO2, 0.5%, and 5% Pd−CeO2 NPs, respectively. The percentage of Ce was seen to decrease with more Pd content. The percentage mass of Ce, O, and Pd can be found in Table S1. This shows that Pd has been successfully incorporated into the CeO2 lattice.

3. Applications

3.1. Photocatalytic Degradation of MB

The photocatalytic degradation of MB using S−CeO2 and Pd−CeO2 NPs was carried out under visible light irradiation in a total experiment duration of 5 h. The activity of C−CeO2 against MB dye under visible light was also investigated to compare the photocatalytic efficiency with the synthesized materials. Figure 6a shows the average C/C0 of the photocatalytic degradation of MB using C−CeO2, S−CeO2, and Pd−CeO2 NPs, while the average percentage of the photocatalytic degradation of MB and the absorption spectra of MB within 5 h can be seen in Figures S3 and S4, respectively. Based on the study, adsorption-desorption equilibrium was reached in 30 min, in which C−CeO2 showed a slight adsorption capacity. About 39–61% adsorption was reached for the synthesized materials suggesting that the addition of Pd effectively increases the affinity of MB molecules towards photocatalysts [46]. The enhanced adsorption is also driven by the increase in the surface area contributed by significantly reduced particle size [46].
The effectiveness of the photocatalysts in the photocatalytic degradation of MB was seen as follows: 1% Pd−CeO2 > 5% Pd−CeO2 > S−CeO2 > 0.5% Pd−CeO2 > 3% Pd−CeO2 > C−CeO2. A small response from C−CeO2 might be due to the larger band gap energy, which was found to be 3.10 eV. Moreover, 3% Pd−CeO2 and 0.5% Pd−CeO2 also showed lower responses despite their lower band gap energies. This might be due to variations in particle size, which resulted in lower responses in the photocatalytic activity. In addition to that, a smaller surface area might also lead to less active sites present on the surface of the photocatalysts [47]. S−CeO2 and 5% Pd−CeO2 showed almost similar activities. The activity of S−CeO2 was higher than some of the materials, which might be due to the mixed CeO2/Ce2O3 phases, as shown in Figure 1a. The presence of both phases can ease the redox reaction between Ce3+ and Ce4+, which causes the photocatalytic activities to increase [48,49,50]. Choudhury et al. also stated that an electron from Ce3+ can be transferred to adsorbed oxygen to form reactive oxygen species (ROS), i.e., superoxide radicals (O2•−), whereas holes interact with water to form hydroxyl radicals (OH) [51]. In addition, the e in the CB can be trapped by oxygen vacancies and then react with O2 to form O2•−. These radicals are involved in the degradation of MB into harmless products [52]. Recombination of photogenerated e and h+ was restrained through the Ce3+/Ce4+ redox and oxygen vacancies which finally improved the photocatalytic performance of the Pd−CeO2 materials [53]. Moreover, smaller particle size as well as low band gap energy also effectively increased the photocatalytic activity [54]. Nevertheless, 5% Pd−CeO2 showed a slightly better performance than S−CeO2 due to its smaller particle size and band gap energy. Accordingly, 1% Pd−CeO2 showed the highest response, which might be due to the optimum Pd loading. This shows that a further increase in doping does not enhance the photocatalytic degradation of MB [46]. Table 4 summarizes the average percentage of photocatalytic degradation of MB activities using S−CeO2 and Pd−CeO2 NPs under visible light irradiation.

3.2. Photoelectrochemical Studies of Pd−CeO2 NPs

The electrochemical and photoelectrochemical studies of S−CeO2 and Pd−CeO2 NPs were analyzed using LSV and EIS. Figure 6b shows the LSV analysis carried out in the dark and under visible light at 100 mV/s in the range of −0.7–1.5 V. S−CeO2 showed the lowest photocurrent, and 5% Pd−CeO2 showed the highest photocurrent. As the doping percentage increases (Figure 6b), the photocurrent response also increases. Each material, respectively, showed a higher response under visible light irradiation as compared to their response in the dark, suggesting that the materials were light-responsive. The improvement in the photocurrent response in Pd−CeO2 was attributed to the light absorption ability due to the creation of a mid-gap state which lowered the band gap energy [55]. The band gap energy of Pd−CeO2 was narrowed with higher Pd doping, in which the valence electrons can be excited to the conduction band state by absorbing light. It is stated that the e/h+ pairs will recombine unless they are separated quickly [56]. In general, a high photocurrent suggests that the material has a strong ability for the generation and transfer of the photoexcited charge carrier under light irradiation [57]. Therefore, in this case, 5% Pd−CeO2 exhibits better electron-hole separation, and it might be excited easily by visible light.
EIS was performed in the dark and under visible light irradiation at 0.0 V with a frequency ranging from 1–106 Hz (Figure 6c). The EIS Nyquist plots show the charge transfer resistance and separation efficiency between the photogenerated electrons and holes [58]. In general, a small arc radius and low resistance indicate higher charge transfer efficiency [55]. S−CeO2 showed the highest resistance, followed by 0.5% and 1% Pd−CeO2 indicating the slow interfacial charge-transfer process. This response might be due to their high band gap energies. In each case, there was no significant decrease in the resistance under visible light, which suggests that the transfer efficiency of the photogenerated electrons and holes was not accelerated under light irradiation. On the other hand, 3% Pd−CeO2 and 5% Pd−CeO2 showed significant responses, especially under visible light irradiation. This suggests that lower resistances derived from both 3% and 5% Pd−CeO2 show a faster interfacial charge-transfer process. Other factors can also facilitate charge separation and transfer efficiency, such as the presence of Ce3+ and oxygen vacancies [55].

3.3. Antibacterial Activities of Pd−CeO2 NPs

The effect of bactericidal activities of S−CeO2 NPs and Pd−CeO2 NPs was examined against one Gram-positive bacteria (i.e., S. aureus) and another against Gram−negative pathogenic bacteria (i.e., P. aeruginosa). Since the synthesized NPs are light sensitive, the antibacterial activities were performed in the absence and presence of light. The antibacterial effect of Pd−CeO2 and S−CeO2 NPs under light and dark conditions is shown in Figure 7. The results showed that both S−CeO2 NPs and Pd−CeO2NPs exhibit concentration-dependent inhibitions of S. aureus growth under light or dark conditions (Figure 7a,b). At a high concentration of 2048 µg/mL in the dark, the growth inhibition of S. aureus cells was found to be higher (reduction of 1.3 log CFU) in the presence of 5% Pd−CeO2 NPs as compared to the CeO2 NPs (reduction of 1.2 log CFU) (Figure 7a). Similarly, in the presence of light at 2048 µg/mL, the antibacterial effect of 5% Pd−CeO2 NPs was also found to be higher (reduction of 1.6 log CFU) as compared to the S−CeO2 NPs (reductions 1.0 log CFU) (Figure 7b). The bactericidal effect of CeO2 NPs was found to be higher in the presence of light as compared to dark conditions. This finding suggests that light enhances the bactericidal effect of CeO2 NPs towards Gram-positive bacteria S. aureus.
The antibacterial effect of S−CeO2 NPs and Pd−CeO2 NPs on P. aeruginosa was found to be different as compared to S. aureus (Figure 7c,d). There was no concentration-dependent inhibition of P. aeruginosa cell growth in the presence of light and dark conditions. The growth inhibition at the higher concentration (2048 µg/mL) and dark conditions was found to be non-significant in the presence of 5% Pd−CeO2 NPs as compared to the S−CeO2 NPs (Figure 7c). The results in the presence of light were found to be significantly effective at all tested concentrations of S−CeO2 NPs and Pd−CeO2 NPs (Figure 7d).
In the presence of light and high concentration (2048 µg/mL), the 5% Pd−CeO2 NPs showed a significant reduction of P. aeruginosa cells (1.0 log CFU) compared to the S−CeO2 NPs (0.6 log CFU). Based on the findings of the present study, it is clear that light acts as a sensitizing agent, which results in the enhanced antibacterial activity of CeO2 NPs as compared to dark conditions. Previous research has shown that UV light irradiation causes the formation of reactive oxygen species (ROS) such as OH, O2•−, and singlet oxygen (O) from metal-NPs [59,60,61,62]. This evidence can be explained in the current study by the possibility of ROS generation during the photocatalytic degradation of the MB experiment (Section 3.1). In addition, Pd-doping will also result in the enhanced antibacterial effect of CeO2 NPs, and the effect was increased with the increasing concentration of Pd. Overall, these effects were found to be more effective towards Gram-positive bacteria S. aureus than the Gram-negative pathogen P. aeruginosa.
In general, the antibacterial activity of metal oxides is associated with the release of metal ions from metal oxides. It is reported that metal ions are involved in the destruction of the bacterial cell and membrane [63]. This could lead to the possibility of metal oxides penetrating the cell. In the case of CeO2, CeO2 dissociates into Ce4+ ions (most of the time under irradiation of visible light) and interacts with the bacterial cell and penetrates the cell [64]. This might lead to changes in cell integrity, lactate dehydrogenase leakage and cell death. Moreover, the generation of ROS is also responsible for antibacterial activity [65]. When CeO2 is irradiated with light, e are promoted to CB and reacted with molecular oxygen to form O2•−. The photogenerated h+ reacts with H2O molecules on the surface of CeO2 to form OH radicals. These two radicals are believed to be contributing significantly to the destruction of the bacterial cell membrane [60].

4. Experimental

4.1. Chemicals, Bacterial Strain, Culture Media, and Growth Conditions

Cerium(III) nitrate hexahydrate 98% (Ce(NO3)3·6H2O) and commercial CeO2 (C−CeO2) were purchased from Sigma-Aldrich whereas, palladium(II) chloride anhydrous (PdCl2) was obtained from Fluka. Water was purified using Aquatron (England) prior to use. For photocatalytic degradation of MB and photoelectrochemical studies, MB and NaCl were obtained from Merck. For electrode preparation, ethanol (95%), ethyl cellulose 48–49.5% (w/w) ethoxy basis, and alpha-terpineol were obtained from Daejung Chemicals and Metals Co., Ltd., Sigma-Aldrich and Merck, respectively. The bacterial strain S. aureus KCTC 1916 (Gram-positive) and P. aeruginosa KCTC 1637 (Gram-negative) were purchased from the Korean Collection for Type Cultures (KCTC, Daejeon, Korea). The bacteria were cultivated using Tryptic soy broth (TSB) and a TSB agar plate (Difco Laboratory Inc., Detroit, MI, USA). The growth temperature of the bacterial strain was 37 °C under aerobic conditions.

4.2. Instrumentations

CeO2 and (0.5, 1, 3, and 5%) Pd−doped CeO2 NPs were synthesized using a microwave-assisted method (Anton Paar Monowave 400, Graz, Austria). Fourier Transform-Infrared Spectroscopy (FT-IR) was used to identify the possible functional groups present in the synthesized CeO2 and Pd−CeO2 NPs using Shimadzu IRPrestige-21 FT-IR Spectrophotometer. The stretching frequencies obtained were plotted as %transmittance mode on the y-axis and wavenumber (cm−1) on the x-axis from 450 to 4000 cm−1. The morphology, structure, and elemental mapping were analyzed using field emission transmission electron microscopy (FE-TEM) and selected area electron diffraction (SAED) using JEM-F200 (JEOL Ltd., Tokyo, Japan). The determination of band gap energy of S−CeO2 and Pd−CeO2 NPs was investigated using UV-Vis diffuse reflectance spectroscopy (DRS) (Shimadzu, UV-2600, Tokyo, Japan). A photoluminescence (PL) study was carried out using F-7000 Fluorescence spectroscopy (Hitachi High Tech, Tokyo, Japan) with an excitation wavelength of 370 nm. X-ray photoelectron spectroscopy (XPS) and valence band (VB)-XPS were performed (Kratos Analytical, AXIS Nova, Manchester, UK). Photocatalytic activities of MB dye degradation were carried out using a photochemical reactor Toption (TOPT-V) having a 300 W Xenon lamp, and the photocatalytic degradation of MB was monitored using UV–visible spectrophotometer (Shimadzu UV-1900, Japan). Photoelectrochemical studies were performed using Autolab (MetroHm, Herisau, Switzerland) under dark and visible light irradiation (Simon FL30 LED Floodlight, 100 W, Jiangsu, China). The measurements were carried out and taken from NOVA software. Photoantibacterial studies of S−CeO2 and Pd−CeO2 NPs were investigated using a 96-well microplate in the presence of the LED light (One & One Plus OP-0303 Nape Slim LED Stand).

4.3. Microwave-Assisted Synthesis of Cerium Oxide Nanoparticles

CeO2 NPs were synthesized using the microwave-assisted method. Briefly, 0.05 M of Ce(NO3)3·6H2O solution (15 mL) was prepared in a microwave vessel. Exactly 2.4 mL of 1 M NaOH was added dropwise into the solution. Subsequently, the microwave reaction was carried out at 180 °C for 15 min at 850 W microwave power. The precipitate formed was centrifuged and washed three times with water before it was dried at 80 °C. The product was stored and labeled as S−CeO2.

4.4. Microwave-Assisted Synthesis of Pd−CeO2 Nanoparticles

Pd−CeO2 NPs were synthesized using the same method as mentioned above. A 15 mL of 0.05 M Ce(NO3)3 solution was prepared. A specific amount of PdCl2 was then added to prepare 0.5, 1, 3, and 5% Pd−CeO2. Subsequently, 1 M NaOH was added dropwise into the solution. The microwave reaction was carried out at 180 °C for 15 min at 850 W microwave power. The precipitate was formed, centrifuged, and washed three times with water before it was dried at 80 °C. The products were stored and labeled as 0.5% Pd−CeO2, 1% Pd−CeO2, 3% Pd−CeO2, and 5% Pd−CeO2 for further use.

4.5. Electrode Preparation

S−CeO2, 0.5%, 1%, 3%, and 5% Pd−CeO2 electrodes were prepared using the doctor blade method. In brief, 25 mg of the respective sample was mixed with 0.5 mL ethanol and 0.5 mL α-terpineol. The mixture was sonicated for 10 min. Then, 25 mg of ethyl cellulose was added to the mixture and stirred at 80 °C for ~2 h to produce a thick paste. The paste was then spread on fluorine-doped tin oxide (FTO) glass electrode by 2 cm × 1 cm using a doctor blade. The glass electrode was dried at 80 °C for 24 h prior to use.

4.6. Photocatalytic Degradation of MB Dye

The photocatalytic degradation of MB dye using S−CeO2 and Pd−CeO2 NPs under visible light irradiation was monitored using UV-Vis spectroscopy. Exactly 10 mg of S−CeO2 and 0.5, 1, 3, and 5% Pd−CeO2 NPs were dispersed in 50 mL of 10 ppm MB dye solution. The sample mixture was stirred in the dark for 30 min to reach adsorption-desorption equilibrium. Then, the reaction tubes were irradiated with visible light (300 W) for 5 h in which the absorbance of the solution was measured every 1 h. The percentage of photocatalytic dye degradation of MB was obtained using Equation (4):
%   photocatalytic   MB   dye   degradation = ( A blank A sample ) A blank × 100
where Ablank is the absorbance of MB only and Asample is the absorbance of MB dye after photocatalytic degradation by the photocatalyst.

4.7. Photoelectrochemical Studies

The photoelectrochemical response of S−CeO2 and Pd−CeO2 NPs was examined through linear sweep voltammetry (LSV) and electrochemical impedance spectroscopy (EIS) experiments. The experiments were carried out under ambient conditions in the dark and under visible light irradiation (LED, 100 W) in 100 mL of a 1 M NaCl aqueous electrolyte solution. The distance between the light and reactor vial was 22 cm. The prepared glass electrode, Ag/AgCl electrode, and Pt electrode were used as the working electrode, reference electrode, and counter electrode, respectively. For each electrode, LSV and EIS were performed in the dark and later under visible light irradiation at 100 mV/s in the potential range of −0.7–1.5 V and at 0.0 V with a frequency ranging from 1–106 Hz, respectively.

4.8. Assays for Antibacterial Activities of Pd−CeO2 Nanoparticles

A single colony from the agar plate of each bacterium was inoculated in the TSB and incubated for 12 h at 37 °C under shaking conditions (250 rpm). The seed culture was diluted into fresh TSB in order to achieve the final OD600 ~0.05. The diluted cell culture (300 µL) was placed in a 96-well microtiter plate and treated with different concentrations of S−CeO2 and 0.5, 1, 3, and 5% Pd−CeO2 NPs. The concentrations of these NPs ranged from 265 to 2048 µg/mL. Two sets of microtiter plates were prepared to contain different concentrations of NPs. One set of microplates was incubated in the dark for 24 h at 37 °C. The second set of the microplates was incubated in the presence of LED light that was set at the height of 27 cm for 24 h at 37 °C. After incubation, the cell culture (100 µL) was transferred into another 96-well microplate containing 200 µL sterile TSB. A two-fold serial dilution (up to 10−8 dilutions) of the cell culture was carried out. The serially diluted cell culture (100 µL) was spread-plated on the TSA plates. The TSA plates were incubated at 37 °C for 24 h, followed by the counting of the total colonies. The log colony forming unit (CFU) values of treated and untreated cells were calculated. All the experiments were carried out in triplicate.

5. Conclusions

S−CeO2 and 0.5, 1, 3, and 5% Pd−CeO2 NPs were successfully synthesized using the microwave-assisted method. Mixed phases of CeO2/Ce2O3 were obtained in S−CeO2 and 0.5, 1, and 3% Pd−CeO2. However, there were no mixed phases observed in 5% Pd−CeO2 NPs. Average crystallite sizes were found to be between 16.25–37.25 nm. Based on the TEM images, irregularly spherical shaped S−CeO2 and Pd−CeO2 NPs were observed with an average particle size between 6 and 13 nm. The band gap energy of S−CeO2 decreased with the addition of higher Pd content, in which the band gap narrowing phenomena was illustrated through the DOS scheme. One percent of Pd−CeO2 NPs showed enhanced responses under visible light irradiation in photocatalytic degradation of MB. Meanwhile, 5% Pd−CeO2 showed enhanced responses in photoelectrochemical and photoantibacterial activities. Therefore, Pd−CeO2 has shown visible light active properties and can be potentially used in photocatalysis and photoantibacterial applications.

Supplementary Materials

The following supporting information can be downloaded at: https://0-www-mdpi-com.brum.beds.ac.uk/article/10.3390/catal13010096/s1. Figure S1. Standards XRD patterns of CeO2, Ce2O3, and PdO; Figure S2. EDX-mapping of Ce, O, and Pd elements in (a) S−CeO2, (b) 0.5% Pd−CeO2, and (c) 5% Pd−CeO2 NPs; Figure S3. The average percentage of photocatalytic degradation of MB dye using C−CeO2, S−CeO2, and Pd−CeO2 NPs under visible light irradiation; Figure S4. Absorbance spectra of photocatalytic degradation of MB using (a) C−CeO2, (b) S−CeO2 (c) 0.5%, (d) 1%, (e) 3%, and (f) 5% Pd−CeO2 NPs; Table S1. Percentage mass of Ce, O, and Pd elements in S−CeO2, 0.5% Pd−CeO2, and 5% Pd−CeO2 NPs using EDX-Mapping.

Author Contributions

S.N.M.: Methodology, Investigation, Data curation, and Writing—original draft. F.K.: Methodology, Investigation, Data curation, and Writing. M.H.H.: Supervision, Writing—review and editing. Y.-M.K.: Resources, Formal analysis. M.M.K.: Supervision, Conceptualization, Funding acquisition, Writing—review and editing. All authors have read and agreed to the published version of the manuscript.

Funding

The authors would like to acknowledge the FRC grant (UBD/RSCH/1.4/FICBF(b)/2022/046) received from Universiti Brunei Darussalam, Brunei Darussalam. This research was supported by Basic Science Research Program through the National Research Foundation of Korea (NRF) grant funded by the Ministry of Education (2021R1A6A1A03039211 and 2022R1A2B5B01001998).

Conflicts of Interest

The authors declare no conflict of interest.

References

  1. Sánchez-López, E.; Gomes, D.; Esteruelas, G.; Bonilla, L.; Lopez-Machado, A.L.; Galindo, R.; Cano, A.; Espina, M.; Ettcheto, M.; Camins, A.; et al. Metal-Based Nanoparticles as Antimicrobial Agents: An Overview. Nanomaterials 2020, 10, 292. [Google Scholar] [CrossRef] [PubMed] [Green Version]
  2. Wang, L.; Hu, C.; Shao, L. The Antimicrobial Activity of Nanoparticles: Present Situation and Prospects for the Future. Int. J. Nanomed. 2017, 2017, 1227–1249. [Google Scholar] [CrossRef] [PubMed] [Green Version]
  3. Kadiyala, U.; Kotov, N.A.; VanEpps, J.S. Antibacterial Metal Oxide Nanoparticles: Challenges in Interpreting the Literature. Curr. Pharm. Des. 2018, 24, 896–903. [Google Scholar] [CrossRef]
  4. Chiu, Y.-H.; Chang, T.-F.; Chen, C.-Y.; Sone, M.; Hsu, Y.-J. Mechanistic Insights into Photodegradation of Organic Dyes Using Heterostructure Photocatalysts. Catalysts 2019, 9, 430. [Google Scholar] [CrossRef] [Green Version]
  5. Thambiraj, S.; Sharmila, G.; Ravi Shankaran, D. Green Adsorbents from Solid Wastes for Water Purification Application. Mater. Today Proc. 2018, 5, 16675–16683. [Google Scholar] [CrossRef]
  6. Daneshvar, N.; Salari, D.; Khataee, A.R. Photocatalytic Degradation of Azo Dye Acid Red 14 in Water: Investigation of the Effect of Operational Parameters. J. Photochem. Photobiol. A Chem. 2003, 157, 111–116. [Google Scholar] [CrossRef]
  7. Rafiq, A.; Ikram, M.; Ali, S.; Niaz, F.; Khan, M.; Khan, Q.; Maqbool, M. Photocatalytic Degradation of Dyes Using Semiconductor Photocatalysts to Clean Industrial Water Pollution. J. Ind. Eng. Chem. 2021, 97, 111–128. [Google Scholar] [CrossRef]
  8. Santoso, E.; Ediati, R.; Kusumawati, Y.; Bahruji, H.; Sulistiono, D.O.; Prasetyoko, D. Review on Recent Advances of Carbon Based Adsorbent for Methylene Blue Removal from Waste Water. Mater. Today Chem. 2020, 16, 100233. [Google Scholar] [CrossRef]
  9. Khan, I.; Saeed, K.; Zekker, I.; Zhang, B.; Hendi, A.H.; Ahmad, A.; Ahmad, S.; Zada, N.; Ahmad, H.; Shah, L.A.; et al. Review on Methylene Blue: Its Properties, Uses, Toxicity and Photodegradation. Water 2022, 14, 242. [Google Scholar] [CrossRef]
  10. Beitollahi, H.; van Le, Q.; Farha, O.K.; Shokouhimehr, M.; Tajik, S.; Nejad, F.G.; Kirlikovali, K.O.; Jang, H.W.; Varma, R.S. Recent Electrochemical Applications of Metal-Organic Framework-Based Materials. Cryst. Growth Des. 2020, 20, 7034–7064. [Google Scholar] [CrossRef]
  11. Basu, K.; Benetti, D.; Zhao, H.; Jin, L.; Vetrone, F.; Vomiero, A.; Rosei, F. Enhanced Photovoltaic Properties in Dye Sensitized Solar Cells by Surface Treatment of SnO2 Photoanodes. Sci. Rep. 2016, 6, 1–10. [Google Scholar] [CrossRef] [PubMed] [Green Version]
  12. Li, L.; Zhu, B.; Zhang, J.; Yan, C.; Wu, Y. Electrical Properties of Nanocube CeO2 in Advanced Solid Oxide Fuel Cells. Int. J. Hydrogen Energy 2018, 43, 12909–12916. [Google Scholar] [CrossRef]
  13. Liang, S.; Wang, H.; Li, Y.; Qin, H.; Luo, Z.; Huang, B.; Zhao, X.; Zhao, C.; Chen, L. Rare-Earth Based Nanomaterials and Their Composites as Electrode Materials for High Performance Supercapacitors: A Review. Sustain. Energy Fuels 2020, 4, 3825–3847. [Google Scholar] [CrossRef]
  14. Xie, W.; Liu, B.; Xiao, S.; Li, H.; Wang, Y.; Cai, D.; Wang, D.; Wang, L.; Liu, Y.; Li, Q.; et al. High Performance Humidity Sensors Based on CeO2 Nanoparticles. Sens. Actuators B Chem. 2015, 215, 125–132. [Google Scholar] [CrossRef]
  15. Manibalan, G.; Murugadoss, G.; Thangamuthu, R.; Ragupathy, P.; Kumar, M.R.; Mohan Kumar, R.; Jayavel, R. High Electrochemical Performance and Enhanced Electrocatalytic Behavior of a Hydrothermally Synthesized Highly Crystalline Heterostructure CeO2@NiO Nanocomposite. Inorg. Chem. 2019, 58, 13843–13861. [Google Scholar] [CrossRef]
  16. Nwachukwu, I.M.; Nwanya, A.C.; Osuji, R.; Ezema, F.I. Nanostructured Mn-Doped CeO2 Thin Films with Enhanced Electrochemical Properties for Pseudocapacitive Applications. J. Alloys Compd. 2021, 886, 161206. [Google Scholar] [CrossRef]
  17. Wang, H.; Liu, Y.; Li, M.; Huang, H.; Xu, H.M.; Hong, R.J.; Shen, H. Multifunctional TiO2 nanowires-Modified Nanoparticles Bilayer Film for 3D Dye-Sensitized Solar Cells. Optoelectron. Adv. Mater. Rapid Commun. 2010, 4, 1166–1169. [Google Scholar] [CrossRef]
  18. Rahman, A.; Harunsani, M.H.; Tan, A.L.; Ahmad, N.; Khan, M.M. Antioxidant and Antibacterial Studies of Phytogenic Fabricated ZnO Using Aqueous Leaf Extract of Ziziphus Mauritiana Lam. Chem. Pap. 2021, 75, 3295–3308. [Google Scholar] [CrossRef]
  19. Aboutaleb, W.A.; El-Salamony, R.A. Effect of Fe2O3-CeO2 Nanocomposite Synthesis Method on the Congo Red Dye Photodegradation under Visible Light Irradiation. Mater. Chem. Phys. 2019, 236, 121724. [Google Scholar] [CrossRef]
  20. Naidi, S.N.; Khan, F.; Tan, A.L.; Harunsani, M.H.; Kim, Y.-M.; Khan, M.M. Photoantioxidant and Antibiofilm Studies of Green Synthesized Sn-Doped CeO2 Nanoparticles Using Aqueous Leaf Extracts of Pometia Pinnata. New J. Chem. 2021, 45, 7816–7829. [Google Scholar] [CrossRef]
  21. Su, Z.; Si, W.; Liu, H.; Xiong, S.; Chu, X.; Yang, W.; Peng, Y.; Chen, J.; Cao, X.; Li, J. Boosting the Catalytic Performance of CeO2 in Toluene Combustion via the Ce-Ce Homogeneous Interface. Environ. Sci. Technol. 2021, 55, 12630–12639. [Google Scholar] [CrossRef] [PubMed]
  22. Su, Z.; Yang, W.; Wang, C.; Xiong, S.; Cao, X.; Peng, Y.; Si, W.; Weng, Y.; Xue, M.; Li, J. Roles of Oxygen Vacancies in the Bulk and Surface of CeO2 for Toluene Catalytic Combustion. Environ. Sci. Technol. 2020, 54, 12684–12692. [Google Scholar] [CrossRef] [PubMed]
  23. Gnanam, S.; Gajendiran, J.; Ramana Ramya, J.; Ramachandran, K.; Gokul Raj, S. Glycine-Assisted Hydrothermal Synthesis of Pure and Europium Doped CeO2 Nanoparticles and Their Structural, Optical, Photoluminescence, Photocatalytic and Antibacterial Properties. Chem. Phys. Lett. 2021, 763, 138217. [Google Scholar] [CrossRef]
  24. Bača, Ľ.; Steiner, H.; Stelzer, N. Upconversion Luminescence and Optical Thermometry in Er3+/Yb3+ Co-Doped CeO2 for Space Application. J. Alloys Compd. 2019, 774, 418–424. [Google Scholar] [CrossRef]
  25. Khan, M.M.; Rahman, A.; Matussin, S.N. Recent Progress of Metal-Organic Frameworks and Metal-Organic Frameworks-Based Heterostructures as Photocatalysts. Nanomaterials 2022, 12, 2820. [Google Scholar] [CrossRef]
  26. dos Santos, A.P.B.; Dantas, T.C.M.; Costa, J.A.P.; Souza, L.D.; Soares, J.M.; Caldeira, V.P.S.; Araújo, A.S.; Santos, A.G.D. Formation of CeO2 Nanotubes through Different Conditions of Hydrothermal Synthesis. Surf. Interfaces 2020, 21, 100746. [Google Scholar] [CrossRef]
  27. Seong, G.; Dejhosseini, M.; Adschiri, T. A Kinetic Study of Catalytic Hydrothermal Reactions of Acetaldehyde with Cubic CeO2 Nanoparticles. Appl. Catal. A Gen. 2018, 550, 284–296. [Google Scholar] [CrossRef]
  28. Xu, B.; Zhang, Q.; Yuan, S.; Liu, S.; Zhang, M.; Ohno, T. Synthesis and Photocatalytic Performance of Yttrium-Doped CeO2 with a Hollow Sphere Structure. Catal. Today 2017, 281, 135–143. [Google Scholar] [CrossRef] [Green Version]
  29. Lian, J.; Liu, P.; Jin, C.; Liu, Q.Y.; Zhang, X.; Zhang, X. Flower-like CeO2/CoO p-n Heterojuncted Nanocomposites with Enhanced Peroxidase-Mimicking Activity for l-Cysteine Sensing. ACS Sustain. Chem. Eng. 2020, 8, 17540–17550. [Google Scholar] [CrossRef]
  30. Zheng, J.; Zhu, Z.; Gao, G.; Liu, Z.; Wang, Q.; Yan, Y. Construction of Spindle Structured CeO2 Modified with Rod-like Attapulgite as a High-Performance Photocatalyst for CO2 Reduction. Catal. Sci. Technol. 2019, 9, 3788–3799. [Google Scholar] [CrossRef]
  31. Bezkrovnyi, O.S.; Lisiecki, R.; Kepinski, L. Relationship between Morphology and Structure of Shape-Controlled CeO2 Nanocrystals Synthesized by Microwave-Assisted Hydrothermal Method. Cryst. Res. Technol. 2016, 51, 554–560. [Google Scholar] [CrossRef]
  32. Khan, M.M.; Ansari, S.A.; Pradhan, D.; Han, D.H.; Lee, J.; Cho, M.H. Defect-Induced Band Gap Narrowed CeO2 Nanostructures for Visible Light Activities. Ind. Eng. Chem. Res. 2014, 53, 9754–9763. [Google Scholar] [CrossRef]
  33. Abbas, F.; Iqbal, J.; Jan, T.; Naqvi, M.S.H.; Gul, A.; Abbasi, R.; Mahmood, A.; Ahmad, I.; Ismail, M. Differential Cytotoxicity of Ferromagnetic Co Doped CeO2 Nanoparticles against Human Neuroblastoma Cancer Cells. J. Alloys Compd. 2015, 648, 1060–1066. [Google Scholar] [CrossRef]
  34. Matussin, S.N.; Rahman, A.; Khan, M.M. Role of Anions in the Synthesis and Crystal Growth of Selected Semiconductors. Front. Chem. 2022, 10, 881518. [Google Scholar] [CrossRef] [PubMed]
  35. Liu, H.; Zhu, Y.; Ma, J.; Chen, C.; Cheng, P.; Zhang, S. Hydrothermal Synthesis of Pd-Doped CeO2 Nanomaterials and Electrochemical Detection for Phenol. J. Cryst. Growth 2022, 586, 126626. [Google Scholar] [CrossRef]
  36. Gad, S.C. Palladium. In Encyclopedia of Toxicology; Elsevier: Amsterdam, The Netherlands, 2014; pp. 751–753. [Google Scholar] [CrossRef]
  37. Hegde, M.S.; Madras, G.; Patil, K.C. Noble Metal Ionic Catalysts. Acc. Chem. Res. 2009, 42, 704–712. [Google Scholar] [CrossRef]
  38. Wang, B.; Weng, D.; Wu, X.; Ran, R. Modification of Pd–CeO2 Catalyst by Different Treatments: Effect on the Structure and CO Oxidation Activity. Appl. Surf. Sci. 2011, 257, 3878–3883. [Google Scholar] [CrossRef]
  39. George, S.E.; George, M.; Alex, J.; Joy, L.K.; Aravind, A.; Sajan, D.; Thakur, A.; Hussain, S.; Vinitha, G. Nonlinear Optical and Photocatalytic Dye Degradation of Co Doped CeO2 Nanostructures Synthesized through a Modified Combustion Technique. Ceram. Int. 2020, 46, 13932–13940. [Google Scholar] [CrossRef]
  40. Matussin, S.N.; Khan, M.M. Phytogenic Fabrication of CeO2@SnO2 Heterojunction Nanostructures for Antioxidant Studies. Chem. Pap. 2022, 76, 2071–2084. [Google Scholar] [CrossRef]
  41. Naidi, S.N.; Harunsani, M.H.; Tan, A.L.; Khan, M.M. Green-Synthesized CeO2 Nanoparticles for Photocatalytic, Antimicrobial, Antioxidant and Cytotoxicity Activities. J. Mater. Chem. B 2021, 9, 5599–5620. [Google Scholar] [CrossRef]
  42. Tou, M.; Michalsky, R.; Steinfeld, A. Solar-Driven Thermochemical Splitting of CO2 and In Situ Separation of CO and O2 across a Ceria Redox Membrane Reactor. Joule 2017, 1, 146–154. [Google Scholar] [CrossRef] [PubMed] [Green Version]
  43. Channei, D.; Nakaruk, A.; Jannoey, P.; Phanichphant, S. Preparation and Characterization of Pd Modified CeO2 Nanoparticles for Photocatalytic Degradation of Dye. Solid State Sci. 2019, 87, 9–14. [Google Scholar] [CrossRef]
  44. Syed Khadar, Y.A.; Balamurugan, A.; Devarajan, V.P.; Subramanian, R.; Dinesh Kumar, S. Synthesis, Characterization and Antibacterial Activity of Cobalt Doped Cerium Oxide (CeO2:Co) Nanoparticles by Using Hydrothermal Method. J. Mater. Res. Technol. 2019, 8, 267–274. [Google Scholar] [CrossRef]
  45. He, L.; Ren, Y.; Fu, Y.; Yue, B.; Edman Tsang, S.C.; He, H. Morphology-Dependent Catalytic Activity of Ru/CeO2 in Dry Reforming of Methane. Molecules 2019, 24, 526. [Google Scholar] [CrossRef] [PubMed] [Green Version]
  46. Cui, X.; Xu, W.; Xie, Z.; Dorman, J.A.; Gutierrez-Wing, M.T.; Wang, Y. Effect of Dopant Concentration on Visible Light Driven Photocatalytic Activity of Sn1-XAgxS2. Dalton Trans. 2016, 45, 16290–16297. [Google Scholar] [CrossRef]
  47. Xing, J.; Jiang, H.B.; Chen, J.F.; Li, Y.H.; Wu, L.; Yang, S.; Zheng, L.R.; Wang, H.F.; Hu, P.; Zhao, H.J.; et al. Active Sites on Hydrogen Evolution Photocatalyst. J. Mater. Chem. A Mater. 2013, 1, 15258. [Google Scholar] [CrossRef]
  48. Khan, M.E.; Khan, M.M.; Cho, M.H. Ce3+-Ion, Surface Oxygen Vacancy, and Visible Light-Induced Photocatalytic Dye Degradation and Photocapacitive Performance of CeO2-Graphene Nanostructures. Sci. Rep. 2017, 7, 5928. [Google Scholar] [CrossRef] [Green Version]
  49. Kumar, K.M.; Mahendhiran, M.; Diaz, M.C.; Hernandez-Como, N.; Hernandez-Eligio, A.; Torres-Torres, G.; Godavarthi, S.; Gomez, L.M. Green Synthesis of Ce3+ Rich CeO2 Nanoparticles and Its Antimicrobial Studies. Mater. Lett. 2018, 214, 15–19. [Google Scholar] [CrossRef]
  50. Hu, Q.; Huang, B.; Li, Y.; Zhang, S.; Zhang, Y.; Hua, X.; Liu, G.; Li, B.; Zhou, J.; Xie, E.; et al. Methanol Gas Detection of Electrospun CeO2 Nanofibers by Regulating Ce3+/Ce4+ Mole Ratio via Pd Doping. Sens. Actuators B Chem. 2020, 307, 127638. [Google Scholar] [CrossRef]
  51. Choudhury, B.; Chetri, P.; Choudhury, A. Oxygen Defects and Formation of Ce3+ Affecting the Photocatalytic Performance of CeO2 Nanoparticles. RSC Adv. 2014, 4, 4663–4671. [Google Scholar] [CrossRef]
  52. Khan, I.; Saeed, K.; Ali, N.; Khan, I.; Zhang, B.; Sadiq, M. Heterogeneous Photodegradation of Industrial Dyes: An Insight to Different Mechanisms and Rate Affecting Parameters. J. Environ. Chem. Eng. 2020, 8, 104364. [Google Scholar] [CrossRef]
  53. Yang, C.; Yang, J.; Duan, X.; Hu, G.; Liu, Q.; Ren, S.; Li, J.; Kong, M. Roles of Photo-Generated Holes and Oxygen Vacancies in Enhancing Photocatalytic Performance over CeO2 Prepared by Molten Salt Method. Adv. Powder Technol. 2020, 31, 4072–4081. [Google Scholar] [CrossRef]
  54. Li, Y.F.; Liu, Z.P. Particle Size, Shape and Activity for Photocatalysis on Titania Anatase Nanoparticles in Aqueous Surroundings. J. Am. Chem. Soc. 2011, 133, 15743–15752. [Google Scholar] [CrossRef] [PubMed]
  55. Khan, M.M.; Ansari, S.A.; Pradhan, D.; Ansari, M.O.; Han, D.H.; Lee, J.; Cho, M.H. Band Gap Engineered TiO2 Nanoparticles for Visible Light Induced Photoelectrochemical and Photocatalytic Studies. J. Mater. Chem. A Mater 2014, 2, 637–644. [Google Scholar] [CrossRef]
  56. Li, W.; Li, M.; Xie, S.; Zhai, T.; Yu, M.; Liang, C.; Ouyang, X.; Lu, X.; Li, H.; Tong, Y. Improving the Photoelectrochemical and Photocatalytic Performance of CdO Nanorods with CdS Decoration. Cryst. Eng. Comm. 2013, 15, 4212. [Google Scholar] [CrossRef]
  57. Lu, X.; Zheng, D.; Zhang, P.; Liang, C.; Liu, P.; Tong, Y. Facile Synthesis of Free-Standing CeO2 Nanorods for Photoelectrochemical Applications. Chem. Commun. 2010, 46, 7721. [Google Scholar] [CrossRef]
  58. Ansari, S.A.; Khan, M.M.; Ansari, M.O.; Kalathil, S.; Lee, J.; Cho, M.H. Band Gap Engineering of CeO2 Nanostructure Using an Electrochemically Active Biofilm for Visible Light Applications. RSC Adv. 2014, 4, 16782–16791. [Google Scholar] [CrossRef]
  59. Zhang, W.; Li, Y.; Niu, J.; Chen, Y. Photogeneration of Reactive Oxygen Species on Uncoated Silver, Gold, Nickel, and Silicon Nanoparticles and Their Antibacterial Effects. Langmuir 2013, 29, 4647–4651. [Google Scholar] [CrossRef]
  60. Li, Y.; Zhang, W.; Niu, J.; Chen, Y. Mechanism of Photogenerated Reactive Oxygen Species and Correlation with the Antibacterial Properties of Engineered Metal-Oxide Nanoparticles. ACS Nano 2012, 6, 5164–5173. [Google Scholar] [CrossRef]
  61. Li, Y.; Zhang, W.; Niu, J.; Chen, Y. Surface-Coating-Dependent Dissolution, Aggregation, and Reactive Oxygen Species (ROS) Generation of Silver Nanoparticles under Different Irradiation Conditions. Environ. Sci. Technol. 2013, 47, 10293–10301. [Google Scholar] [CrossRef]
  62. Brunet, L.; Lyon, D.Y.; Hotze, E.M.; Alvarez, P.J.J.; Wiesner, M.R. Comparative Photoactivity and Antibacterial Properties of C60 Fullerenes and Titanium Dioxide Nanoparticles. Environ. Sci. Technol. 2009, 43, 4355–4360. [Google Scholar] [CrossRef] [PubMed]
  63. Azizi-Lalabadi, M.; Ehsani, A.; Divband, B.; Alizadeh-Sani, M. Antimicrobial Activity of Titanium Dioxide and Zinc Oxide Nanoparticles Supported in 4A Zeolite and Evaluation the Morphological Characteristic. Sci. Rep. 2019, 9, 65. [Google Scholar] [CrossRef] [PubMed] [Green Version]
  64. Sharma, G.; Prema, D.; Venkataprasanna, K.S.; Prakash, J.; Sahabuddin, S.; Devanand Venkatasubbu, G. Photo Induced Antibacterial Activity of CeO2/GO against Wound Pathogens. Arab. J. Chem. 2020, 13, 7680–7694. [Google Scholar] [CrossRef]
  65. Shams, S.; Khan, A.U.; Yuan, Q.; Ahmad, W.; Wei, Y.; Khan, Z.U.H.; Shams, S.; Ahmad, A.; Rahman, A.U.; Ullah, S. Facile and Eco-Benign Synthesis of Au@Fe2O3 Nanocomposite: Efficient Photocatalytic, Antibacterial and Antioxidant Agent. J. Photochem. Photobiol. B 2019, 199, 111632. [Google Scholar] [CrossRef]
Figure 1. (a) XRD patterns and (b) FTIR-spectra of S−CeO2 and (0.5, 1, 3, and 5%) Pd−CeO2 NPs.
Catalysts 13 00096 g001
Figure 2. XPS spectra of S−CeO2, 0.5% Pd−CeO2, and 5% Pd−CeO2: (a) Survey scan, (b) Ce 3d, (c) Pd 3d, (d) O 1s, and (e) C 1s.
Catalysts 13 00096 g002
Figure 3. (a) Valence band XPS spectra of S−CeO2, 0.5% Pd−CeO2, and 5% Pd−CeO2 NP; (b) zoomed valence band spectra of (i) S−CeO2, (ii) 0.5% Pd−CeO2, and (iii) 5% Pd−CeO2 to estimate the band gap; and (c) proposed density of electronic states (DOS) for (i) S−CeO2, (ii) 0.5% Pd−CeO2, and (iii) 5% Pd−CeO2 NPs.
Catalysts 13 00096 g003
Figure 4. (a) Tauc plot derived from Kubelka-Munk function for band gap energy estimation, and (b) photoluminescence spectra of C−CeO2, S−CeO2, and Pd−CeO2 NPs.
Catalysts 13 00096 g004
Figure 5. TEM, HR-TEM, and SAED patterns of (ac) S−CeO2, (df) 0.5% Pd−CeO2, and (gi) 5% Pd−CeO2 NPs.
Catalysts 13 00096 g005
Figure 6. (a) The average C/C0 of photocatalytic degradation of MB using C−CeO2, S−CeO2, and Pd−CeO2 NPs under visible light irradiation, (b) LSV, and (c) EIS Nyquist plots of S−CeO2, 0.5%, 1%, 3%, and 5% Pd−CeO2 photoelectrode in the dark and under visible light irradiation.
Catalysts 13 00096 g006
Figure 7. Log reduction of the S. aureus treated with different concentrations of S−CeO2 NPs and Pd−CeO2 NPs incubated under (a) dark and (b) light conditions. Log reduction of the P. aeruginosa treated with different concentrations of S−CeO2 NPs and Pd−CeO2 NPs incubated under (c) dark conditions and (d) light conditions, where ***, **, and * imply significance at p < 0.0001, p < 0.01, and p < 0.05, respectively, while ns means non-significant.
Catalysts 13 00096 g007
Table 1. The average crystallite size (D), lattice parameter, cell volume, and average lattice strain of S−CeO2 and Pd−CeO2 NPs.
SampleAverage Crystallite Size (D, nm)Lattice Parameter, a (Å)Cell Volume (Å3)Average Lattice Strain
S−CeO234.675.414158.690.0022
0.5% Pd−CeO237.255.408158.160.0009
1% Pd−CeO216.255.423159.480.0004
3% Pd−CeO223.035.409158.250.0019
5% Pd−CeO219.175.428159.930.0022
Table 2. Atomic concentration of C 1s, O 1s, Ce 3d, and Pd 3d of S−CeO2, 0.5% Pd−CeO2, and 5% Pd−CeO2.
SampleAtomic Concentration (%)
C 1sO 1sCe 3dPd 3d
S−CeO212.474.113.5-
0.5% Pd−CeO212.672.115.10.2
5% Pd−CeO219.066.312.81.9
Table 3. Band gap energy of C−CeO2, S−CeO2, and Pd−CeO2 NPs.
SampleBand Gap Energy (eV)
C−CeO23.10
S−CeO22.56
0.5% Pd−CeO22.50
1% Pd−CeO22.47
3% Pd−CeO22.42
5% Pd−CeO22.27
Table 4. The average percentage MB dye degradation using C−CeO2, S−CeO2, and Pd−CeO2 under visible light irradiation.
C−CeO2S−CeO20.5% Pd−CeO21% Pd−CeO23% Pd−CeO25% Pd−CeO2
0 h3.87 ± 1.9444.92 ± 3.6042.21 ± 6.3461.87 ± 3.9739.57 ± 0.8150.83 ± 1.52
1 h3.33 ± 1.0447.22 ± 2.0645.58 ± 7.5461.20 ± 6.9240.67 ± 1.0350.18 ± 0.80
2 h4.19 ± 0.6651.69 ± 2.7748.19 ± 7.7364.63 ± 7.9244.07 ± 2.5053.62 ± 2.72
3 h4.57 ± 1.3354.13 ± 1.5250.35 ± 6.5567.42 ± 8.6445.36 ± 2.0254.85 ± 2.15
4 h7.12 ± 3.8258.99 ± 2.2954.72 ± 5.7170.87 ± 9.4847.31 ± 3.1957.56 ± 3.31
5 h10.28 ± 3.1360.48 ± 3.7660.33 ± 1.7672.07 ± 5.3451.20 ± 3.4762.10 ± 4.27
Disclaimer/Publisher’s Note: The statements, opinions and data contained in all publications are solely those of the individual author(s) and contributor(s) and not of MDPI and/or the editor(s). MDPI and/or the editor(s) disclaim responsibility for any injury to people or property resulting from any ideas, methods, instructions or products referred to in the content.

