Article

Analysis of Unregulated VOCs Downstream a Three-Way Catalyst in a Simulated Gasoline Engine Exhaust under Non-Optimum Conditions

1
Univ Lyon, Université Claude Bernard Lyon 1, CNRS, IRCELYON, F-69626 Villeurbanne, France
2
Université Paris Saclay, Faculté des Sciences, CNRS, Institut de Chimie Physique, F-91405 Orsay, France
3
Univ Lyon, Université Claude Bernard Lyon 1, CNRS, ISA, F-69626 Villeurbanne, France
*
Authors to whom correspondence should be addressed.
Submission received: 2 February 2023 / Revised: 1 March 2023 / Accepted: 8 March 2023 / Published: 10 March 2023
(This article belongs to the Special Issue Approaches to Catalysis: Elimination of Environmental Pollutants)

Abstract

:
Urban air pollution is partly due to exhaust emissions from road transport. Vehicle emissions have been regulated for more than 30 years in many countries around the world. Each motor type is equipped with a specific emission control system. In gasoline vehicles, a three-way catalytic converter (TWC) is implemented to remove at the same time hydrocarbons (HC), carbon monoxide (CO), and nitrogen oxides (NOx). However, TWCs are only efficient above 200 °C and at a stoichiometric air-to-fuel ratio in the exhaust. However, deviations from stoichiometry occur during fast accelerations and decelerations. This study reports the analysis of unregulated VOCs commercial mini-TWC fed by model gasoline gas mixtures. A synthetic gas bench was used to control the model exhaust containing two model hydrocarbons (propene and propane) to identify the conditions at which VOCs are created under non-optimal conditions. Most of the pollutants such as N2O and VOCs were emitted between 220 and 500 °C with a peak at around 280 °C, temperature which corresponds to the tipping point of the TWC activity. The combination of different mass spectrometric analysis (online and offline) allowed to identify many different VOCs: carbonated (acetone, acetaldehyde, acroleine), nitrile (acetonitrile, propanenitrile, acrylonitrile, cyanopropene) and aromatic (benzene, toluene) compounds. Growth mechanisms from propene and to a lesser extend propane are responsible for the formation of these higher aromatic compounds that could lead to the formation of secondary organic aerosol in a near-field area.

Graphical Abstract

1. Introduction

Air pollution is one of the main health threats to humankind, along with climate change. The World Health Organization (WHO) estimated that, in 2019, 99% of the world population was living in places where air quality guideline levels were not met, causing 4.2 million premature deaths in 2016. In September 2022, WHO published new Air Quality Guidelines to reduce even further the pollution level at which the air is considered harmful. All urban areas in the world are exposed to poor air quality. Heavy traffic is responsible for a great part of this urban air pollution, due to nitrogen oxides (NOx), volatile organic compounds (VOCs), and particulate matter (PM) emissions. This situation has triggered the emergence of free emission zones in large cities, such as in London in 2008. Vehicle emissions are dependent on many factors such as external temperature, engine types and regime, fuel type, road-driving behavior and composition, and loading and mileage of the post-treatment catalyst [1,2].
Since the implementation of the Euro standards in 1992, emissions from light-duty vehicles have been drastically reduced in the European Union. For instance, all gasoline engines are now equipped with a Three-Way Catalytic converter (TWC) located downstream of the engine in the exhaust line. TWCs promote the depletion of hydrocarbons (HC), carbon monoxide (CO), and nitric oxide (NO) along with three simultaneous global reactions:
HC + n O 2 m CO 2 + p H 2 O
2 CO + O 2 2 CO 2
2 NO + 2 CO N 2 + 2 CO 2
Reactions (1) and (2) are favored under oxidative conditions while reaction (3) is promoted under reductive ones. When the air-to-fuel ratio is to high (oxidative or “lean” conditions), CO and HC are fully oxidized and NO is oxidized into NO2. Whereas for low air-to-fuel ratios (reductive or “rich” conditions), CO and HC are only partially oxidized, leading to the formation of many sub-products [1,2,3]. Therefore, optimal TWC operating conditions are achieved for a stoichiometric air-to-fuel ratio [4] which is continuously monitored on board and tuned by a Lambda sensor. The activity of a TWC also depends on the exhaust temperature. Typically, TWCs start to convert pollutants from 200–250 °C according to the composition and loading of the catalytic washcoat [4,5]. Therefore, a large pollution emission spectra may occur by gasoline vehicles during the cold-start period, before the catalyst is functional and during urban driving, as it promotes a low regime engine mode, due to speed limits and constant stops constraining the exhaust temperature. Reiter and Kockelman [6] estimated that vehicle cold-starts, gasoline, and diesel account for up to 80% of some mobile-source air pollutants. This is in particular very problematic in confined spaces such as underground garages where high concentrations of pollutants such as BTX (benzene, toluene, and xylene), PAH (polyaromatic hydrocarbons), PM, CO, and NO2 were measured at levels corresponding to chronic or even acute risks [7]. To decrease cold-start emissions, TWC is generally located as close as practicable to the engine exhaust (closed-coupled catalysts) to reduce the warm-up time. Another attractive method is to add a hydrocarbon (HC) trap material in TWCs which can store the HC emissions during the cold start period and desorb them at higher temperatures where they can be fully oxidized by the TWC [8].
Not only are cold-start periods problematic; stoichiometric air-to-fuel ratios are also crucial for the optimal operation of TWCs [5,9]. Deviations from stoichiometric conditions can be observed in particular during fast acceleration (or deceleration) of the vehicles, as the air compensation used to maintain a constant air-to-fuel ratio is generally not reactive enough compared to the rapid increase (or decrease) of the fuel injection [1,10]. As a consequence, during these fast transitions, TWCs are less efficient and can also produce many pollutants such as VOCs. Some studies demonstrated the formation of VOCs downstream TWCs due to the partial oxidation of HC during transients in rich conditions [11,12].
To the best of our knowledge, the great majority of the studies in the literature on the impact of TWC on VOC emissions were performed on a chassis dynamometer with a vehicle or on an engine test for which fuel, mileage, and conditions can be highly variable [1,3,10,12,13,14]. Thus, operations with a vehicle or an engine cannot easily explore, with a stable and reproducible manner, the deviations from stoichiometric conditions, which are critical for TWCs. This is due to the high complexity of the injection systems, combustion chamber, and post-treatment process which introduces variabilities in the emission concentrations, exhaust flow, and temperature. Furthermore, this kind of measurement with engines or vehicles does not allow removing of CO2 or H2O from the exhaust and to investigate the impact of the nature of the hydrocarbon on the emissions. Therefore, the use of a synthetic gas bench is necessary to downgrade variability and complexity, at the cost of dynamic changes. TWC controlled studies essentially focus on regulated emission. In fine, there is only few studies on the formation of VOC on TWC in controlled conditions, and usually on a limited number of species (nitrous oxide, ammonia, methane, etc.) [9,15,16], despite its known high activity.
To address this significant gap, we report in this study a qualitative real-time analysis of non-regulated pollutants, mainly VOCs, downstream a commercial TWC in reproducible and controlled conditions in terms of overall flow (and then constant space velocity), constant upstream concentrations of hydrocarbons, CO, NO, O2, CO2, and H2O, and reproducible ramps of temperature. We decided to use a synthetic gas bench which can operate with controlled and reproducible simulated gasoline engine exhausts, leading the possibility to explore the impact of temperature, the nature of hydrocarbons, and H2O and CO2 on the TWC catalytic performances and emissions. The ability of TWCs to oxidize organics depends on their nature, according to this reactivity classification: alkene > aromatic > aldehyde > ketone > alkane [11]. We then selected propane and propene as two representative hydrocarbons of gasoline exhausts for their opposite reactivities: high for propene and low for propane. Two richness of the gas mixtures (rich and lean) were investigated to mimic deviations from stoichiometric conditions in the temperature range 150–650 °C as well as the impact of H2O and CO2 on the VOCs emissions. The control of rich and lean conditions along light-off experiments is very tricky to achieve with a real engine, justifying the implementation of a synthetic gas bench. Despite the relative simplicity of the composition of the simulated gasoline engine exhaust and a constant space velocity, we analyzed in real-time an extensive set of unregulated molecules, showing a more complicated image of reaction chemistry than expected.

2. Results

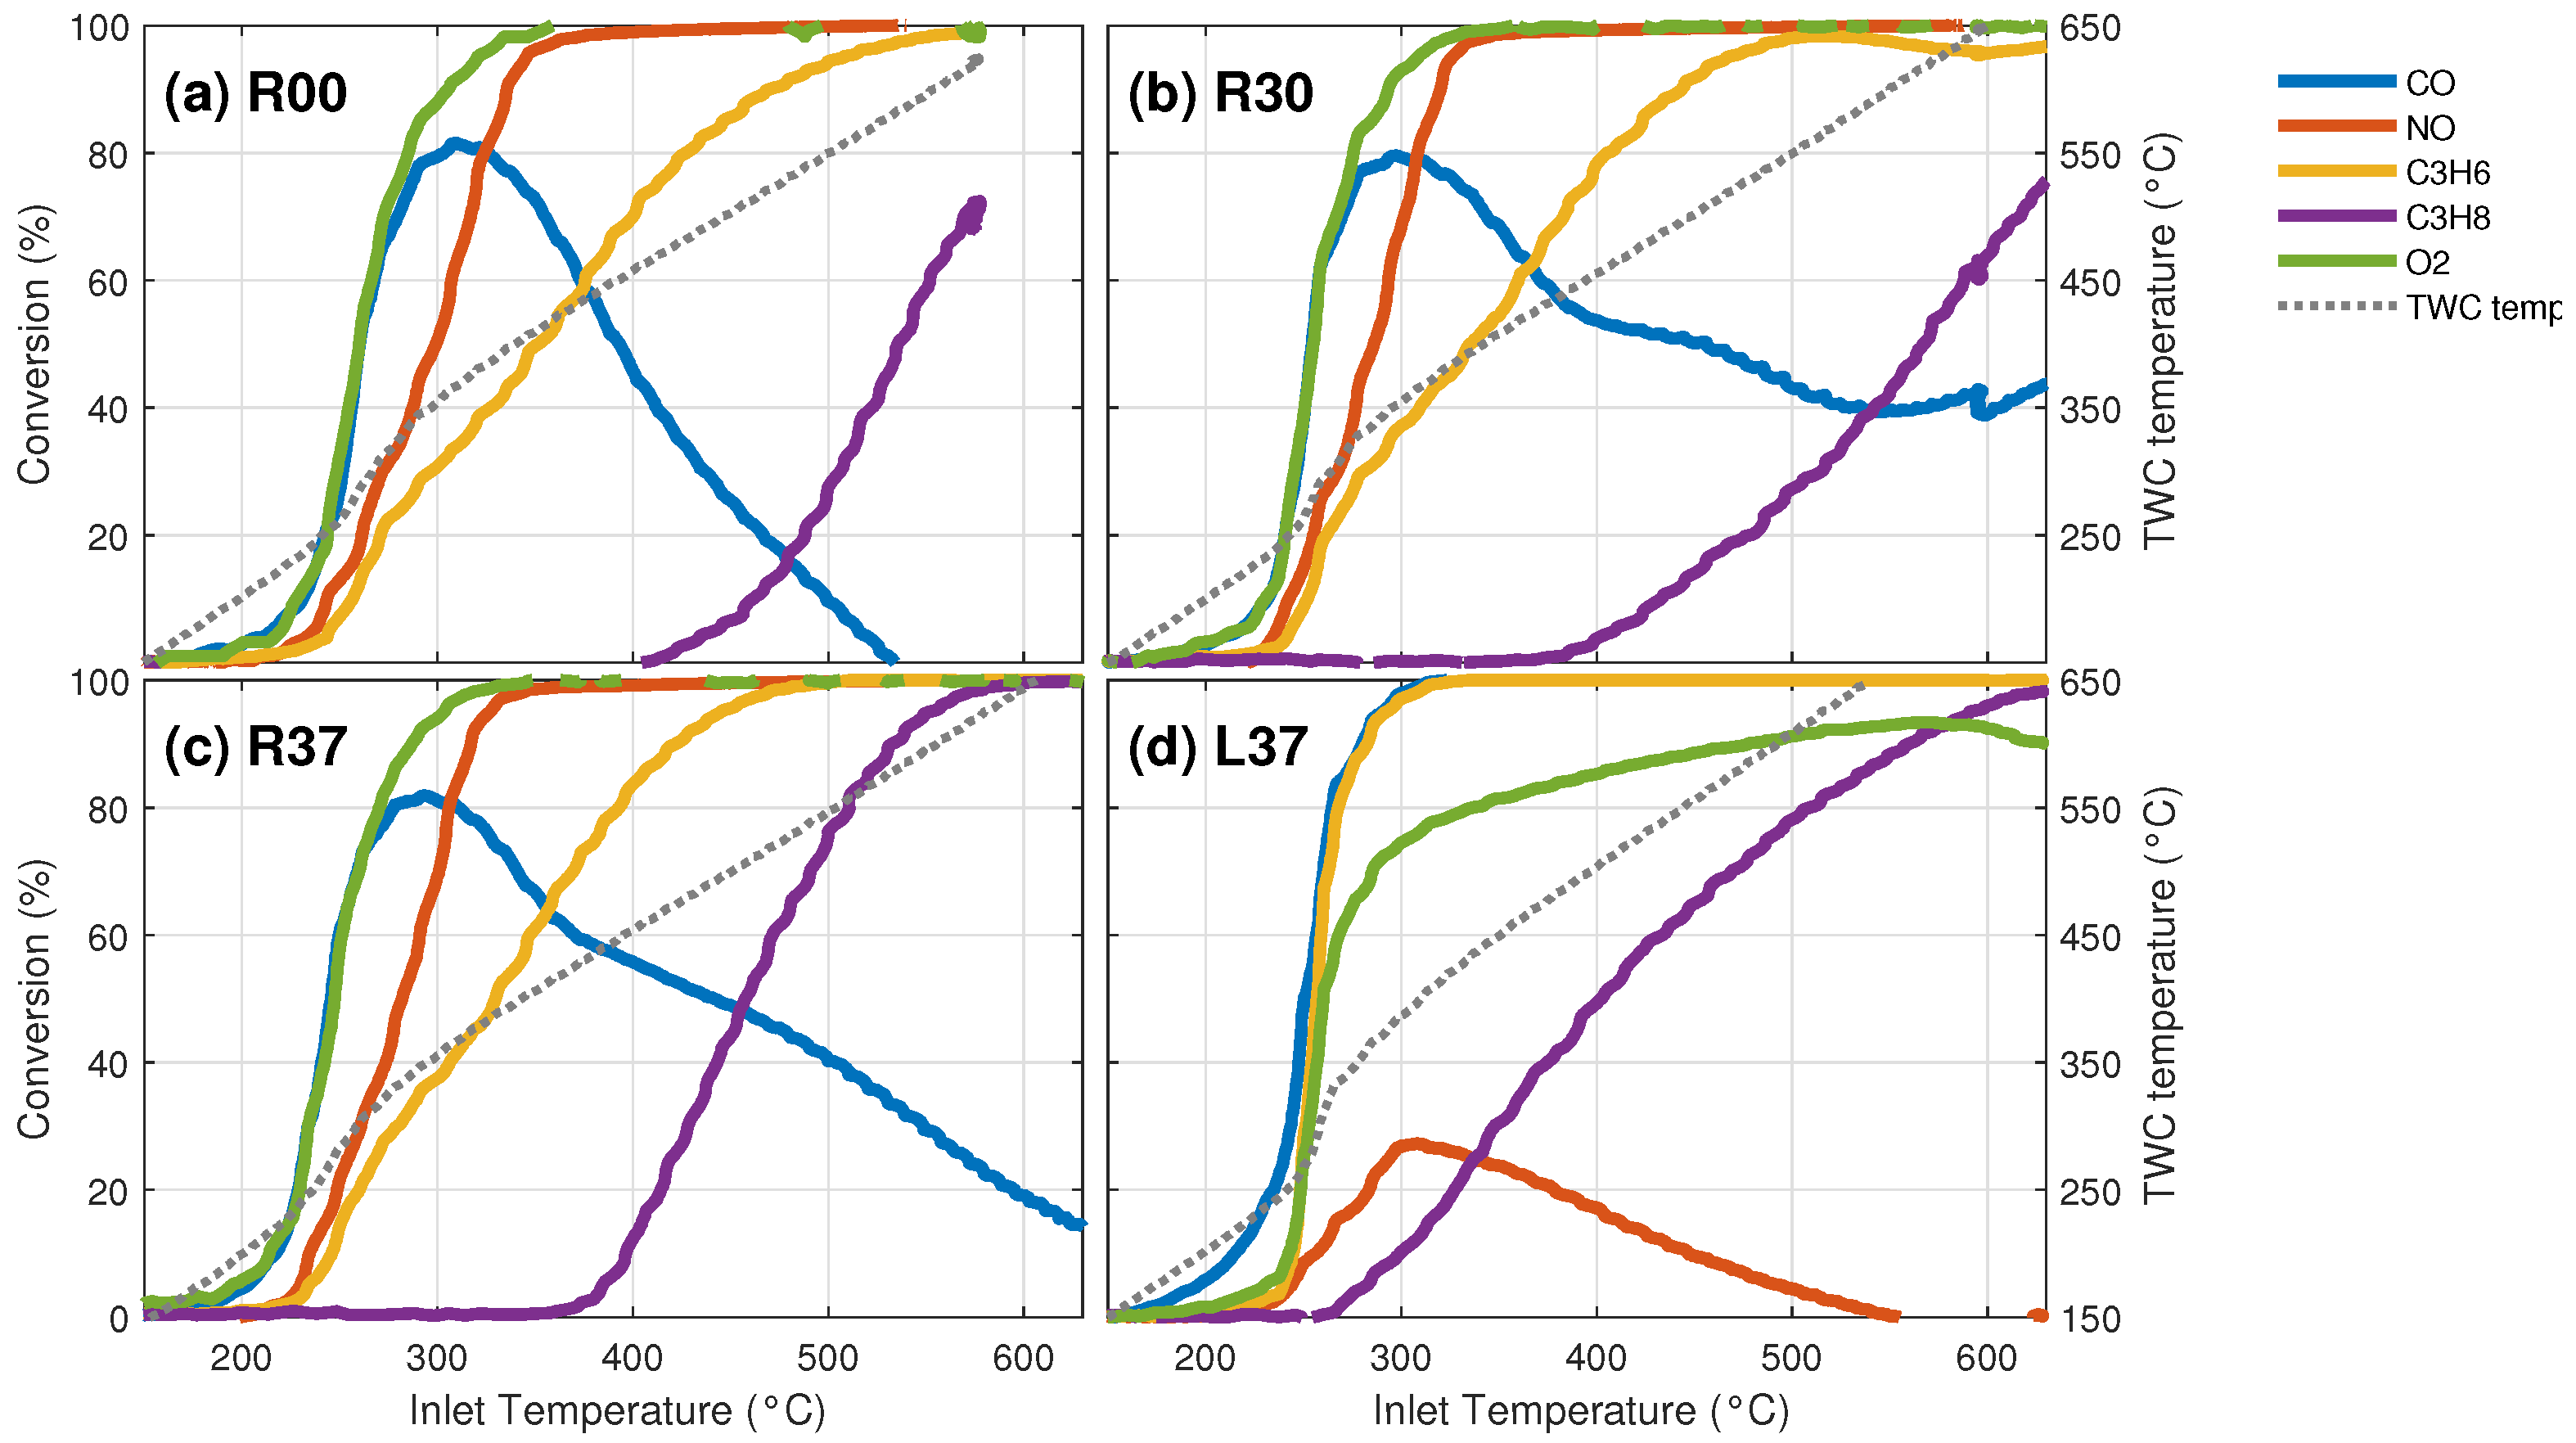
2.1. Catalytic Performances

Figure 1 presents LO curves for 4 different reactive mixtures. Temperature values for 10% and 50% conversion are reported in Table 1. As expected, under lean conditions, all oxidation processes are favored, and total conversion of CO and HCs is observed. The onset temperatures for CO, propene and propane oxidation are 155 °C, 195 °C, and 262 °C, respectively. The activation of CO and C3H6 triggers a significant increase of T T W C from 250 °C up to 320 °C due to the exothermicity of these oxidation reactions. CO and propene are fully oxidized from 320 °C upwards, while propane oxidation is more gradual reaching 100% of conversion above 620 °C. These results confirm the low reactivity of propane compared to propene on TWCs. In parallel, NO reduction is limited, reaching a maximum conversion of 27% at 306 °C, corresponding to the temperature of full conversion of CO and propene. After the full oxidation of CO and propene, the time variation of T T W C is linear and follows the controlled ramp of 200 °C h 1 without any exotherms.
Under rich conditions (Figure 1—(a) R00, (b) R30, and (c) R37) two temperature domains can be clearly distinguished according to the residual concentration of oxygen in the feed: a low-temperature domain, typically below 270–280 °C where the residual oxygen concentration is high enough and a high-temperature domain above 280 °C where the remaining oxygen level is low or negligible.
In the low-temperature domain, predominant reactions in the R00 mixture are CO (2) and C3H6 (4) oxidation as well as NO reduction by CO (3). As in lean L37 conditions, CO is the more reactive pollutant, with an onset temperature below 200 °C, while propene and NO are simultaneously activated from 220 °C. An exotherm in the TWC, similar to the one observed in lean conditions, is taking place from around 240–250 °C. The addition of water in the feed (R30) has no significant impact in this low temperature domain as confirmed by similar T 10 % values (Table 1) for CO, propene and NO conversions.
C 3 H 6 + 4.5 O 2 3 CO 2 + 3 H 2 O
At the tipping point between the low and high temperature domains, both CO and propene conversions stop rising, then ceasing the exotherm in the TWC. This tipping point also corresponds to the maximum of the emissions of N2O produced by the NO reduction (Figure 2). In the high temperature domain, the low residual concentration of O2 triggers many side reactions, leading to a very complex media. For instance, the partial oxidation (5) and the steam reforming (6) of propene occur as proved by the drop of the CO conversion and the emissions of H2 (Figure 2). This latter can further react with NO to produce NH3, along reaction (8), above 400 °C (Figure 2) as it has been mainly observed under rich conditions and at high speeds in the exhaust of gasoline vehicles [17]. The addition of water in the feed (R30 and R37) enhances the CO conversion above 380 °C most probably because TWC promotes the water–gas shift reaction (7) as already observed by Lopez-Gonzales et al. [18]:
C 3 H 6 + 3 O 2 3 CO + 3 H 2 O
C 3 H 6 + 3 H 2 O 3 CO + 6 H 2
CO + H 2 O H 2 + CO 2
NO + 5 2 H 2 NH 3 + H 2 O
Propane starts to be converted at a much higher temperature than in lean conditions (Table 1) due to the lack of oxygen in the rich conditions, it reacts via propane steam reforming (9). The presence of CO2 in the reactive mixture (R37) strongly enhances the propane conversion, demonstrating a good activity of the TWC for the propane dry reforming (10).
C 3 H 8 + 3 H 2 O 3 CO + 7 H 2
C 3 H 8 + 3 CO 2 6 CO + 4 H 2

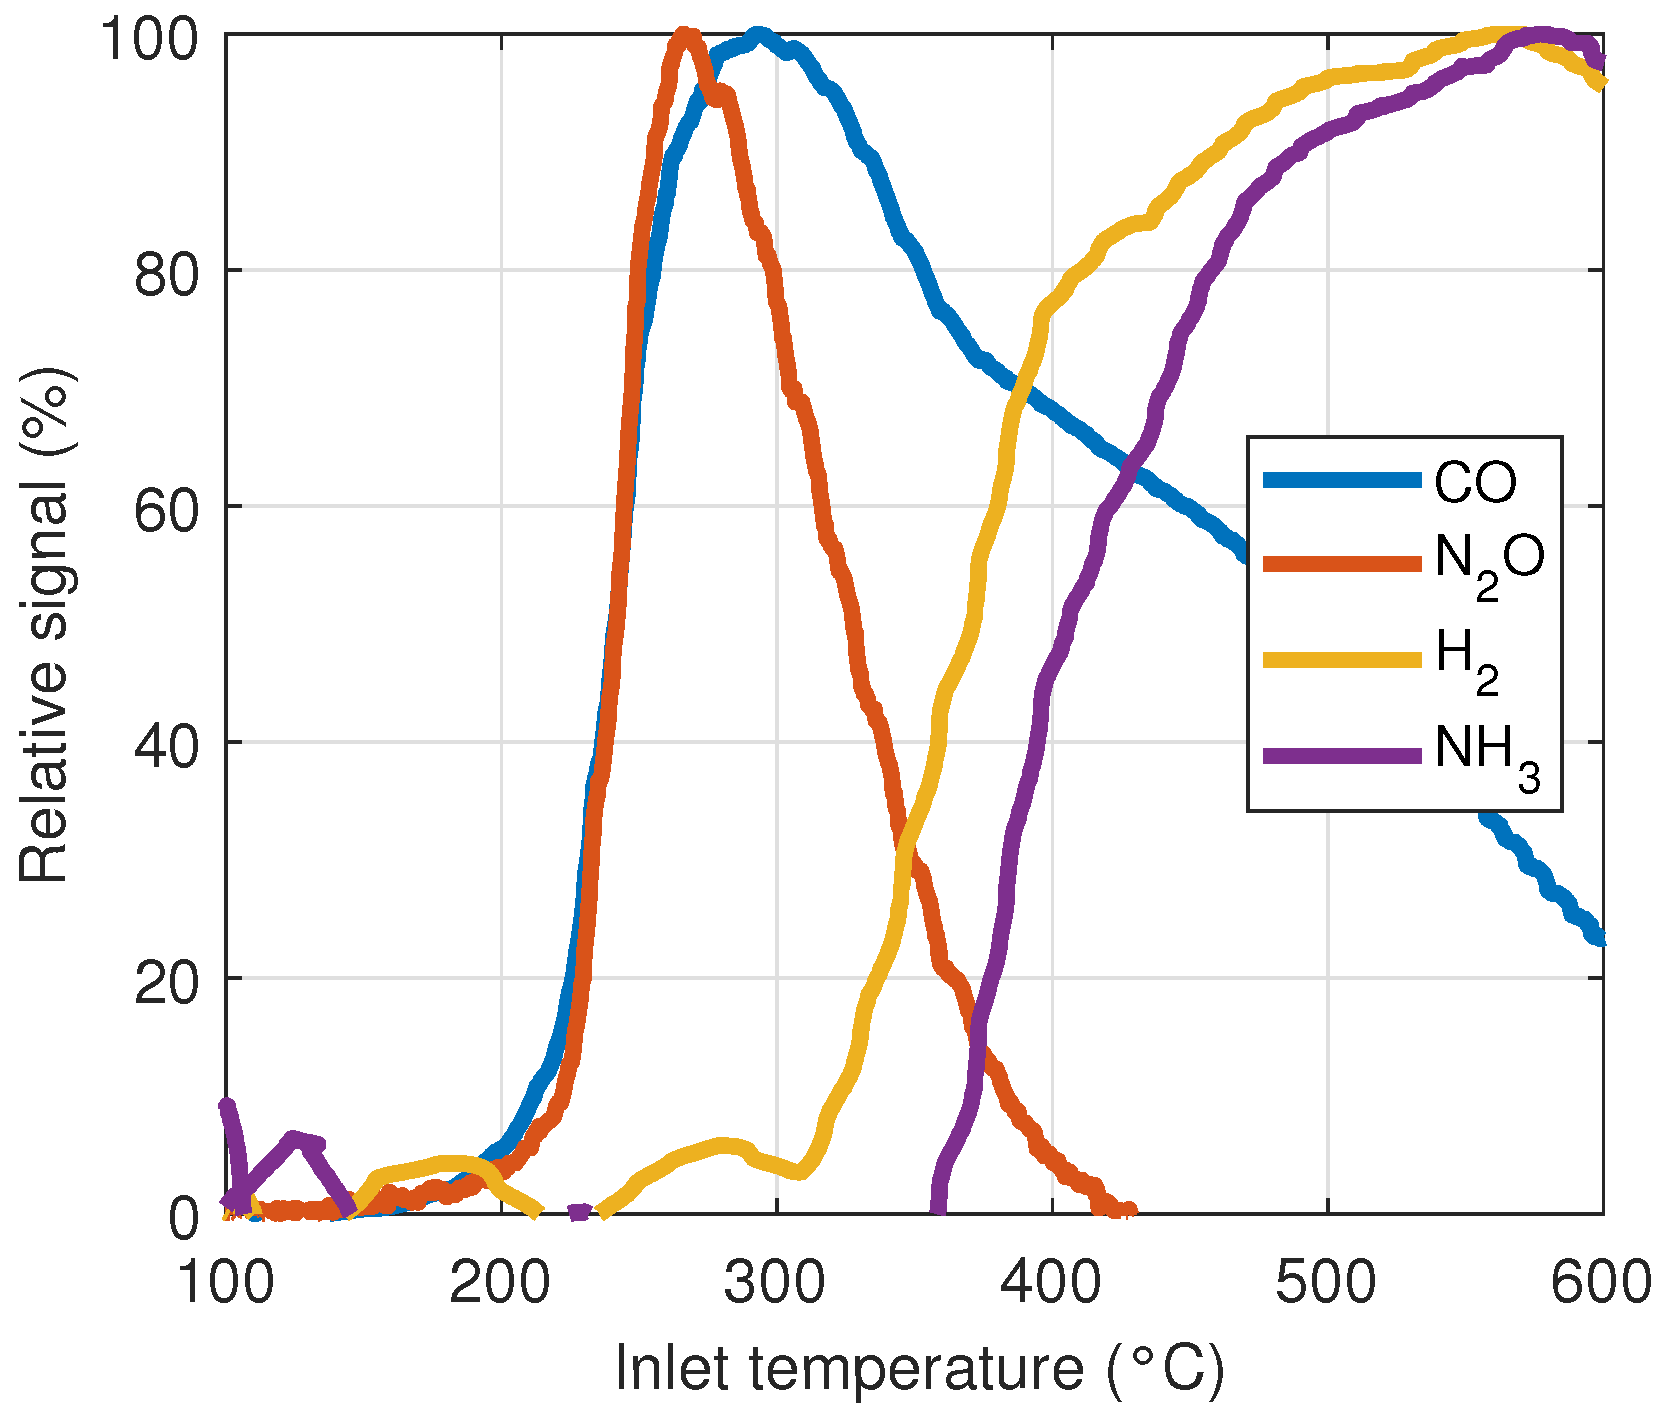
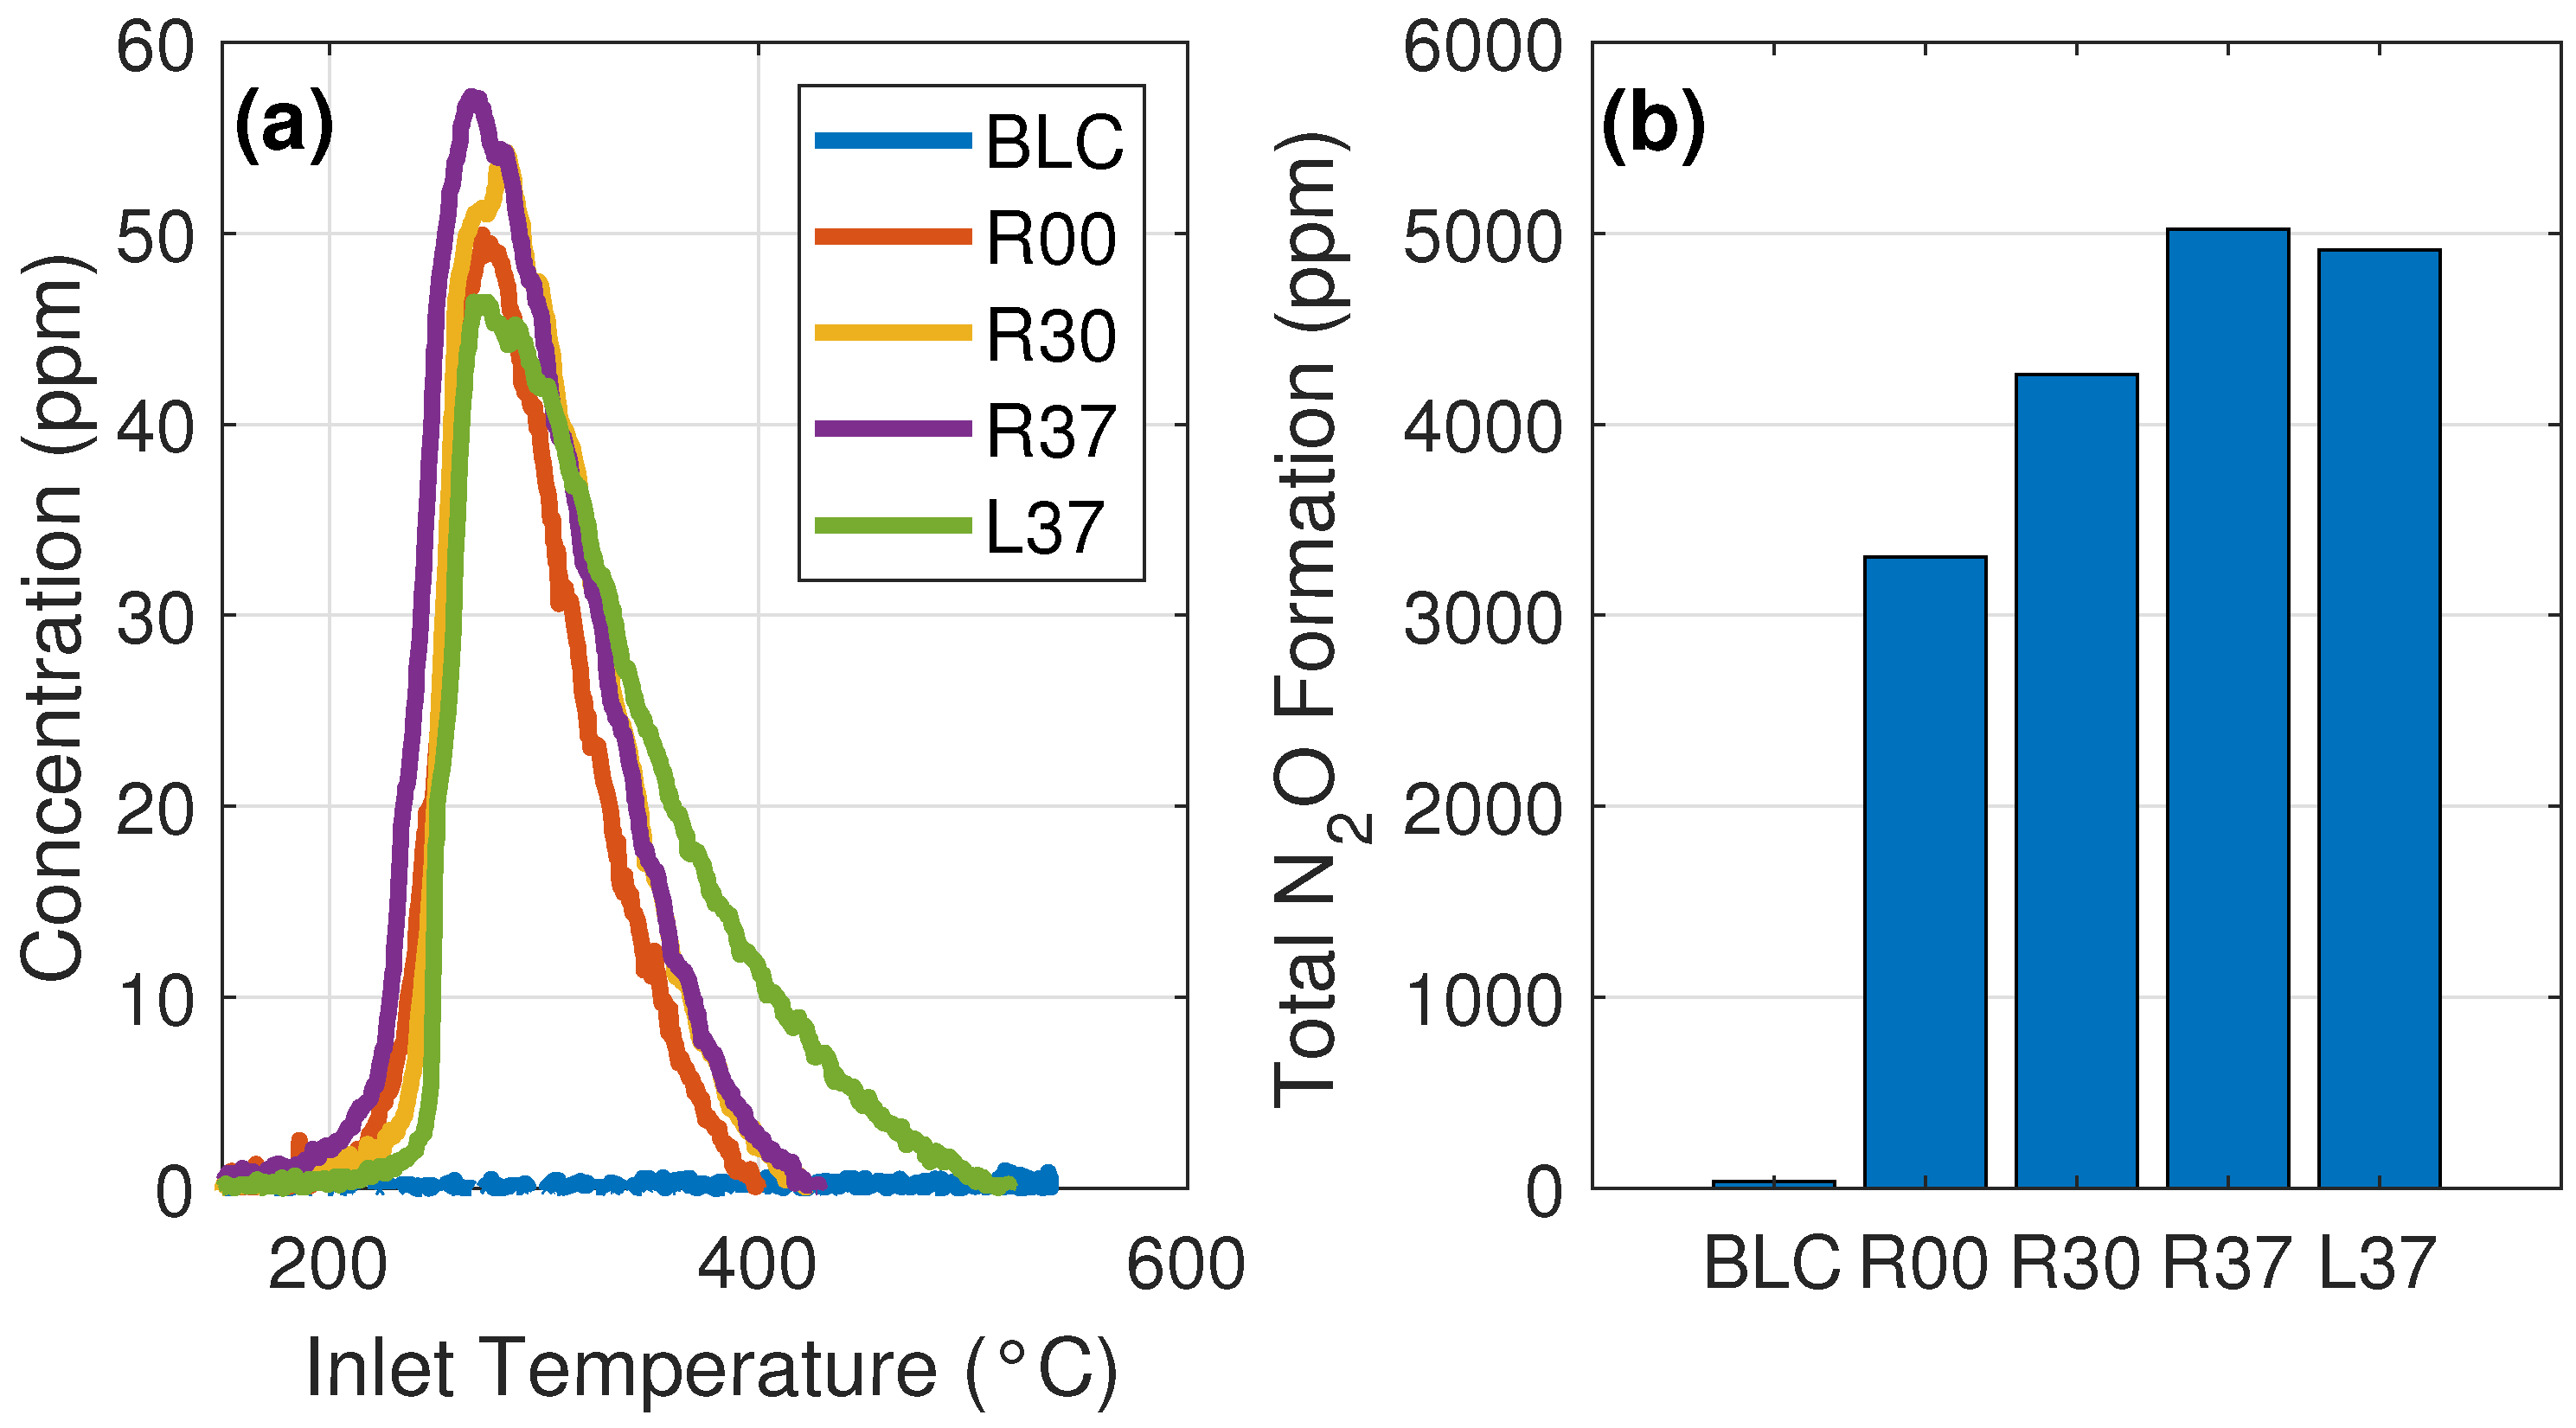
2.2. Nitrous Oxide Formation

Nitrous oxide N2O is a greenhouse gas and an ozone-depleting substance [19] for which the emissions by transport and industry represent 15% of the total emissions [20]. In transportation-related emissions, N2O is a known by-product of the NO reduction in a three-way catalyst (11) at low temperature [20,21], according to:
2 NO + CO N 2 O + CO 2
Figure 3 presents N2O emissions during LO analysis under different oxidative/reductive conditions. N2O is produced regardless of the conditions (rich or lean). An important variability is observed though from one experiment to another on its maximal quantity, varying from 46 to 58 ppm. The mean of the maximum N2O concentration in rich reactive mixtures is 54 ± 13 ppm. The N2O production starts from 220 °C ( T 10 % = 230 ± 23 °C), concomitantly with NO reduction by CO, and reaches a maximum at 276 ± 11 °C, corresponding to the tipping point described above and then drops until complete disappearance from 400 °C (at T 10 % = 389 ± 16 °C where only 10% on N2O is left) for rich experiments, which is consistent with the literature [21,22].
In the case of lean conditions, the N2O production is slightly shifted to higher temperature, reaching a lower maximum value (47 ppm at 267 °C) but more gradually vanished with temperature until 500 °C ( T 10 % = 451 °C). The overall N2O production during the different LOs has been estimated from the area of the N2O production profiles (Figure 3b). Interestingly, our experiments indicate that the addition of H2O and CO2 significantly increases the N2O production, in particular above 300 °C. H2O and CO2 most likely competes with CO and NO on the surface of the TWC catalysts and makes more difficult the N2 production.

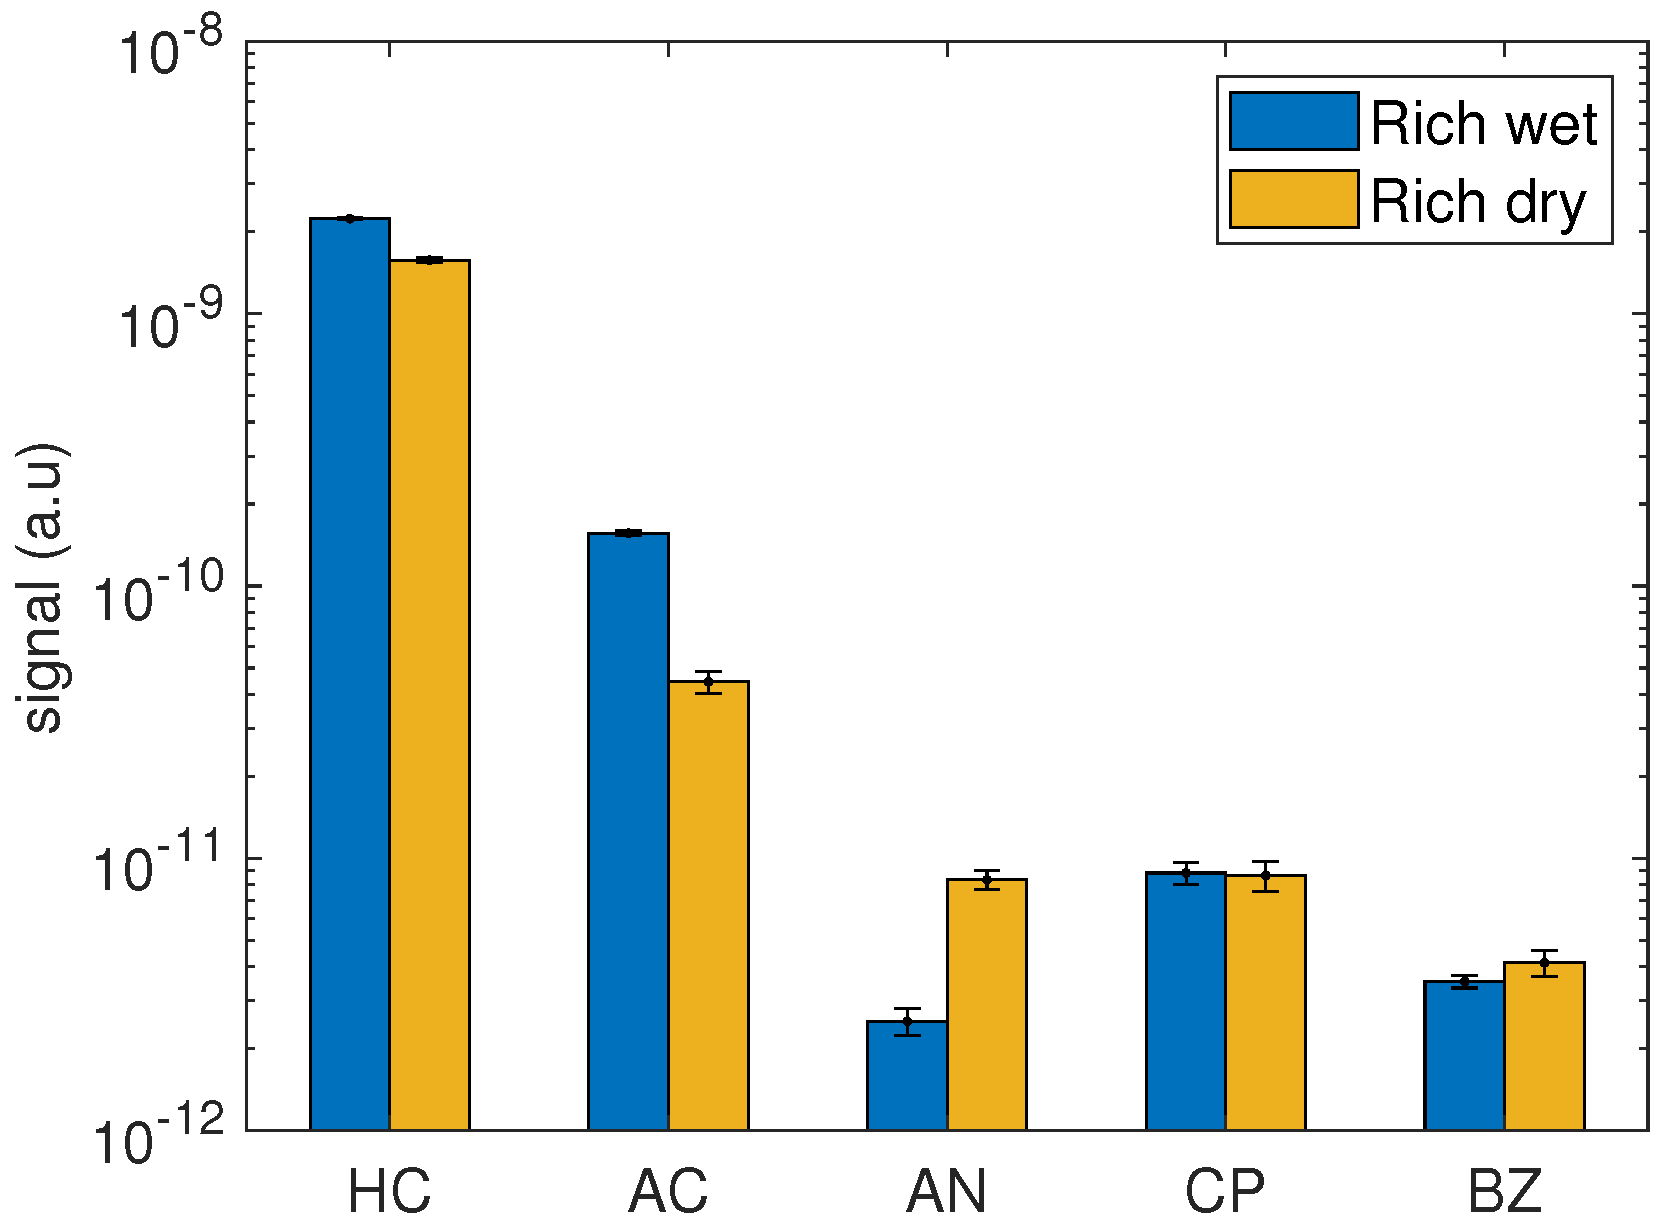
2.3. VOCs Formation at Constant Temperature

VOCs emissions were measured during two isotherms at 280 °C and 400 °C in a specific rich mixture (see materials and methods section for further information) with and without water in the feed. During the plateau at 280 °C and in dry conditions, the conversion of propene and NO were similar at 20%, CO conversion was 70%, whereas C3H8 was only slightly converted for this experiment. The N2O concentration peaked at 68 ppm after 1 h smoothed step-wise increase. This maximum value was higher than that measured in R00. After 1 h of sampling at 280 °C, TD-GC-MS evidenced the presence of many nitriles such as acetonitrile (CH3CN), propanenitrile (C2H5CN) and 2-propenenitrile (C2H3CN). In addition, MIMS (Figure 4) has identified acrylonitrile (C2H3CN) and cyanopropene that might be propenenitrile or methylacrylonitrile (CH2C(CH3)CN). Higher mass compounds were observed mainly corresponding to aromatics such as benzene, toluene or xylene.
Wet conditions at the same temperature greatly modify the profile of the main identified VOCs (Figure 4). While the nitriles concentration generally decreased in presence of H2O, except for cynaopropene, a clear increase of oxygenated compounds was observed. Acetone drastically increased by a factor of 10 from dry to wet conditions. This trend was confirmed using the PTR-MS, which has also identified other oxygenated volatiles such as acetaldehyde and a small signal of acroleine (C2H3CHO). TD-GC-MS also highlighted a large increase in the number of analytes under wet conditions compared to dry conditions, with a predominant GC peak attributed to butanol. This molecule was not identified with the other techniques as butanol can be fragmented into daughter ions that interfere with other ions (from propane, propene, and acrolein) in MIMS and PTR-MS [23]. Apart from butanol, TD-GC-MS has evidenced the presence of acids and esters such as propanoic acid and its ester derivatives as well as ester derivatives of acetic acid. Many oxygenated and nitrogenated aromatic species were also identified, in particular acetophenone, phenol derivatives and pyridines derivatives. The signal of aromatics like benzene was only slightly modified (Figure 4) by the addition of water in the feed.
At 400 °C, as expected, conversion of pollutants under dry conditions were higher (70% for CO, 50% for propene and 10% for propane), while NO was totally reduced. At this high temperature, oxygen was fully consumed. As already observed at 280 °C, dry conditions promote the formation of nitriles: acetonitrile, propanenitrile, methylacrylonitrile, and 2-butenenitrile were observed in TD-GC-MS and PTR-MS and HCN was identified as well by PTR-MS. HCN, acetonitrile, and propanenitrile signals were at their highest intensity at this temperature. Presence of aromatics (benzene, toluene, xylene, styrene, up to naphthalene) were also identified in these conditions. As at 280 °C, the addition of water drastically increased the number of visible peaks in PTR-MS and TD-GC-MS spectra. A large amount of butanol was detected again by TD-GC-MS. Contrary to the above-mentioned nitriles, acetone and acetaldehyde concentrations faded before 400 °C. Interestingly, as in cooler conditions, pyridines derivatives were identified in TD-GC-MS (pyridine and ethylpyridine for instance) as well as acid and ester derivatives.

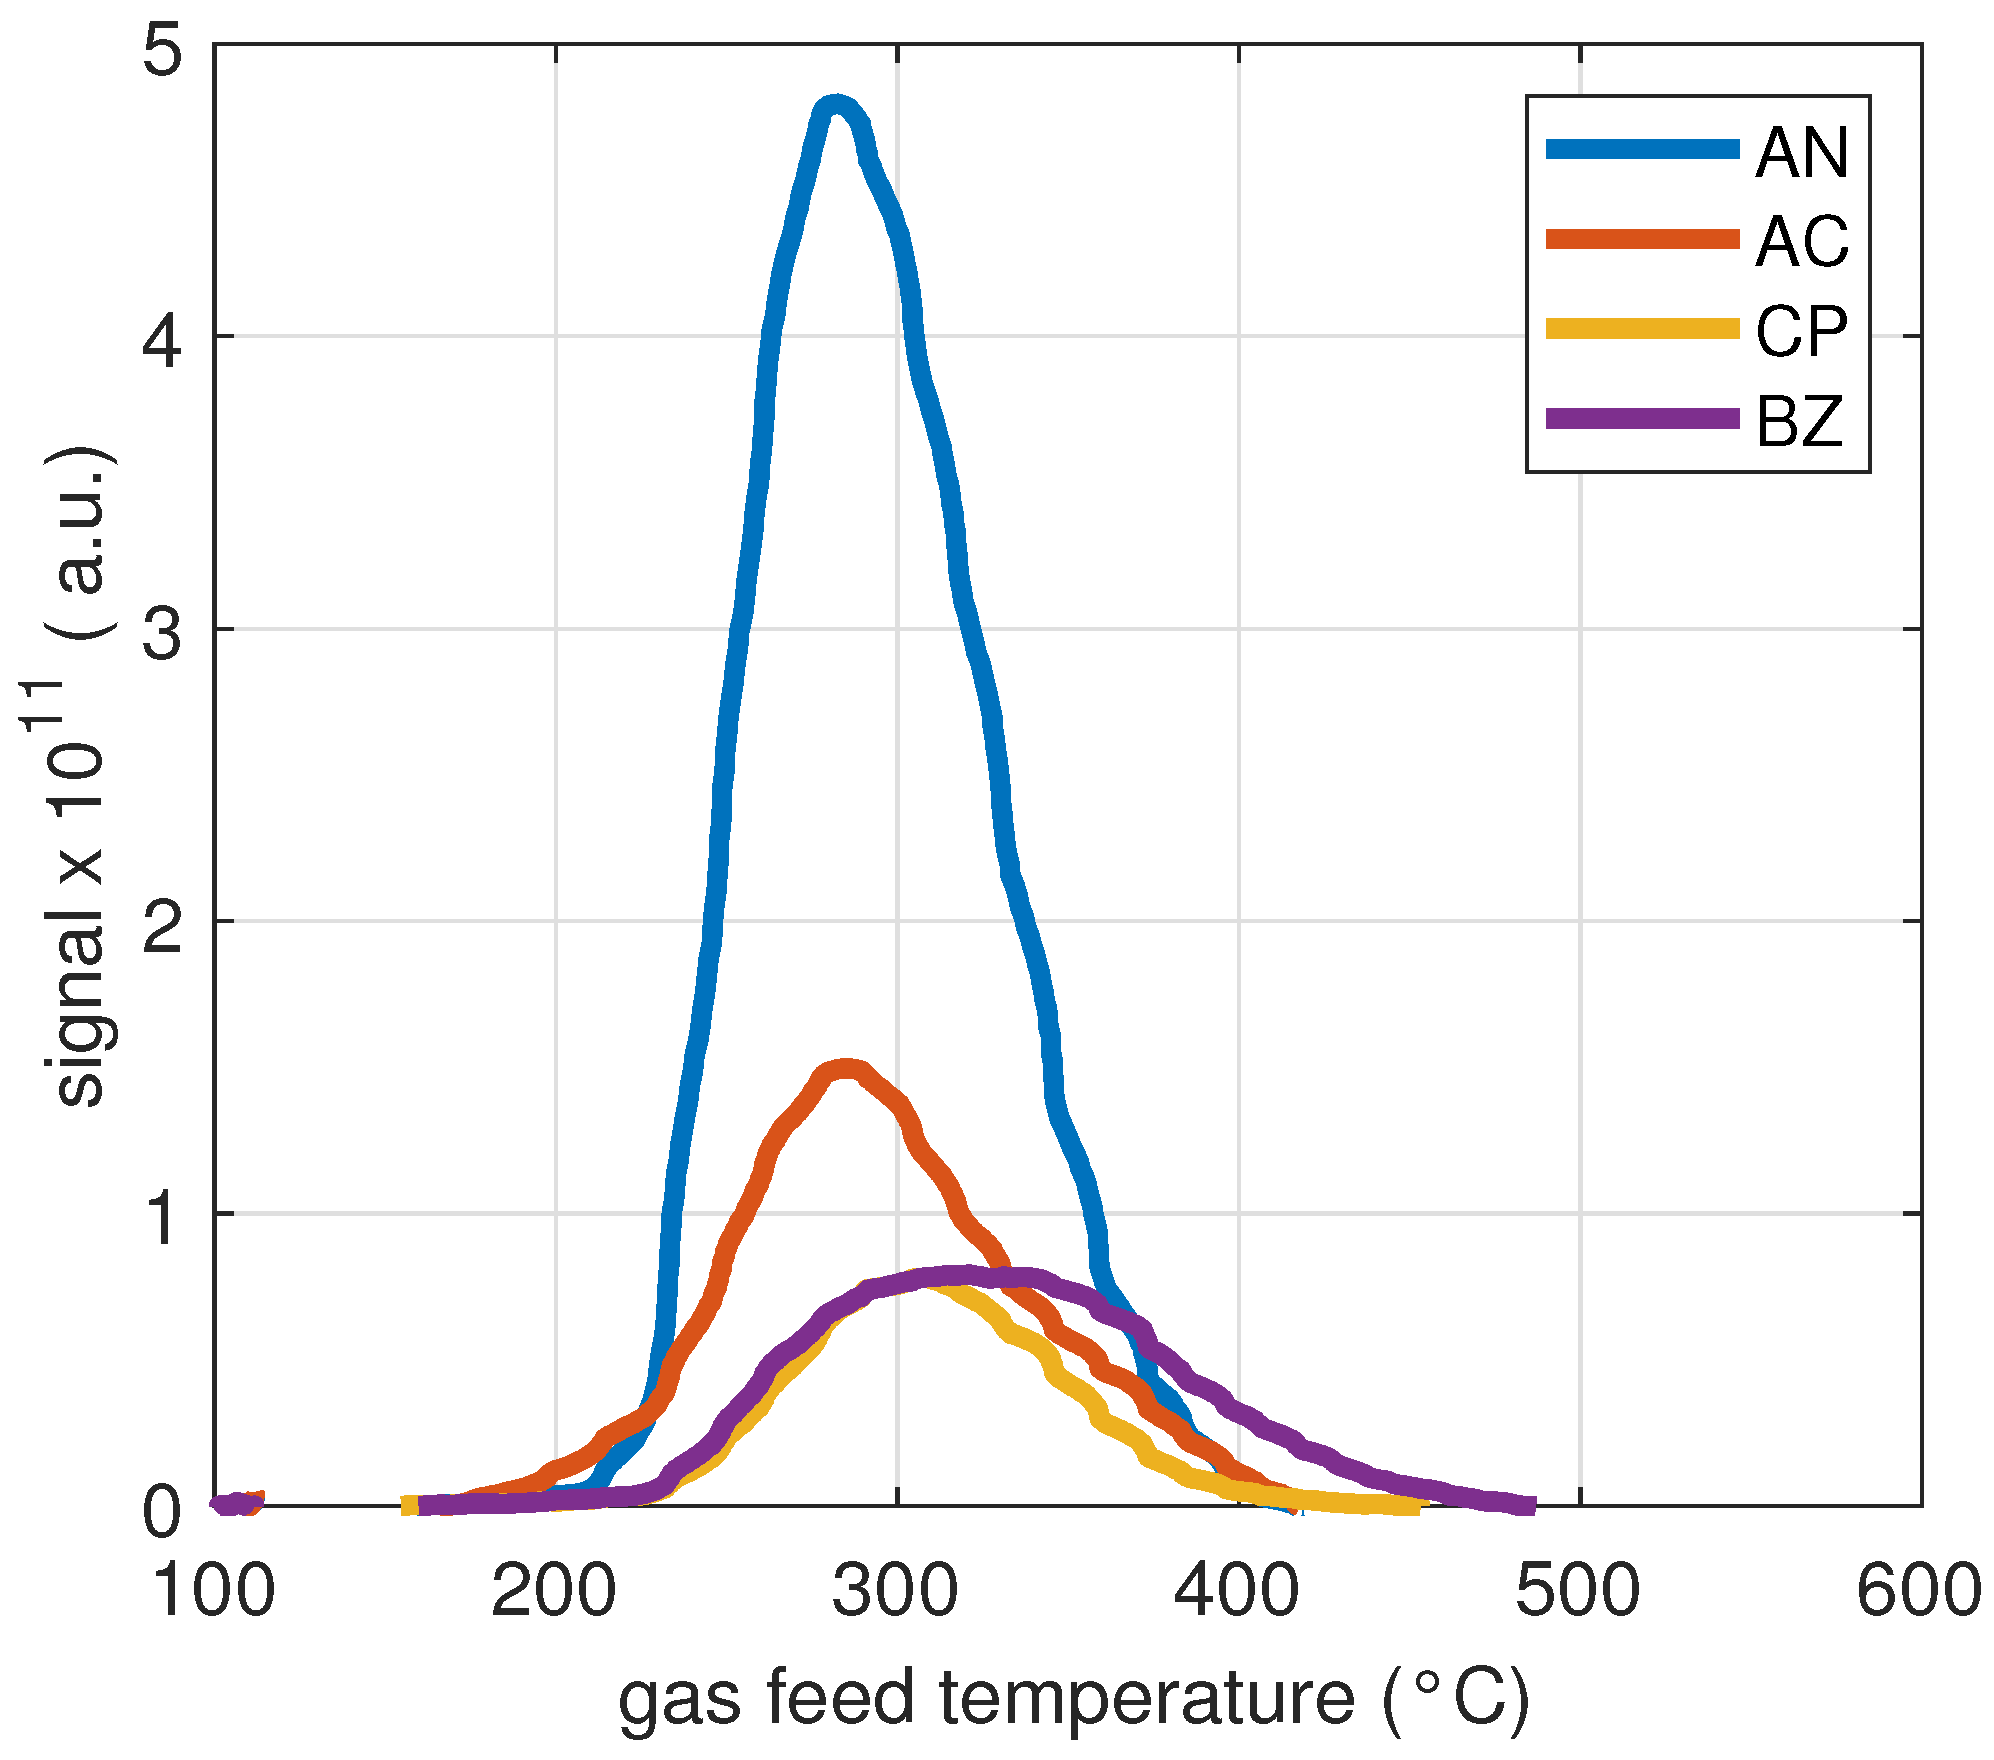
2.4. VOCs Emissions Analysis during a Light-Off Experiment

The VOCs emissions were measured on-line by MIMS during a light-off experiment in R37 conditions. Figure 5 shows that most of the VOCs were emitted between 220 °C and 400 °C with a peak at around 280 °C, temperature which corresponds to the tipping point between the two temperature domains of the TWC activity (see also Figure 2). In this temperature range, TWC activates CO, NO, and propene. Acetone, nitriles (acrylonitrile and cyanopropene) and benzene were identified downstream the TWC (Figure 5). Acrylonitrile and acetone behave as N2O as they were formed from 200 °C, and reached a maximum at 280 °C. As N2O, they could be some by-products of the NO reduction. On the other hand, the emissions of cyanopropene and benzene were found to start from 220–230 °C, together with the activation of propene. Emissions of benzene took place in a broader temperature window until 500 °C. As already discussed, the H2 formed from 300 °C via the propene steam reforming can reduce NO to produce NH3 from 350 °C (8). Both concentrations of H2 and N2O were maximal at 550 °C. PTR-MS analysis also confirmed the drop of the VOCs emissions above 400 °C. Nevertheless, a small amount of acetonitrile and propanenitrile were still measured at 500 °C.
Our results clearly evidence the emission of nitrile compounds between 200 °C and 400 °C, especially under dry conditions (Figure 4). Acetonitrile and acrylonitrile behave similarly, mainly produced in dry conditions whereas methylacrylonitrile can be formed in both dry and wet mixtures. Nitriles’ formation correlates with N2O formation. It could be due to the ammoxidation of propene or propane over the catalysts. The reaction is a partial oxidation phenomenon (12):
CH 2 CHCH 3 + 3 2 O 2 + N 2 O CH 2 CHCN + 3 H 2 O
Propene ammoxidation, according to reaction (12), is a well-known process used to produce acrylonitrile at the industrial level on mixed oxide catalysts (SOHIO process) using, for the vast majority, a bismuth molybdate catalyst [24,25]. By-products such as acrolein and HCN are formed as well depending on the conversion levels (directly from propene or from main by-products) [25]. Cerium oxides in the TWC could act as Mo-based oxides, but in a less efficient way when considering acrylonitrile formation (12). Moreover, as the reaction needs O2 and NH3, it can only occur at intermediate temperatures (below the tipping point), where some oxygen is still available. This indicates that small concentrations of NH3 could be also formed in the low-temperature domain.
HCN, which was identified in the exhaust by PTR-MS, is a known product of rich conditions in gasoline vehicles [10,16,26,27]. It has been detected at concentration up to 5 ppbv in urban areas [27,28]. Baum et al. [10] have investigated the emissions of 14 light duty vehicles in the cold start period and have observed a moderate correlation with NO and CO identifying reaction (13) as a probable reaction path.
NO + CO + 5 2 H 2 HCN + H 2 O
This reaction requires higher temperatures, explaining the higher concentration observed for HCN at 400 °C compared to 280 °C by PTR-MS analysis. The presence of HCN in the exhaust of the mini-TWC could then be due to reaction (13).
Acetone, as well as acrolein, is emitted in the temperature range where oxygen is not totally depleted (200 °C–400 °C), propene is only partly converted, and before propane activation. Acrolein is a well-known product of the propene partial oxidation on metal oxides catalysts [29]. Therefore, acrolein was probably formed by the partial oxidation of propene on the catalytic washcoat, via a first H-abstraction followed by an O-addition [29]. Acetone could be formed from the reduction of propanol [30], which has been clearly identified in our system. Propanol was most likely produced by water addition on the propene molecules. That reaction path would explain the tremendous influence of the water addition on the formation of acetone observed in our experiment. In a similar manner, as observed in the PTR-MS experiments, acetaldehyde formation is promoted at low temperatures in humid conditions. Studies on gasoline engines showed the formation of acetaldehyde entirely due to the catalyst, in a 3-zone monolith catalyst [12].

3. Materials and Methods

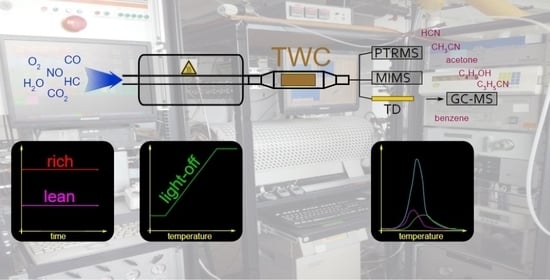
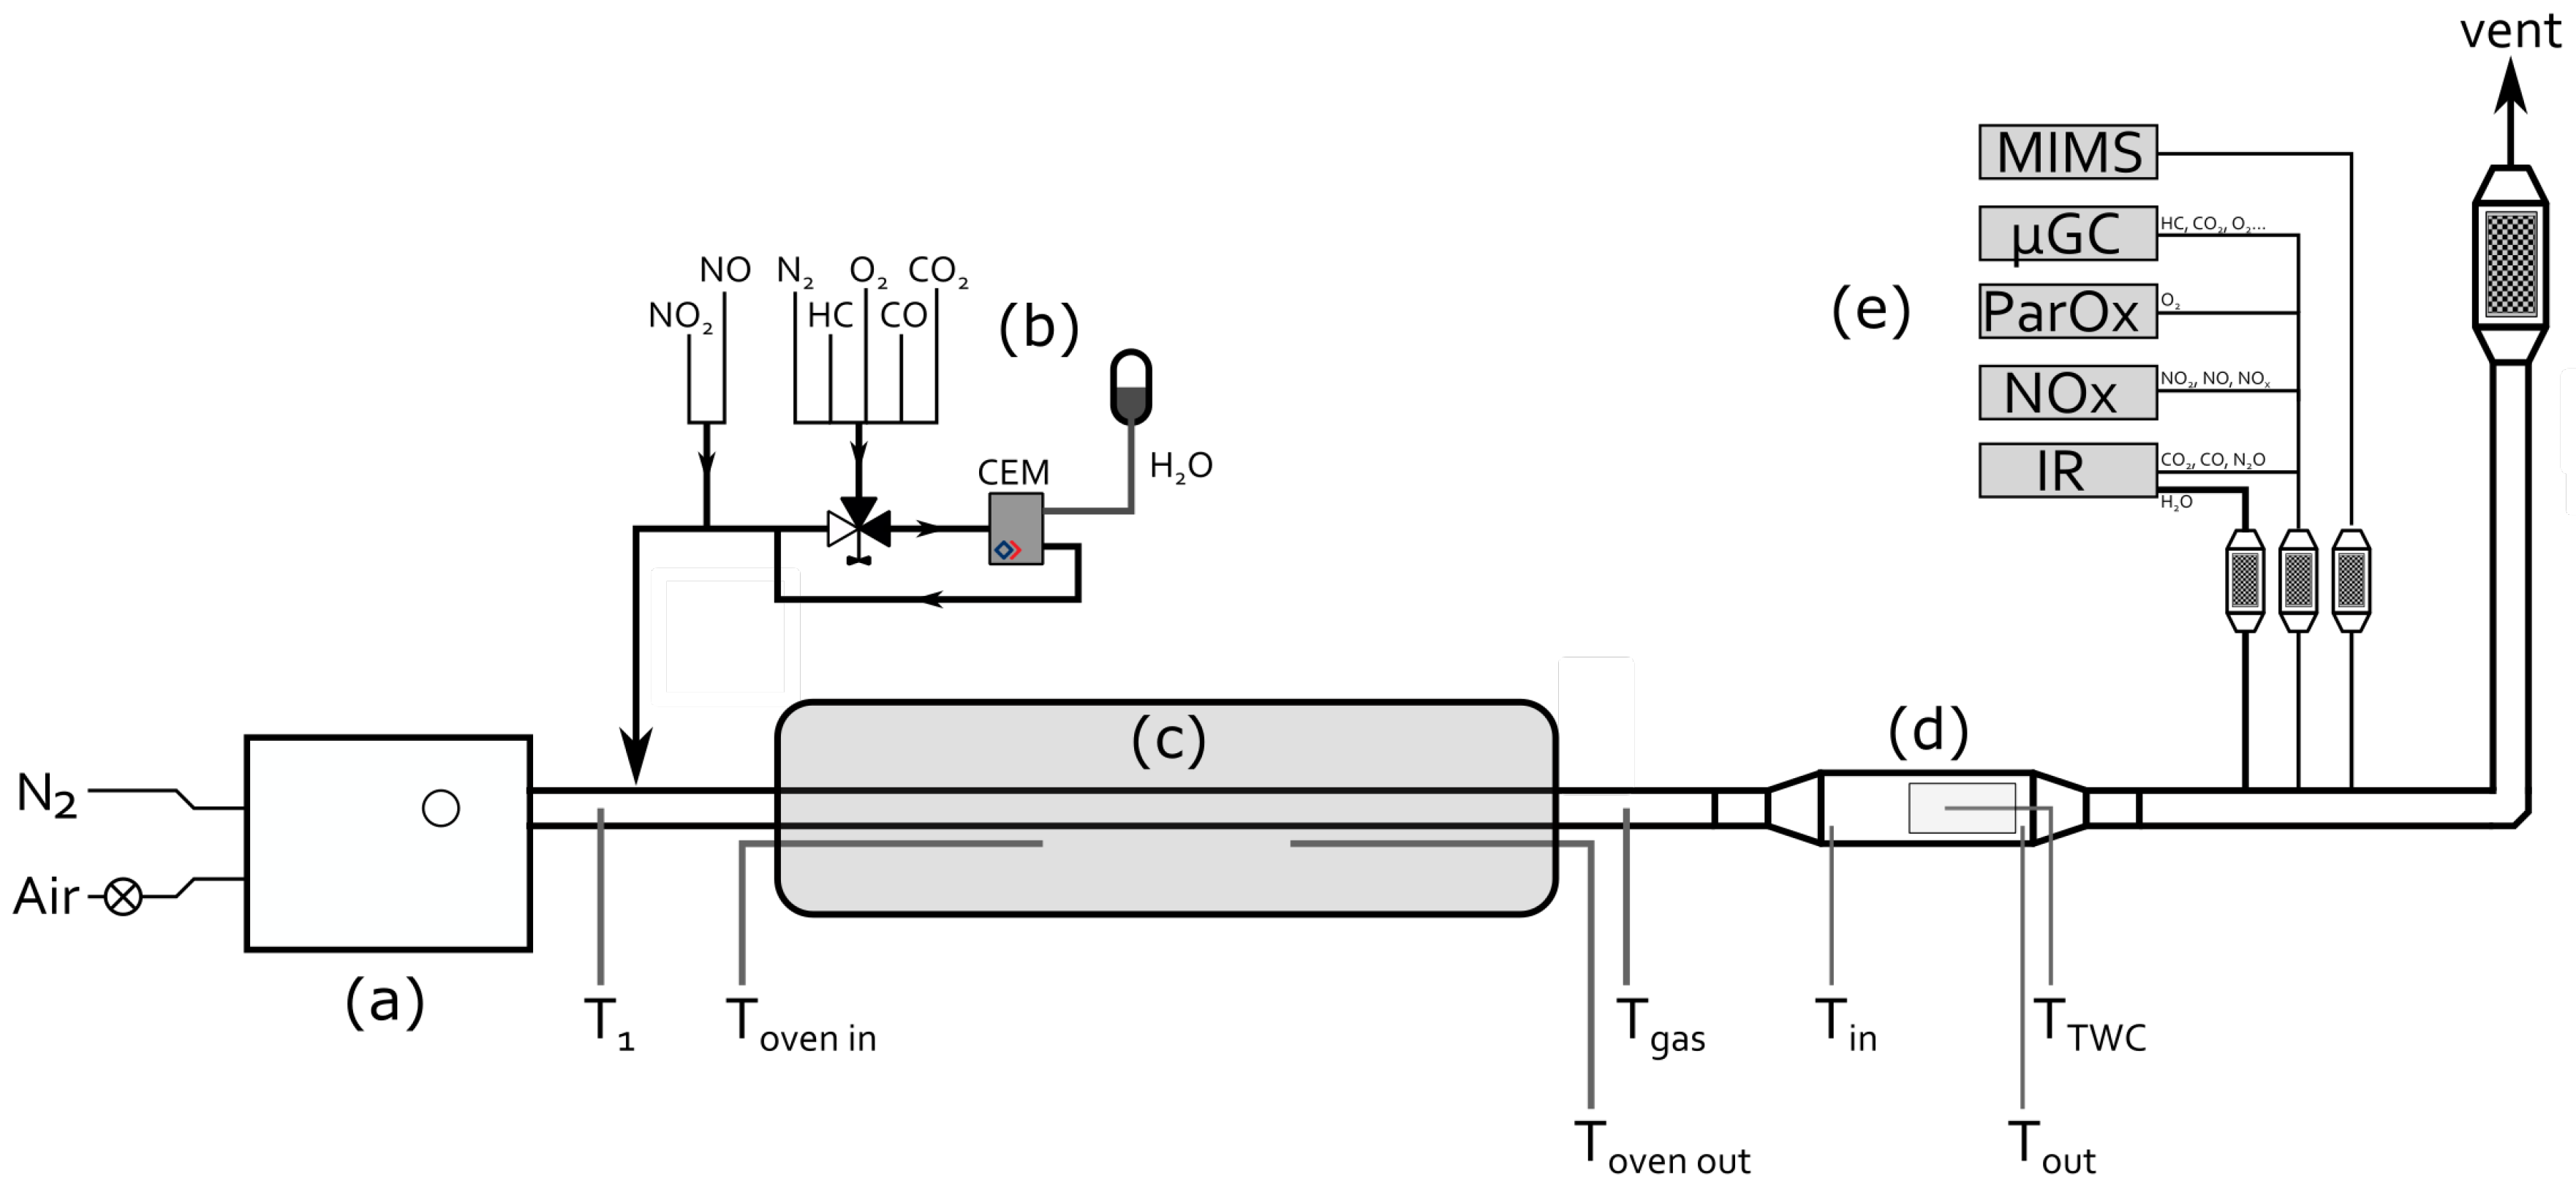
3.1. Synthetic Gas Bench and Reactor

A synthetic gas bench (SGB) was used to study the formation of VOCs downstream a commercial mini-TWC ( 1 × 2 inch ). The SGB is composed of 5 modules (Figure 6): (i) nitrogen stream; (ii) a gas mixing system to mimic a gasoline exhaust; (iii) a temperature-controlled tubular oven; (iv) a reactor to hold the TWC; (v) an analytical system including on-line analyzers. The SGB is described in detail elsewhere [18,31].
A N2 main stream (air products, from a tank of pure liquid N2) was maintained at 14 NL min−1 during the experiments by a mass flowmeter (Bronkhorst France, Montigny les Cormeilles, France) and was circulated through a 1-inch diameter stainless steel tube (Figure 6a). A secondary line (Figure 6b) equipped with a series of mass flowmeters (Bronkhorst France, Montigny les Cormeilles, France) monitored by a common LabView software was used to add CO2 (Linde, 99.995% purity), CO (Messer, 5% in N2, 99.995% purity), NO (Messer, 10.6% in N2, 99.995% purity), C3H6/C3H8 (Linde, 75%/25%, 99.995% purity) and O2 (Air liquide, 99.995% purity) into the main nitrogen stream. All these gases were mixed before their introduction into the main N2 stream. Furthermore, a controlled concentration of water vapor can be added in this line via a controlled evaporator and mixer system (CEM, Bronkhorst France, Montigny les Cormeilles, France). All the lines placed downstream of the CEM were heated to avoid condensation problems at a temperature above 100 °C. Moreover, the NO gas line was introduced in the reaction mixture after the CEM to avoid the formation HNO2 or HNO3. This secondary line was mixed with the main N2 stream to achieve a total constant flow of 20 NL min−1. Concentrations for rich and lean conditions are detailed in Table 2. Rich/lean gas mixtures correspond to the control in the secondary line of 1.4 NL min−1 of CO2, 2.4/1.6 NL min−1 of CO, 2.4 NL min−1 of NO line, 1.8 NL min−1 of C3H6/C3H8, 0.08/0.2 NL min−1 of O2 and of a convenient flow of N2 to maintain constant the overall flow of this secondary line at 6 NL min−1.
Gas mixtures were preheated in a tubular oven (Thermoconcept, Merignac, France). A stainless-steel reactor (Figure 6d) was used to fix a commercial mini-TWC (size: 1 in × 2 in , volume: 24.5 cm3). This small volume allows to reach a space velocity of around 50,000 h−1 for an overall flow of 20 NL min−1, representative of real gasoline exhausts although in the lower range of real values. The reactor was placed downstream of the tubular oven, inside an isolated chamber filled with quartz wool. The temperature was controlled by a retrofitted closed-loop control system which regulated the temperature at the exit of the oven (inlet of the reactor) up to 700 °C (1000–1100 °C inside the oven). The inlet and outlet of the reactor were cone-shaped to homogenize the gas distribution across the mini-TWC. Before being placed in the reactor, the mini-TWC was wrapped in a vermiculite-coated fibre mat which provided insulation and prevented gas by-pass. Once the sample was introduced in the reactor, it was calcined at 700 °C for 4 h to trigger the thermal expansion of the fibres mat and keep it firmly in place during operation.
The mini-TWC was drilled from a commercial cordierite TWC honeycomb (size: 4.33 in × 4.9 in ), volume: 1.19 L, density: 400 cpsi, channel wall thickness: 109 µm (4.3 mil)) coating with a catalytic washcoat composed of Pd and Rh (PGM loading = 30 g ft 3 , Pd/Rh weight ratio = 5) supported on γ -Al2O3 and a ceria-zirconia mixed oxide. The mass of Pd and Rh inside the mini-TWC was 21.6 and 4.3 mg, respectively.
Temperature of the experimental set-up was controlled with a set of K thermocouples. Gas stream temperature was also controlled at the exit of the oven ( T o v e n ), before the reactor ( T i n ), after the reactor ( T o u t ), and inside the mini-TWC ( T T W C ), approximately in the middle of the TWC using a miniature thermocouple (0.25 mm OD).

3.2. Analyzers

Multiple online and offline analyzers were combined to identify VOCs produced by the mini-TWC. An IR analyzer (XStream, Emerson Process Management GmbH, Hasselroth, Germany) was used to on-line monitor CO2, CO, N2O and H2O. Nitrogen oxides (NO, total NO x and NO2) were measured thanks to a chemiluminescence analyser (Ecophysics, Duerten, Switzerland). A paramagnetic analyzer was used for the continuous measurement of oxygen above 0.1% (Parox 2000, FoxSense, Opfikon, Switzerland). All analyzers give results under 10 s. A delayed time response of 8.4 min was observed for the chemiluminescence analyzer due to the sampling. Moreover, a micro-GC (SRA instruments) equipped with a Molecular Sieve column (5 Å, 10 m) and a Poraplot Q column (10 m) was used to simultaneous analyze small hydrocarbons (C2–C3) and CO2 on the first column and O2 and CO on the second column with a frequency of around 3 min.

3.3. Mass Spectrometry Analysis

Mass spectrometry methods were used to obtain insights in the VOCs emissions of TWC contrary to previous studies on the same SGB [18,31]. Three complementary types of mass spectrometers have been deployed: a proton transfer reaction mass spectrometer (PTR-TOF-MS) (Ionicon, Innsbrück, Austria), a membrane inlet mass Spectrometer (MIMS) for real-time analysis, and a thermodesorption GC-MS (TD-GC-MS) for more exhaustive analysis over a longer time scale. All conditions are summarized in Table 3. All signals are reported in arbitrary units and represent qualitative results as our goal was to identify the emitted VOCs. It has to be noted that VOCs analysis were not performed with an ultra-high temporal evolution but give a mean image of the evolution of the TWC emissions at the scale of few seconds. In this time lapse, observed species were sufficiently stable to be considered as formed during the catalytic process.
As the concentrations of pollutants fed in the TWC were in the range of hundreds of ppm, the reaction mixture was diluted by a factor 100 by a diluting system (VKL100, Palas GMBH, Karlsruhe, Germany) before analysis in the PTR-TOF-MS. This dilution was necessary to maintain the total VOC concentration well below the ppm level, to avoid depletion of the H3O+ precursor signal used for proton transfer reaction. For the same reason, hydrocarbons and oxygen concentrations had to be decreased at 312 ppm for C3H6 and 0.11% for O2. PTR-TOF-MS analysis were then performed in these alternative rich conditions, with or without H2O (3%). The inlet temperature ( T i n ) was increased step-wise and maintained constantly for at least 20 min in order to accumulate data at 150 °C, 280 °C, 400 °C, 500 °C, and 670 °C. Full scans 0–200 u were processed.
The MIMS analyser has already been described elsewhere [32,33]. Briefly, a semi-permeable membrane, generally in silicone, separates the gas stream from the mass spectrometer’s vacuum. VOCs flow through the membrane due to a pervaporation process. The use of a silicon membrane implies a higher selectivity for apolar species, hence concentrating them and improving their detection. In this series of experiments, the silicon membrane was 125 µm thick and sandwiched between two plates where a 1.5 mm × 4 cm channel transfer the gas stream of the sample on one side and the vacuum gas on the other side [33]. The latter is directly connected to the EI source of a quadrupole (Prisma Plus, Pfeiffer Vacuum, Germany). MIMS set-up was connected in the outlet stream of the TWC.
Ex situ analysis were conducted as well, using a thermodesorption based instrument (Perkin Elmer TurboMatrix 650). Specific tubes were used to collect and accumulate pollutants before their desorption in a GC-MS (Agilent Technologies 6890 and 5973). A pump placed downstream the reactor was used to deliver a constant flow of 120 mL min−1 inside the thermodesorption tube for 1 h. Pollutants were collected under rich conditions, with (3%) or without humidity. Two gas temperatures were tested: 280 °C, near the maximum of N2O production, and 400 °C where propane starts to react. Adsorbents used were Tenax and Carbotrap-carbosieve. Tenax is commonly used for VOC applications, although C2-C3 HCs are not well adsorbed on this material. Carbotrap-carbosieve, on the contrary, adsorbs light-weighted molecules. The thermodesorption tubes were desorbed at 250 °C for 15 min at a flow rate of 20 mL min−1 and analyzed on a GC-MS. The same tube was subjected to further desorption cycles until the chromatogram presented no remaining species.

3.4. Light-Off Experiments

The emissions of the commercial mini-TWC were measured along standard light-off (LO) protocols. Before the introduction of the different gas mixtures, the pre-heating oven was heated at 120 °C ( T o u t ) for at least 1 h to avoid any water condensation in the pipes. LO were performed from 150 °C up to 650 °C ( T i n ) with a heating ramp of 200 °C h 1 , followed by a plateau at 700 °C for 20 min. At this point, flows of HC, CO, CO2, H2O and NOx were stopped, and finally O2 was added with a constant flow of 20 NL min−1. Then, the sample was cooled-down to room temperature in air (20 NL min−1). LO were conducted in different reactive mixtures denoted RXY or LXY where R and L correspond to rich and lean mixtures, while X and Y are linked, respectively, to the percentage of water and CO2 in the stream. For instance, R37 corresponds to a rich reactive mixture containing 3% of H2O and 7% of CO2.
All emitted pollutants were monitored by different instruments which present various sampling times. Therefore, all recorded data have been linearly interpolated to the same timeline using a Matlab macro. Conversion X (in %) of each pollutant (CO, NO, C3H6, C3H8) and O2 were calculated with Equation (14):
X ( % ) = C 0 C d o w n s t r e a m ( T ) C 0
where C d o w n s t r e a m is the concentration of the studied compound downstream the TWC at a given T i n temperature during the LO and C 0 the concentration upstream of the TWC for the temperature T i n of the inlet temperature as measured at the beginning of the LO experiment.

4. Conclusions

This study describes the analysis of VOCs emissions downstream a commercial mini-TWC exposed to a simple mix of exhaust gases (CO, NO, H2O, CO2, O2, and two C3-hydrocarbons). Light-off experiments between 150 °C and 650 °C highlighted the influence of humidity and CO2 on the TWC catalytic performances. In particular, CO2 was found to activate propane via the dry reforming while H2O strongly promoted the water–gas shift reaction.
N2O formation was evidenced in all different studied conditions (lean or rich) with a maximal concentration of around 60 ppm at 280 °C. Despite the fact that lean conditions presented a smaller maximal concentration compared to rich conditions, the total emitted amount of N2O was equivalent in both conditions as its formation was extended in the temperature range for lean conditions. In addition, our results indicate that the addition of H2O and CO2 in the stream promotes the production of N2O.
Real-time MS and TD-GC-MS analysis have been conducted to identify the emitted VOCs, both in isothermal conditions and light-off conditions. Mass spectrometry techniques enabled identifying a large number of VOCs among carbonylated (acetone, acetaldehyde, acroleine), nitriles (acetonitrile, propanenitrile, acrylonitrile, cyanopropene), and aromatic (benzene, toluene) families. Nitriles were more concentrated under dry conditions, whereas carbonylated species were present in wet conditions. Most of the VOCs were emitted between 200 °C and 400–500 °C with maximal levels at 280–300 °C, corresponding to the tipping point of the TWC activity according to the residual oxygen concentration in the feed. Some aromatic compounds were also observed, such as benzene, which was more concentrated, while toluene, xylene, styrene and even naphthalene were also identified. Furthermore, in humid conditions as encountered in real exhausts, many other higher mass compounds were identified such as esters (from propanoic or acetic acid), benzonitriles, pyridines derivatives, phenols derivatives, acetophenone, etc. Growth mechanism from propene and to a lesser extend propane are most likely responsible for the formation of these higher aromatic compounds.
In conclusion, the coupling of a synthetic gas bench to real-time mass spectrometric analyses provided a new insight on TWC reactivity. This unique set-up make it clear that complex chemistry is occurring on and downstream the TWC, leading to the formation and growth of higher mass compounds such as aromatics from C3-molecules. These high mass compounds could be further oxidized once emitted in the atmosphere to form secondary organic aerosols. Finally, our work demonstrate that reactivity on TWC represents a potential formation route of many toxic compounds found in the exhaust fumes. When the engine starts (as the temperature is low) and when it accelerates (as rich conditions are present), the emission are high with formation of nitriles, ketones, and aromatics that are not only due to unburnt hydrocarbons. Implementing efficient TWC should then take into consideration its reactivity towards the formation of VOCs.

Author Contributions

Conceptualization, E.L., C.G., and P.V.; methodology, E.L., A.B., and G.R.; validation, E.L. and G.R.; formal analysis, E.L. and G.R.; investigation, E.L. and A.B.; resources, P.V. and C.G.; data curation, E.L.; writing—original draft preparation, E.L.; writing—review and editing, P.V., G.R., A.B. and C.G.; visualization, E.L.; supervision, P.V. and E.L.; project administration, E.L.; funding acquisition, P.V. and C.G. All authors have read and agreed to the published version of the manuscript.

Funding

This research was supported by the French National Scientific Research Center CNRS fellowship for E.L. to work for two years at IRCELYON.

Data Availability Statement

Data are available upon demand to the corresponding author.

Acknowledgments

The authors would like to acknowledge Mickael Helali (ENS Lyon) for his help in the preliminary work done during a 2-month undergraduate studies traineeship. Rulan Verma and Sébastien Perrier are thanked for the installation and demonstration of the PTR-MS use.

Conflicts of Interest

The authors declare no conflict of interest.

Abbreviations

The following abbreviations are used in this manuscript:
TWCThree-Way Catalyst
VOCVolatile Organic Compound
SGBSynthetic Gas Bench
MIMSMembrane Inlet Mass Spectrometry
PTR-MSProton Transfer Reaction Mass Spectrometry
TD-GC-MSThermoDersorption-Gas Chromatrography-Mass Spectrometry
LOLight-off

References

  1. Suarez-Bertoa, R.; Lähde, T.; Pavlovic, J.; Valverde, V.; Clairotte, M.; Giechaskiel, B. Laboratory and On-Road Evaluation of a GPF-Equipped Gasoline Vehicle. Catalysts 2019, 9, 678. [Google Scholar] [CrossRef] [Green Version]
  2. Martinet, S.; Liu, Y.; Louis, C.; Tassel, P.; Perret, P.; Chaumond, A.; André, M. Euro 6 Unregulated Pollutant Characterization and Statistical Analysis of After-Treatment Device and Driving-Condition Impact on Recent Passenger-Car Emissions. Environ. Sci. Technol. 2017, 51, 5847–5855. [Google Scholar] [CrossRef] [Green Version]
  3. Clairotte, M.; Adam, T.W.; Chirico, R.; Giechaskiel, B.; Manfredi, U.; Elsasser, M.; Sklorz, M.; DeCarlo, P.F.; Heringa, M.F.; Zimmermann, R.; et al. Online characterization of regulated and unregulated gaseous and particulate exhaust emissions from two-stroke mopeds: A chemometric approach. Anal. Chim. Acta 2012, 717, 28–38. [Google Scholar] [CrossRef]
  4. Shelef, M.; McCabe, R.W. Twenty-five years after introduction of automotive catalysts: What next? Catal. Today 2000, 62, 35–50. [Google Scholar] [CrossRef]
  5. Rood, S.; Eslava, S.; Manigrasso, A.; Bannister, C. Recent advances in gasoline three-way catalyst formulation: A review. Proc. Inst. Mech. Eng. Part D J. Automob. Eng. 2020, 234, 936–949. [Google Scholar] [CrossRef]
  6. Reiter, M.S.; Kockelman, K.M. The problem of cold starts: A closer look at mobile source emissions levels. Transp. Res. Part D Transp. Environ. 2016, 43, 123–132. [Google Scholar] [CrossRef] [Green Version]
  7. Glorennec, P.; Bonvallot, N.; Mandin, C.; Goupil, G.; Pernelet-Joly, V.; Millet, M.; Filleul, L.; Le Moullec, Y.; Alary, R. Is a quantitative risk assessment of air quality in underground parking garages possible? Indoor Air 2008, 18, 283–292. [Google Scholar] [CrossRef]
  8. Lee, J.; Theis, J.R.; Kyriakidou, E.A. Vehicle emissions trapping materials: Successes, challenges, and the path forward. Appl. Catal. B Environ. 2019, 243, 397–414. [Google Scholar] [CrossRef]
  9. Getsoian, A.B.; Theis, J.R.; Lambert, C.K. Sensitivity of Three-Way Catalyst Light-Off Temperature to Air-Fuel Ratio. Emiss. Control Sci. Technol. 2018, 4, 136–142. [Google Scholar] [CrossRef]
  10. Baum, M.M.; Moss, J.A.; Pastel, S.H.; Poskrebyshev, G.A. Hydrogen Cyanide Exhaust Emissions from In-Use Motor Vehicles. Environ. Sci. Technol. 2007, 41, 857–862. [Google Scholar] [CrossRef]
  11. Poulopoulos, S.G.; Samaras, D.P.; Philippopoulos, C.J. Regulated and speciated hydrocarbon emissions from a catalyst equipped internal combustion engine. Atmos. Environ. 2001, 35, 4443–4450. [Google Scholar] [CrossRef]
  12. Hasan, A.O.; Abu-jrai, A.; Al-Muhtaseb, A.H.; Tsolakis, A.; Xu, H. Formaldehyde, acetaldehyde and other aldehyde emissions from HCCI/SI gasoline engine equipped with prototype catalyst. Fuel 2016, 175, 249–256. [Google Scholar] [CrossRef]
  13. Schmitz, T.; Hassel, D.; Weber, F.J. Determination of VOC-components in the exhaust of gasoline and diesel passenger cars. Atmos. Environ. 2000, 34, 4639–4647. [Google Scholar] [CrossRef]
  14. Hata, H.; Okada, M.; Funakubo, C.; Hoshi, J. Tailpipe VOC Emissions from Late Model Gasoline Passenger Vehicles in the Japanese Market. Atmosphere 2019, 10, 621. [Google Scholar] [CrossRef] [Green Version]
  15. Nandi, S.; Arango, P.; Chaillou, C.; Dujardin, C.; Granger, P.; Laigle, E.; Nicolle, A.; Norsic, C.; Richard, M. Relationship between design strategies of commercial three-way monolithic catalysts and their performances in realistic conditions. Catal. Today 2022, 384–386, 122–132. [Google Scholar] [CrossRef]
  16. Keirns, M.H.; Holt, E.L. Hydrogen Cyanide Emissions from Three-Way Catalyst Prototypes under Malfunctioning Conditions. SAE Trans. 1978, 87, 815–827. [Google Scholar] [CrossRef]
  17. Jang, J.; Lee, J.; Choi, Y.; Park, S. Reduction of particle emissions from gasoline vehicles with direct fuel injection systems using a gasoline particulate filter. Sci. Total Environ. 2018, 644, 1418–1428. [Google Scholar] [CrossRef]
  18. Lopez-Gonzalez, D.; Tsampas, M.N.; Boréave, A.; Retailleau-Mevel, L.; Klotz, M.; Tardivat, C.; Cartoixa, B.; Pajot, K.; Vernoux, P. Mixed Ionic–Electronic Conducting Catalysts for Catalysed Gasoline Particulate Filters. Top. Catal. 2015, 58, 1242–1255. [Google Scholar] [CrossRef]
  19. Ravishankara, A.R.; Daniel, J.S.; Portmann, R.W. Nitrous Oxide (N2O): The Dominant Ozone-Depleting Substance Emitted in the 21st Century. Science 2009, 326, 123–125. [Google Scholar] [CrossRef] [Green Version]
  20. Davidson, E.A.; Kanter, D. Inventories and scenarios of nitrous oxide emissions. Environ. Res. Lett. 2014, 9, 105012. [Google Scholar] [CrossRef]
  21. Dasch, J.M. Nitrous Oxide Emissions from Vehicles. J. Air Waste Manag. Assoc. 1992, 42, 63–67. [Google Scholar] [CrossRef]
  22. Srinivasan, A.; Depcik, C. Review of Chemical Reactions in the NO Reduction by CO on Rhodium/Alumina Catalysts. Catal. Rev. 2010, 52, 462–493. [Google Scholar] [CrossRef]
  23. Buhr, K.; van Ruth, S.; Delahunty, C. Analysis of volatile flavour compounds by Proton Transfer Reaction-Mass Spectrometry: Fragmentation patterns and discrimination between isobaric and isomeric compounds. Int. J. Mass Spectrom. 2002, 221, 1–7. [Google Scholar] [CrossRef]
  24. Brazdil, J.F. A critical perspective on the design and development of metal oxide catalysts for selective propylene ammoxidation and oxidation. Appl. Catal. A Gen. 2017, 543, 225–233. [Google Scholar] [CrossRef]
  25. Giordano, N.; Bart, J. On the mechanism of ammoxidation of propene over cerium-doped bismuth molybdate catalysts. Recl. Des Trav. Chim. Des Pays-Bas 1975, 94, 28–30. [Google Scholar] [CrossRef]
  26. Karlsson, H.L. Ammonia, nitrous oxide and hydrogen cyanide emissions from five passenger vehicles. Sci. Total. Environ. 2004, 334–335, 125–132. [Google Scholar] [CrossRef]
  27. Moussa, S.G.; Leithead, A.; Li, S.M.; Chan, T.W.; Wentzell, J.J.B.; Stroud, C.; Zhang, J.; Lee, P.; Lu, G.; Brook, J.R.; et al. Emissions of hydrogen cyanide from on-road gasoline and diesel vehicles. Atmos. Environ. 2016, 131, 185–195. [Google Scholar] [CrossRef] [Green Version]
  28. You, Y.; Staebler, R.M.; Moussa, S.G.; Su, Y.; Munoz, T.; Stroud, C.; Zhang, J.; Moran, M.D. Long-path measurements of pollutants and micrometeorology over Highway 401 in Toronto. Atmos. Chem. Phys. 2017, 17, 14119–14143. [Google Scholar] [CrossRef] [Green Version]
  29. Adams, C.R.; Jennings, T.J. Investigation of the mechanism of catalytic oxidation of propylene to acrolein and acrylonitrile. J. Catal. 1963, 2, 63–68. [Google Scholar] [CrossRef]
  30. Zervas, E.; Montagne, X.; Lahaye, J. Emission of Alcohols and Carbonyl Compounds from a Spark Ignition Engine. Influence of Fuel and Air/Fuel Equivalence Ratio. Environ. Sci. Technol. 2002, 36, 2414–2421. [Google Scholar] [CrossRef]
  31. Lizarraga, L.; Souentie, S.; Boreave, A.; George, C.; D’Anna, B.; Vernoux, P. Effect of Diesel Oxidation Catalysts on the Diesel Particulate Filter Regeneration Process. Environ. Sci. Technol. 2011, 45, 10591–10597. [Google Scholar] [CrossRef]
  32. Davey, N.G.; Krogh, E.T.; Gill, C.G. Membrane-introduction mass spectrometry (MIMS). TrAC Trends Anal. Chem. 2011, 30, 1477–1485. [Google Scholar] [CrossRef]
  33. Louarn, E.; Hamrouni, A.; Colbeau-Justin, C.; Bruschi, L.; Lemaire, J.; Heninger, M.; Mestdagh, H. Characterization of a membrane inlet interfaced with a compact chemical ionization FT-ICR for real-time and quantitative VOC analysis in water. Int. J. Mass Spectrom. 2013, 353, 26–35. [Google Scholar] [CrossRef]
Figure 1. Conversion of CO, NO, O2 and HC (C3H6 and C3H8) and T T W C as a function of the inlet temperature ( T i n ) in different reactive mixtures: (a) R00: rich conditions without water and CO2; (b) R30: rich conditions with 3% H2O without CO2; (c) R37: rich conditions with water (3%) and CO2 (7%); and (d) L37: lean conditions with water (3%) and CO2 (7%).
Catalysts 13 00563 g001
Figure 2. MIMS real-time analysis during a light off in R37 rich conditions (R37) for H2 (m/z 2) and NH3 (m/z 17) relative signal (to their maximum). N2O and CO signals from IR analyzer are superimposed.
Catalysts 13 00563 g002
Figure 3. N2O formation (a) during light-off and (b) total formation for different light-off conditions: with no catalytic material (BLC); rich conditions without water and CO2 (R00); rich conditions with 3% H2O without CO2 (R30); rich conditions with water (3%) and CO2 (7%) (R37); and lean conditions with water (3%) and CO2 (7%) (L37).
Catalysts 13 00563 g003
Figure 4. Observed average signal of VOCs during an isothermal experiment at the maximum observed signal (280 °C) for R and R-H2O gas mixtures (HC: hydrocarbons m/z 41; AC: acetone; AN: acrylonitrile; CP: cyanopropene; BZ: benzene) for rich conditions in a wet (H2O 3%) or dry (H2O 0%) environment. Measurements were performed with a MS equipped with a membrane for MIMS analysis.
Catalysts 13 00563 g004
Figure 5. MIMS real-time analysis during a light off in R37 rich conditions (R37) for VOCs signals (AN: acrylonitrile, m/z 53; AC: acetone, m/z 58; CP: cyanopropene, m/z 67; BZ: benzene, m/z 78). N2O signal from IR analyzer is superimposed.
Catalysts 13 00563 g005
Figure 6. Synthetic gas bench (SGB) scheme: (a) nitrogen stream generator, (b) gas-lines mixing system (CO, NO, O2, CO2, HC) with a water evaporator (CEM), (c) pre-heating oven, (d) reactor with inserted TWC, (e) analyzers (MIMS: membrane inlet mass spectrometer; µGC: micro gas chromatograph; ParOx: paramagnetic oxygen analyzer; NOx: Chemiluminescence (two inlets) NO, NO2, NOx analyzer; online IR (heated line) infrared analyzer for CO, N2O, CO2, H2O. Temperature and flowmeter are controlled by a LabView software.
Catalysts 13 00563 g006
Table 1. Observed inlet temperature ( T i n in °C) for 10% ( T 10 % ) and 50% ( T 50 % ) conversion. Temperature values have an estimated variability of σ = 10 °C.
CONOC3H6C3H8O2
T 10 % T 50 % T 10 % T 50 % T 10 % T 50 % T 10 % T 50 % T 10 % T 50 %
R00231260243299257351462535228260
R30231254242286252335433566230255
R37217246235282246330396457214247
L37215250257-245257299402242260
Table 2. Experimental conditions for rich and lean experiments. They are denominated in the text and figures as “RXY” or “LXY” for, respectively, rich (R) and lean (L) conditions with a concentration of X% of H2O and Y% of CO2. Alternative conditions are used for PTR-MS analysis (see text for description).
RichLean
O20.4%1%
CO6000 ppm4000 ppm
NO600 ppm600 ppm
C3H61125 ppm1125 ppm
C3H8375 ppm375 ppm
H2OX = 0% (dry) or 3% (wet)
CO2Y = 0% or 7%
Total flux20 NL  min−1 in N2
Table 3. Operating conditions for the mass spectrometric experiments.
MS Tech.SamplingDilutionGas ConditionsTemperature ( T i n )
MIMSDirect sampling through a semi-permeable membrane; response time <1 minnoRich and lean according to Table 2, in dry and wet conditionsRamp
PTR-MSDirect sampling; response time under seconds for one spectrum, but needs 20 min accumulation time in order to decrease detection limit × 100 Rich but with modified values of HC (C3H6: 312 ppm and C3H8: 104 ppm) and O2Stepwise increase of temperature: 150 °C, 280 °C, 400 °C, 500 °C, 670 °C
TD-GC-MSAdsorption on filled tube (Tenax or Carbotrap-carbosieve); adsorption time was 1 hnoRich according to Table 2, in dry and wet conditionsAt 300 °C and 400 °C
Disclaimer/Publisher’s Note: The statements, opinions and data contained in all publications are solely those of the individual author(s) and contributor(s) and not of MDPI and/or the editor(s). MDPI and/or the editor(s) disclaim responsibility for any injury to people or property resulting from any ideas, methods, instructions or products referred to in the content.

