Article

One-Pot Synthesis of Iron-Modified Zeolite X and Characterization of the Obtained Materials

by
Fabian N. Murrieta-Rico
1,*,
Joel Antúnez-García
2,
Rosario I. Yocupicio-Gaxiola
3,
Jonathan Zamora
4,5,
Armando Reyes Serrato
2 and
Vitalii Petranovskii
2
1
Ingeniería Mecatrónica, Universidad Politécnica de Baja California, Mexicali 21376, B.C., Mexico
2
Centro de Nanociencias y Nanotecnología, Universidad Nacional Autónoma de México, Ensenada 22800, B.C., Mexico
3
Tecnológico Nacional de México/Instituto Tecnológico Superior de Guasave, Carretera a Brecha Sin Número, Ejido Burrioncito, Guasave 81149, SIN., Mexico
4
Departamento de Ingeniería Metalúrgica, Facultad de Química, Universidad Nacional Autónoma de México, Ciudad de Mexico 04510, Mexico
5
Instituto Potosino de Investigación Científica y Tecnológica A.C., Camino a la Presa San José 2055, Col. Lomas 4ª Sección, San Luis Potosí 78216, S.L.P., Mexico
*
Author to whom correspondence should be addressed.
Submission received: 2 February 2023 / Revised: 15 July 2023 / Accepted: 19 July 2023 / Published: 27 July 2023

Abstract

:
Iron inclusion in the composition of the zeolite crystal structure endows it with new and useful properties. However, direct synthesis involving Fe, frequently creates unfavorable conditions that hinder the crystallization process and generate impurity phases. For this reason, novel methods, which include iron within the zeolitic matrix, are being sought out. This article presents a one-pot synthesis of iron-modified zeolite X. The resulting materials were characterized, and their textural, electrical, and magnetic properties were studied.

Graphical Abstract

1. Introduction

Zeolites are materials of undeniable importance in modern technology. They can be used as molecular sieves, ion exchangers, and catalysts, in sensor development, etc. Such applications are possible due to the characteristic distribution of pores and channels in each zeolite type, which provides a distinctive surface and active sites that contribute to the specific physicochemical properties.
Zeolites occur in nature or can be synthesized in the laboratory; however, in both cases, the composition of zeolites basically consists of Si and Al as structural elements of the crystalline framework and cations that compensate for the charge of the crystal structure, with Na as a rule [1]. In addition, the properties of zeolites can be tuned by isomorphous substitution of the framework Si and Al atoms by Ga, Fe, Ge, P, etc., and by replacement of exchangeable Na by ions of other chemical elements, such as Cu, Ag, Ca, and others.
In terms of stability, removing isomorphically substituted iron is more difficult than that introduced by ion exchange in the zeolite. On the other hand, iron by isomorphic substitution can only be found in tetrahedral form, while iron by ion exchange can be found forming different molecular complexes. This implies that the properties that the zeolite acquires by containing isomorphically substituted iron can be well determined and reproducible experimentally, contrary to what would occur with iron by ion exchange. Recent theoretical results have shown that isomorphic iron substitution in a zeolite can lead to different interesting magnetic properties, such as half-semiconductor behavior and half-conductor [2,3,4].
Iron-containing zeolites are important in industry as catalysts. Their characterization is difficult due to the large number of possible Fe-containing particles in the crystal lattice and/or pores of zeolites as well as their dependence on the preparation method. In this regard, various novel methods for modifying zeolites are under research. For example, in the work by Knops-Gerrits and Goddard III [5], nano-clusters of iron oxides were formed inside CFI, MOR, MFI, and CHA zeolites. Giacomo et al. [6] prepared Fe-silicalite by isomorphous substitution, which was used to oxidize glycerol to dihydroxyacetone. In the case of MFI zeolite, it was modified with Fe-based species to obtain catalysts for Fischer–Tropsch synthesis [7]. A detailed study of the evolution of iron-containing compounds in the HZSM-5 zeolite, depending on the iron sources used, is available in [8]. In addition, multifunctional zeolite Ga-Fe-MFI has been obtained by hydrothermal synthesis [9]. Compared with the ion-exchange Fe-containing MFI zeolite, the H-FeGaAl-MFI zeolite showed higher activity in the methanol-olefin reaction. The co-introduction of Ga compounds into the multi-heteroatomic structure of MFI increased the selectivity of this reaction towards light olefins, opening interesting prospects in the search for new catalysts. In general, MFI zeolite is among the five most widely used zeolites for a good reason: it has been the source of many catalysts.
The second important industrial material in this group is faujasite. The incorporation of iron (III) into the framework of SAPO-37, a silico-aluminophosphate material with a faujasite topology, was investigated [10]. Pure Fe-faujasite structures were obtained at a synthesis temperature of 180 °C. Iron replaces tetrahedrally coordinated aluminum in the structure. FeAPSO-37 is an active catalyst for the liquid phase oxidation of benzene and cyclohexane. Hydrothermally synthesized zeolite faujasite X (FAU-X) is an inexpensive and environmentally friendly inorganic carrier for environmental applications. After the introduction of iron, FAU-X-Fe is effective for extracting phosphates from wastewater treatment plants [11].
Fe-zeolites are widely used in petrochemistry, fine chemicals, environmental protection, and other catalytic fields due to the zeolite properties as well as redox properties provided by the introduction of Fe. After such modification of the zeolite frameworks, their properties can be effectively improved. The review in [12] briefly summarizes the latest developments in the field of synthesis, properties, and applications of Fe-zeolites. Although it is known that Fe (III) occurs in the tetrahedral positions of the framework, where it isomorphically replaces Al, or in extraframework octahedral positions in the form of free Fe(H2O)63+, the process of structural incorporation of Fe (III) into different sites is little known. A study on this topic has been published in [13]. It is important to note that the authors considered FeCl3 to be a widely used and inexpensive reactive among iron precursors.
The advantage of adding iron in synthesis over ion exchange involves several factors, and “new benefits” is only one, albeit the most important. The methods of iron incorporation into the composition of the crystal structure of zeolites during post-synthetic treatments occur through the generation of point defects in the structure and their subsequent “healing”. The direct addition of an iron impurity during synthesis leads to the formation of a more flawless crystal structure. However, even in the case of obtaining only ion-exchange iron-containing zeolites, a single-stage process, compared to a multi-stage one, is of great economic and environmental importance because it reduces energy consumption and creates a significantly smaller amount of wastewater that needs to be treated.
In general, heteroatom zeolites can be synthesized by two strategies, i.e., direct synthesis and post-synthesis. Existing synthesis methods are reviewed in [14]. In the direct synthesis method, Zr, Sn, Ga, Fe, Cr, Co, Mn, etc. heteroatoms are introduced into synthetic mixtures for producing zeolites in the form of organometallic compounds or solutions of metal salts as precursors. During hydrothermal synthesis, these precursors are introduced into the aluminosilicate sol, forming mixed sols of aluminosilicates and compounds with heteroatoms of introduced metals, which ensures their homogeneous dispersion. Of course, some compounds, especially organometallic and organic templates, are expensive and obviously limit the large-scale industrial use of the zeolites thus obtained.
In direct synthesis, nitrates, acetates, and chlorides are often used as a source of metal heteroatoms, but the crystallization process may be lengthy, and the number of heteroatoms included in the zeolite framework is limited. However, even a few heteroatoms will significantly affect the physicochemical properties and expand catalytic applications. In addition, the zeolite crystal structure and morphology may be optimized by controlling the synthesis conditions when using direct hydrothermal synthesis [14].
Although the literature regarding zeolites and iron is plentiful, unanswered questions remain about how iron is incorporated into the zeolitic matrix [15] and which synthesis conditions are necessary to obtain the desired properties. Further study of these topics will contribute to understanding the processes under diverse synthesis conditions and determining suitable applications for zeolites modified with iron based on their characteristic properties.
The present work aims to confirm the possibility of including iron in the composition of a zeolite X, discarding the use of organic templates, and using cheap precursors and low-temperature processes. The properties of the obtained materials, particularly their porosity, as well as electric and magnetic properties, can be used to evaluate the success of the synthesis method presented herein.

2. Results and Discussion

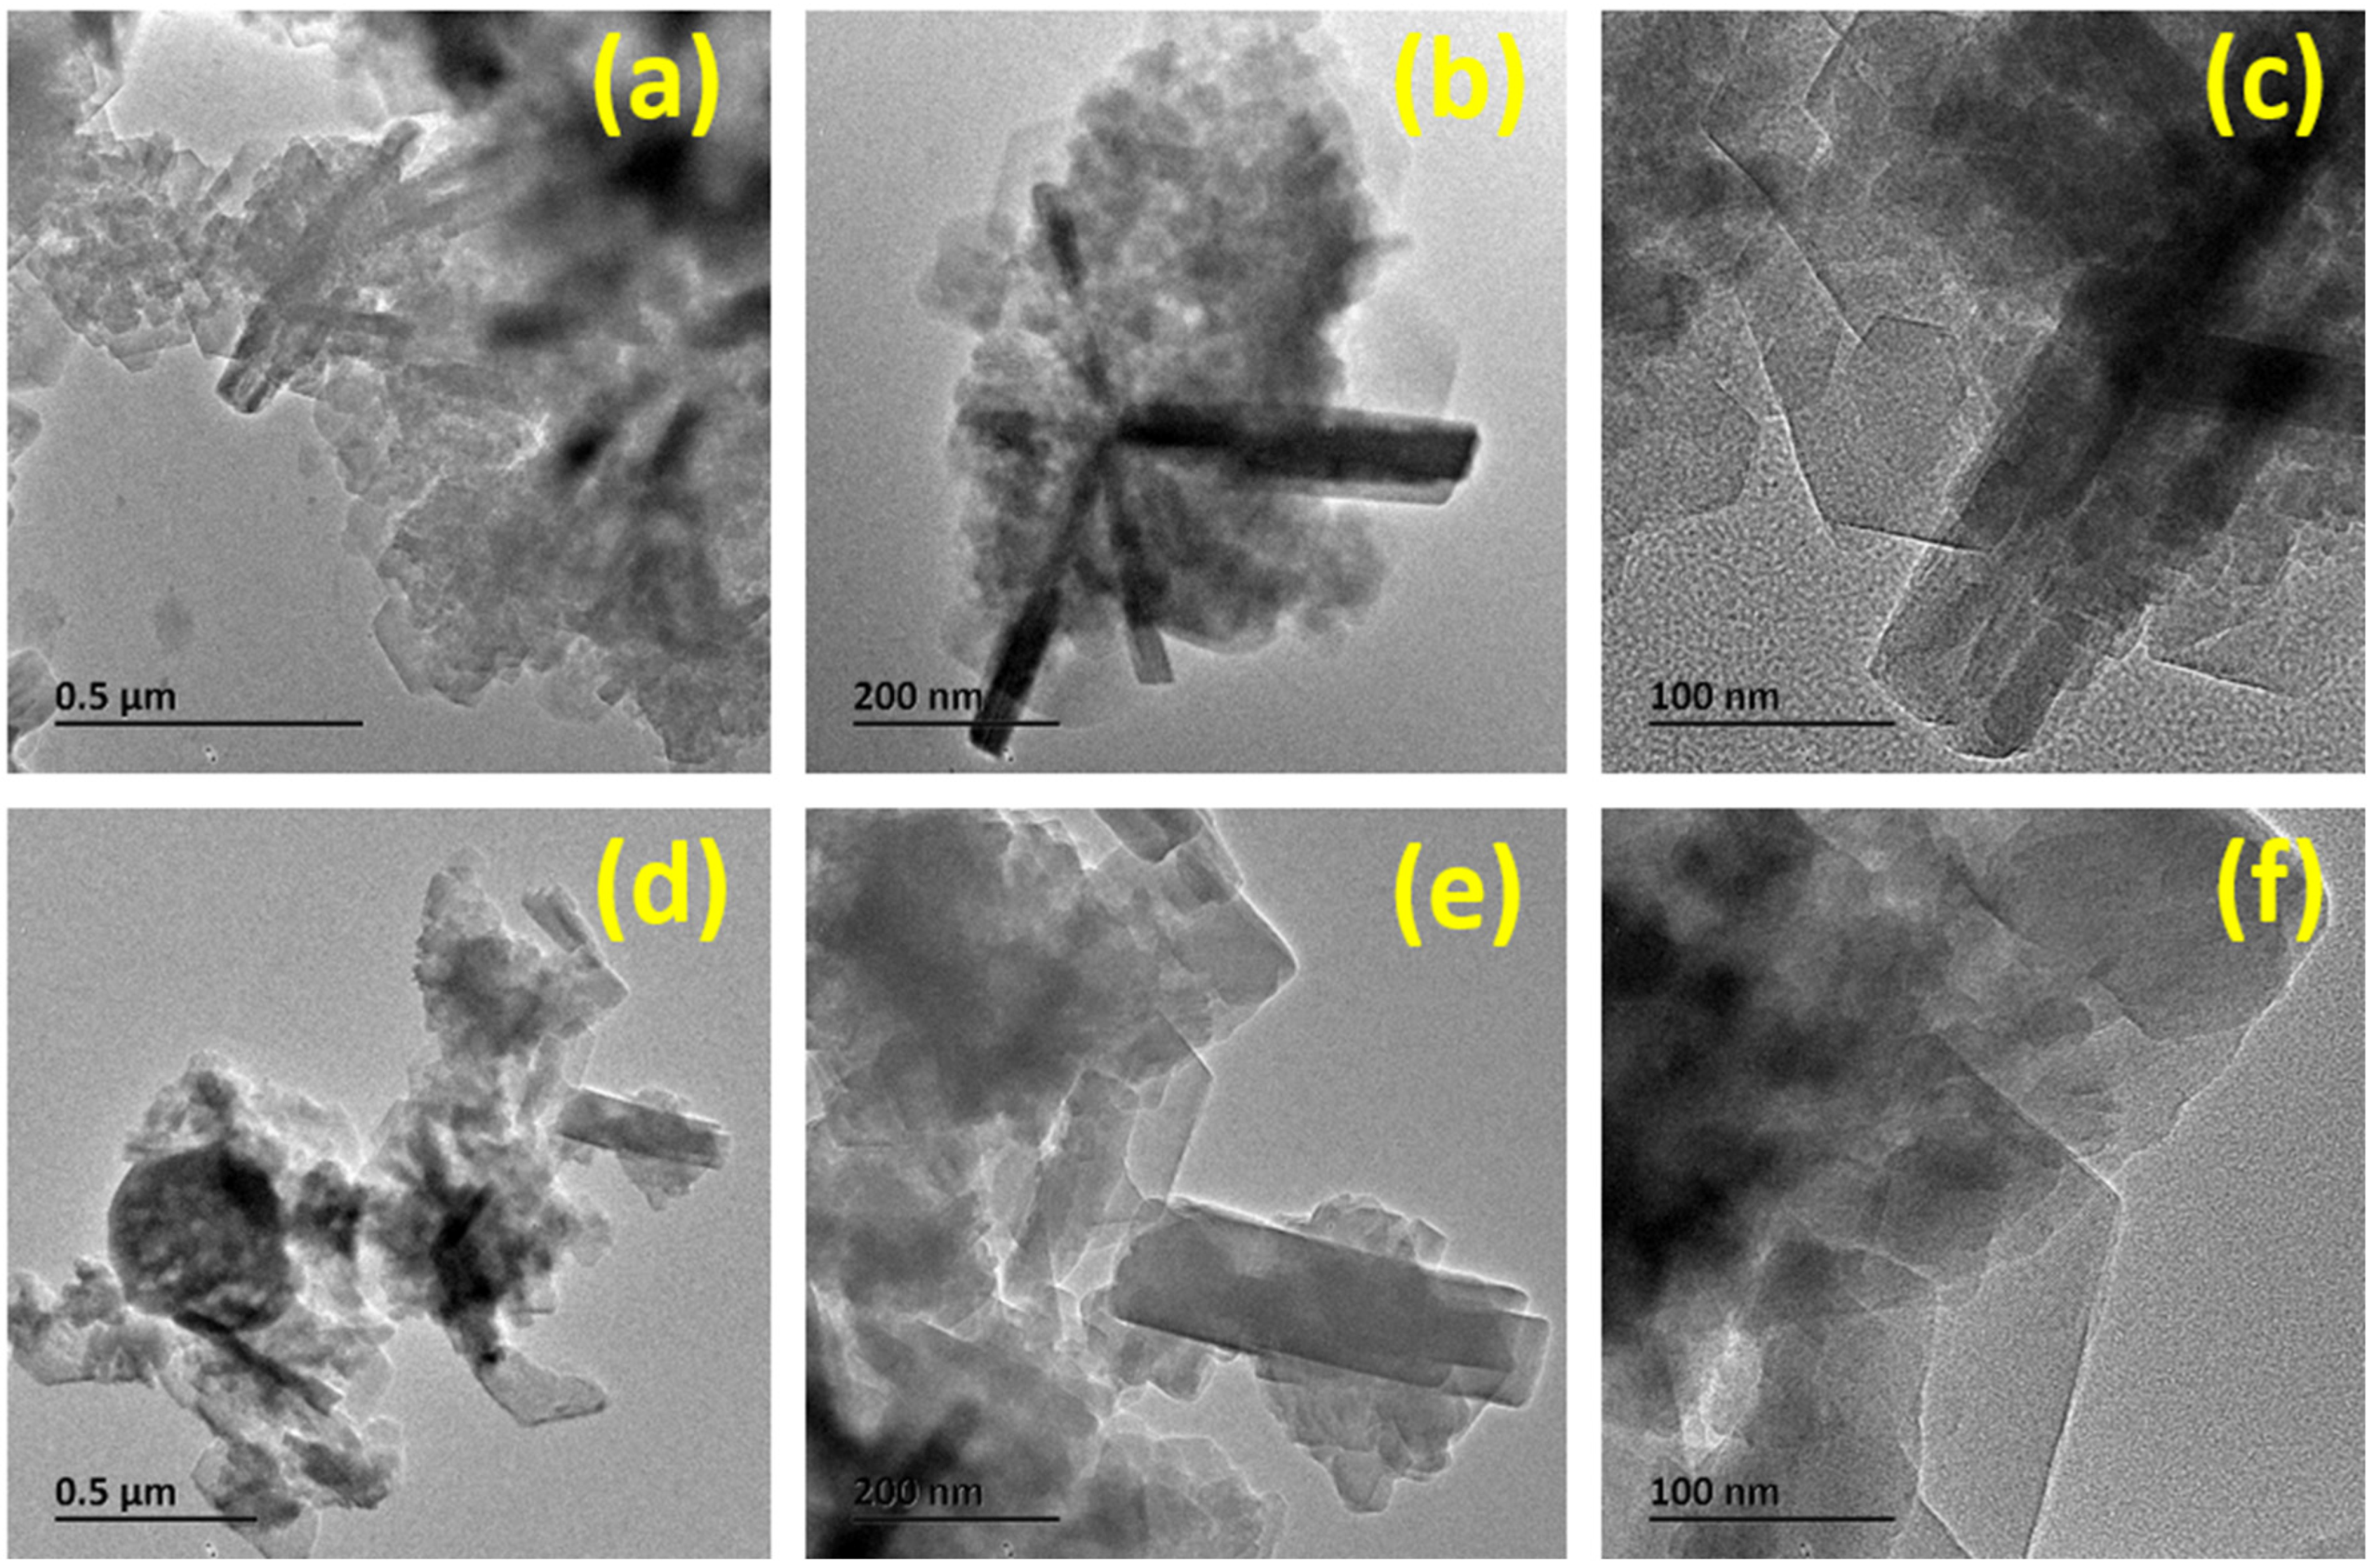
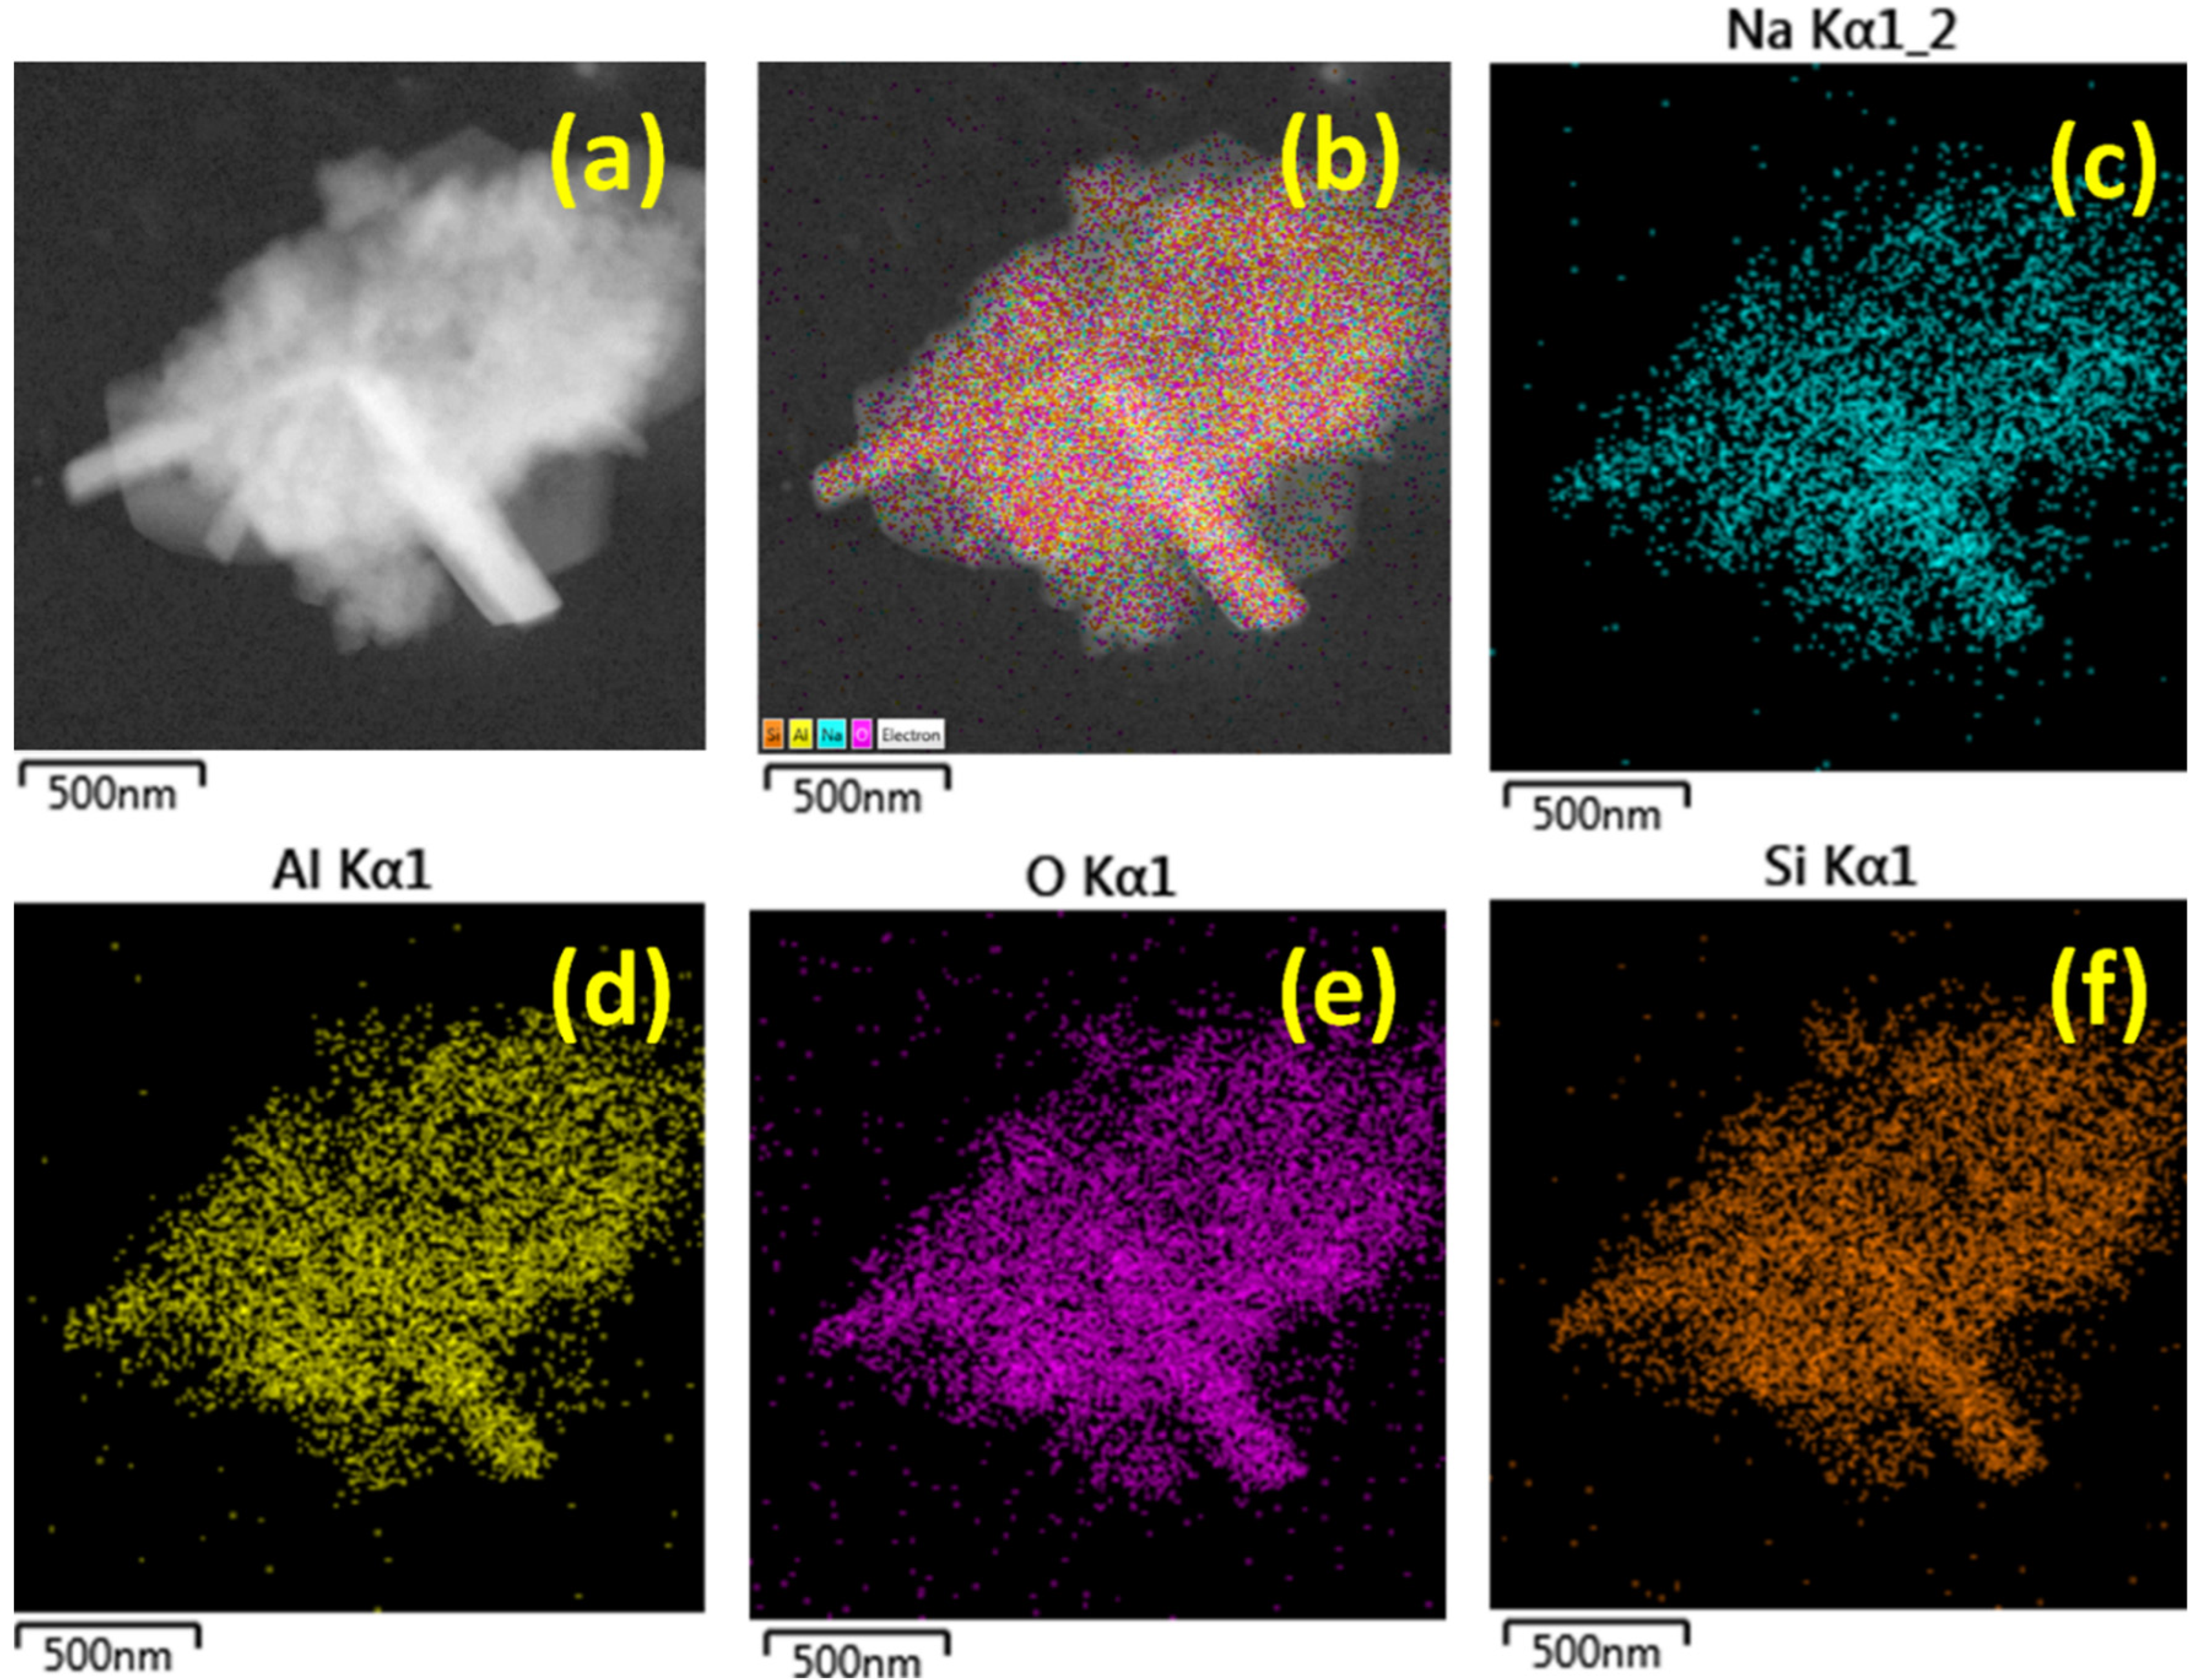
2.1. High Resolution Tramsmission Electron Microscopy and Energy Dispersive Spectroscopy

Representative particles of FAU (Figure 1a) and FAU-Fe (Figure 1d), and two magnifications are shown for each material in the micrographs in Figure 1. Both samples are composed of submicron particles. In the case of FAU zeolite, particles with a layer-like structure, which is joined by one of their ends (Figure 1b), and a crystalline twin structure are presented in Figure 1c.
The observed morphology has been explained as a result of the crystallization liquor, where a clear suspension contributes to thinner layers, more branching, and the pathway of crystallization that is driven by the recrystallization of particles with metastable morphology [16].
In the case of Fe-modified faujasite (FAU-Fe), as in FAU, the iron is presented as an agglomeration (darkest shaded circular-like area in Figure 1d), and the layer-like structures are presented in Figure 1e. As in Figure 1c, the crystalline twin structure is presented in Figure 1f. It is important to note that the materials presented in this study show a particular morphology that is attributed to the reactants during the synthesis. As a result, the properties of the resulting FAU zeolite are different from those offered by other commercial zeolites [17,18].
There is also a slight increase in particle size after the inclusion of iron in the composition of faujasite. An analysis of the energy dispersive X-ray spectroscopy (EDS) data in Figure 2 shows that after the inclusion of iron chloride in the gel, the crystalline sample contains all the elements of the FAU zeolite as well as iron. It is important to note that after the inclusion of Fe, the amount of Al decreased while Si almost did not change. This leads to a variation in the Si/Al ratio and may indicate that Fe atoms have displaced Al atoms.
The data in Figure 2 are information obtained from the characteristic X-rays emitted at a given penetration depth in the spot where the electron beam falls on the sample; for this reason, which generates a localized analysis. If the distribution of chemical elements in the sample is required, it is of use the elemental mapping of the samples. In the case of FAU zeolite, the elemental mapping is presented in Figure 3. For the zone in Figure 3a, the elemental mapping is presented in Figure 3b, and the emission of the characteristic X-ray by Na, Al, O, and Si is presented in Figure 3c, Figure 3d, Figure 3e, and Figure 3f respectively. As observed, all the elements are distributed homogeneously on the sample. In particular, Si and Al show a similar distribution, while O is highly accumulated on the layered structures. This coincides with the expected material type, Na86Al86Si106O384: wH2O (w ~ 260) [19]. In the case of FAU-Fe, the zone under analysis is presented in Figure 4a, and the elemental mapping is presented in Figure 4b. Similar to FAU zeolite, in FAU-Fe, the Al (Figure 4f) and Si (Figure 4h) present a similar distribution, and in comparison, O (Figure 4g) presents and has excess. Na presents a decrease when FAU-Fe (Figure 4c) is compared to FAU (Figure 3c). Furthermore, Figure 4d,e demonstrates the presence of Fe and Cl after the synthesis. This shows how the Fe was successfully integrated in the material after the chemical modification. Cl was also not removed after the washing process, but its presence was minimal, according to Figure 2.

2.2. Inductively Coupled Plasma—Optical Emission Spectrometry

The chemical composition of the FAU and FAU-Fe samples was further studied using ICP-OES. Table 1 shows their elemental composition. The data obtained confirm the EDS data, indicating a decrease in Al content in the FAU-Fe sample; in addition, the Si content also decreased while the Fe content increased. According to Table 1, the SiO2/Al2O3 molar ratios for the FAU and FAU-Fe samples can be estimated as 2.6 and 3.1, respectively.

2.3. BET Analysis

Figure 5 shows N2 adsorption-desorption isotherms for FAU and FAU-Fe. Isotherms typical for microporous materials with a type I hysteresis branch and huge adsorption at low partial pressures indicate the presence of microporosity. A “plateau” manifests itself in the entire range of average partial pressures, while an increase in N2 adsorption occurs at high relative pressures. The latter feature is characteristic of textural porosity and does not refer to internal (intraparticle) porosity but arises from interparticle void space [20]. When iron is included in the zeolite, the amount of adsorbed N2 decreases, but no changes in the shape of the hysteresis branch are observed.
The textural properties of FAU and FAU-Fe are shown in Table 2, in particular the pore volume V p and surface area S B E T . The data for FAU agree with the typical values for zeolitic materials of large surface area (502 m2/g) and pore volume (0.24 cm3/g).
Using the Dubinin–Astakhov method, the data of pore volume and surface area were corrected. The corrected measurements can be found in Table 2. The surface area for FAU zeolite was determined to 934 m2/g, while FAU-Fe zeolite exhibited a surface area of 461 m2/g. Additionally, the correct data indicate a decrease in the textural properties, as determined by the Dubinin–Astakhov method. This is a widespread effect of the inclusion of metals in zeolites, since the metals can be included not only as exchanged ions or replace some tetrahedral positions of the framework but also as nanoparticles in cavities and channels, which can decrease the textural properties of the porous materials.
On the other hand, textural properties decrease by almost 50% in both surface area and pore volume after the inclusion of iron. All of this may be a consequence of the introduction of iron not only into the faujasite crystal lattice but also into the channels and cavities of FAU zeolite in the form of exchange cations and extra lattice nanoparticles of iron oxide phases, which is a very common factor regarding the inclusion of metals in zeolitic materials.

2.4. X-ray Diffraction

The X-ray diffraction patterns showed that both samples, pure FAU, and iron-modified FAU-Fe zeolite displayed the same crystal structure (Figure 6), and both diffractograms matched the reference diffraction pattern corresponding to faujasite. This means that the chosen synthesis conditions are adequate to obtain FAU zeolite in the presence of iron in a one-pot synthesis variant. From the Scherrer equation:
D = K λ β cos θ  
the average crystallite size D ¯ was calculated. Here, D is the crystallite size in nm, K = 0.9 is the Scherrer constant, and   λ = 0.15406 is the wavelength in nm of the X-ray source.
Since D is calculated for each peak, D ¯ was obtained by averaging the calculated values of D . Using Equation (1), the average crystallite size was calculated for each sample: D ¯ F A U- F e = 13 nm and D ¯ F A U = 8 nm. Interestingly, the introduction of iron increased the size of the coherent scattering region in the resulting faujasite. Note, too, that no phases other than faujasite were observed in the diffraction patterns of the samples.
In addition, since the FAU zeolite has a cubic crystalline system, the theoretical cell parameters are a = b = c = 2.4345 nm [19]. Considering that,
1 d h k l 2 = h 2 + k 2 + l 2 a 2   ,
where d h k l is the interplanar space, and so, considering that, the value of the cell parameter a can be calculated from experimental XRD data. Given λ = 0.154056 :
d h k l = λ 2 sin θ ,  
and from experimental data for FAU, in h k l = 331 , we have 2 θ = 15.39 ° , and from Equation (3), d F A U = 0.5733 and a F A U = 2.51 . In the case of FAU-Fe, in h k l = 331 we have 2 θ = 15.42 , and, consequently, d F A U = 0.5742 and a F A U- F e = 2.5 . Since a F A U a F A U- F e , it can be concluded that there is almost no variation in the cell parameters after the modification of FAU zeolite with iron. Furthermore, when the experimental cell parameter is compared with the theoretical one, it can be noted that an expansion of the cell dimensions occurred during the synthesis of FAU zeolite. In the case of the amorphous phase, it can be studied from the crystallinity of the material [21]. In this case, for FAU and FAU-Fe, there is a crystallinity of 98% and 79%, respectively. This implies that after the inclusion of Fe into the zeolites, there is amorphization of the material.

2.5. XPS Analysis

Figure 7 shows the XPS spectra for the FAU and FAU-Fe. The XRD data show that the crystalline structure is retained in the sample modified with iron. However, the variations in crystallinity may be attributed to the presence of iron species within the crystalline structure. This is confirmed by data from EDS and ICP-OES. In this regard, the type of Fe in the sample may be assessed by X-ray photoelectron spectroscopy (XPS).
Figure 7 shows high-resolution XPS spectra for elements such as Al, Si, and Fe. These data fully confirm the sum of observations obtained by other methods. The positions of the Al and Si peaks (74.47 and 103.01 eV, respectively) did not change since the structure of the FAU zeolite was preserved. There was no Fe peak in the FAU spectra, although it was present in very small amounts in the composition of FAU. Apparently, this was an impurity present in the commercial reagents for the synthesis used in this work, but it was not only present on the surface of the crystals. As a matter of fact, in the FAU-Fe, the binding energy of Fe turned out to be 711.5 eV, which corresponds to the states of Fe3+ [22]. This indicates that iron in FAU-Fe exists in the Fe(III) oxide form.

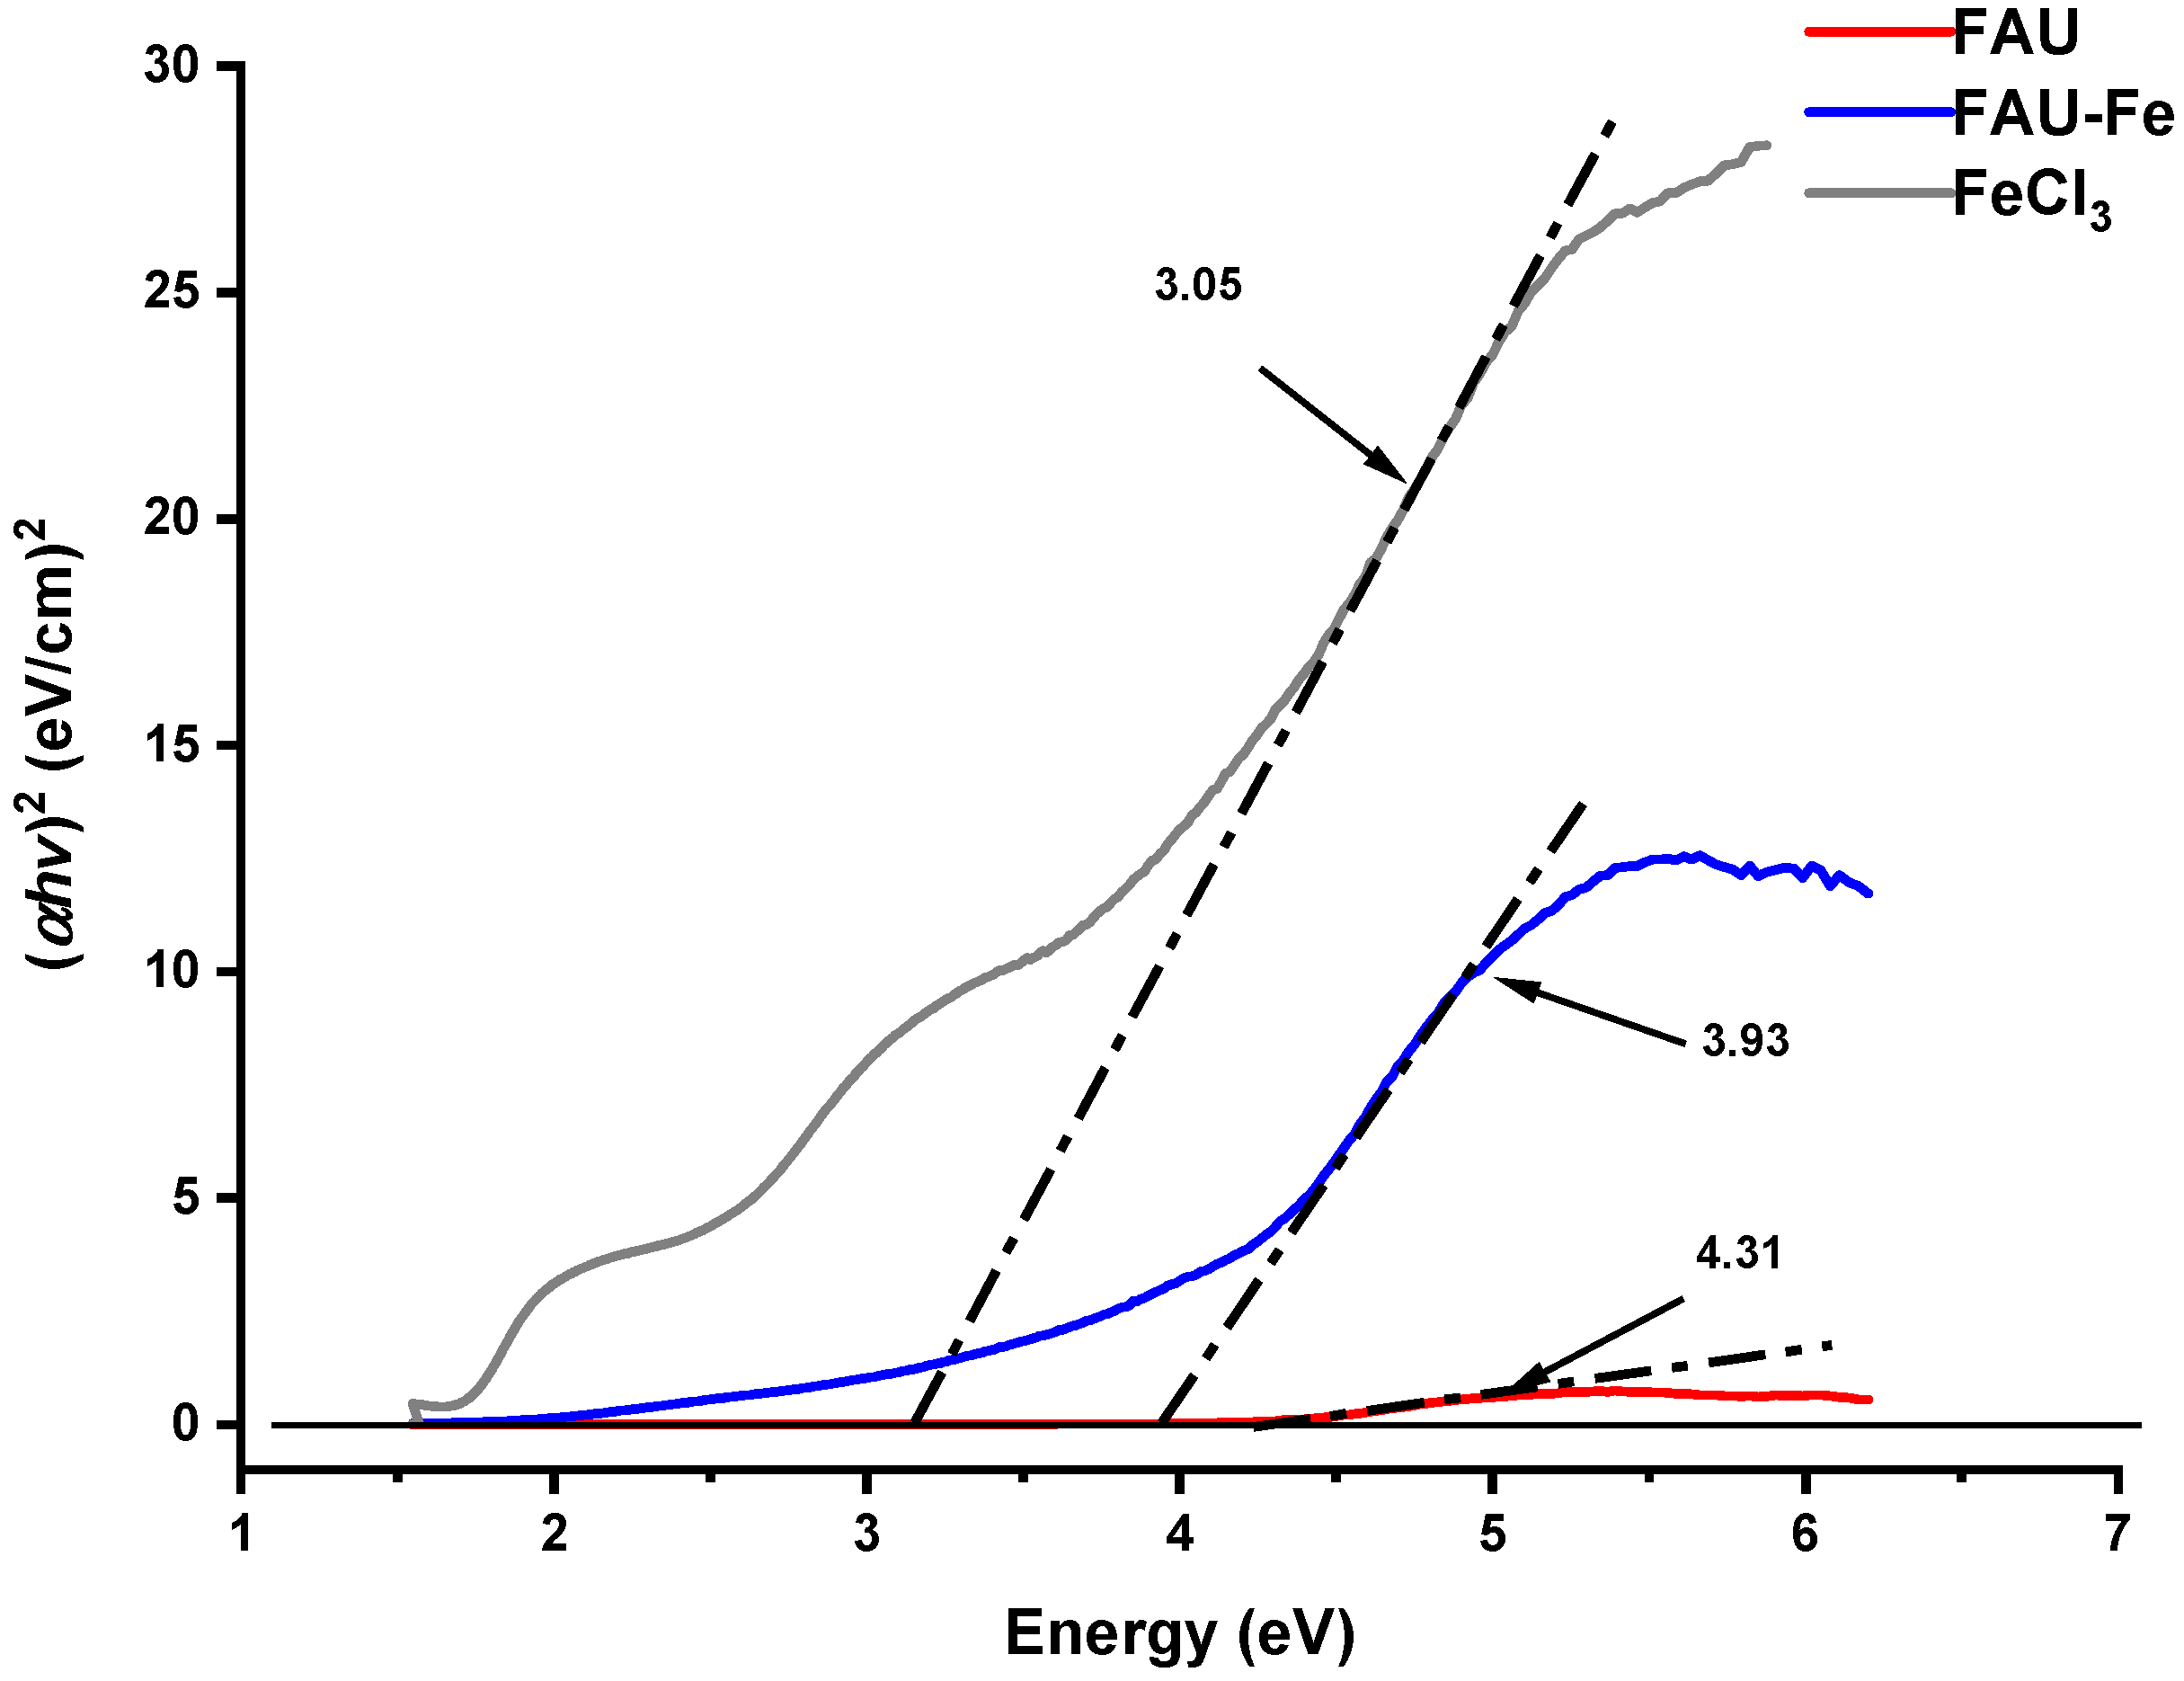
2.6. Bandgap Analysis

The band gap of zeolitic particles was obtained using the UV–Vis spectra of the samples under study in absorbance mode and according to the Tauc model [23]:
( a h v ) 1 / n = A ( h v E g ) ,  
where h is Planck’s constant, v is the frequency of the photon, α is the adsorption coefficient, E g is the bandgap, and A is the slope of the Tauc plot in the linear domain. In this case, n = 2 , which is considered for direct allowed transitions (direct bandgap). The Tauc plot allows us to observe a decrease in the band gap of the FAU-Fe zeolite by 0.38 eV compared to pure faujasite (Figure 8). This means that after the incorporation of Fe into the zeolite, the resulting band gap is between the band gaps of pure FAU and FeCl3. This change in the band gap in FAU-Fe is expected to cause a change in the conductivity of the sample.

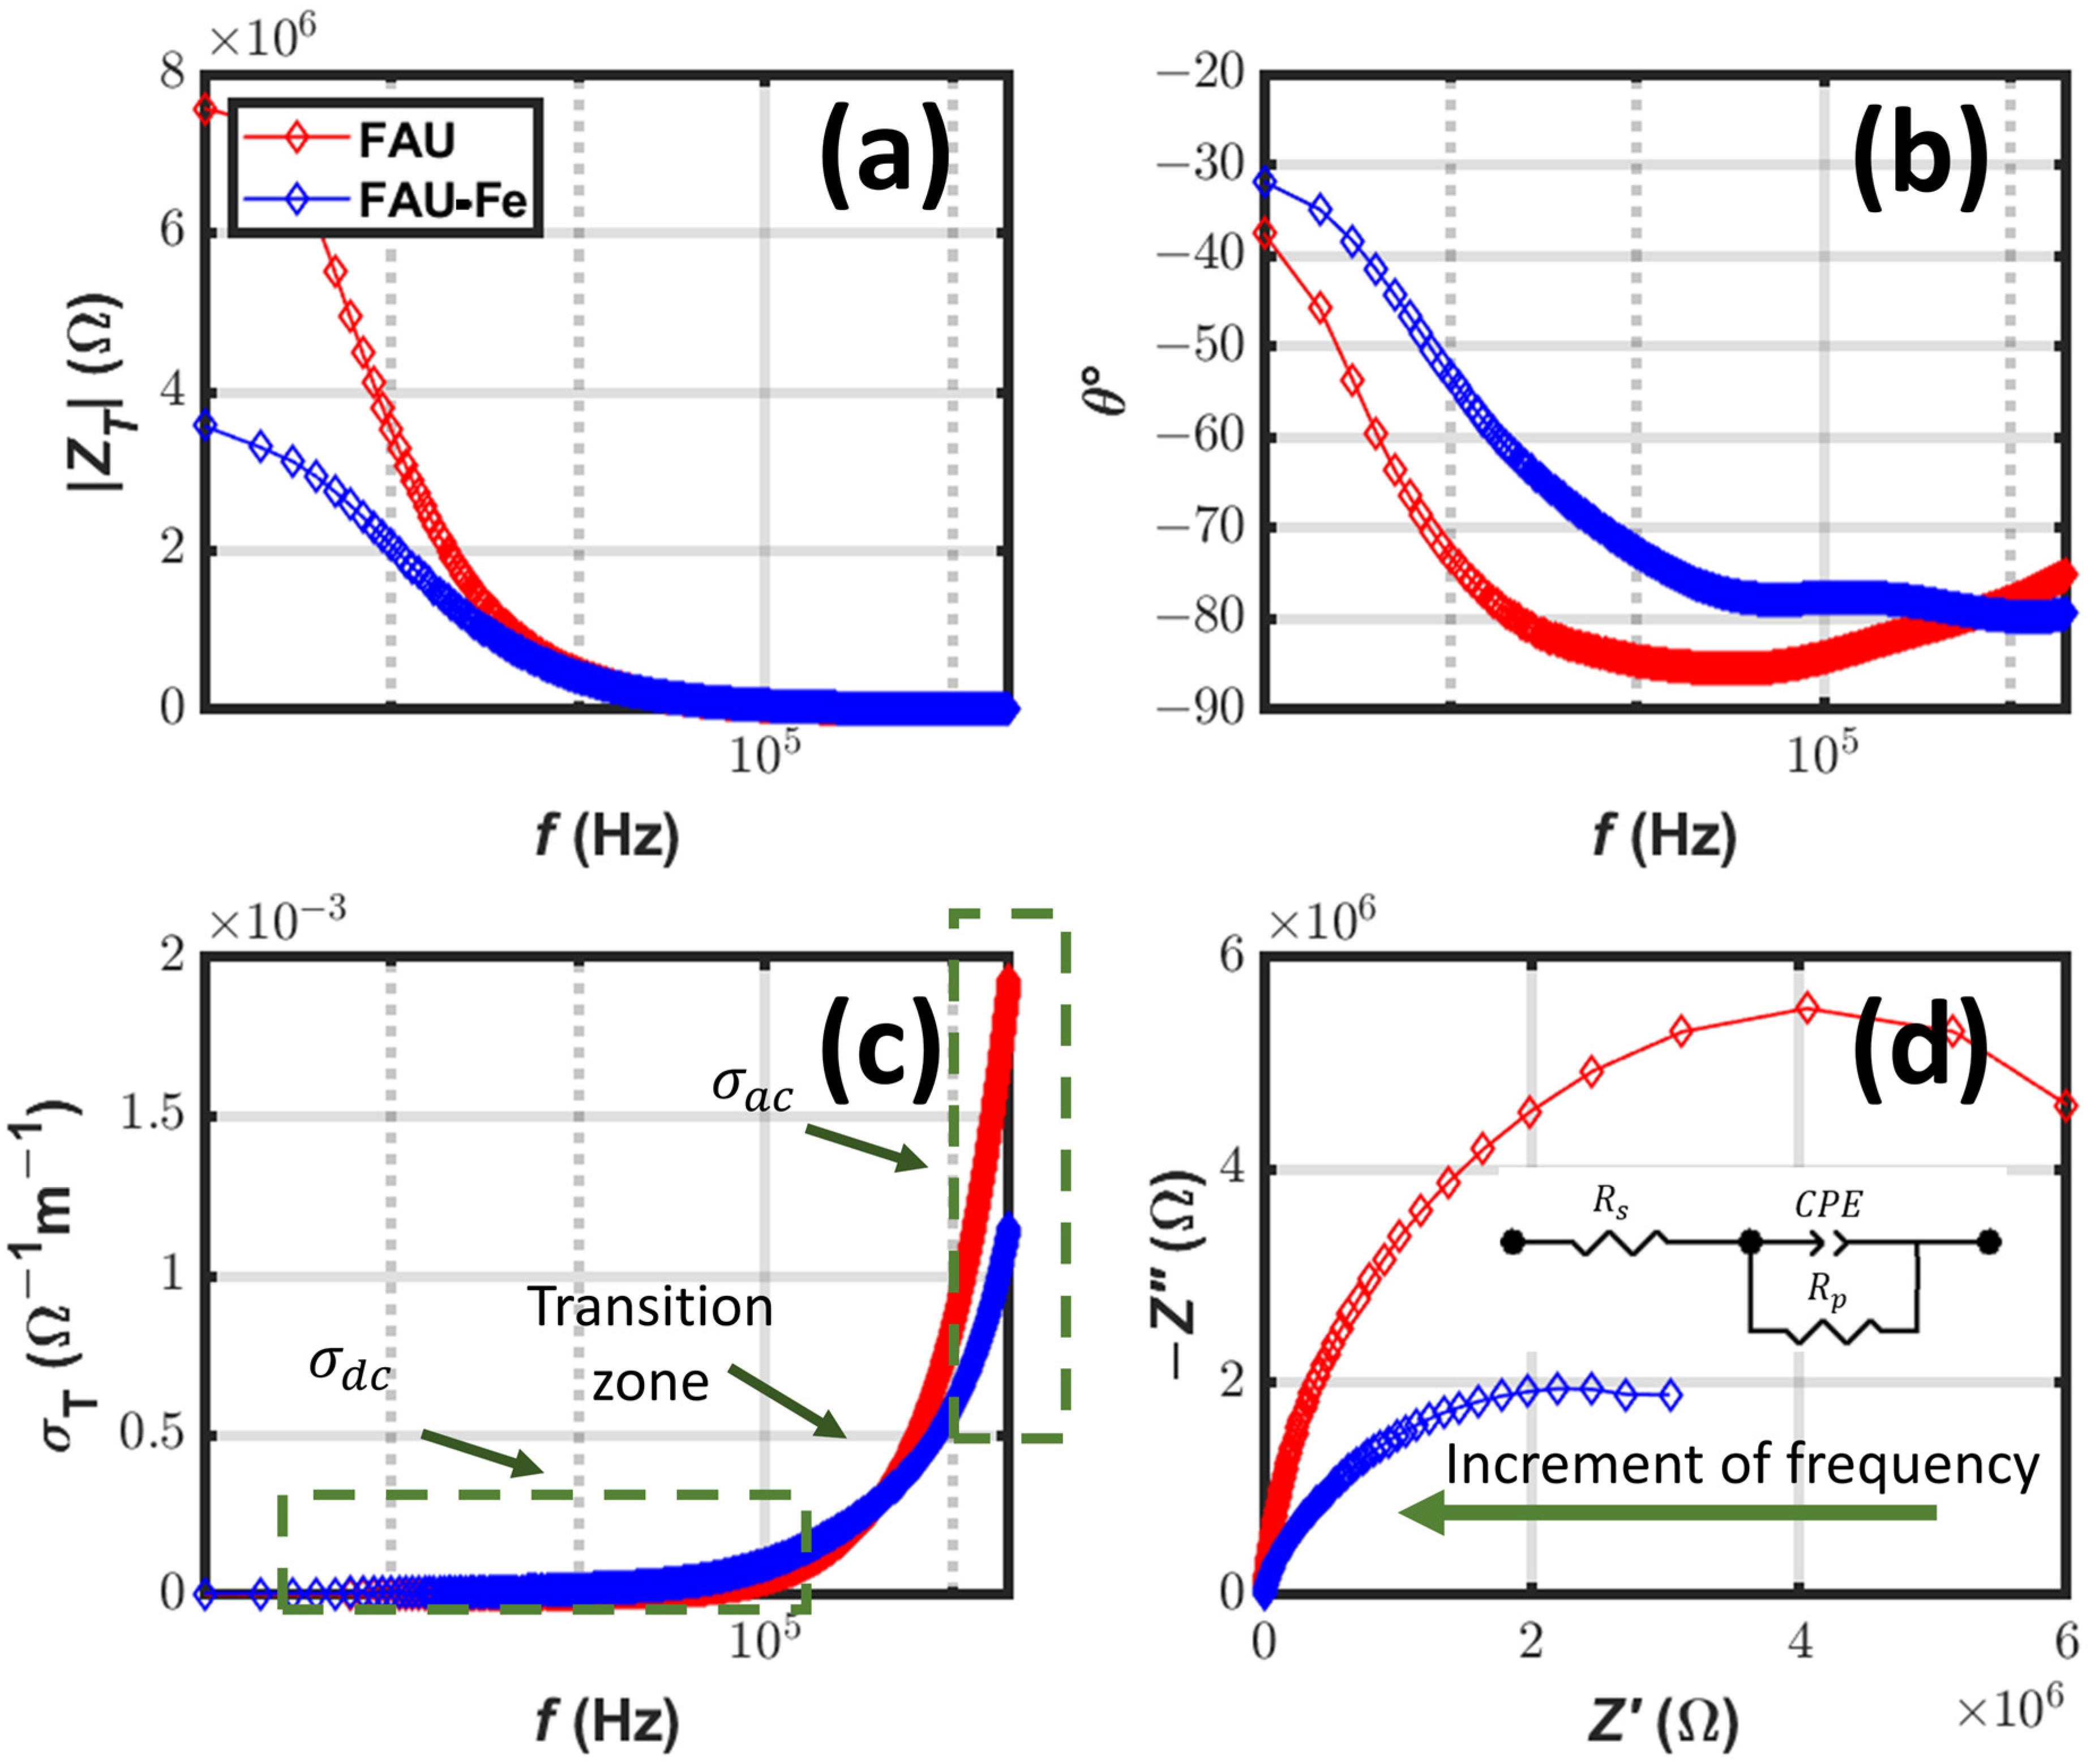
2.7. Electrochemical Impedance Spectroscopy

The EIS data for both samples are presented in Figure 9. As shown, the impedance value of the FAU-Fe sample is smaller than that of the FAU (see Figure 9a). In general, this indicates a greater ability to transport charge carriers through the FAU-Fe zeolite. The phase variations observed in Figure 7b show a decrement in reactive effects, which suggests that iron alters the charge transport mechanisms within the zeolite. In contrast, the AC conductivity is higher for FAU than for FAU-Fe (Figure 9c). This is interesting because such behavior is a consequence of the reduced reactive effects, which may be attributed to Fe. Furthermore, conductivity can be modeled by the Jonscher power law for the universal behavior of conductivity:
σ a c = σ d c + A j ω n ,  
where A j is the pre-exponential factor, ω is the angular frequency in rad/s, and n is the frequency exponent. Fitting the data of Figure 9c to Equation (5) leads to the values shown in Table 3.
According to data in Table 1, DC conductivity in FAU-Fe is greater than in FAU. In addition, for both materials, the value of n is greater than 0.6 and less or equal to 1, which is characteristic of ionic conductors. If the value of n departs from 1, there is a smoother transition from DC to AC conductivity. That is the reason why there is asymptotic behavior at an earlier frequency in FAU zeolite in comparison to FAU-Fe (Figure 9c). When the conductivity of FAU is compared with FAU-Fe, n defines the best frequency for achieving either DC or AC conductivity, as it is observed, below 385.1 kHz, that FAU-Fe has better conductivity than FAU.
Figure 9d presents the Argand diagram. A decrement in reactance is observed after the addition of Fe to the FAU, and since reactance does not go to positive values, there is purely capacitive reactance in both samples. In addition, since two semicircles are observed in Figure 7, the same ion-conducting processes occur in both samples, but the effects of energy-dissipating and charge storing are driven by the particle size.
This makes sense if one considers the increment in the average crystallite size observed after the addition of iron. From data in Figure 9d, it can be proposed that the relationship between Z and Z is given by a Randles circuit (inset in Figure 9d). After the use of the software ZView, the proposed circuit can be fitted to experimental data calculated from | Z T | and θ ° , and for each material, the calculated values are presented in Table 4. In general terms, the resistance decreased after the addition of iron and the capacitance increased, which implies that the capacity for energy storage increased after the addition of iron.

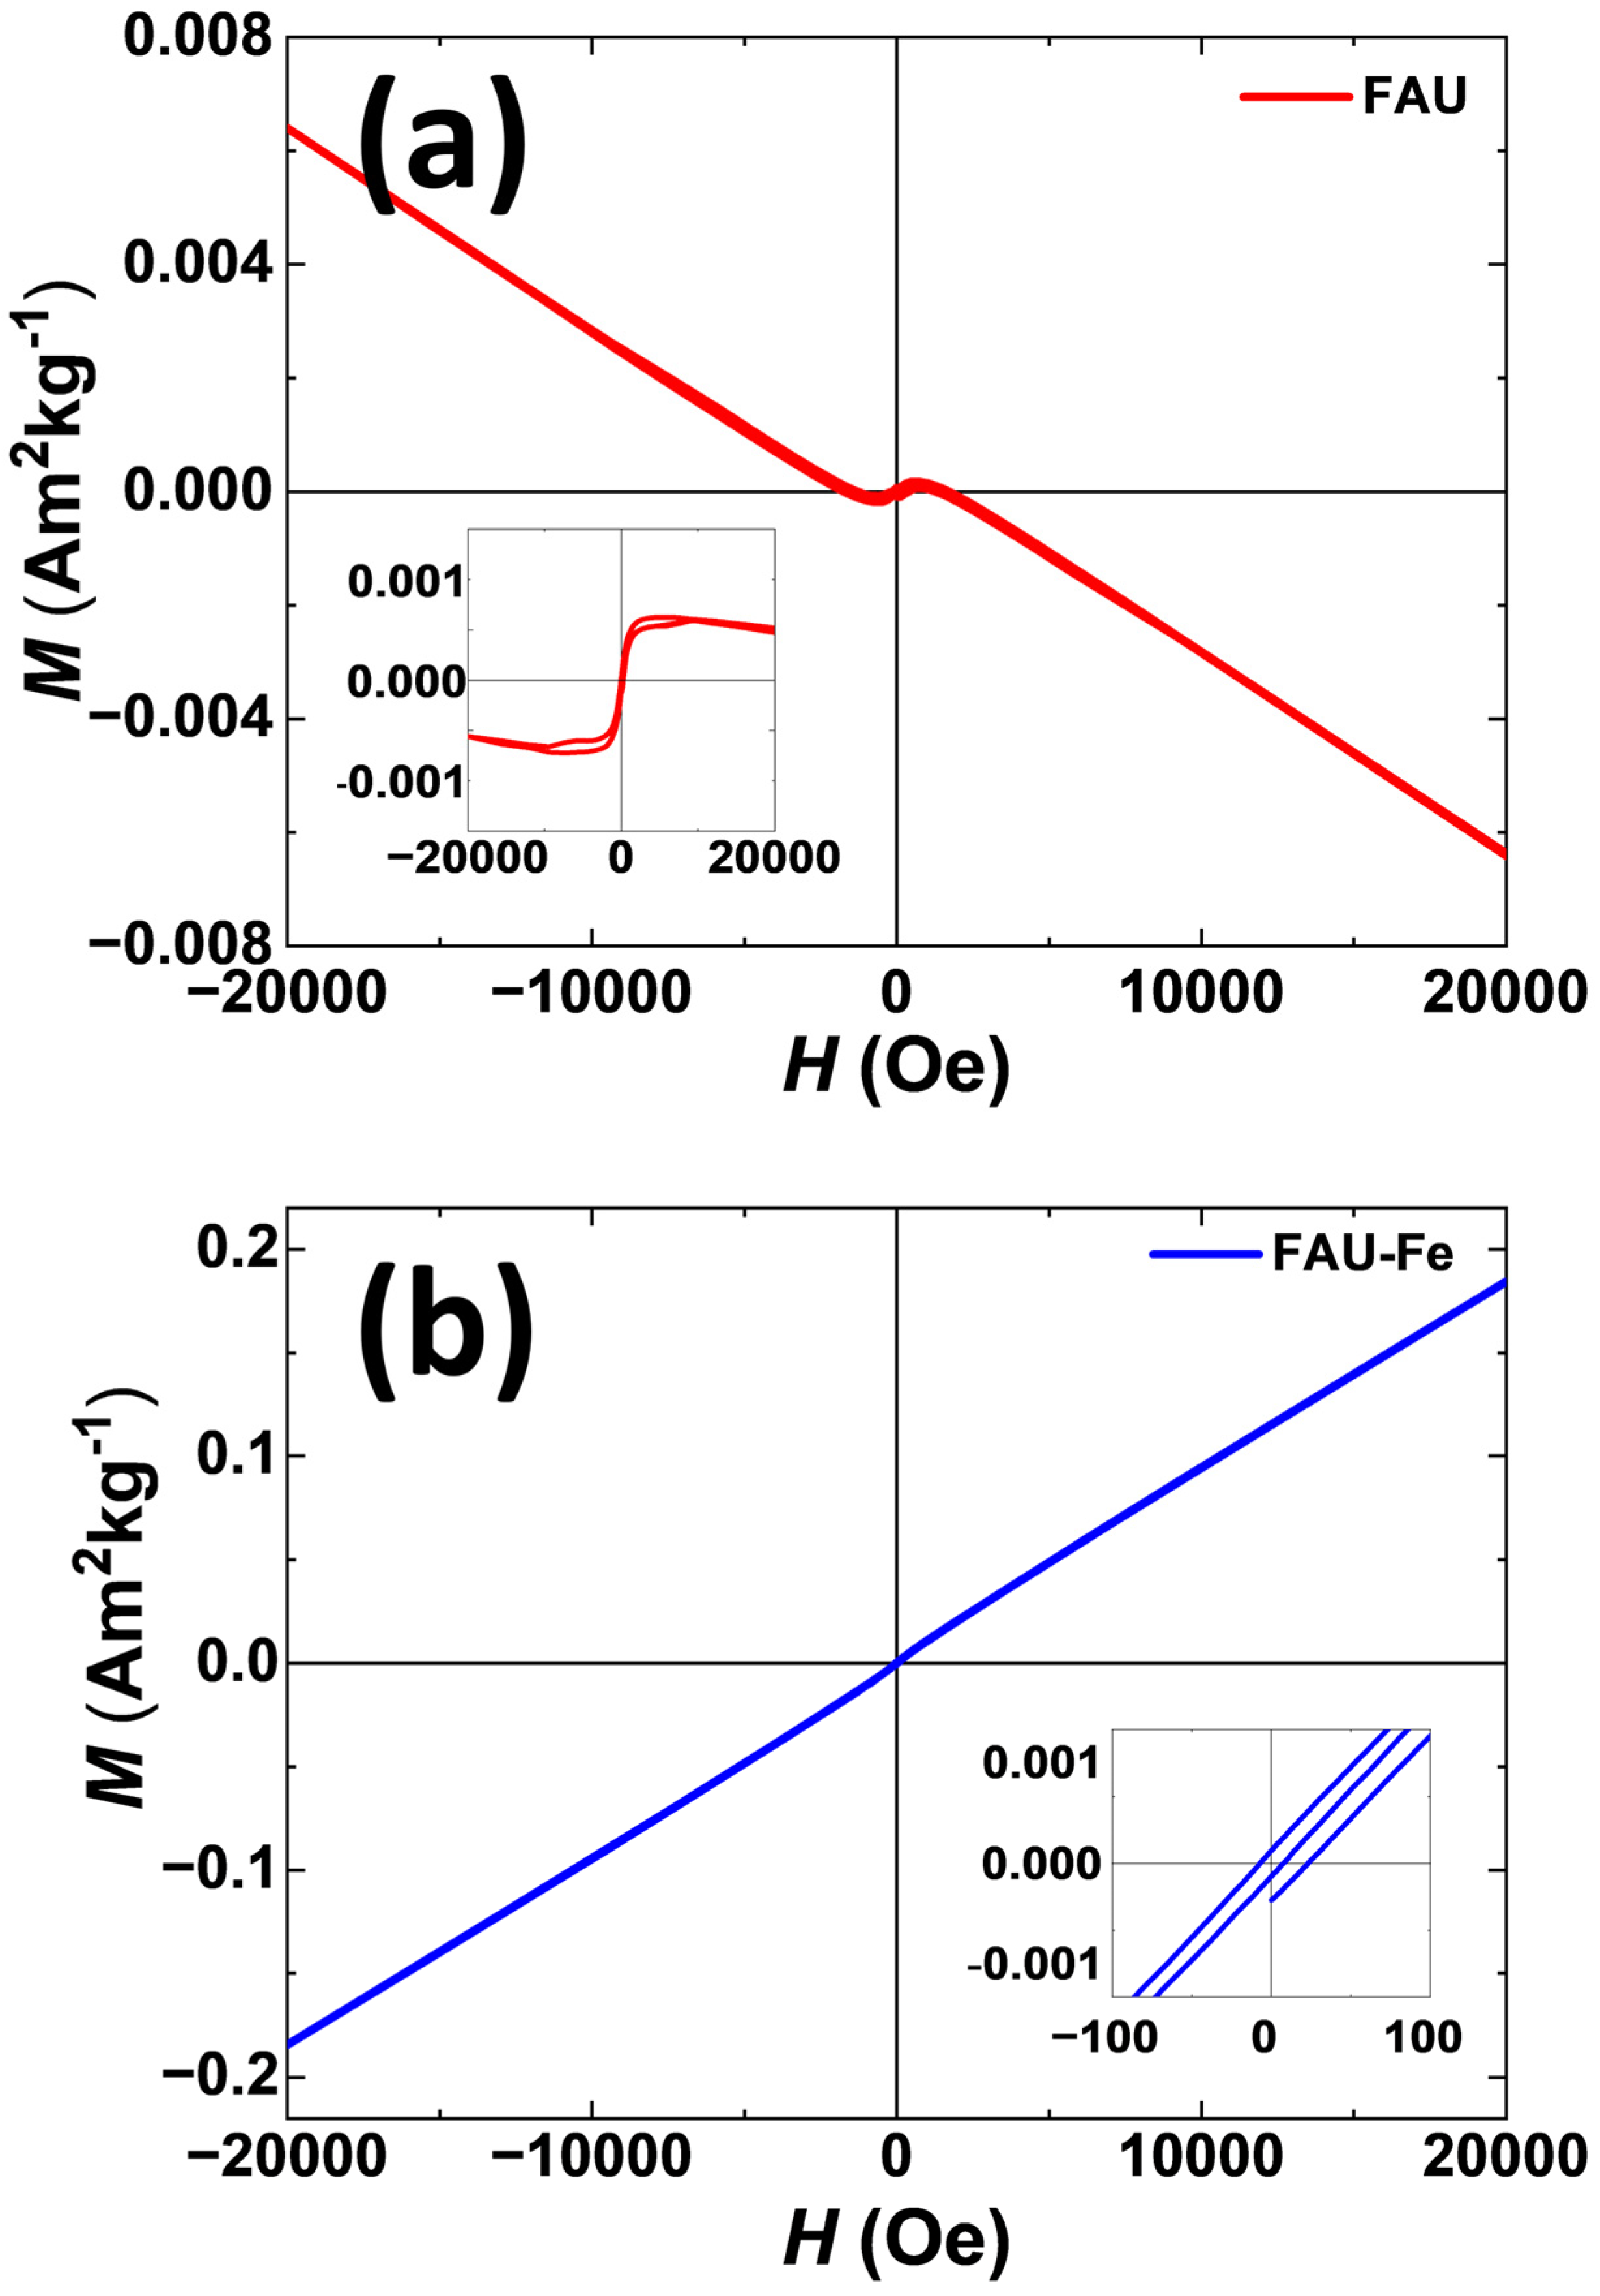
2.8. Magnetic Characterization

In order to highlight some of the distinctive features of the magnetic behavior of zeolite X samples, Figure 10 compares the hysteresis loops of FAU and FAU-Fe, showing the dependence of magnetization on the magnetic field (M-H). Figure 10a exhibits a dominant diamagnetic behavior of FAU due to the matrix and sample holder. However, a weak ferromagnetic behavior is observed at a coercive field below 50 Oe. This behavior can be associated with the possible presence of a small amount of a ferromagnetic phase or, maybe, a duo of uncompensated magnetic moments of antiferromagnetic particles, as reported in other works [24].
On the other hand, the FAU-Fe sample (Figure 10b) exhibits a different behavior, evidencing weak ferromagnetism at room temperature, which is confirmed by coactivity values other than zero. This behavior may be due to the distribution of Fe2+ and Fe3+ ions present to achieve charge compensation generated by the presence of oxygen vacancies and the magnetic interaction between them, causing spontaneous magnetization, as occurs in other similar materials [25,26]. It is known that some zeolites show an antiferromagnetic behavior; however, they present a magnetic moment because of spin canting, which can be defined as the result of a spin-canted arrangement in two sublattices.

3. Materials and Methods

3.1. Preparation of Samples

For the synthesis of iron-modified faujasite (Fe-FAU), a modified IZA formulation was used [13]. In accordance with the original recipe, the synthesis is carried out by mixing two pre-prepared solutions. To prepare the first solution, 50 g of deionized water (conductivity ≤ 4.3 μS/cm) and 50 g of sodium hydroxide (Sigma Aldrich, Solkraftsvägen, Sweden, reagent grade, ≥98%) were mixed and dissolved using a magnetic stirrer. During agitation, the temperature of the mixture was set to 303 K to promote the integration of NaOH in the water. Then, 48.75 g of alumina trihydrate (Sigma Aldrich, reagent grade, 50.0–57.5% Al) was added, the mixture was stirred again at 100 °C until completely dissolved, and it was finally cooled to 25 °C and mixed with 101.25 g of water. Then, 50 g of this solution was mixed with 306 g of water and 26.56 g of sodium hydroxide and homogenized with a magnetic stirrer. Thus, stock precursor solution A was obtained.
Stock precursor solution B was prepared by mixing 109.85 g of sodium meta-silicate pentahydrate (Jalmek, reagent grade, Na2SiO3·5H2O), 306 g of water, and 29.56 g of sodium hydroxide until the mixture was completely dissolved. The mixture was then divided into two equal volumes: one corresponding to solution B for synthesis according to the IZA method. FeCl3 (Sigma Aldrich, reagent grade, 97%) was additionally added to another portion of the solution (in a weight ratio of 130:1) and mixed until homogenized. This was a stock precursor solution C for the direct synthesis of FAU Fe. Then, equal volumes of solutions A and B and also A and C were mixed at room temperature and magnetically stirred until homogenized. The mixtures were transferred to 500 mL polypropylene bottles. Both containers with the obtained gels were placed inside an oven at 90 °C for 12 h. Thereafter, the solids were filtered and washed at the filter with 2 L of deionized water. Finally, the resulting crystals were dried in an oven at 100 °C for 24 h.

3.2. Characterization

The chemical composition of the samples was evaluated by inductively coupled plasma-optical emission spectroscopy (ICP-OES) using a Vista-MPX CCD (Palo Alto, CA, USA) simultaneous ICP-OES (Varian) (Palo Alto, CA, USA). Samples were characterized by X-ray diffraction (XRD) using Aeris Panalytical equipment (Malvern Panalytical, Malvern, UK), with Cu K alpha monochromatic radiation ( λ = 0.154056 nm, 40 kV, 15 mA), and UV-Vis spectroscopy using a UV-Vis-NIR Cary 5000 spectrophotometer (Santa Clarita, CA, USA). Zeolites structures were obtained by high resolution transmission electron microscopy (HRTEM) in a JEOL ARM 200F (Tokyo, Japan) operating at 200 kV, which was equipped with an EDS detector from Oxford (UK) Instruments model Aztec.
The textural properties of materials were determined by means of nitrogen adsorption-desorption isotherms at −196 °C on an ASAP 2000 equipment from Micromeritics (Norcross, GA, USA). Samples were preliminarily degassed at 300 °C for 4 h under vacuum prior to nitrogen adsorption. The surface area was measured by the Brunauer–Emmett–Teller (BET) method at relative pressures of 0.05 < P / P 0 < 0.30 and by Dubinin–Astakhov at the same pressures as those used for the BET method. The average pore diameter was calculated following the Barrett–Joyner–Halenda method (BJH) using the desorption branch of the N2 isotherm. The cumulative pore volume (VP) was obtained according to the amount of gas adsorbed by FAU zeolite at a relative pressure of P / P 0 = 0.99 . The micropore surface area ( S m i c r o ) and the micropore volume ( V m i c r o ) were obtained by the t-plot method.
The XPS spectra of the samples were recorded using a SPECS® spectrometer (Berlin, Germany) with a PHOIBOS® 150 WAL hemispherical energy analyzer with angular resolution (<0.5°), equipped with an XR 50 X-Ray Al/Mg-X-ray anode and μ-FOCUS 500 X-ray monochromator (Al excitation line) sources.
In order to obtain electrochemical impedance spectroscopy (EIS) data, each sample was ground and compressed into a pellet of 1 cm diameter and 1 mm thickness; the pellet was then placed between two polished copper electrodes, which were connected to an E4980A Precision LCR Meter. As a result, for each sample, a dataset was obtained corresponding to the magnitude of the total impedance | Z T | in ohms, phase angle θ in arc degrees, and frequency f of interrogation signal in hertz. Magnetic measurements were performed using a Vibrating Sample Magnetometer (VSM) Squid Magnetometer Quantum Design MPMS® 3 system (LA, USA) with a maximum applied field of 20,000 Oe at room temperature.

4. Conclusions

This work studied the effects of iron incorporation into zeolite X. FAU zeolite was successfully synthesized in the laboratory with a modified recipe. As a result, a layer-like morphology was observed, which grants this material particular properties compared to other zeolites in the literature. During synthesis, FAU zeolite was modified with iron by a simple one-pot synthesis method. As a result, it was found that under the chosen conditions, the zeolite with the FAU crystal structure successfully crystallized from the aluminosilicate gel after including iron in its composition. Diffractograms show that the FAU structure was retained after adding Fe, but an increment in the average crystallite size was observed. The morphology of FAU and FAU Fe particles was similar. The band gap E g of iron-doped faujasite decreases compared to pure zeolite. The effects of the included iron were observed in the electrical behavior of zeolite and its magnetic properties.

Author Contributions

Conceptualization, F.N.M.-R., V.P. and J.A.-G.; methodology, F.N.M.-R.; validation, V.P. and R.I.Y.-G.; formal analysis, F.N.M.-R., V.P., J.A.-G. and J.Z.; investigation, F.N.M.-R., V.P., J.A.-G., R.I.Y.-G., J.Z. and A.R.S.; writing—original draft preparation, F.N.M.-R., V.P., J.A.-G., R.I.Y.-G., J.Z. and A.R.S.; writing—review and editing, F.N.M.-R., V.P., J.A.-G., R.I.Y.-G., J.Z. and A.R.S.; funding acquisition, V.P. and A.R.S. All authors have read and agreed to the published version of the manuscript.

Funding

This research was funded through the grants DGAPA-PAPIIT IG101623 and CONACYT “Basic Science Project A1-S-33492”.

Data Availability Statement

Not applicable.

Acknowledgments

Authors are grateful to Jorge Barreto and Arturo Martínez (IF-UNAM) for their valuable technical assistance in the magnetic measurements. Additionally, the authors would like to extend their gratitude to I. Betancourt for providing access to the infrastructure at IIM-UNAM, as well as Josue Romero for conducting the HRTEM analysis.

Conflicts of Interest

The authors declare no conflict of interest.

References

  1. Murrieta-Rico, F.N.; Antúnez-García, J.; Yocupicio-Gaxiola, R.I.; Galván, D.H.; González, J.C.; Petranovskii, V. Zeolites as initial structures for the preparation of functional materials. J. Appl. Res. Technol. 2022, 20, 92–116. [Google Scholar] [CrossRef]
  2. Antúnez-García, J.; Posada-Amarillas, A.; Galván, D.H.; Smolentseva, E.; Petranovskii, V.; Moyado, S.F. DFT study of composites formed by M2 metallic clusters (M = Ni, Cu, Fe and Au) embedded in faujasite. RSC Adv. 2016, 6, 79160–79165. [Google Scholar] [CrossRef]
  3. Antúnez-García, J.; Galván, D.H.; Petranovskii, V.; Murrieta-Rico, F.N.; Yocupicio-Gaxiola, R.I.; Fuentes-Moyado, S. Theoretical study of the effect of isomorphous substitution by Al3+ and/or Fe3+ cations to tetrahedral positions in the framework of a zeolite with erionite topology. J. Mater. Sci. 2019, 54, 13190–13199. [Google Scholar] [CrossRef]
  4. Antúnez-García, J.; Galván, D.H.; Petranovskii, V.; Murrieta-Rico, F.N.; Yocupicio-Gaxiola, R.I.; Shelyapina, M.G.; Fuentes-Moyado, S. The effect of chemical composition on the properties of LTA zeolite: A theoretical study. Comput. Mater. Sci. 2021, 196, 110557. [Google Scholar] [CrossRef]
  5. Knops-Gerrits, P.P.; Goddard, W.A., III. Methane partial oxidation in iron zeolites: Theory versus experiment. J. Mol. Catal. A Chem. 2001, 166, 135–145. [Google Scholar] [CrossRef]
  6. Lari, G.M.; Mondelli, C.; Pérez-Ramírez, J. Gas-phase oxidation of glycerol to dihydroxyacetone over tailored iron zeolites. ACS Catal. 2015, 5, 1453–1461. [Google Scholar] [CrossRef]
  7. Pour, A.N.; Zamani, Y.; Tavasoli, A.; Shahri, S.M.K.; Taheri, S. Study on products distribution of iron and iron–zeolite catalysts in Fischer–Tropsch synthesis. Fuel 2008, 87, 2004–2012. [Google Scholar] [CrossRef]
  8. Senamart, N.; Buttha, S.; Pantupho, W.; Koleva, I.Z.; Loiha, S.; Aleksandrov, H.A.; Vayssilov, G.N. Characterization and temperature evolution of iron-containing species in HZSM-5 zeolite prepared from different iron sources. J. Porous Mater. 2019, 26, 1227–1240. [Google Scholar] [CrossRef]
  9. Jin, Y.; Asaoka, S.; Zhang, S.; Li, P.; Zhao, S. Reexamination on transition metal substituted MFI zeolites for catalytic conversion of methanol into light olefins. Fuel Process. Technol. 2013, 115, 34–41. [Google Scholar] [CrossRef]
  10. Spinacé, E.V.; Cardoso, D.; Schuchardt, U. Incorporation of Iron (III) and Chromium (III) in SAPO-37. Zeolites 1997, 19, 6–12. [Google Scholar] [CrossRef]
  11. Guaya, D.; Cobos, H.; Camacho, J.; López, C.M.; Valderrama, C.; Cortina, J.L. LTA and FAU-X Iron-Enriched Zeolites: Use for Phosphate Removal from Aqueous Medium. Materials 2022, 15, 5418. [Google Scholar] [CrossRef]
  12. Zhang, J.; Tang, X.; Yi, H.; Yu, Q.; Zhang, Y.; Wei, J.; Yuan, Y. Synthesis, characterization and application of Fe-zeolite: A review. Appl. Catal. A Gen. 2021, 630, 118467. [Google Scholar] [CrossRef]
  13. Ma, B.; Fernandez-Martinez, A.; Mancini, A.; Lothenbach, B. Spectroscopic investigations on structural incorporation pathways of FeIII into zeolite frameworks in cement-relevant environments. Cem. Concr. Res. 2021, 140, 106304. [Google Scholar] [CrossRef]
  14. Lei, Q.; Wang, C.; Dai, W.; Wu, G.; Guan, N.; Li, L. Multifunctional heteroatom zeolites: Construction and applications. Front. Chem. Sci. Eng. 2021, 15, 1462–1486. [Google Scholar] [CrossRef]
  15. Zecchina, A.; Rivallan, M.; Berlier, G.; Lamberti, C.; Ricchiardi, G. Structure and nuclearity of active sites in Fe-zeolites: Comparison with iron sites in enzymes and homogeneous catalysts. Phys. Chem. Chem. Phys. 2007, 9, 3483–3499. [Google Scholar] [CrossRef]
  16. Ferdov, S. Conventional synthesis of layer-like zeolites with faujasite (FAU) structure and their pathway of crystallization. Microporous Mesoporous Mater. 2020, 303, 110263. [Google Scholar] [CrossRef]
  17. Li, L.; Shen, Q.; Li, J.; Hao, Z.; Xu, Z.P.; Lu, G.M. Iron-exchanged FAU zeolites: Preparation, characterization and catalytic properties for N2O decomposition. Appl. Catal. A Gen. 2008, 344, 131–141. [Google Scholar] [CrossRef]
  18. Aparicio, L.M.; Dumesic, J.A.; Fang, S.M.; Long, M.A.; Ulla, M.A.; Millman, W.S.; Hall, W.K. Mössbauer spectroscopy and catalytic studies of iron-exchanged, silicon-substituted Y-zeolite. J. Catal. 1987, 104, 381–395. [Google Scholar] [CrossRef]
  19. Baerlocher, C.; McCusker, L.B. Database of Zeolite Structures. Available online: http://www.izastructure.org/databases (accessed on 29 November 2022).
  20. Tanev, P.T.; Pinnavaia, T.J. Mesoporous silica molecular sieves prepared by ionic and neutral surfactant templating: A com-parison of physical properties. Chem. Mater. 1996, 8, 2068–2079. [Google Scholar] [CrossRef]
  21. Murrieta-Rico, F.N.; Petranovskii, V.; Antúnez-Garcia, J.; Yocupicio-Gaxiola, R.I.; Grishin, M.; Sarvadii, S. Analysis of the effect of crystallization time during growth on the properties of zeolite LTA film on quartz substrates. Mater. Today Proc. 2022, 67, 732–735. [Google Scholar] [CrossRef]
  22. Yan, Z.; Zhuxia, Z.; Tianbao, L.; Xuguang, L.; Bingshe, X. XPS and XRD study of FeCl3–graphite intercalation compounds prepared by arc discharge in aqueous solution. Spectrochim. Acta Part A Mol. Biomol. Spectrosc. 2008, 70, 1060–1064. [Google Scholar] [CrossRef]
  23. Tauc, J. Optical properties and electronic structure of amorphous Ge and Si. Mater. Res. Bull. 1968, 3, 37–46. [Google Scholar] [CrossRef]
  24. Belviso, C.; Kharchenko, A.; Agostinelli, E.; Cavalcante, F.; Peddis, D.; Varvaro, G.; Yaacoub, N.; Mintova, S. Red mud as aluminium source for the synthesis of magnetic zeolite. Microporous Mesoporous Mater. 2018, 270, 24–29. [Google Scholar] [CrossRef]
  25. Karthik, T.; Srinivas, A.; Kamaraj, V.; Chandrasekeran, V. Influence of in situ magnetic field pressing on the structural and multiferroic behaviour of BiFeO3 ceramics. Ceram. Int. 2012, 38, 1093–1098. [Google Scholar] [CrossRef]
  26. Loiola, A.R.; Bessa, R.A.; Freitas, A.D.; Soares, S.A.; Bohn, F.; Pergher, S.B. Magnetic zeolite composites: Classification, synthesis routes, and technological applications. J. Magn. Magn. Mater. 2022, 560, 169651. [Google Scholar] [CrossRef]
Figure 1. Micrographs of zeolites: FAU with a resolution of 0.5 μm (a), 200 nm (b), and 100 nm (c), FAU-Fe with a resolution of 0.5 μm (d), and 200 nm (e), and 100 nm (f).
Catalysts 13 01159 g001
Figure 2. Data from EDS of FAU and FAU-Fe samples.
Catalysts 13 01159 g002
Figure 3. EDS elemental mapping of FAU zeolite: zone under analysis (a), characteristic X-rays emitted by the elements in the sample (b). The cyan, yellow, purple, and orange colors correspond to the emission of Na (c), Al (d), O (e), and Si (f), respectively.
Catalysts 13 01159 g003
Figure 4. EDS elemental mapping of FAU-Fe zeolite: zone under analysis (a), characteristic X-rays emitted by the elements in the sample (b). The cyan, light green, orange, green, purple and yellow colors correspond to the emission of Na (c), Fe (d), Cl (e), Al (f), O (g), and Si (h), respectively.
Catalysts 13 01159 g004
Figure 5. N2 adsorption-desorption isotherms (300 °C) for FAU and FAU-Fe zeolites.
Catalysts 13 01159 g005
Figure 6. Comparison of normalized diffractograms of FAU zeolite.
Catalysts 13 01159 g006
Figure 7. XPS spectra in the BE ranges of Al, Si, and Fe for MFI and MFI-Fe zeolites.
Catalysts 13 01159 g007
Figure 8. Tauc plots corresponding to FAU, FAU-Fe, and FeCl3.
Catalysts 13 01159 g008
Figure 9. The magnitude of total impedance | Z T | (a), phase angle θ (b), total conductivity σ T (c), and Argand diagram of the real part of impedance Z vs. imaginary part of impedance Z (d).
Catalysts 13 01159 g009
Figure 10. Hysteresis loops for as-produced samples: (a) M-H curve of FAU sample, and (b) M-H curve of FAU-Fe sample. The inset: (a) shows corrected for diamagnetic background with weak ferromagnetism behavior, (b) magnification of coercivity field Hc.
Catalysts 13 01159 g010
Table 1. Elemental composition data from ICP-OES for FAU and FAU-Fe zeolites.
SampleAl2O3
% Mole
SiO2
% Mole
Fe2O3
% Mole
SiO2/Al2O3
Mole Ratio
SiO2/Fe2O3
Mole Ratio
SiO2/
(Al2O3 + Fe2O3)
Mole Ratio
Fau27.672.40.052.613312.6
FAU-Fe17.855.526.73.12.11.2
Table 2. Textural properties of FAU and FAU-Fe zeolites.
Sample V p   ( cm 3 / g ) V p   *   ( cm 3 / g ) S B E T   ( m 2 / g ) S D A   *   ( m 2 / g )
FAU0.240.28502934
FAU-Fe0.140.18 301 461
* Data corrected using the method Dubinin-Astakhov.
Table 3. Values obtained from fitting Jonscher’s power law.
Sample σ d c A j   n
FAU 1.66 × 10 6 1.46 × 10 10 1
FAU Fe 3 × 10 5 3.38 × 10 10 0.915
Table 4. Values obtained after fitting experimental data to Randles circuit.
Sample R s   ( ) C P E T   ( F )   C P E P R p   ( )
FAU 1960 5.212 × 10 11 0.9635 1.5258 × 10 7
FAU-Fe 516.6 1.470 × 10 10 0.87681 4.4538 × 10 6
Disclaimer/Publisher’s Note: The statements, opinions and data contained in all publications are solely those of the individual author(s) and contributor(s) and not of MDPI and/or the editor(s). MDPI and/or the editor(s) disclaim responsibility for any injury to people or property resulting from any ideas, methods, instructions or products referred to in the content.

