Polyaniline-Grafted RuO2-TiO2 Heterostructure for the Catalysed Degradation of Methyl Orange in Darkness

 , and
, and
Abstract
:
1. Introduction
2. Results and Discussion
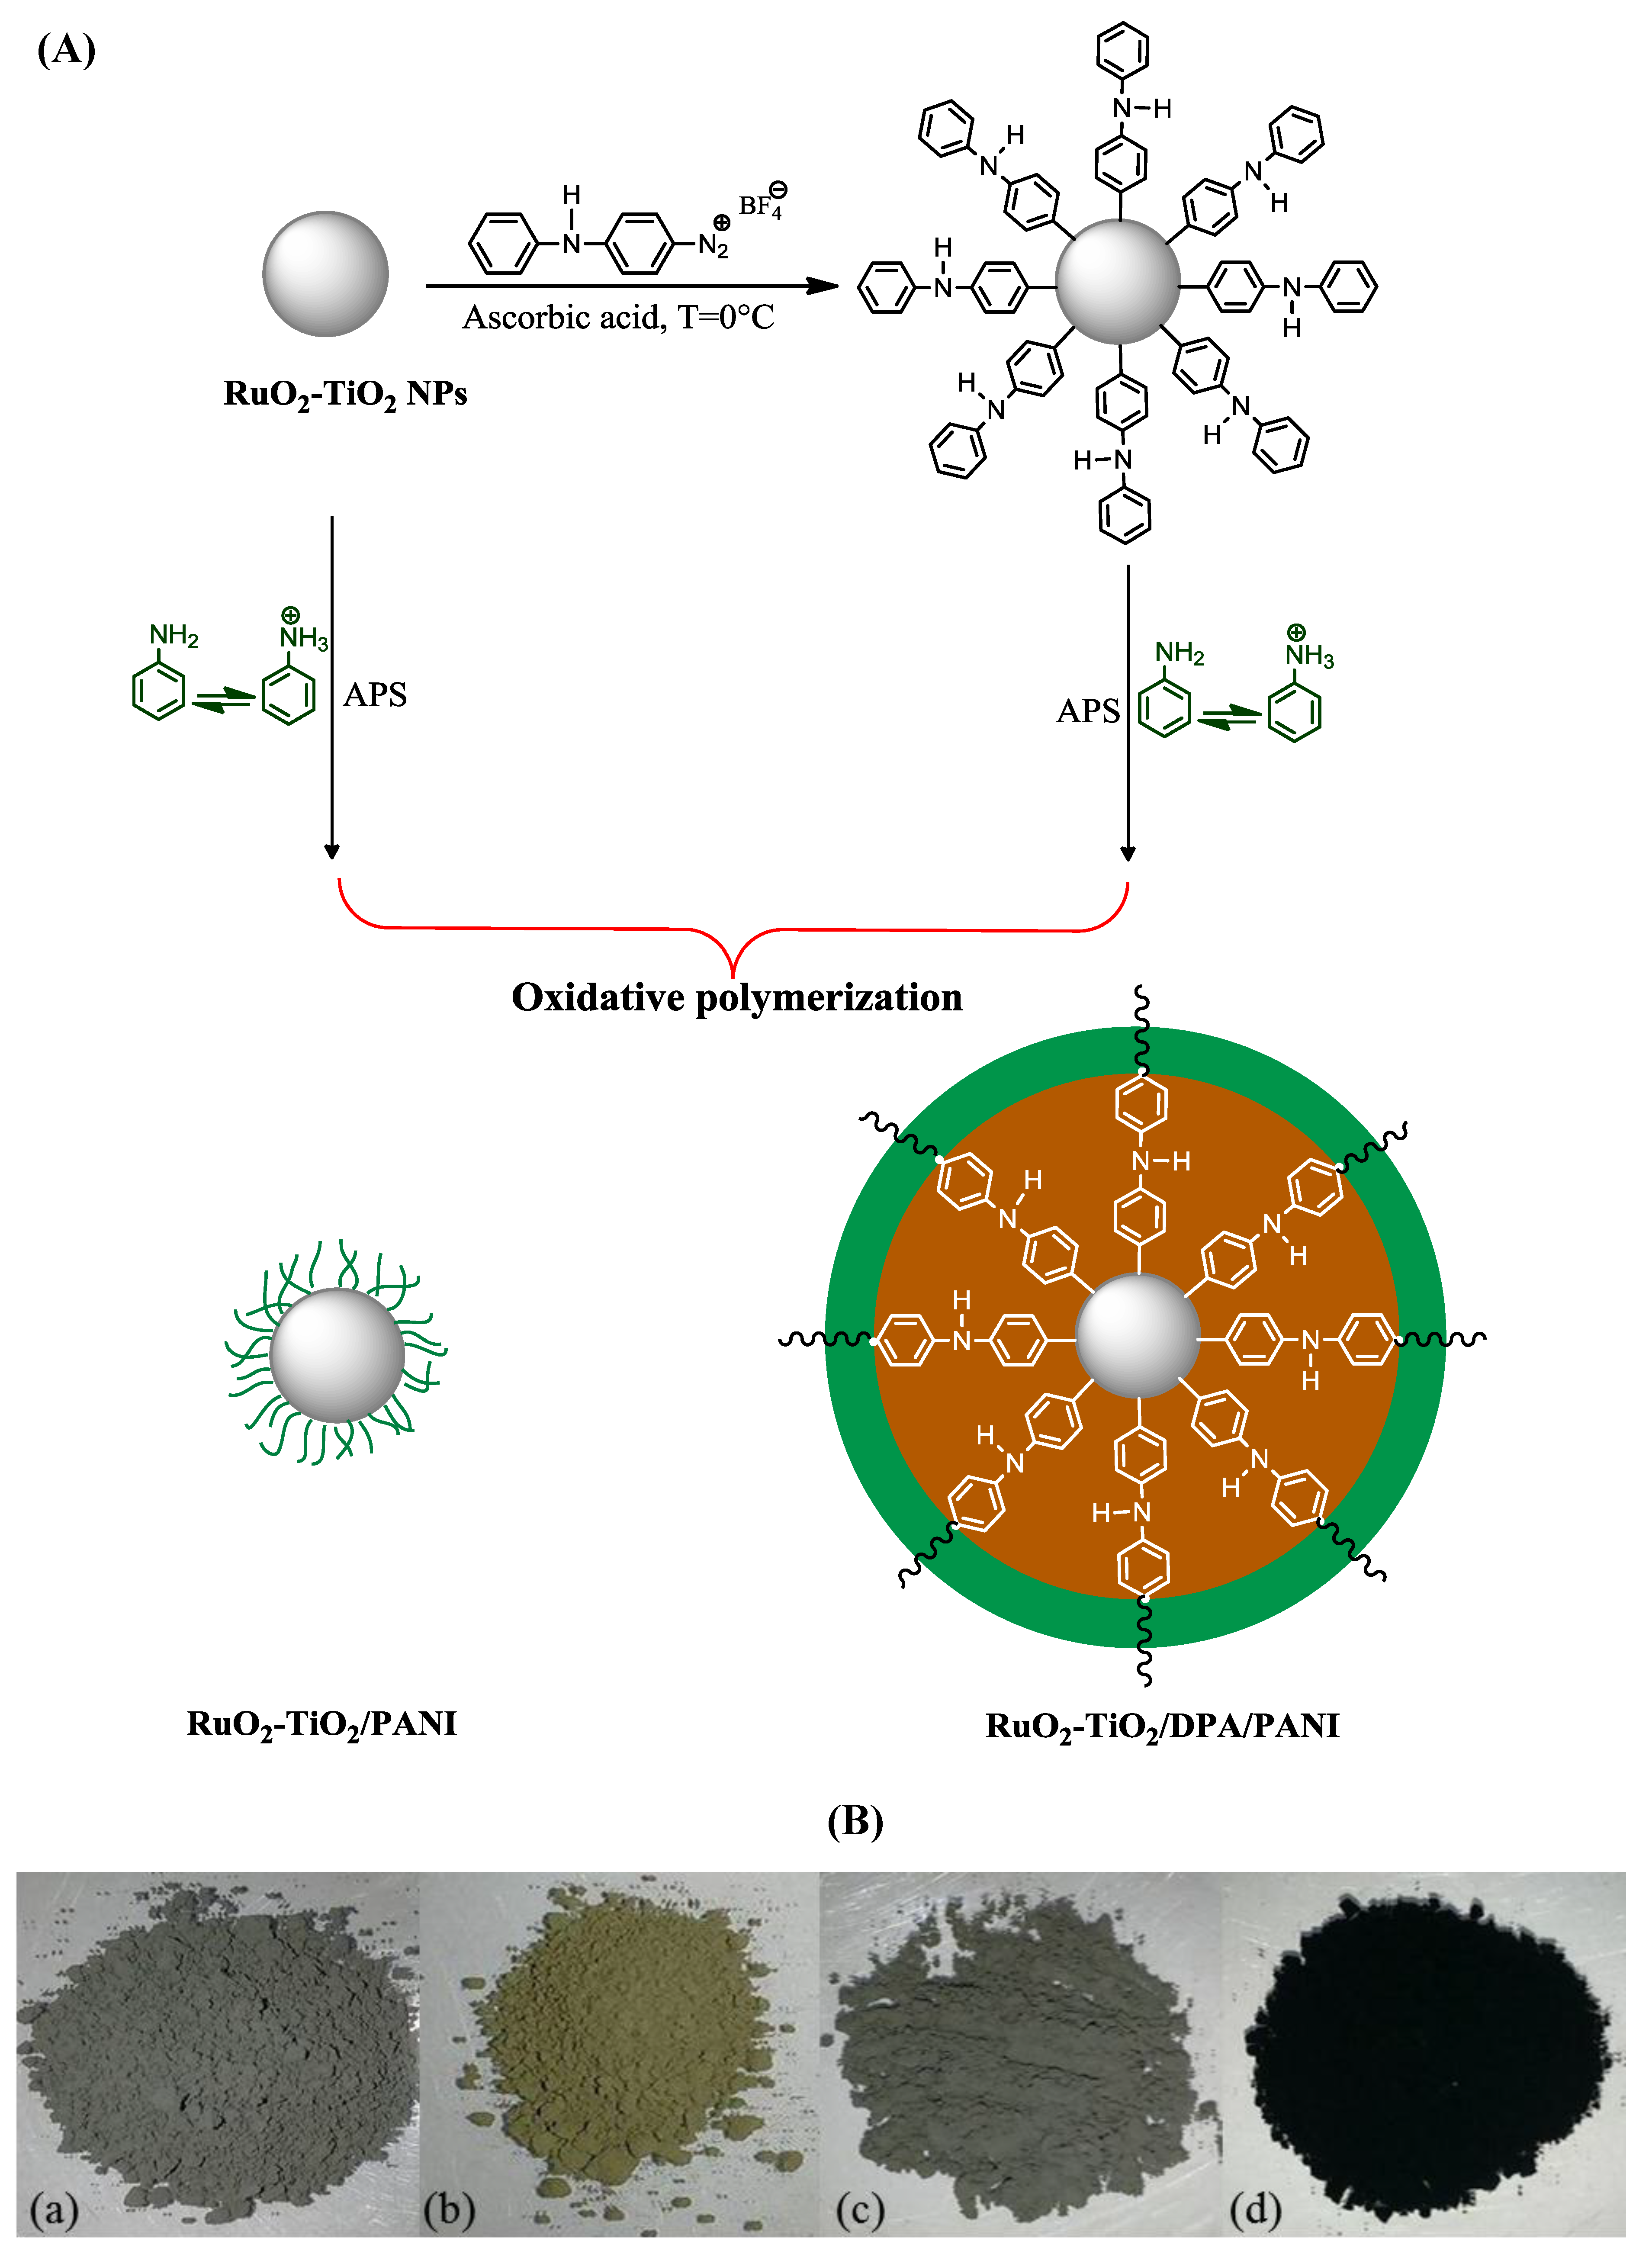
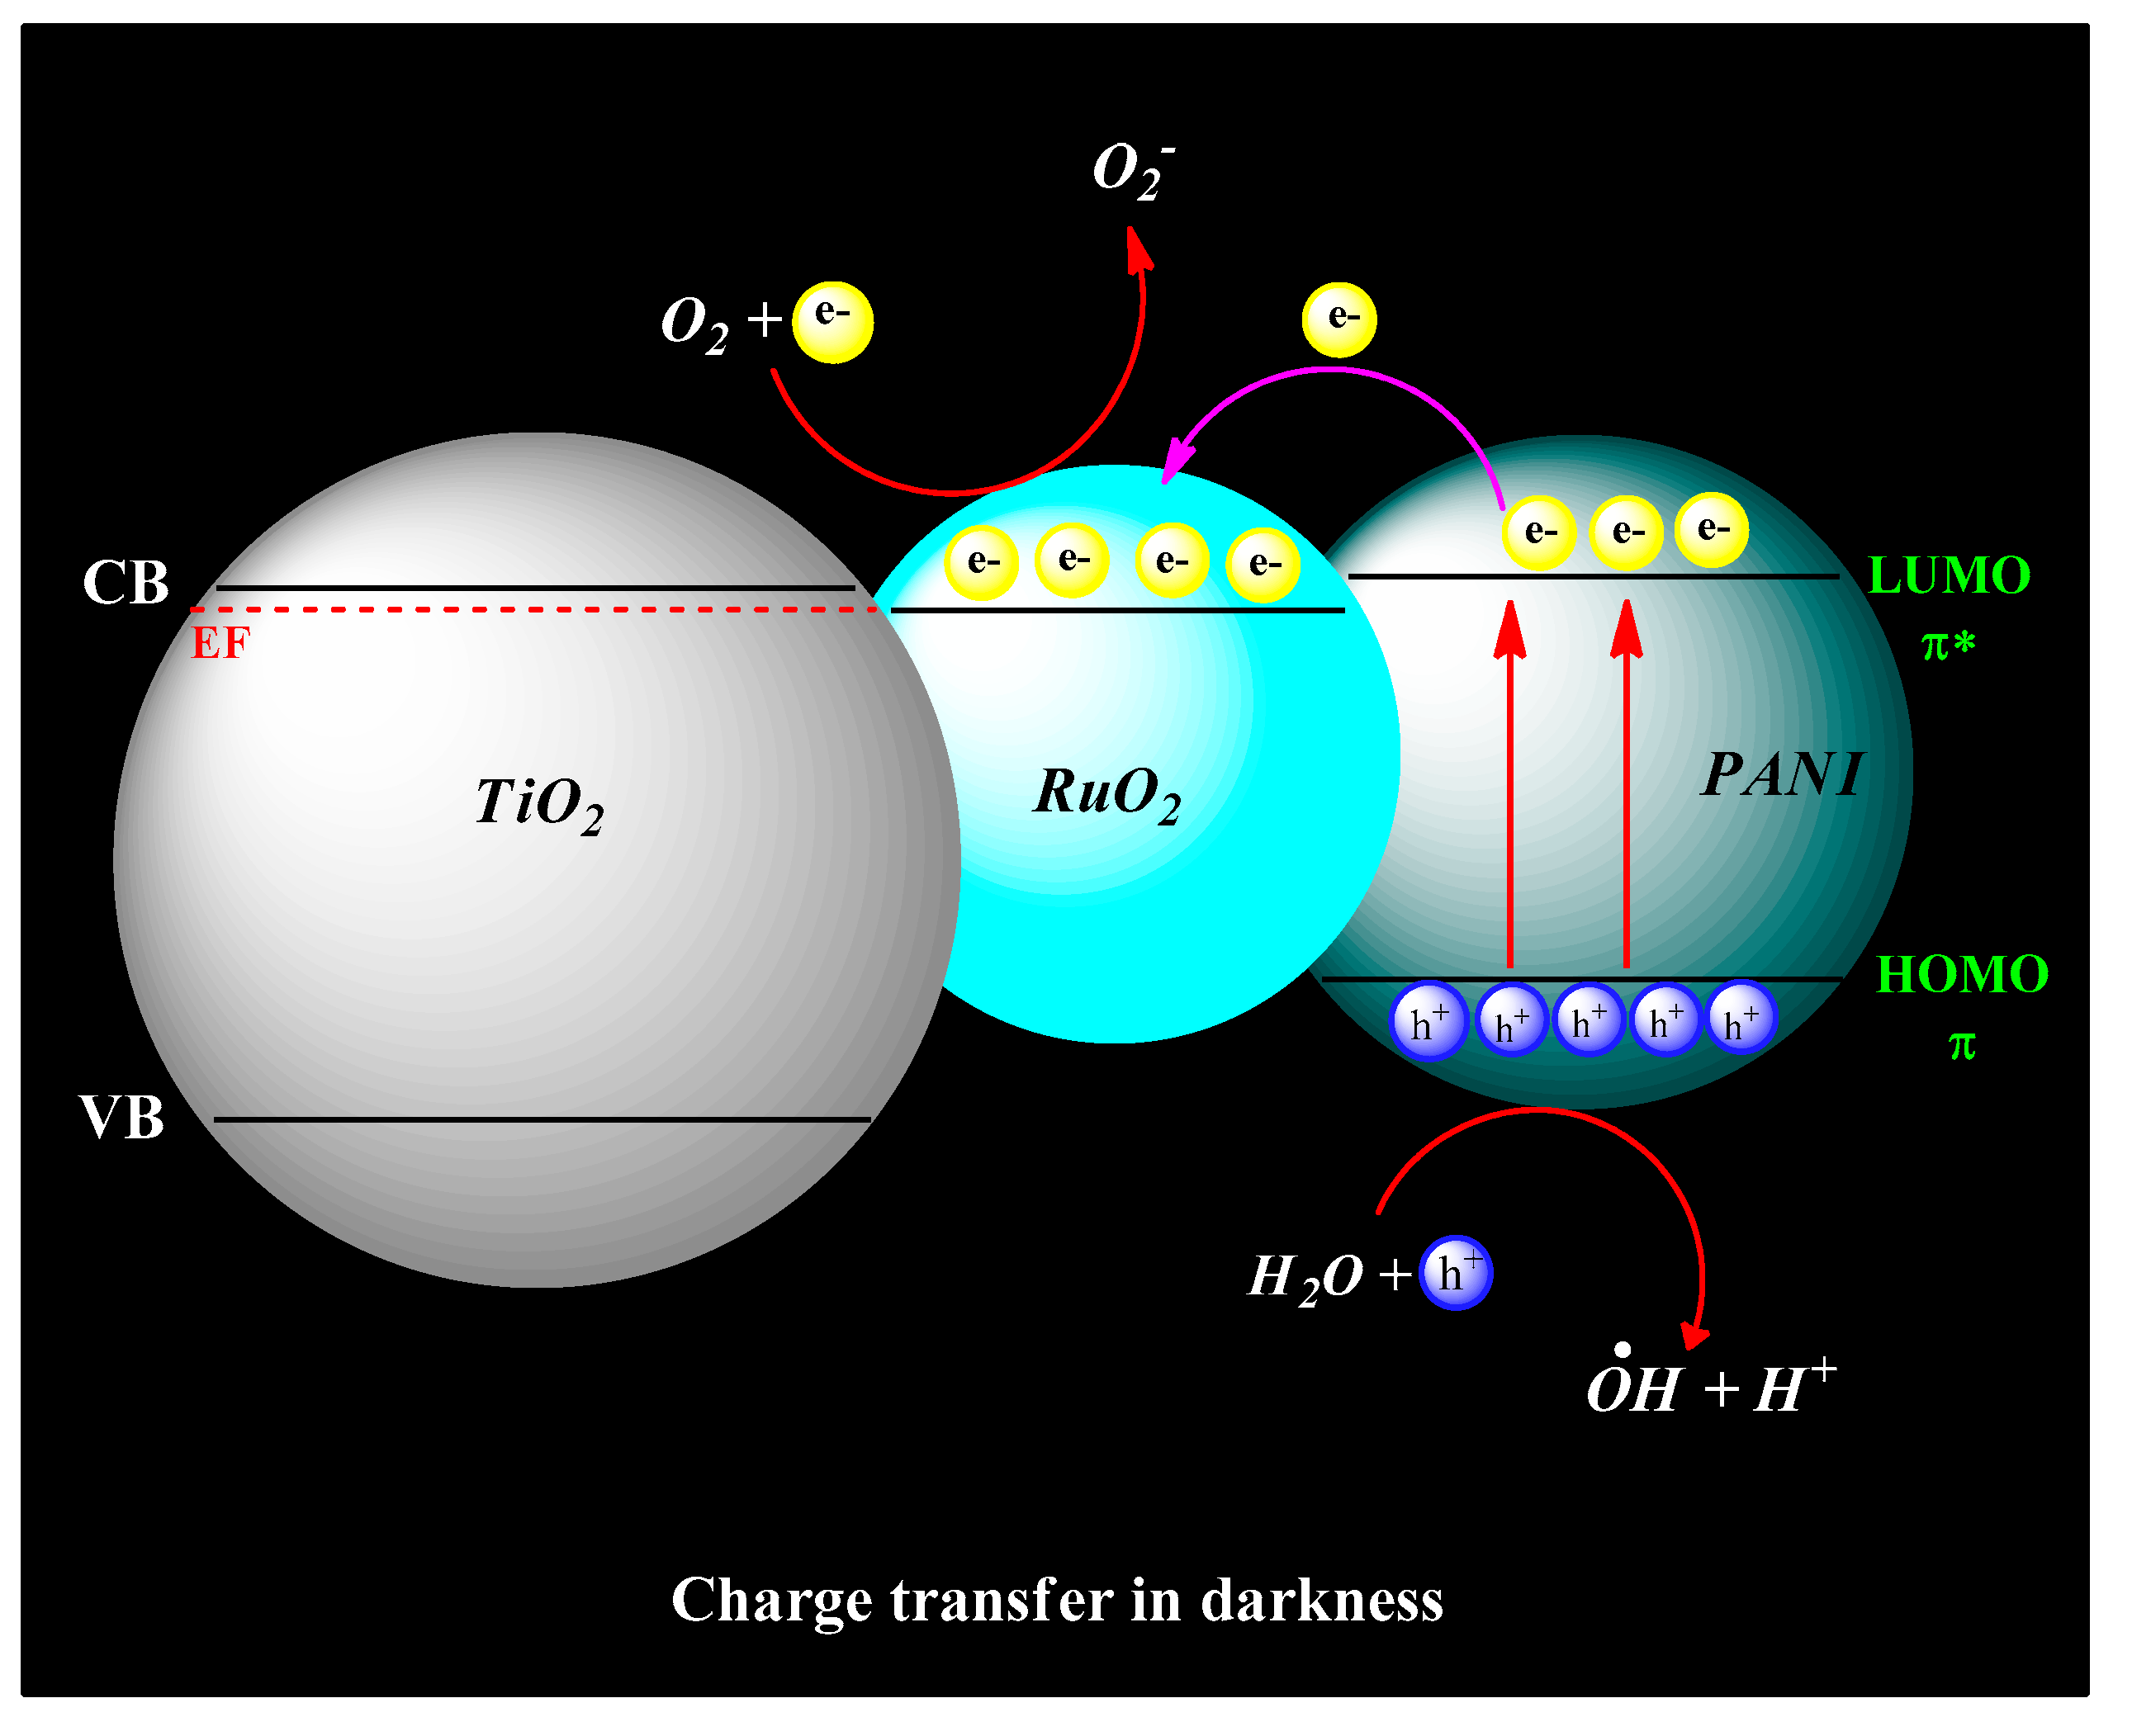
2.1. General Strategy of Designing RuO2-TiO2/PANI Nanocomposites
2.2. RuO2-TiO2 Characterization
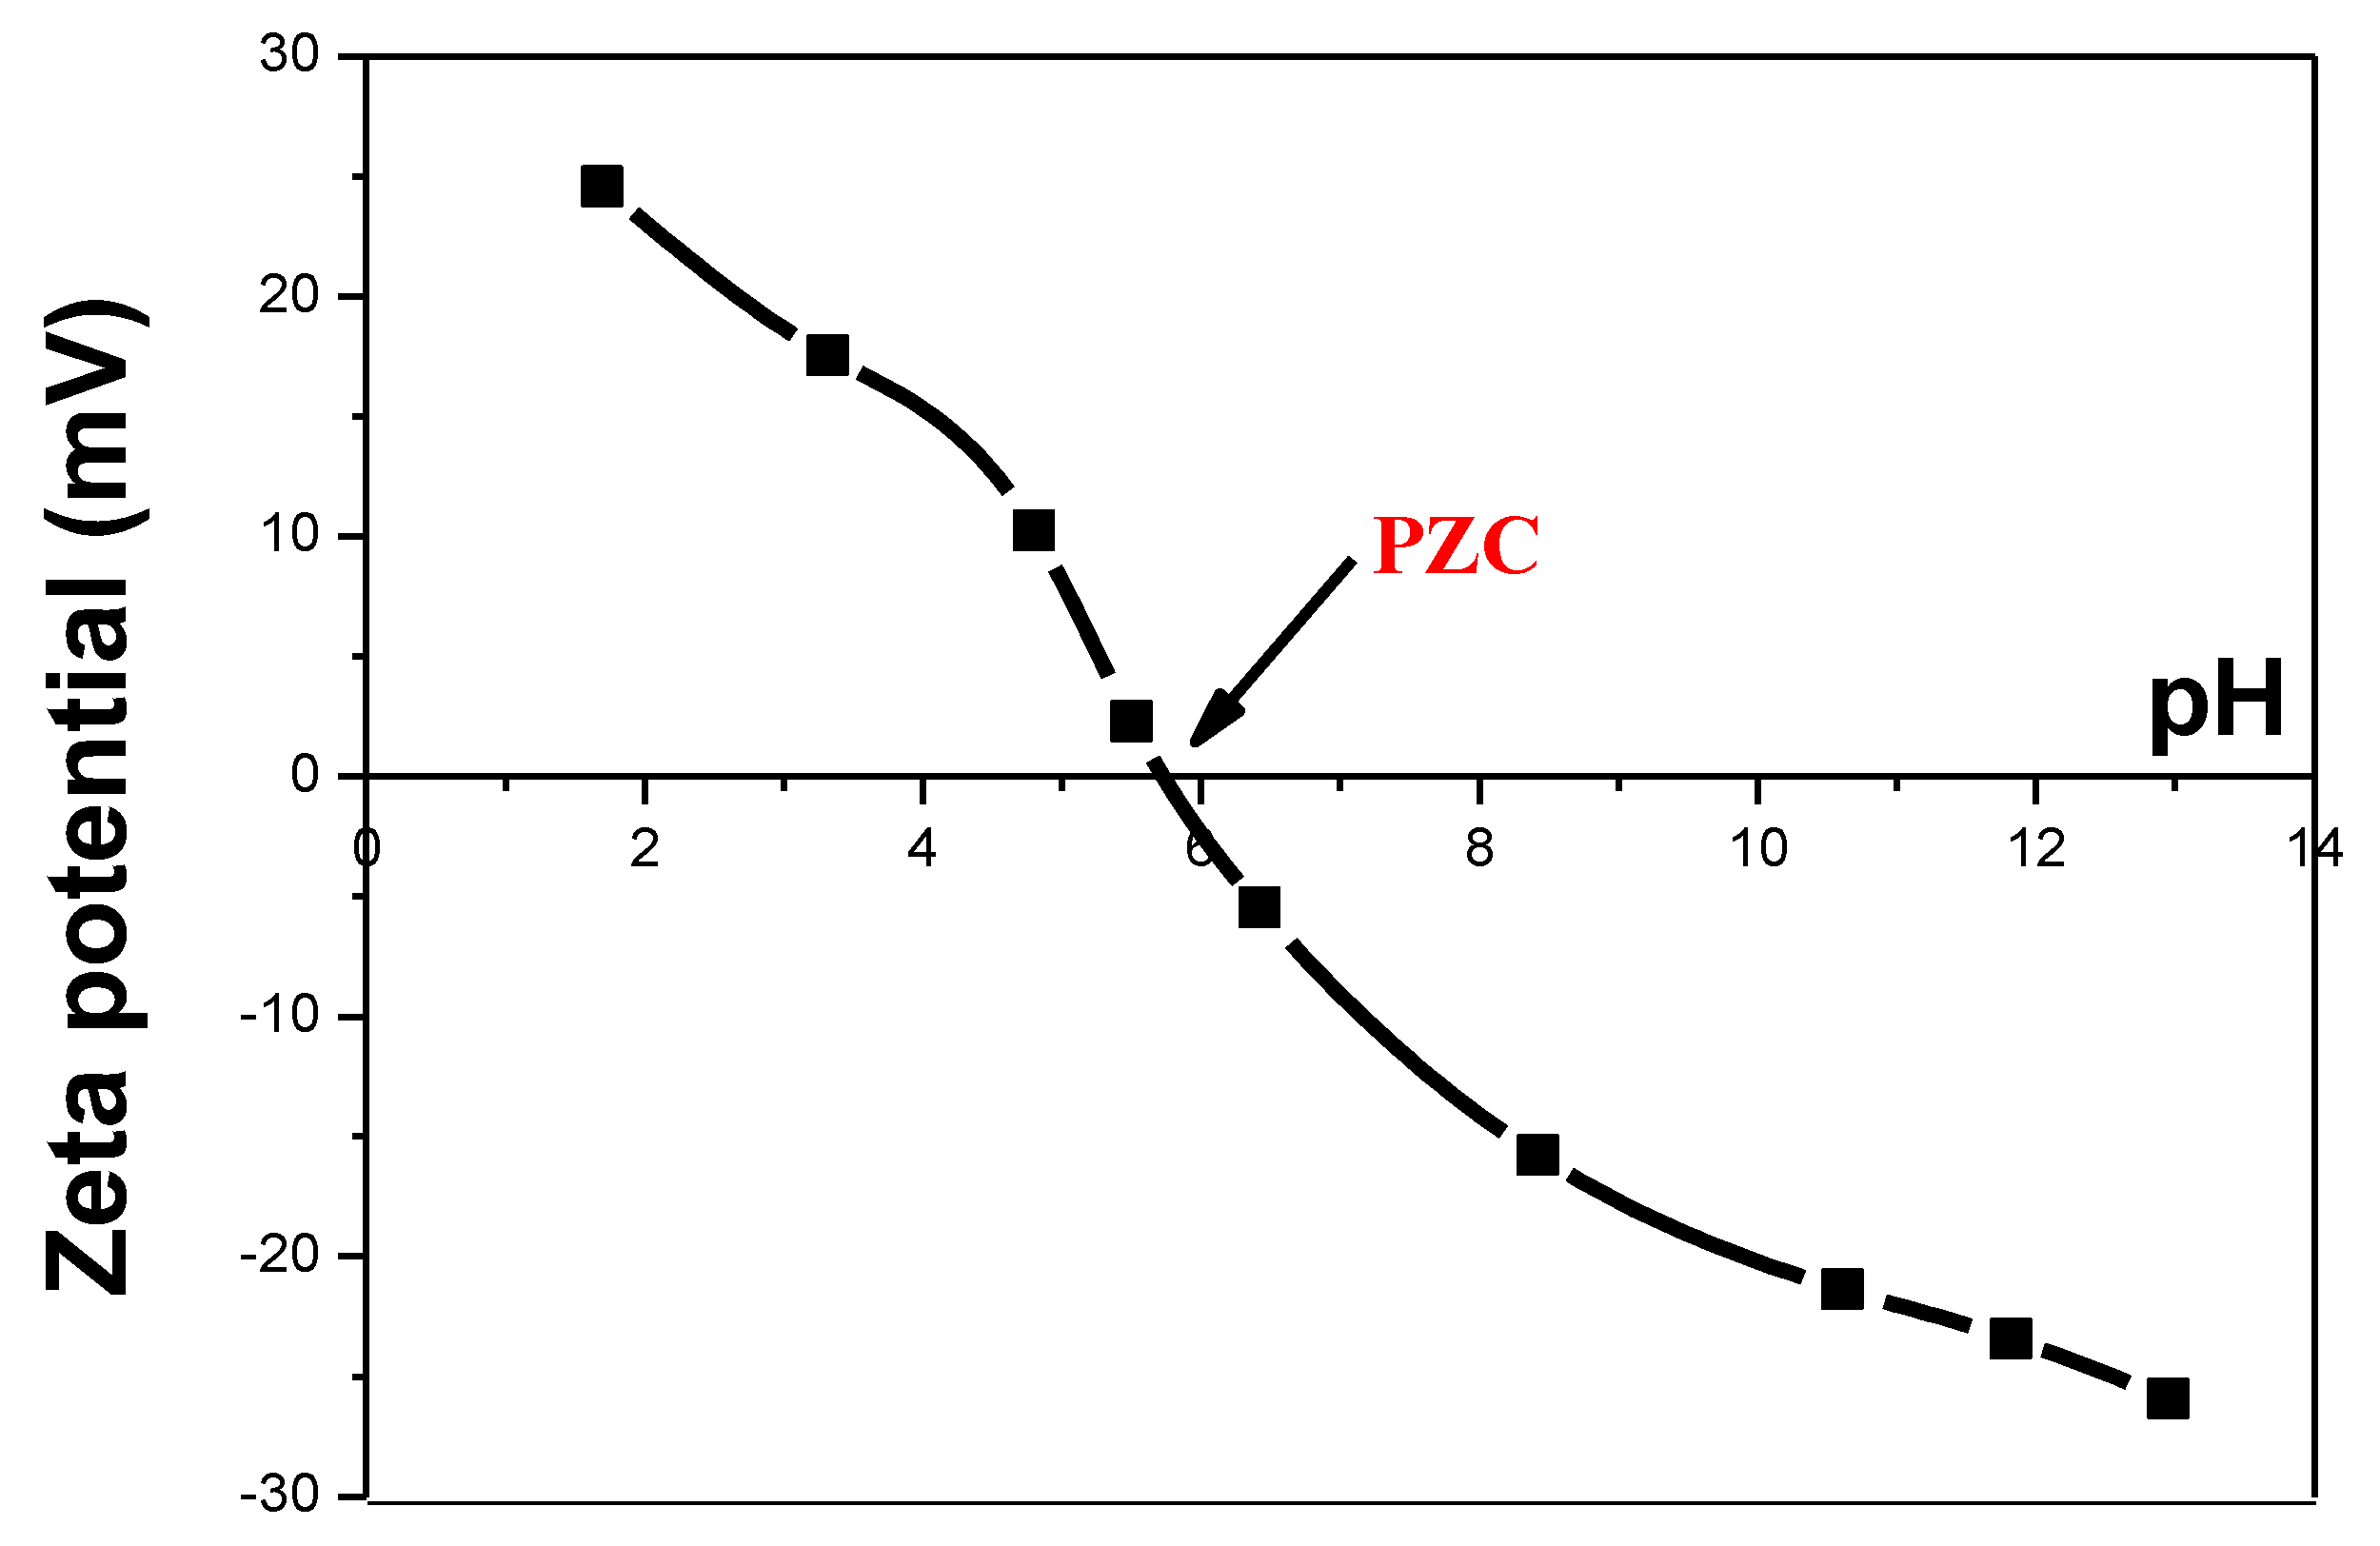
2.2.1. Point of Zero Charge (PZC) of RuO2-TiO2 by Zeta Potential Measurement
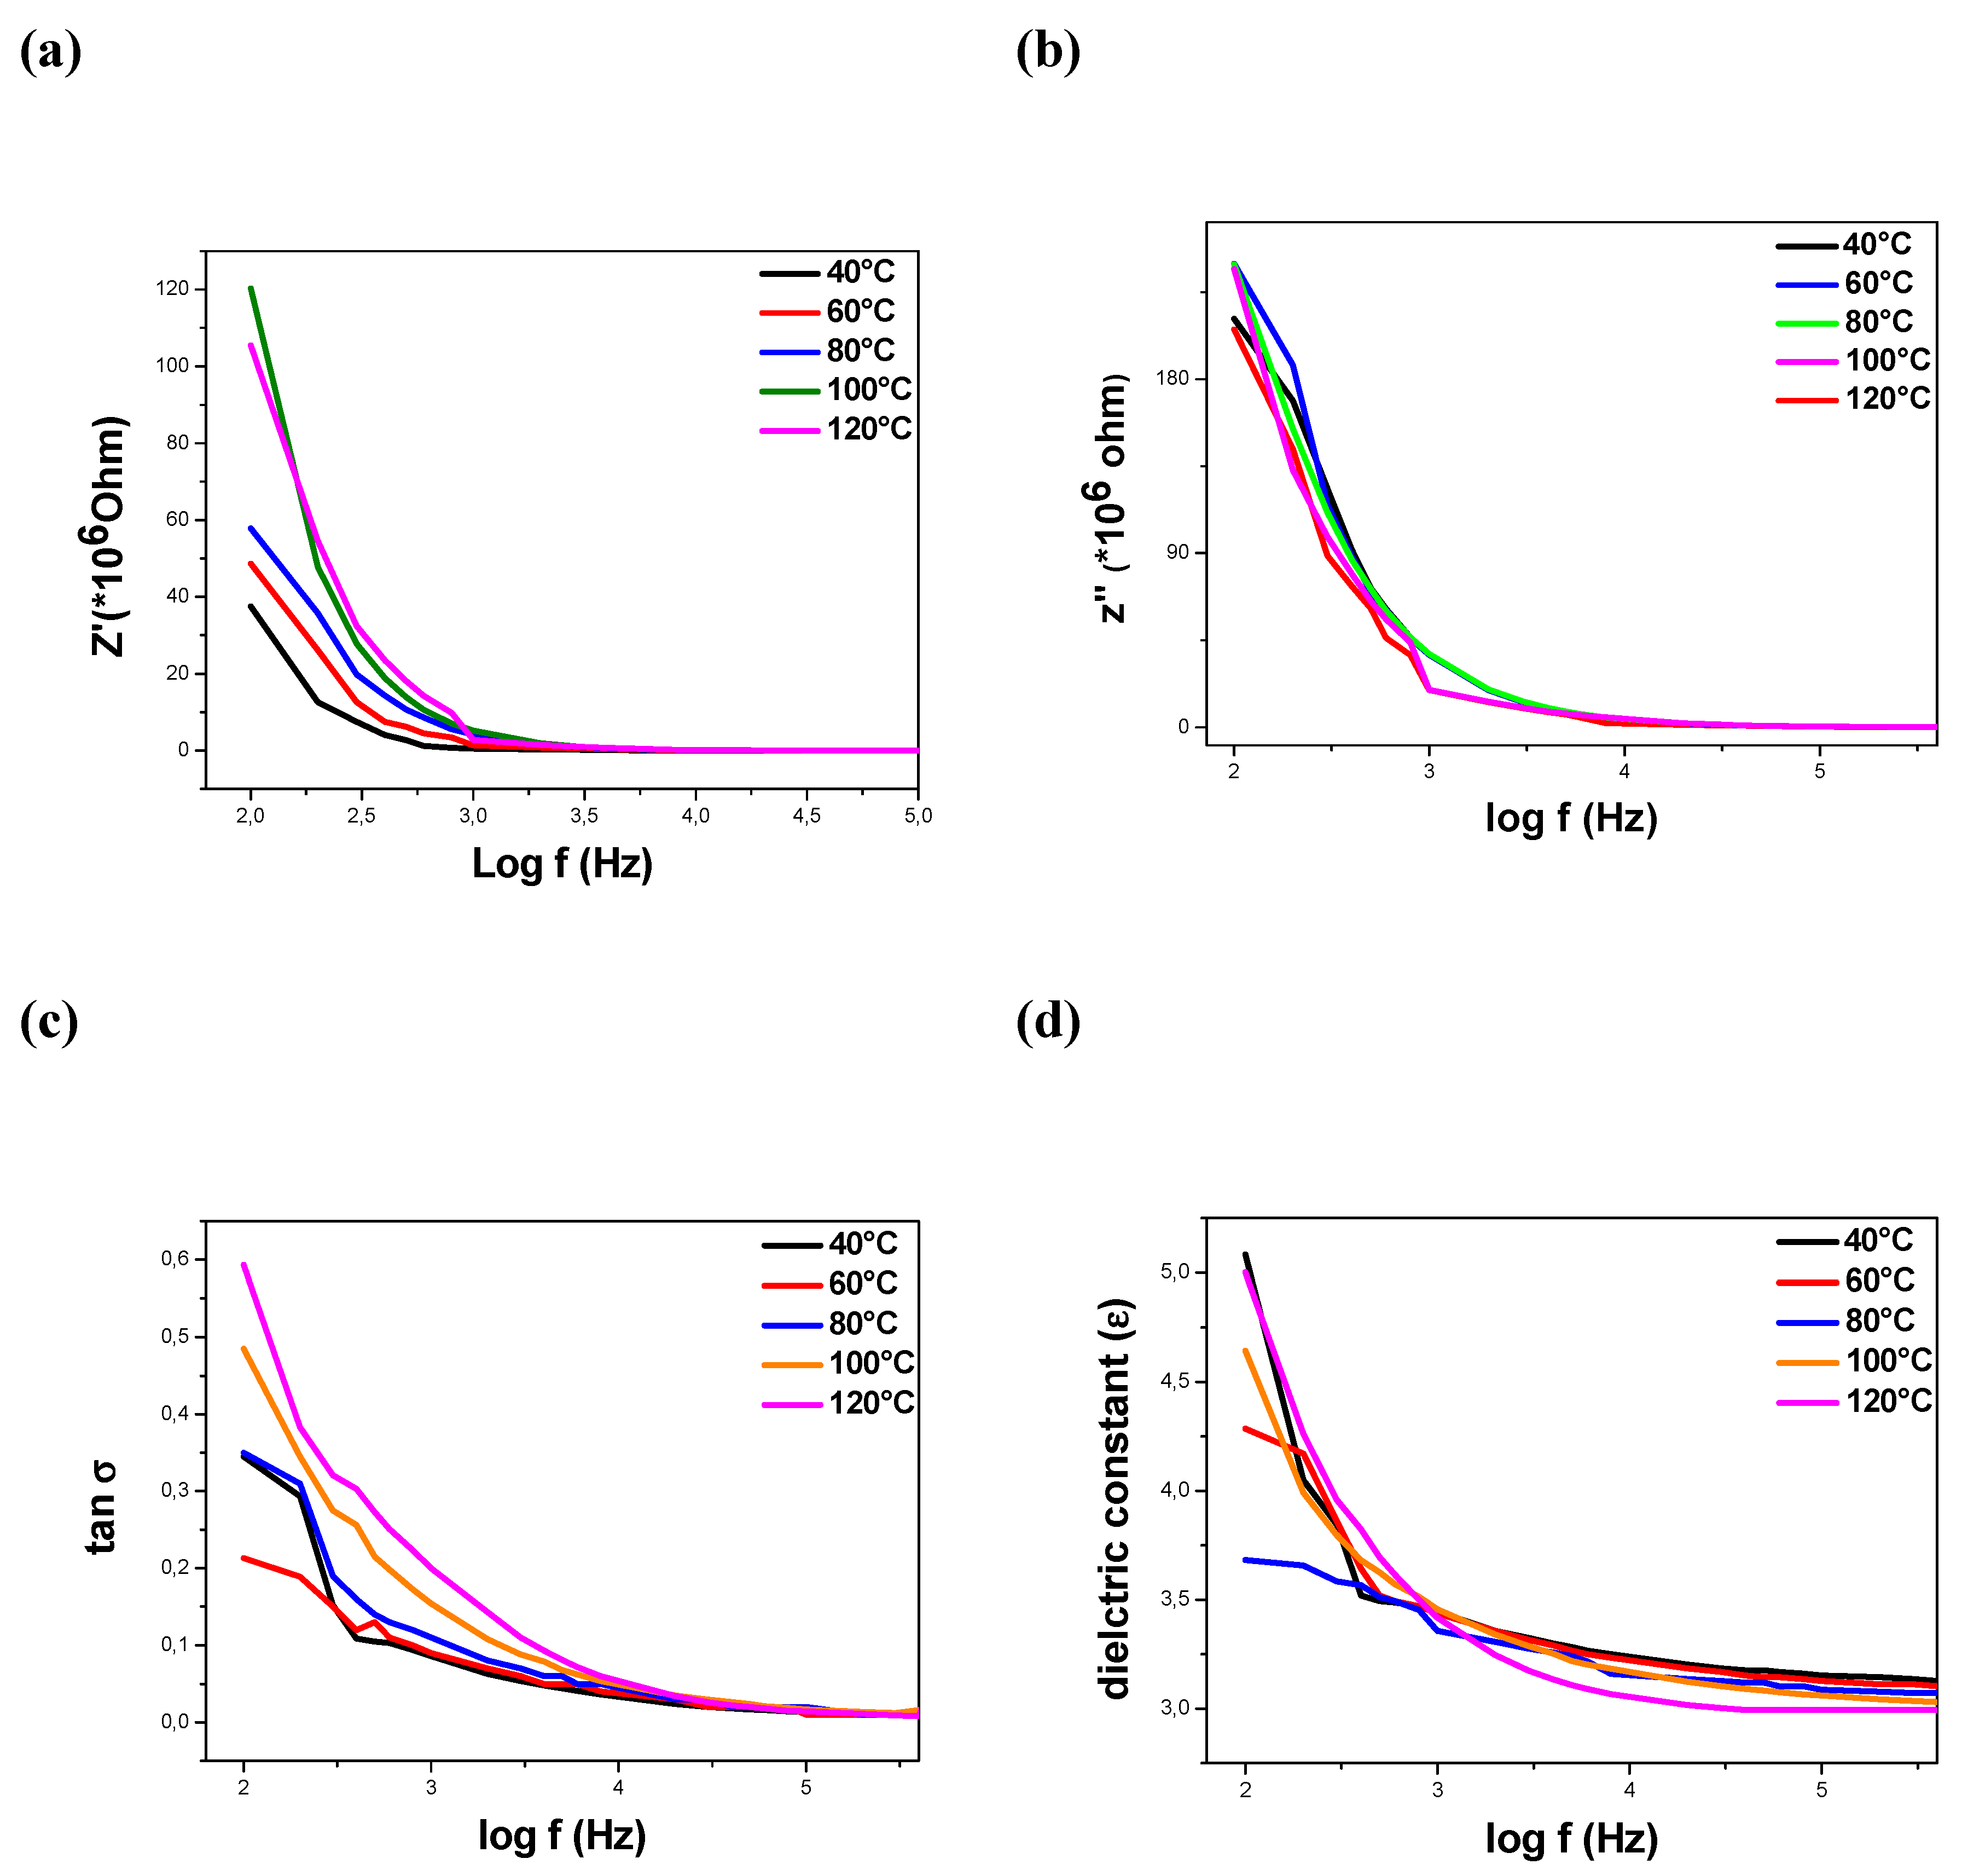
2.2.2. Dielectric Characterization
2.3. Characterization of RuO2-TiO2/PANI Nanocomposites
2.3.1. Resistivity by Four Point Probe Measurements
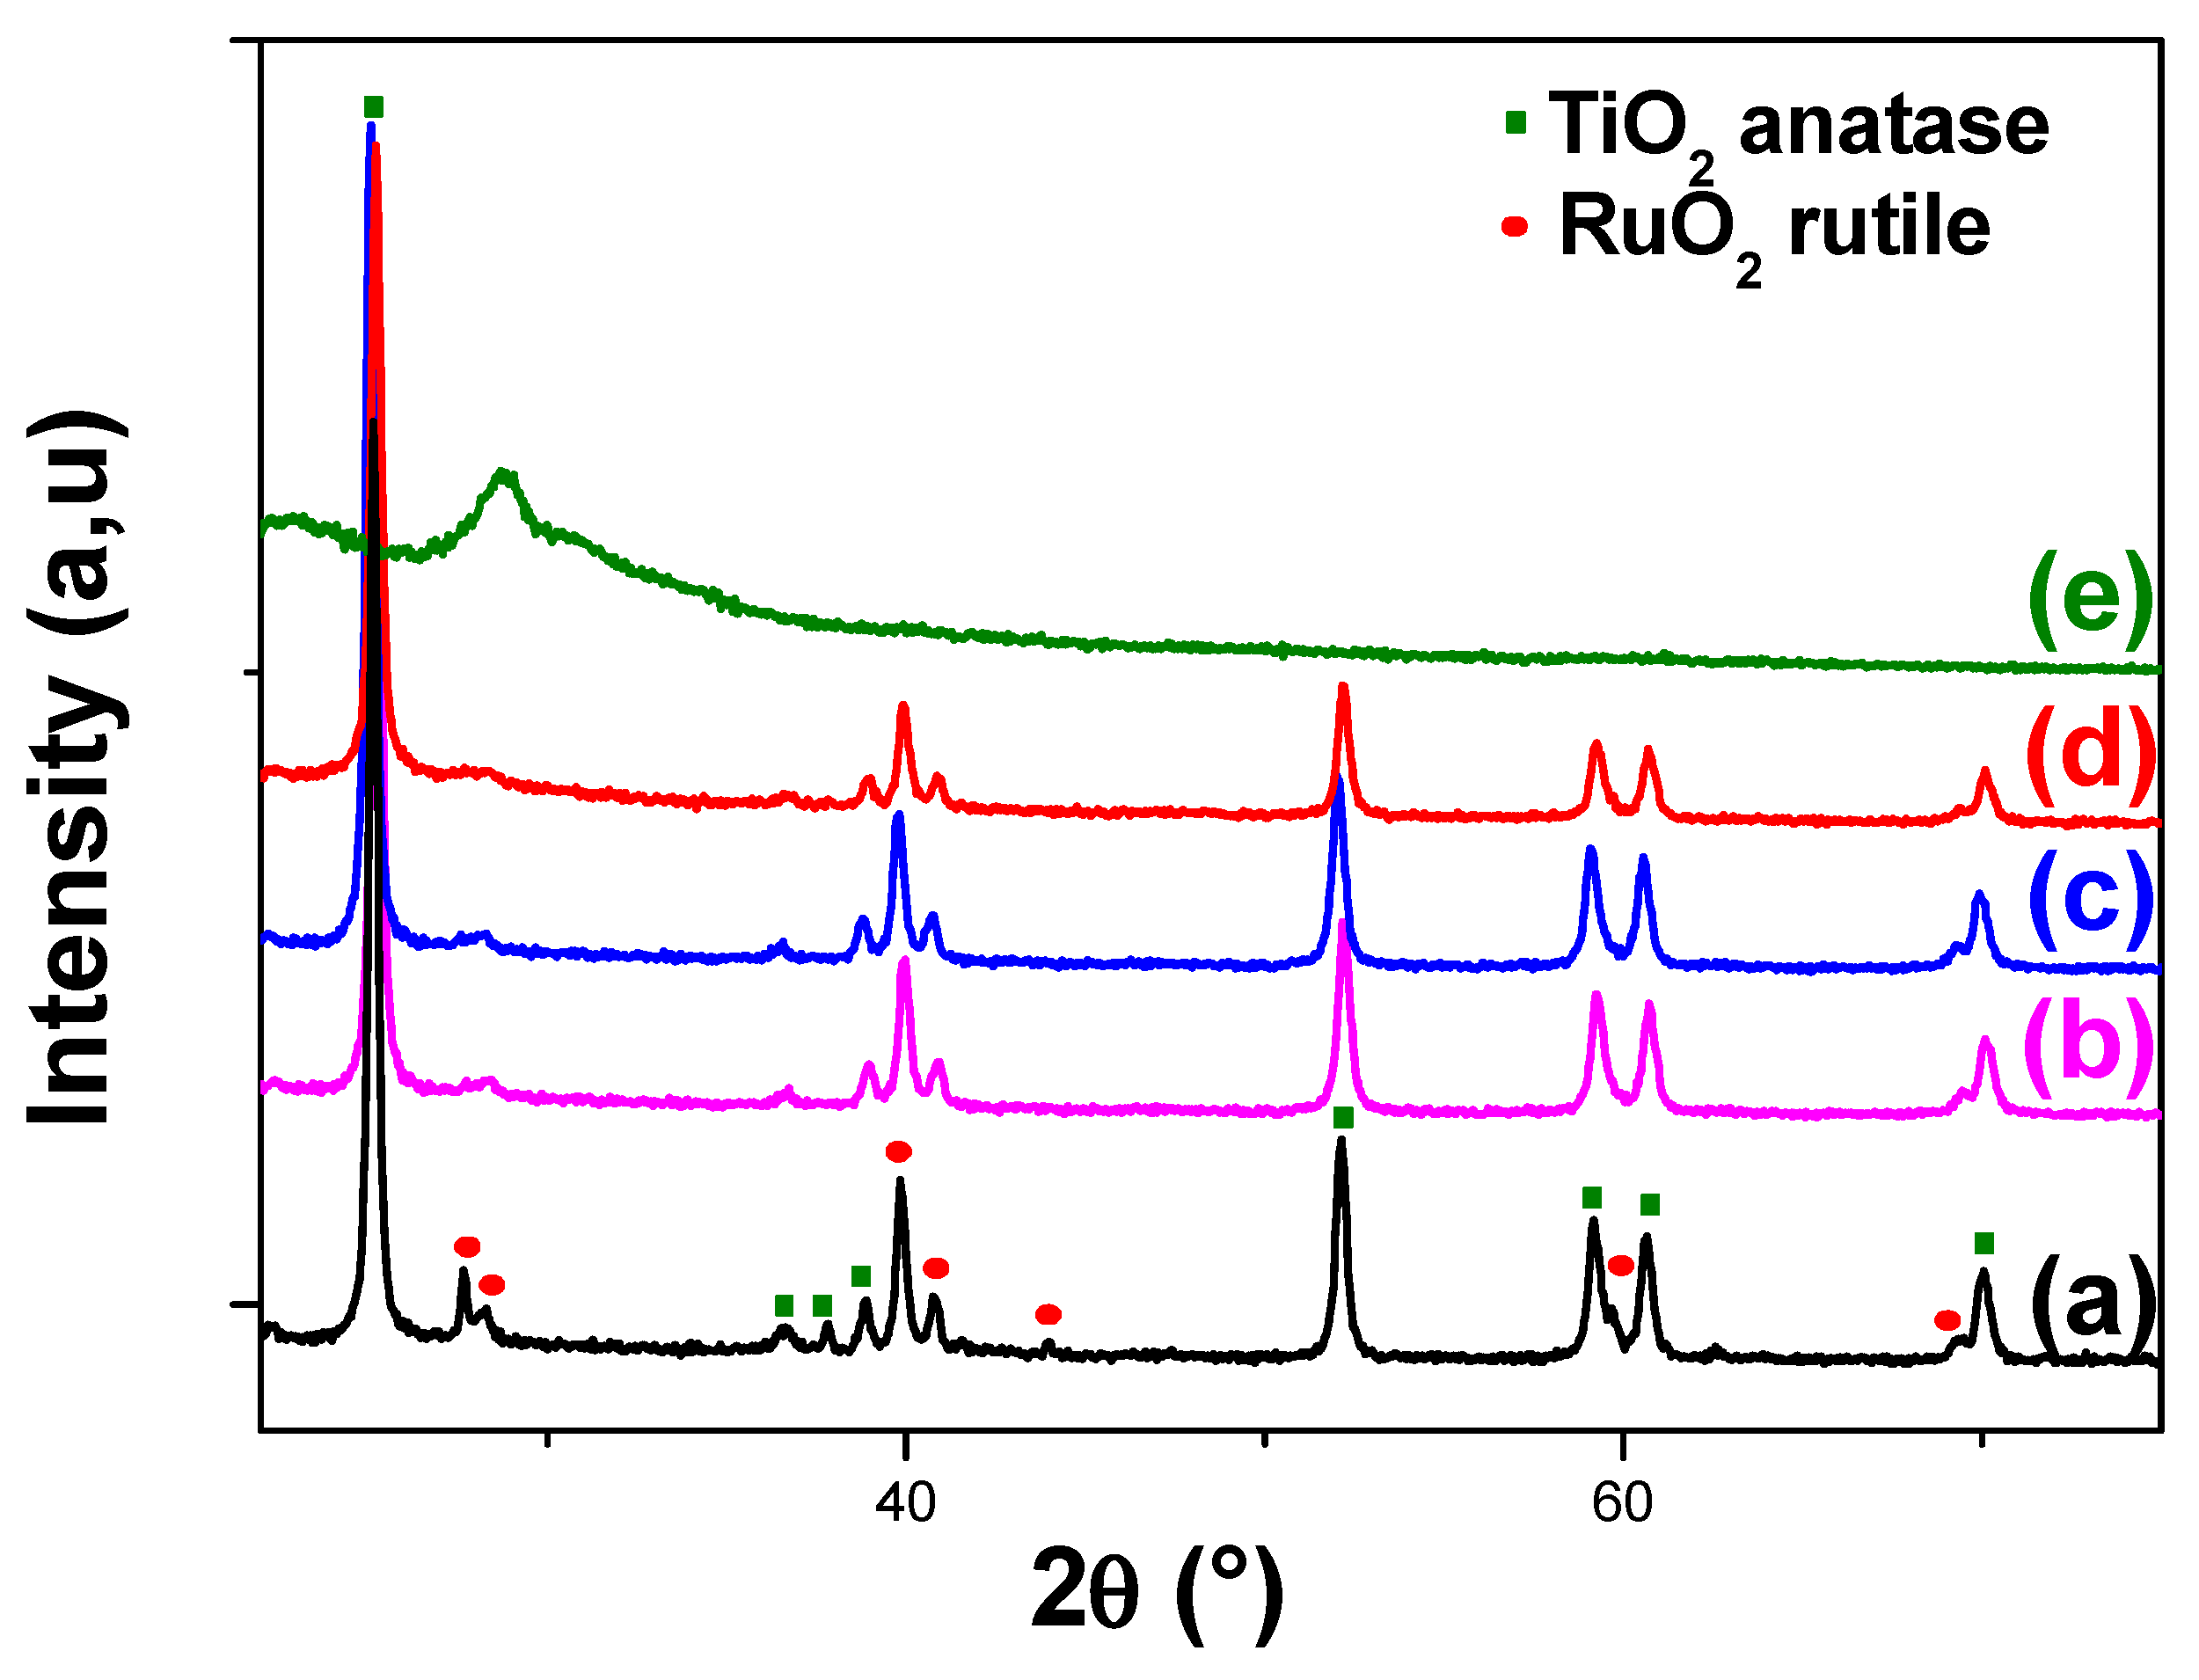
2.3.2. X-Ray Diffraction
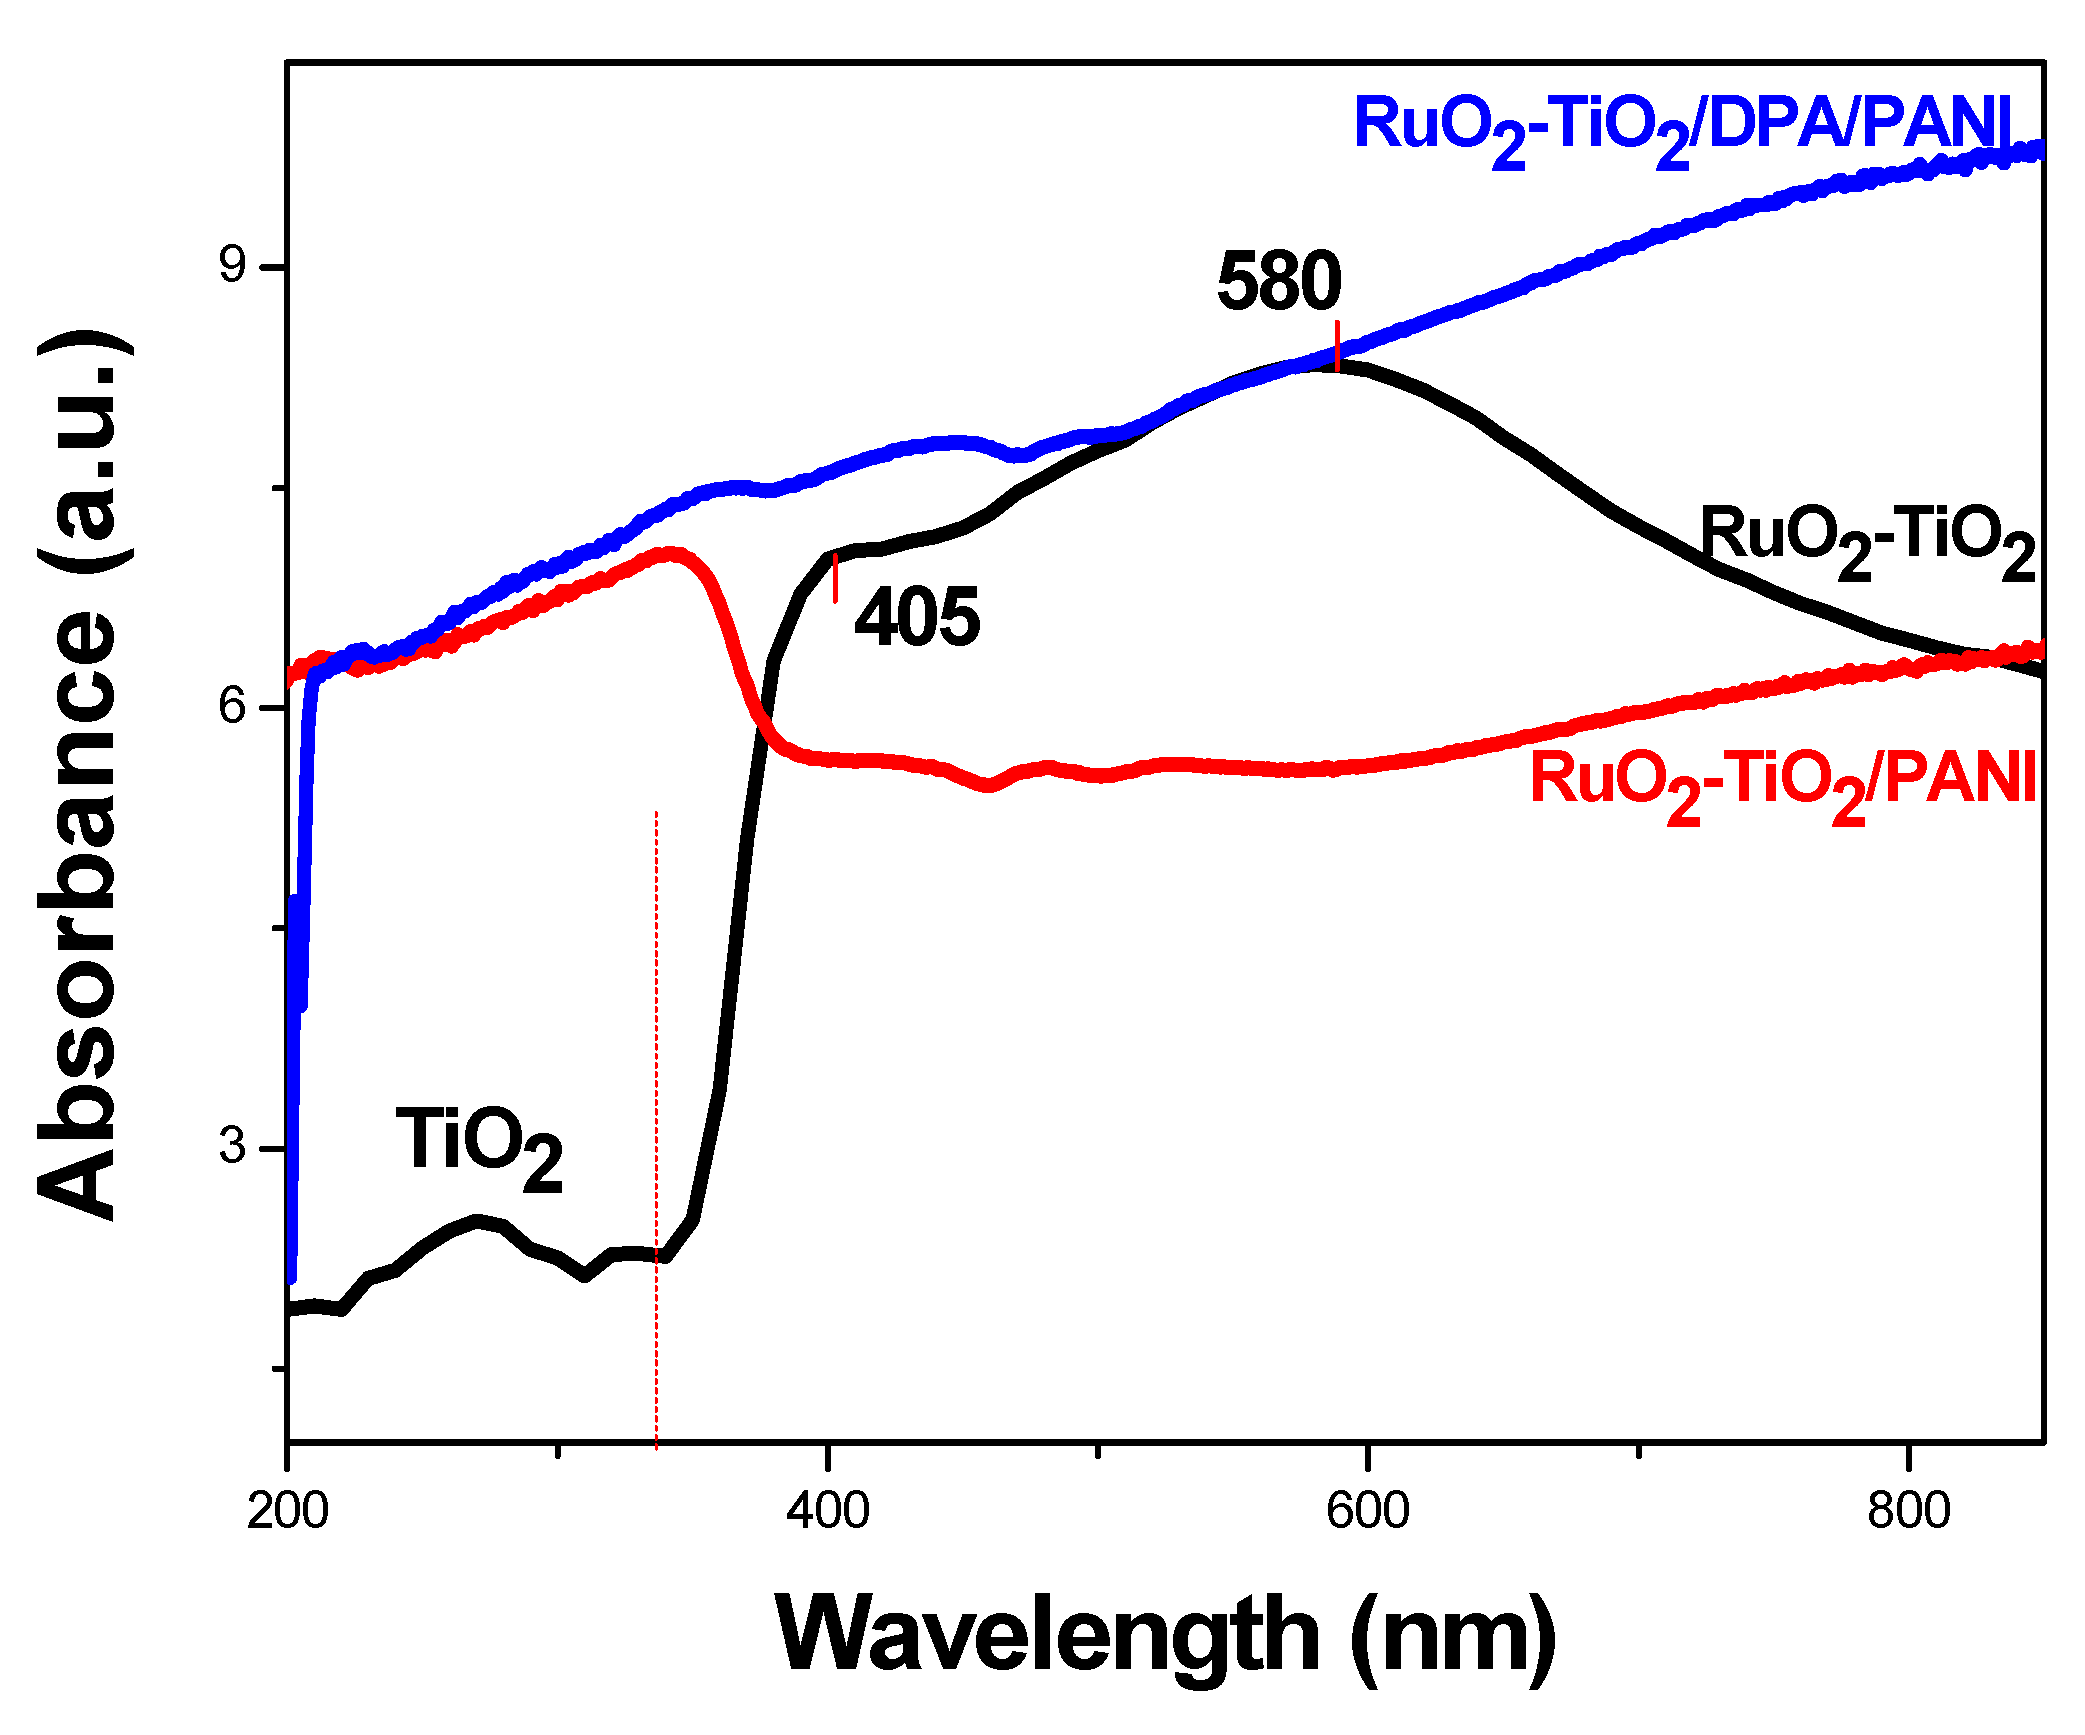
2.3.3. UV-vis
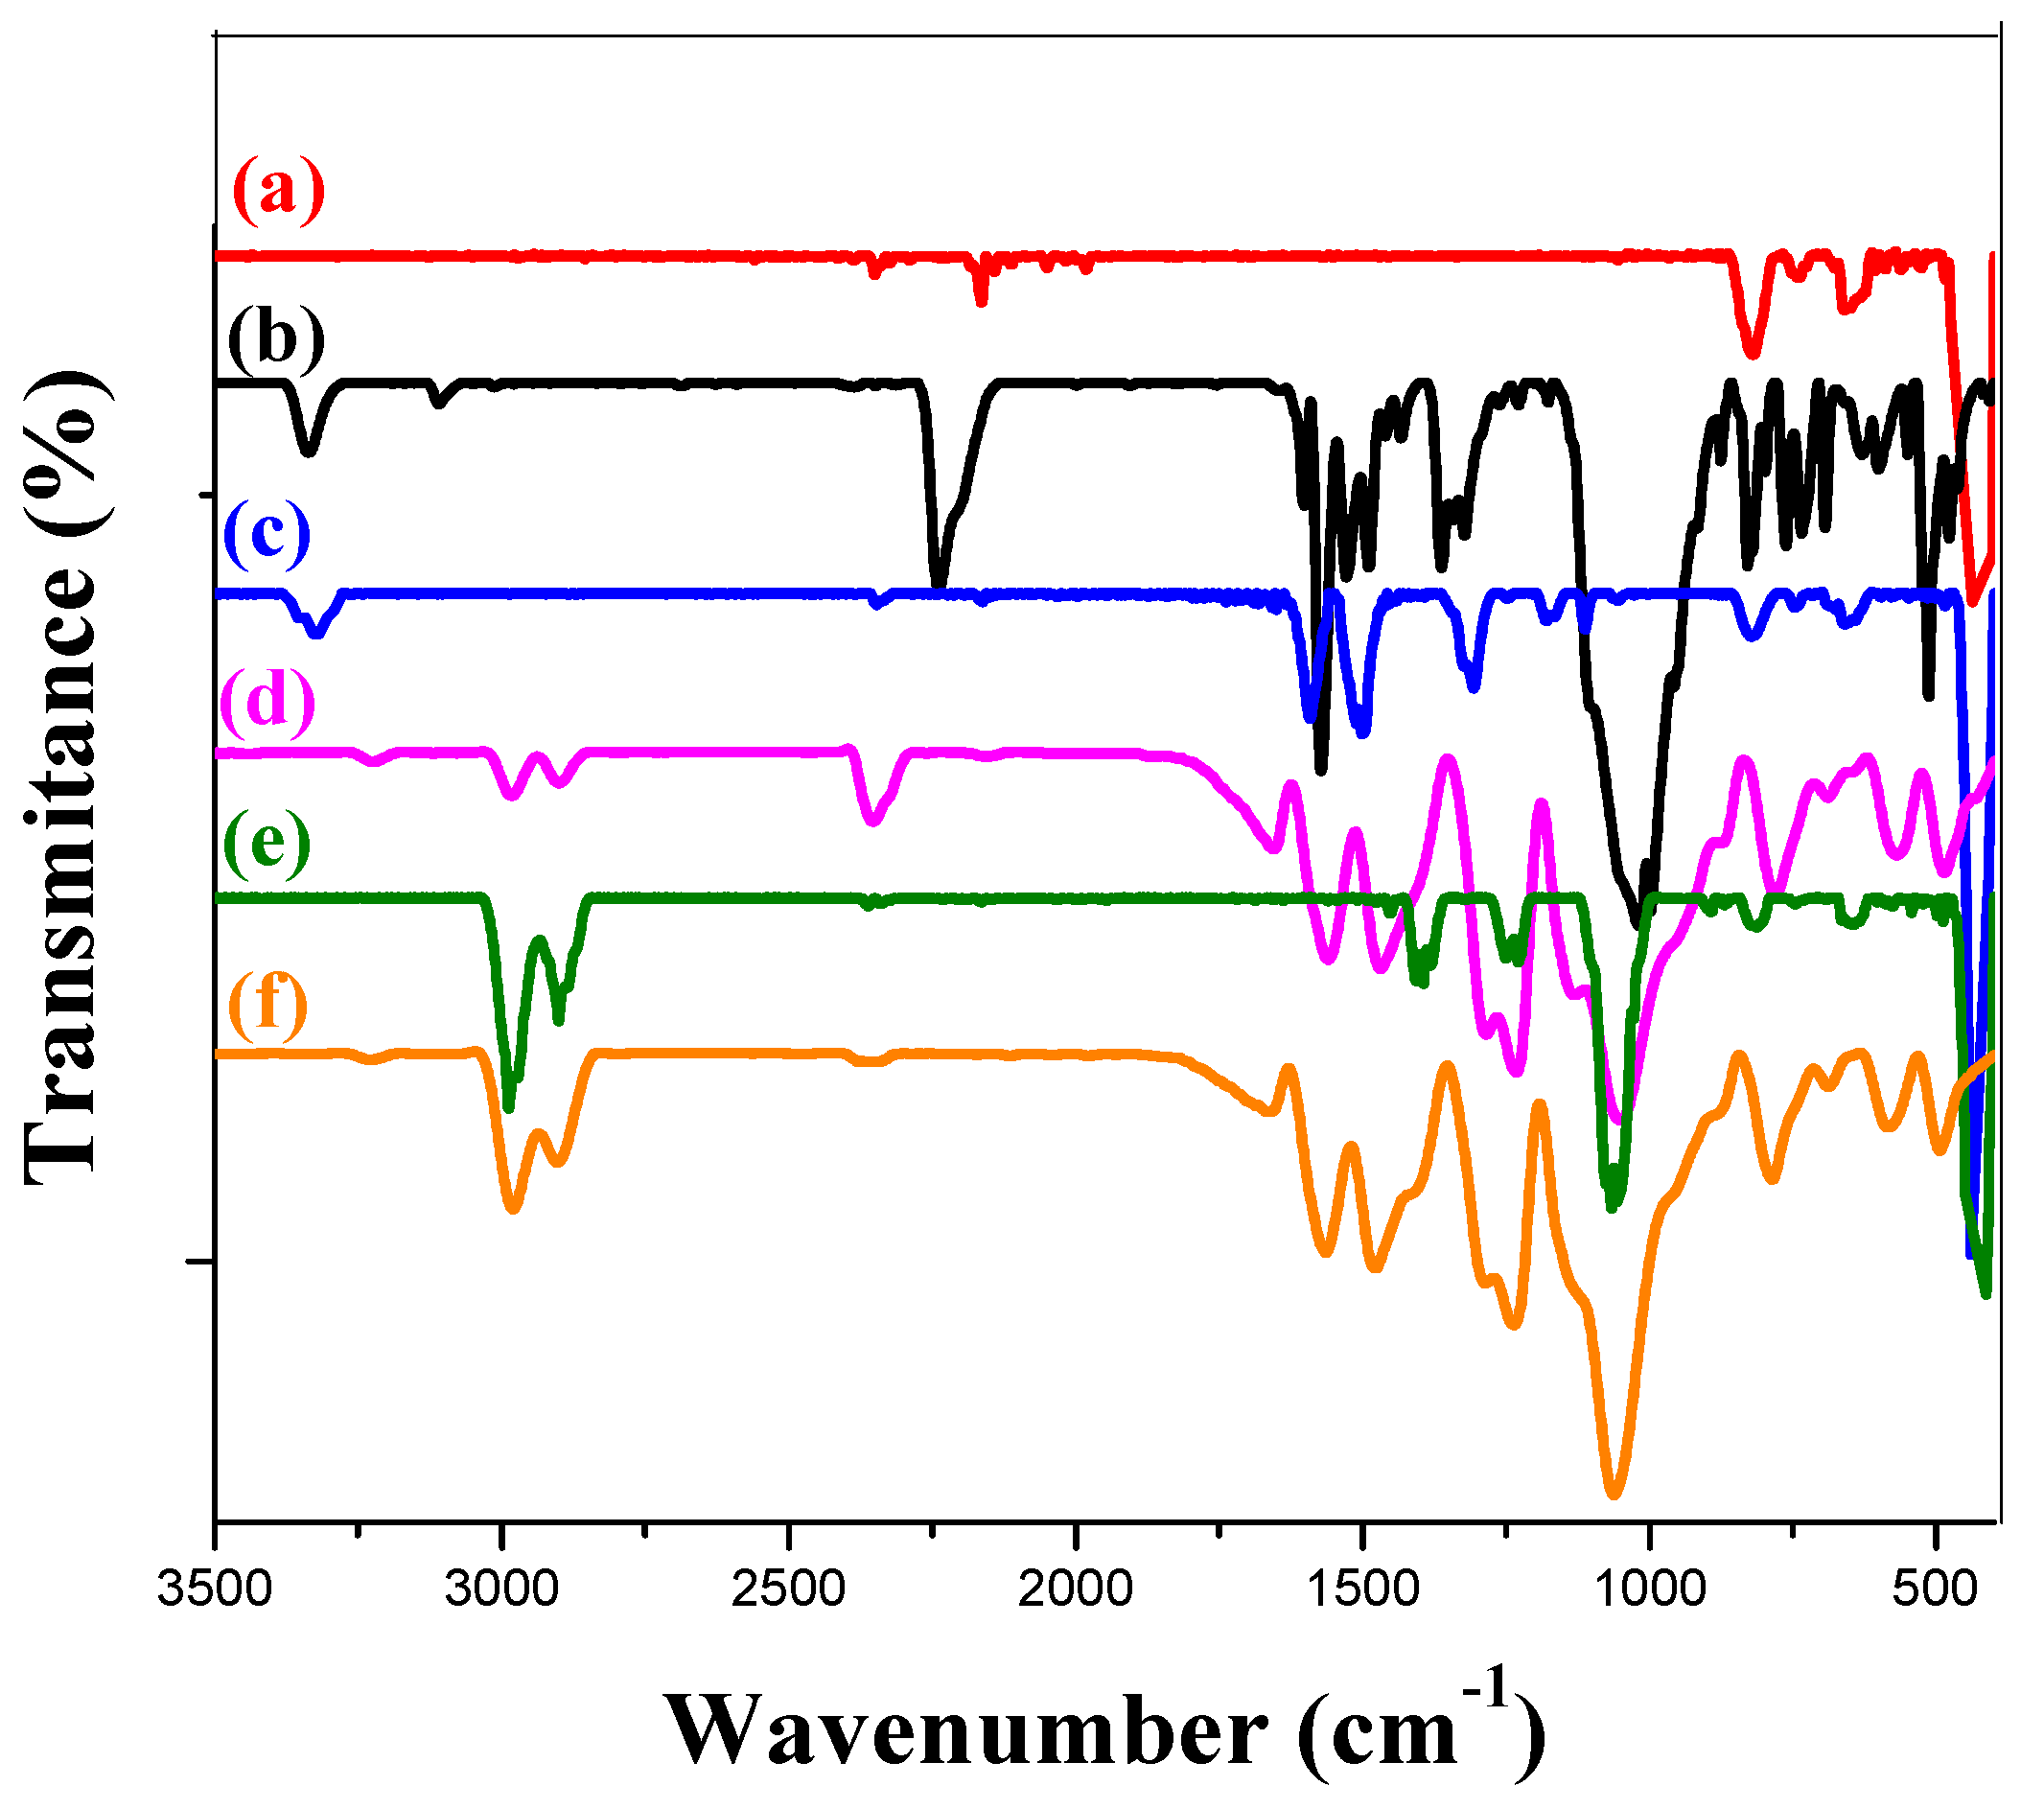
2.3.4. Infrared Spectroscopy
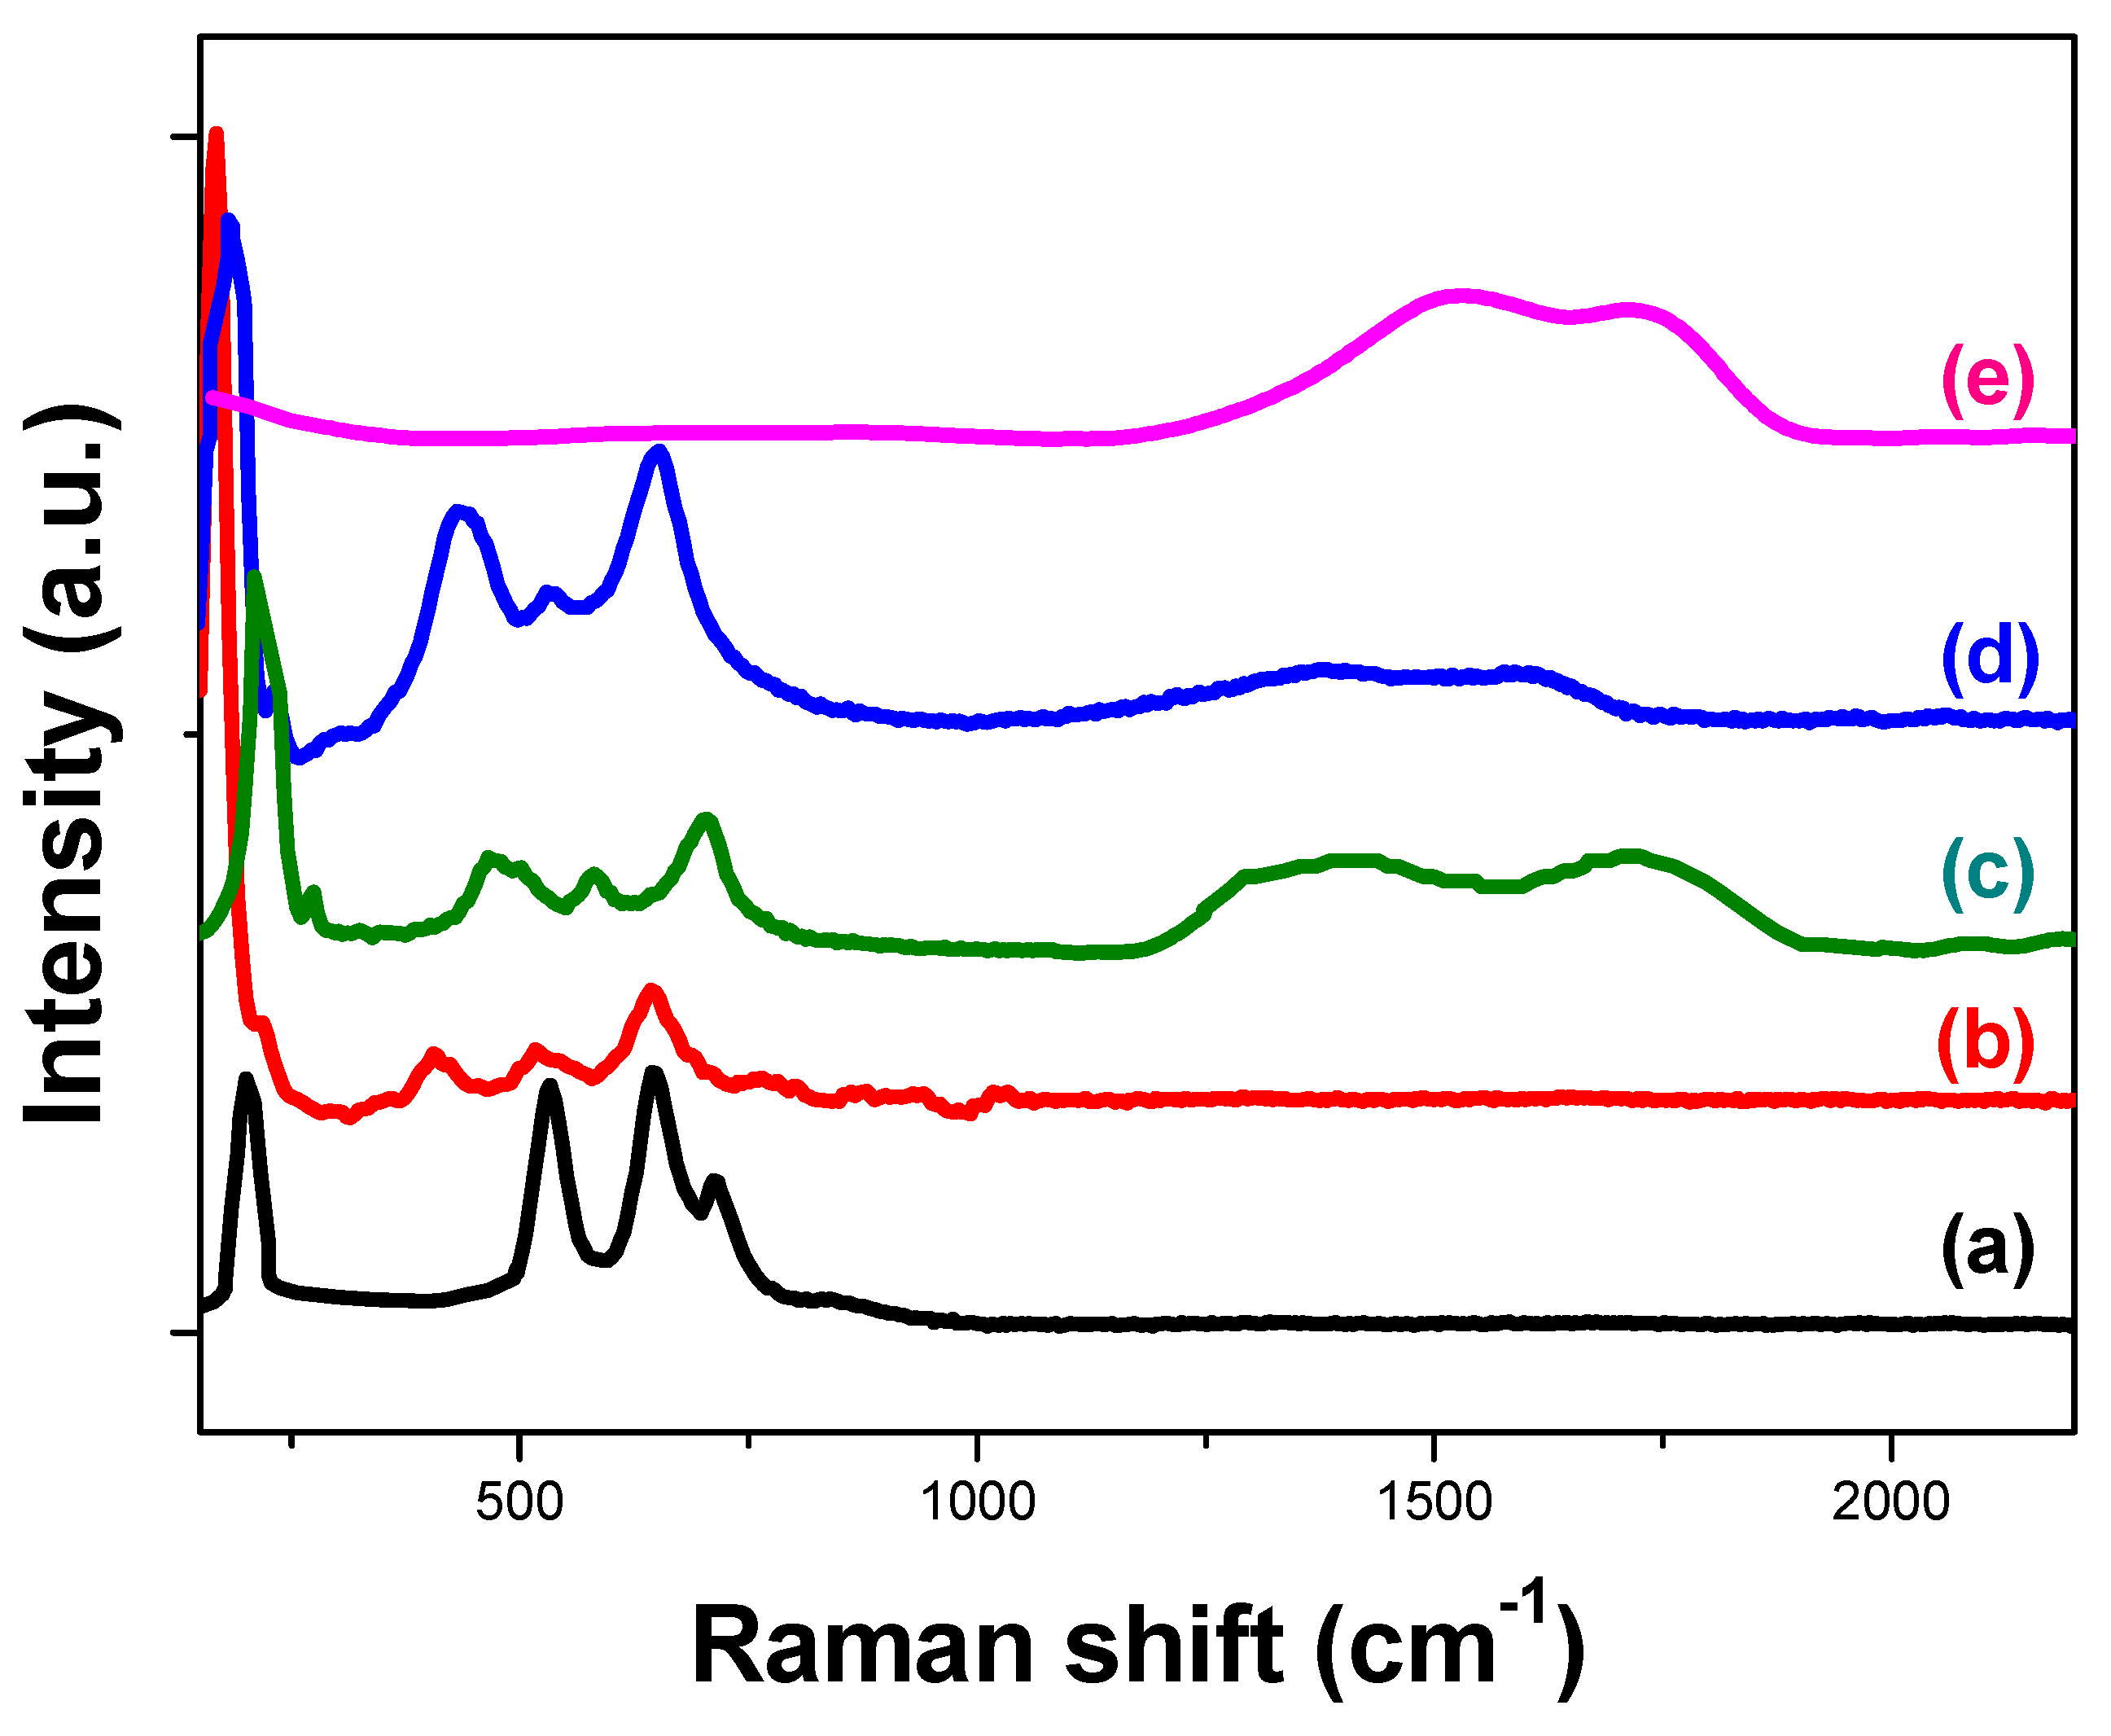
2.3.5. Raman
2.3.6. Thermogravimetric Analysis (TGA)
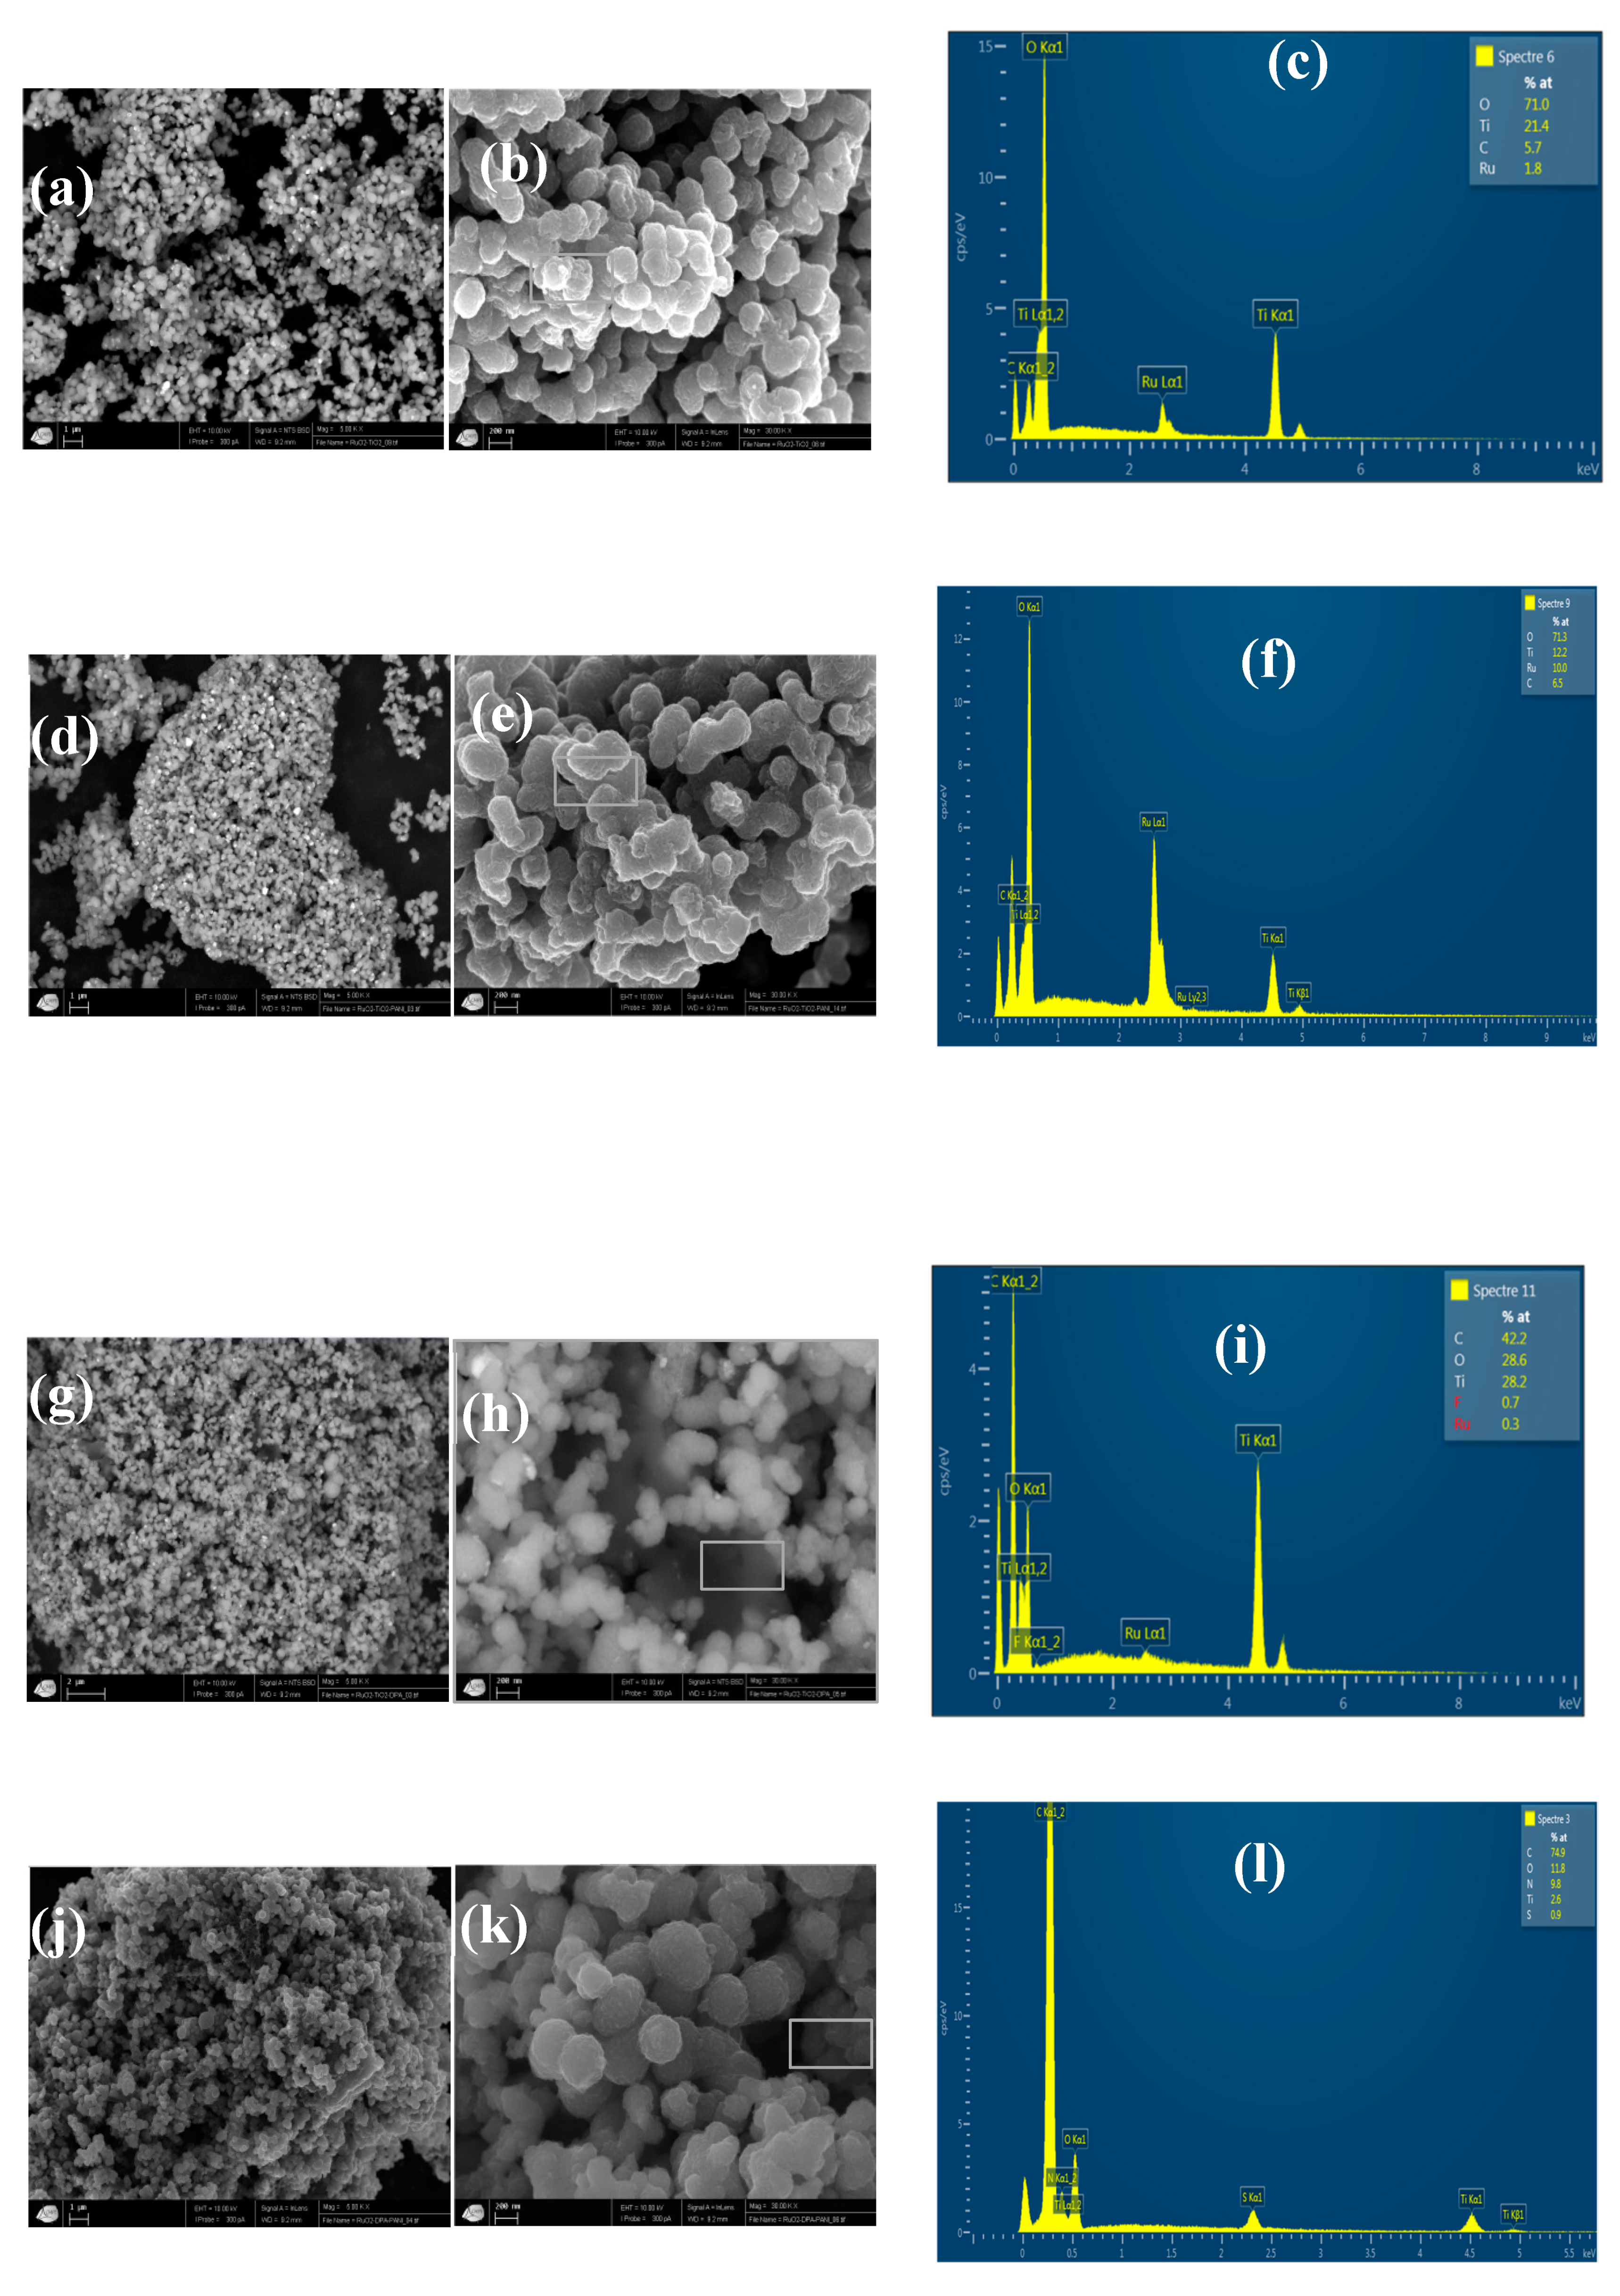
2.3.7. SEM-EDX
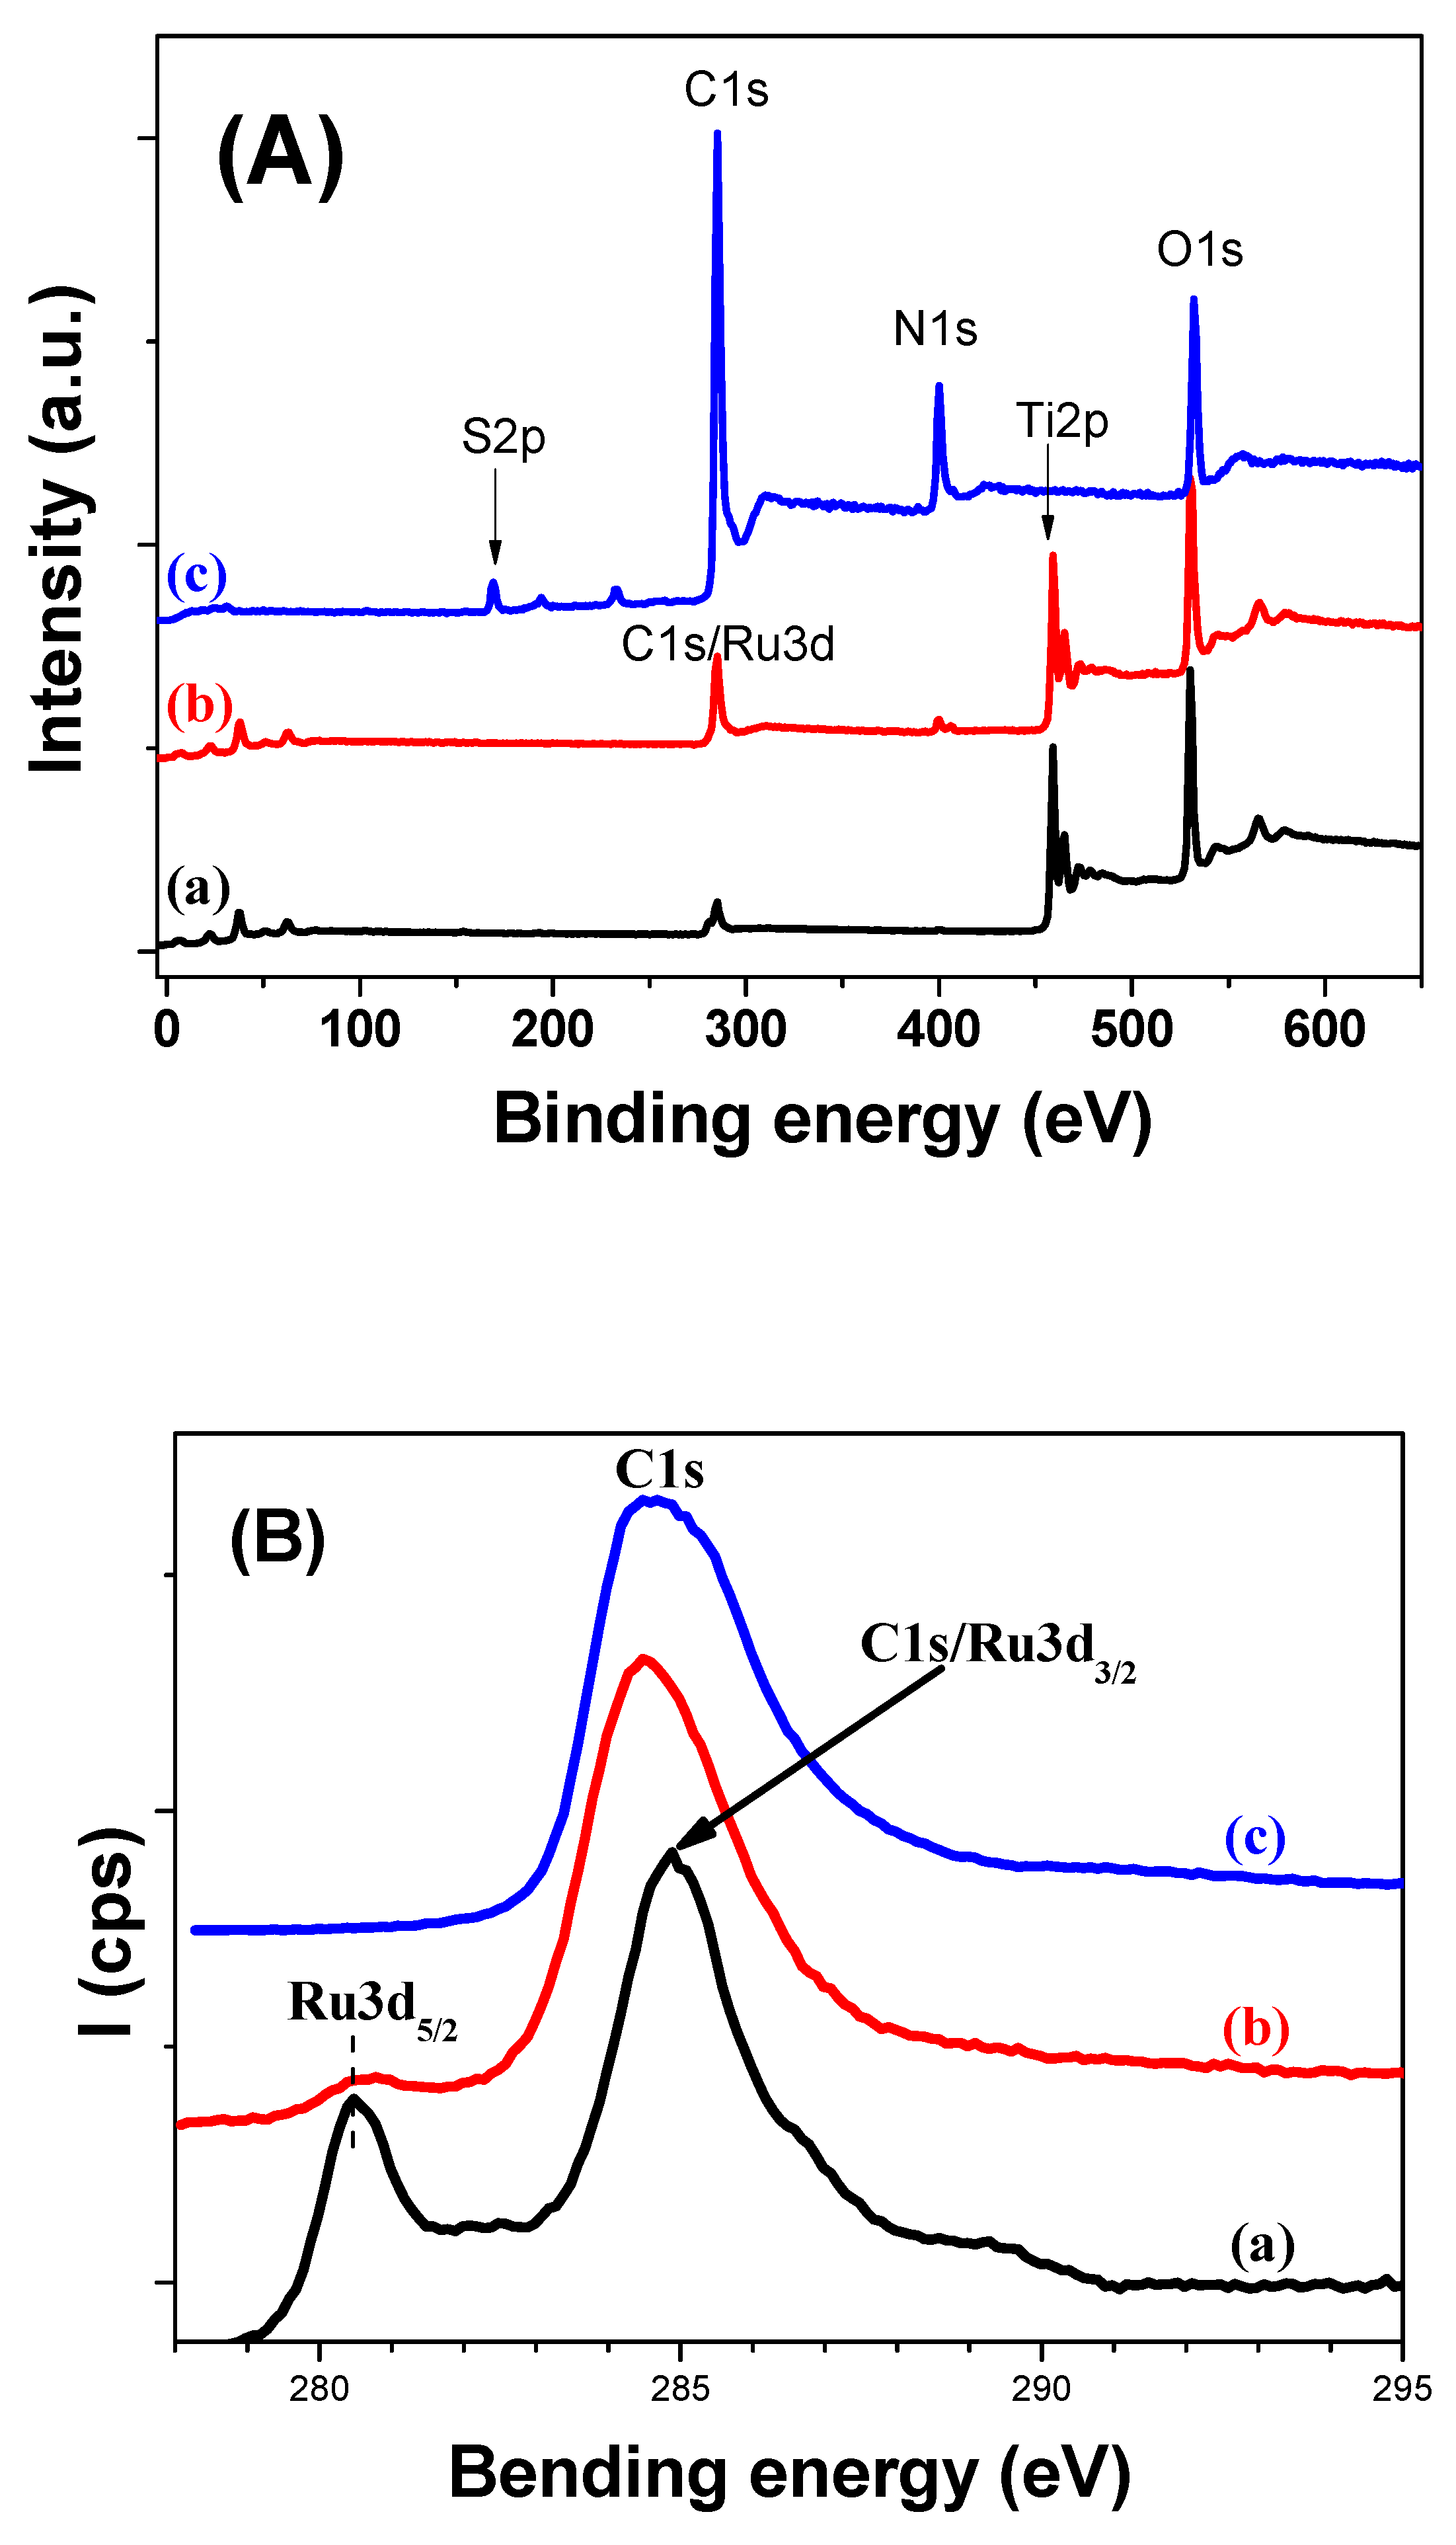
2.3.8. XPS
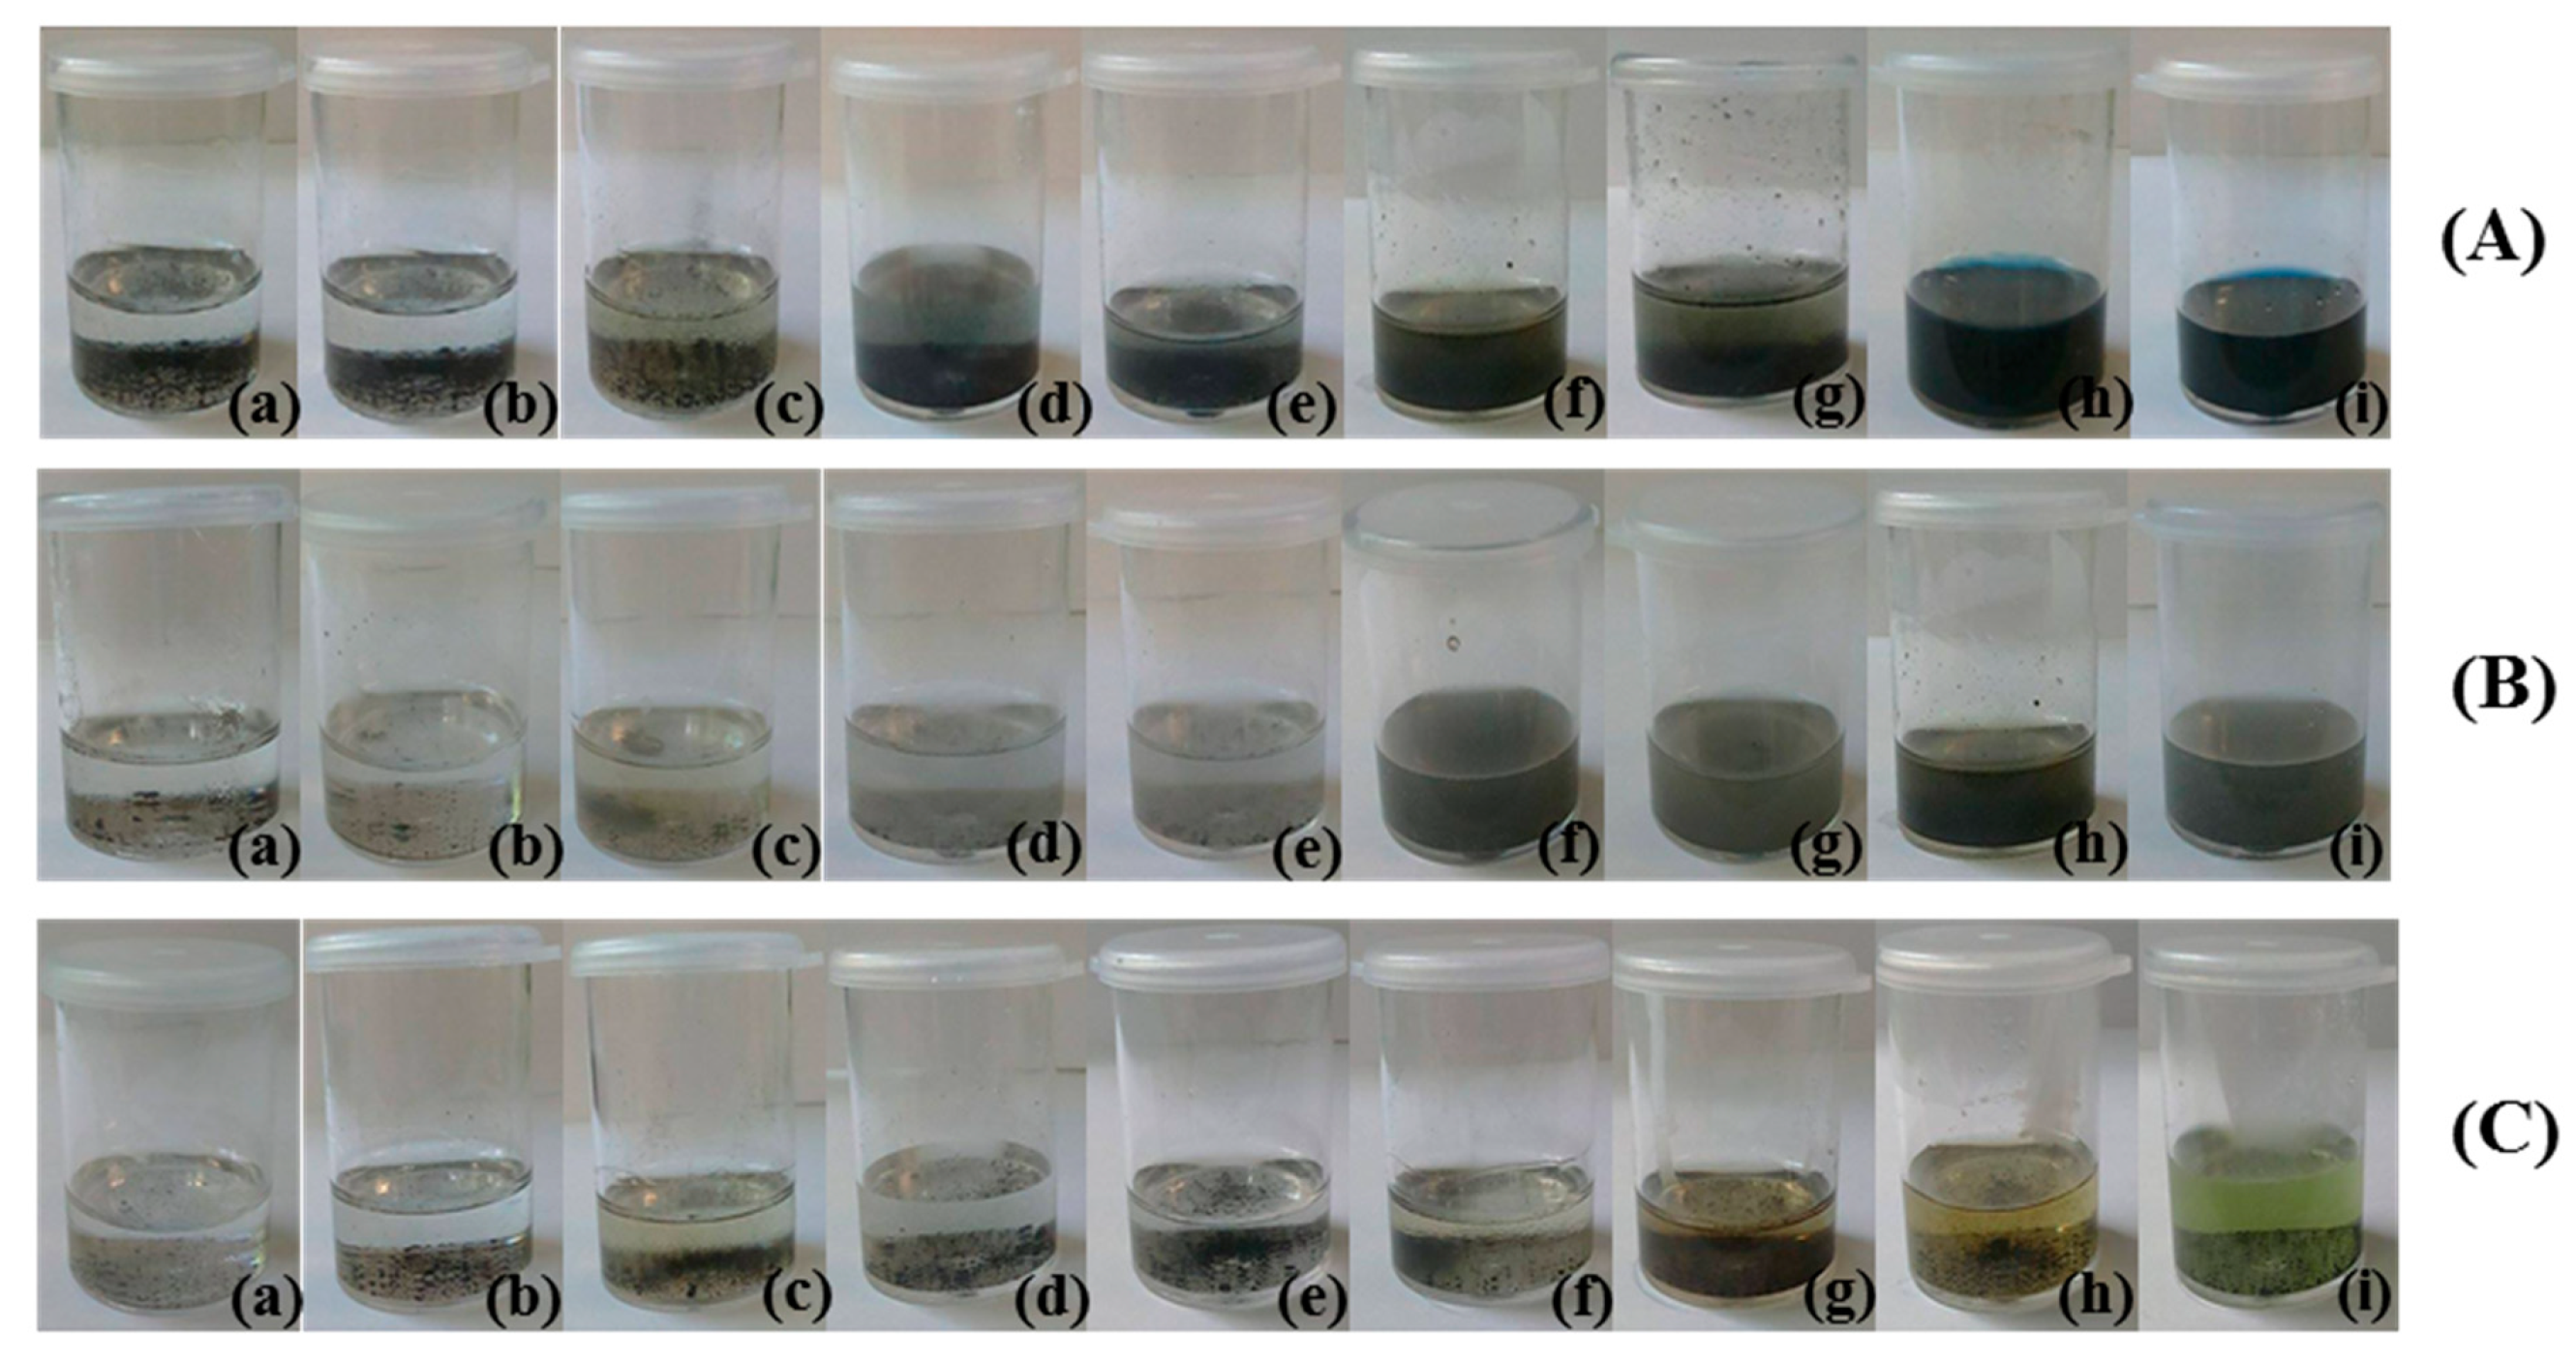
2.4. Adhesion of Polyaniline to RuO2-TiO2 Nanoparticles
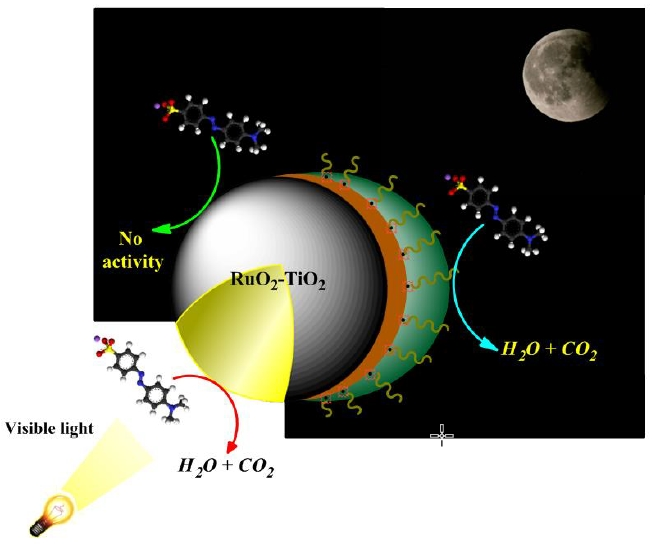
2.5. Catalytic Performances of RuO2-TiO2-DPA-PANI
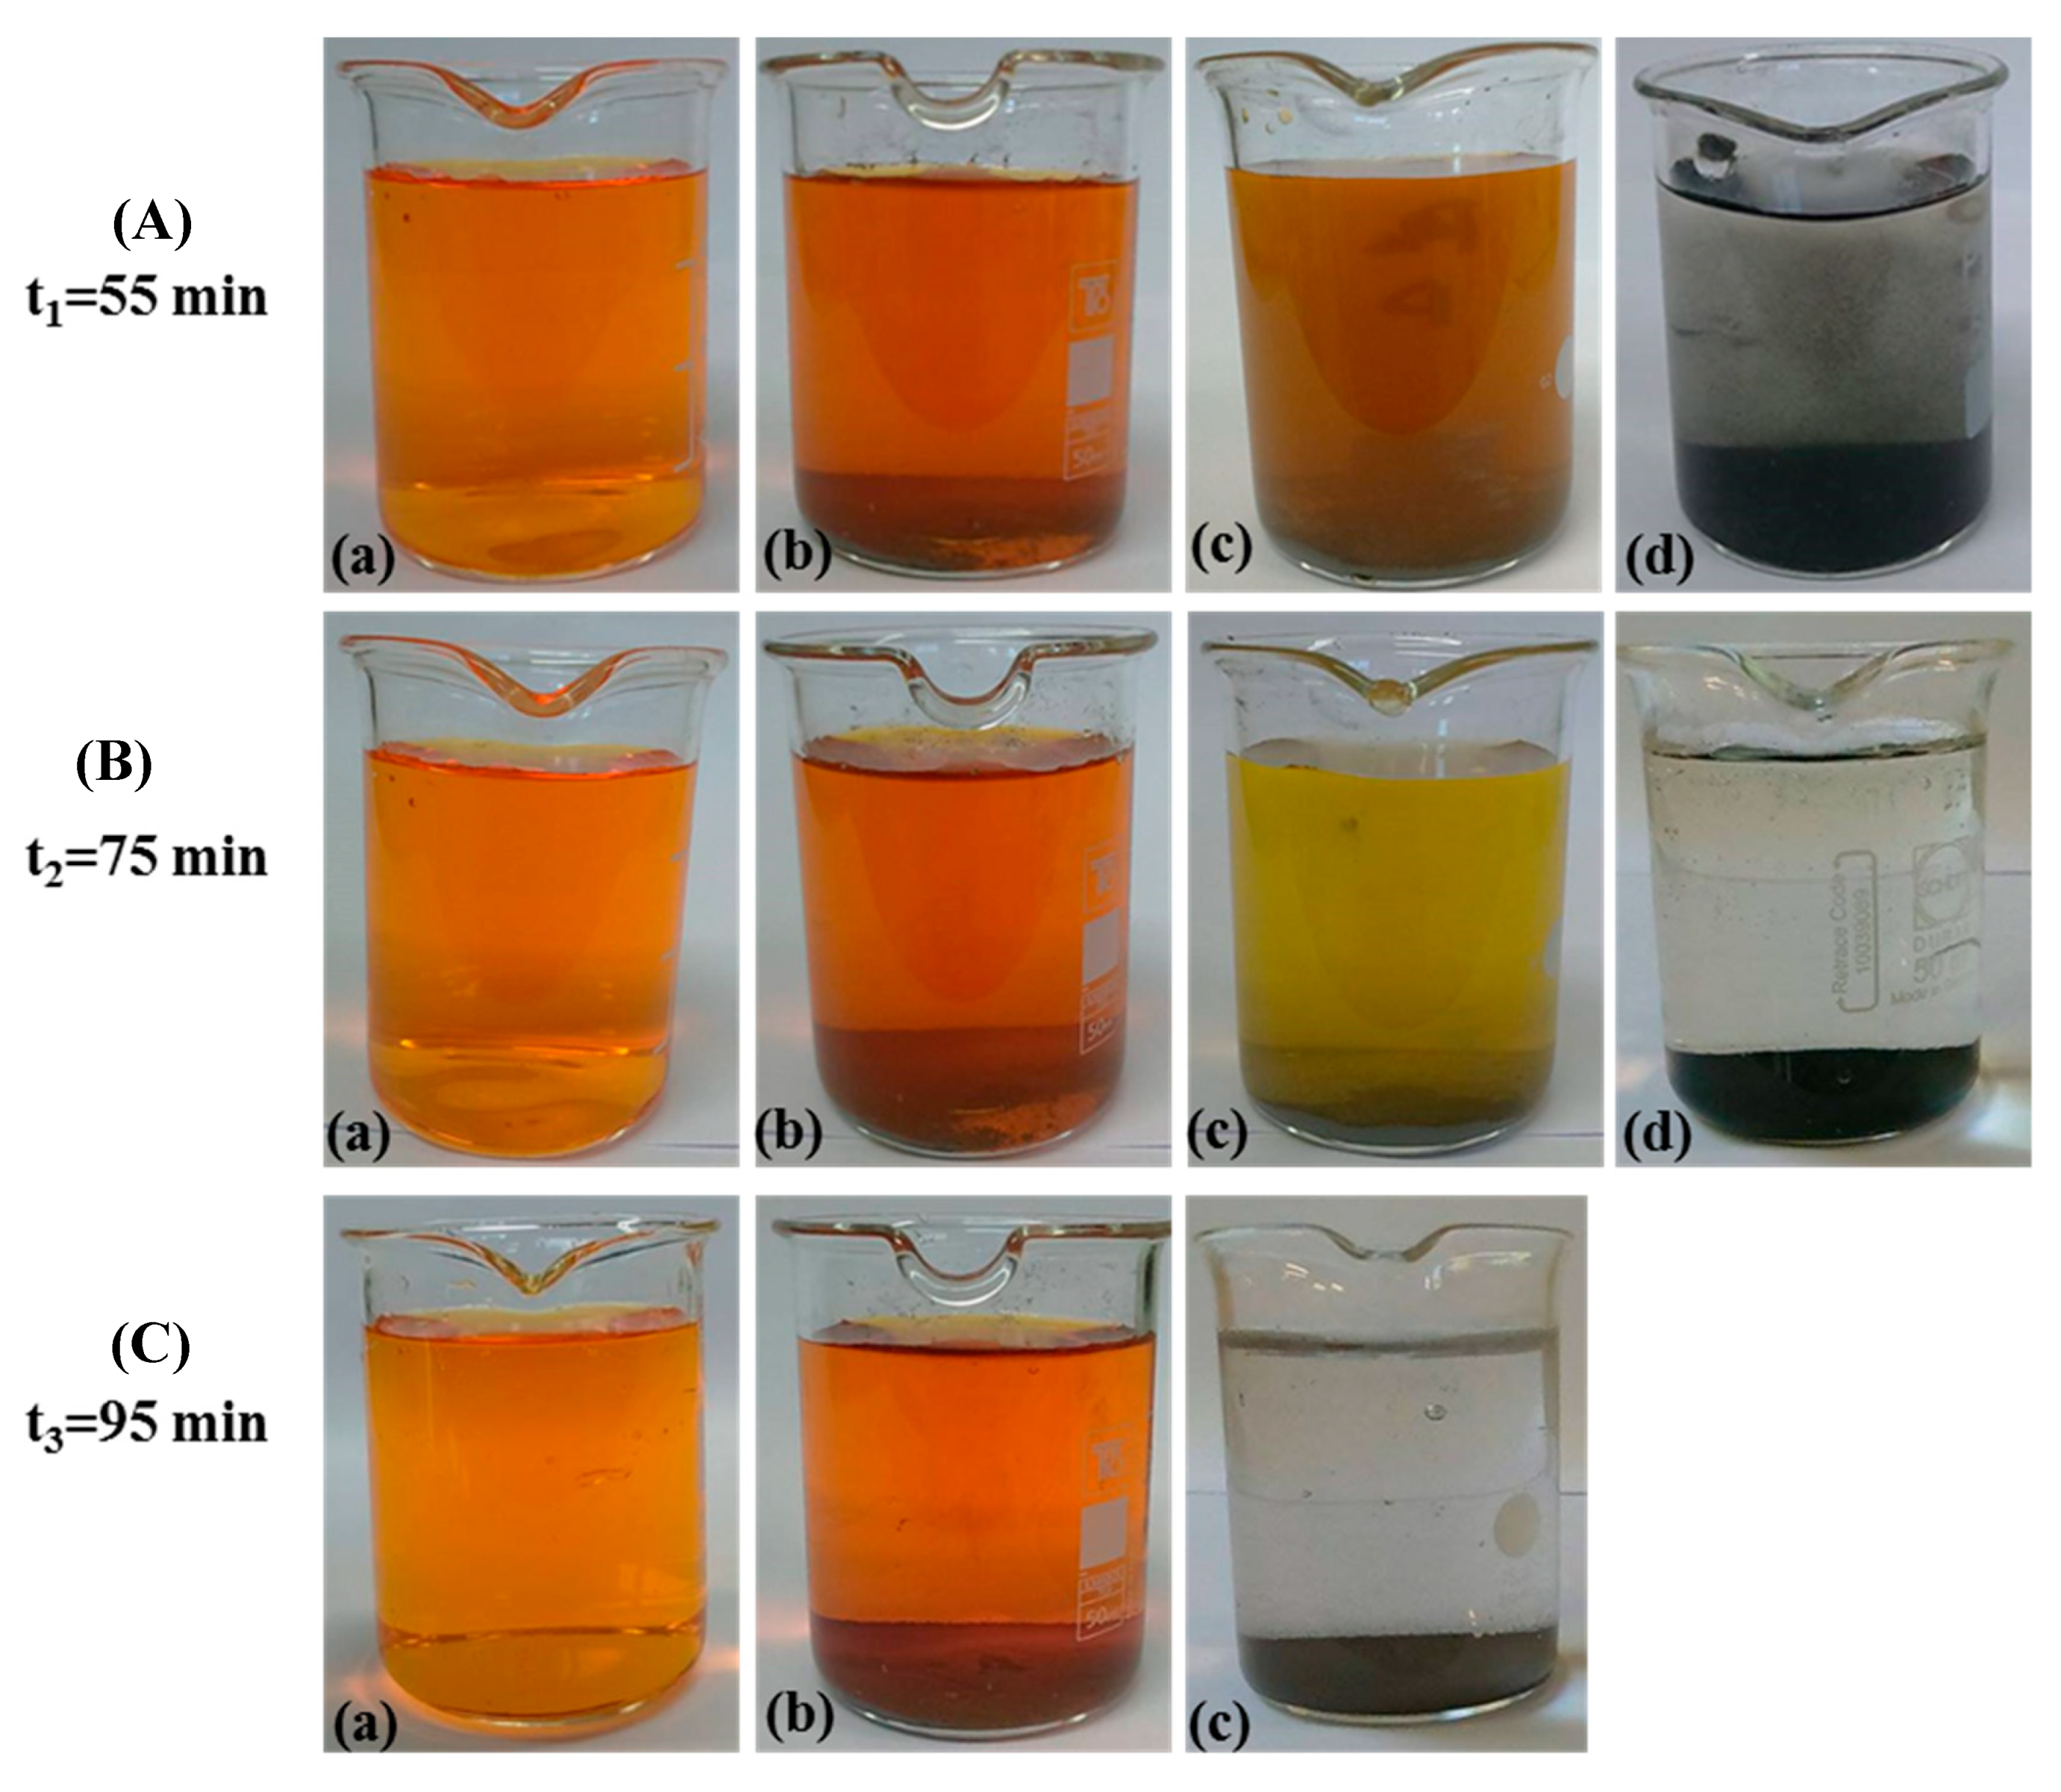
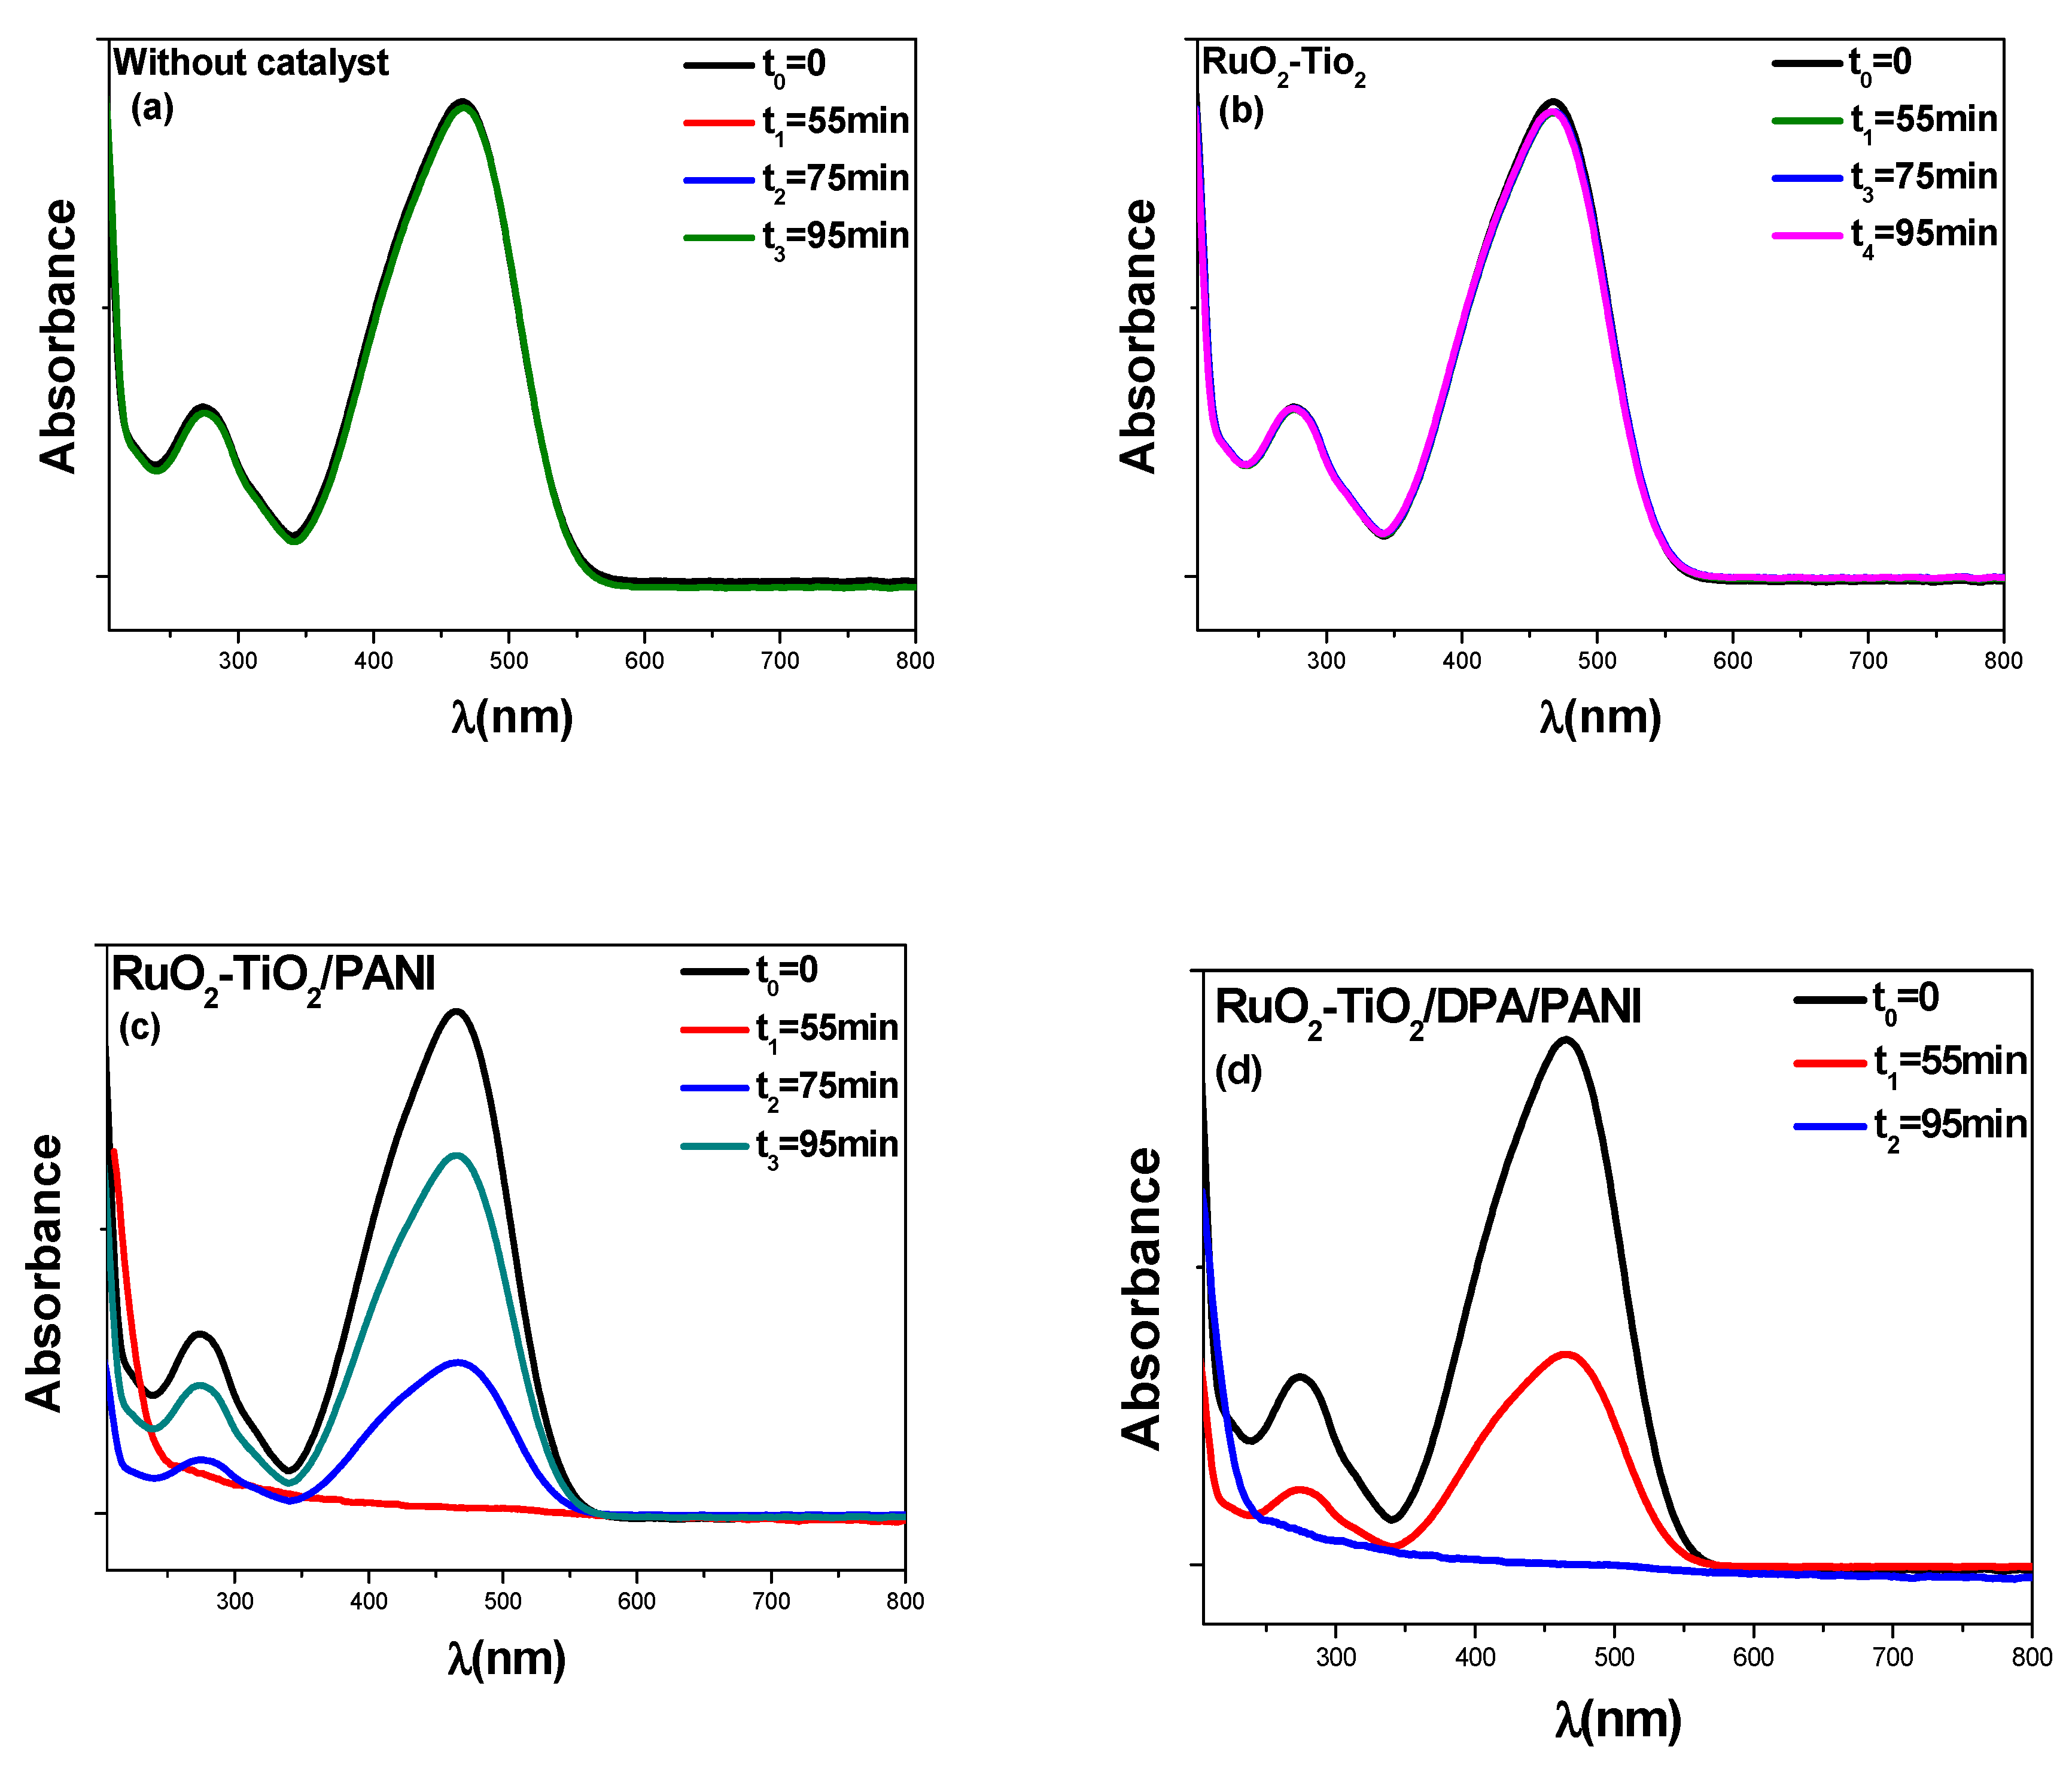
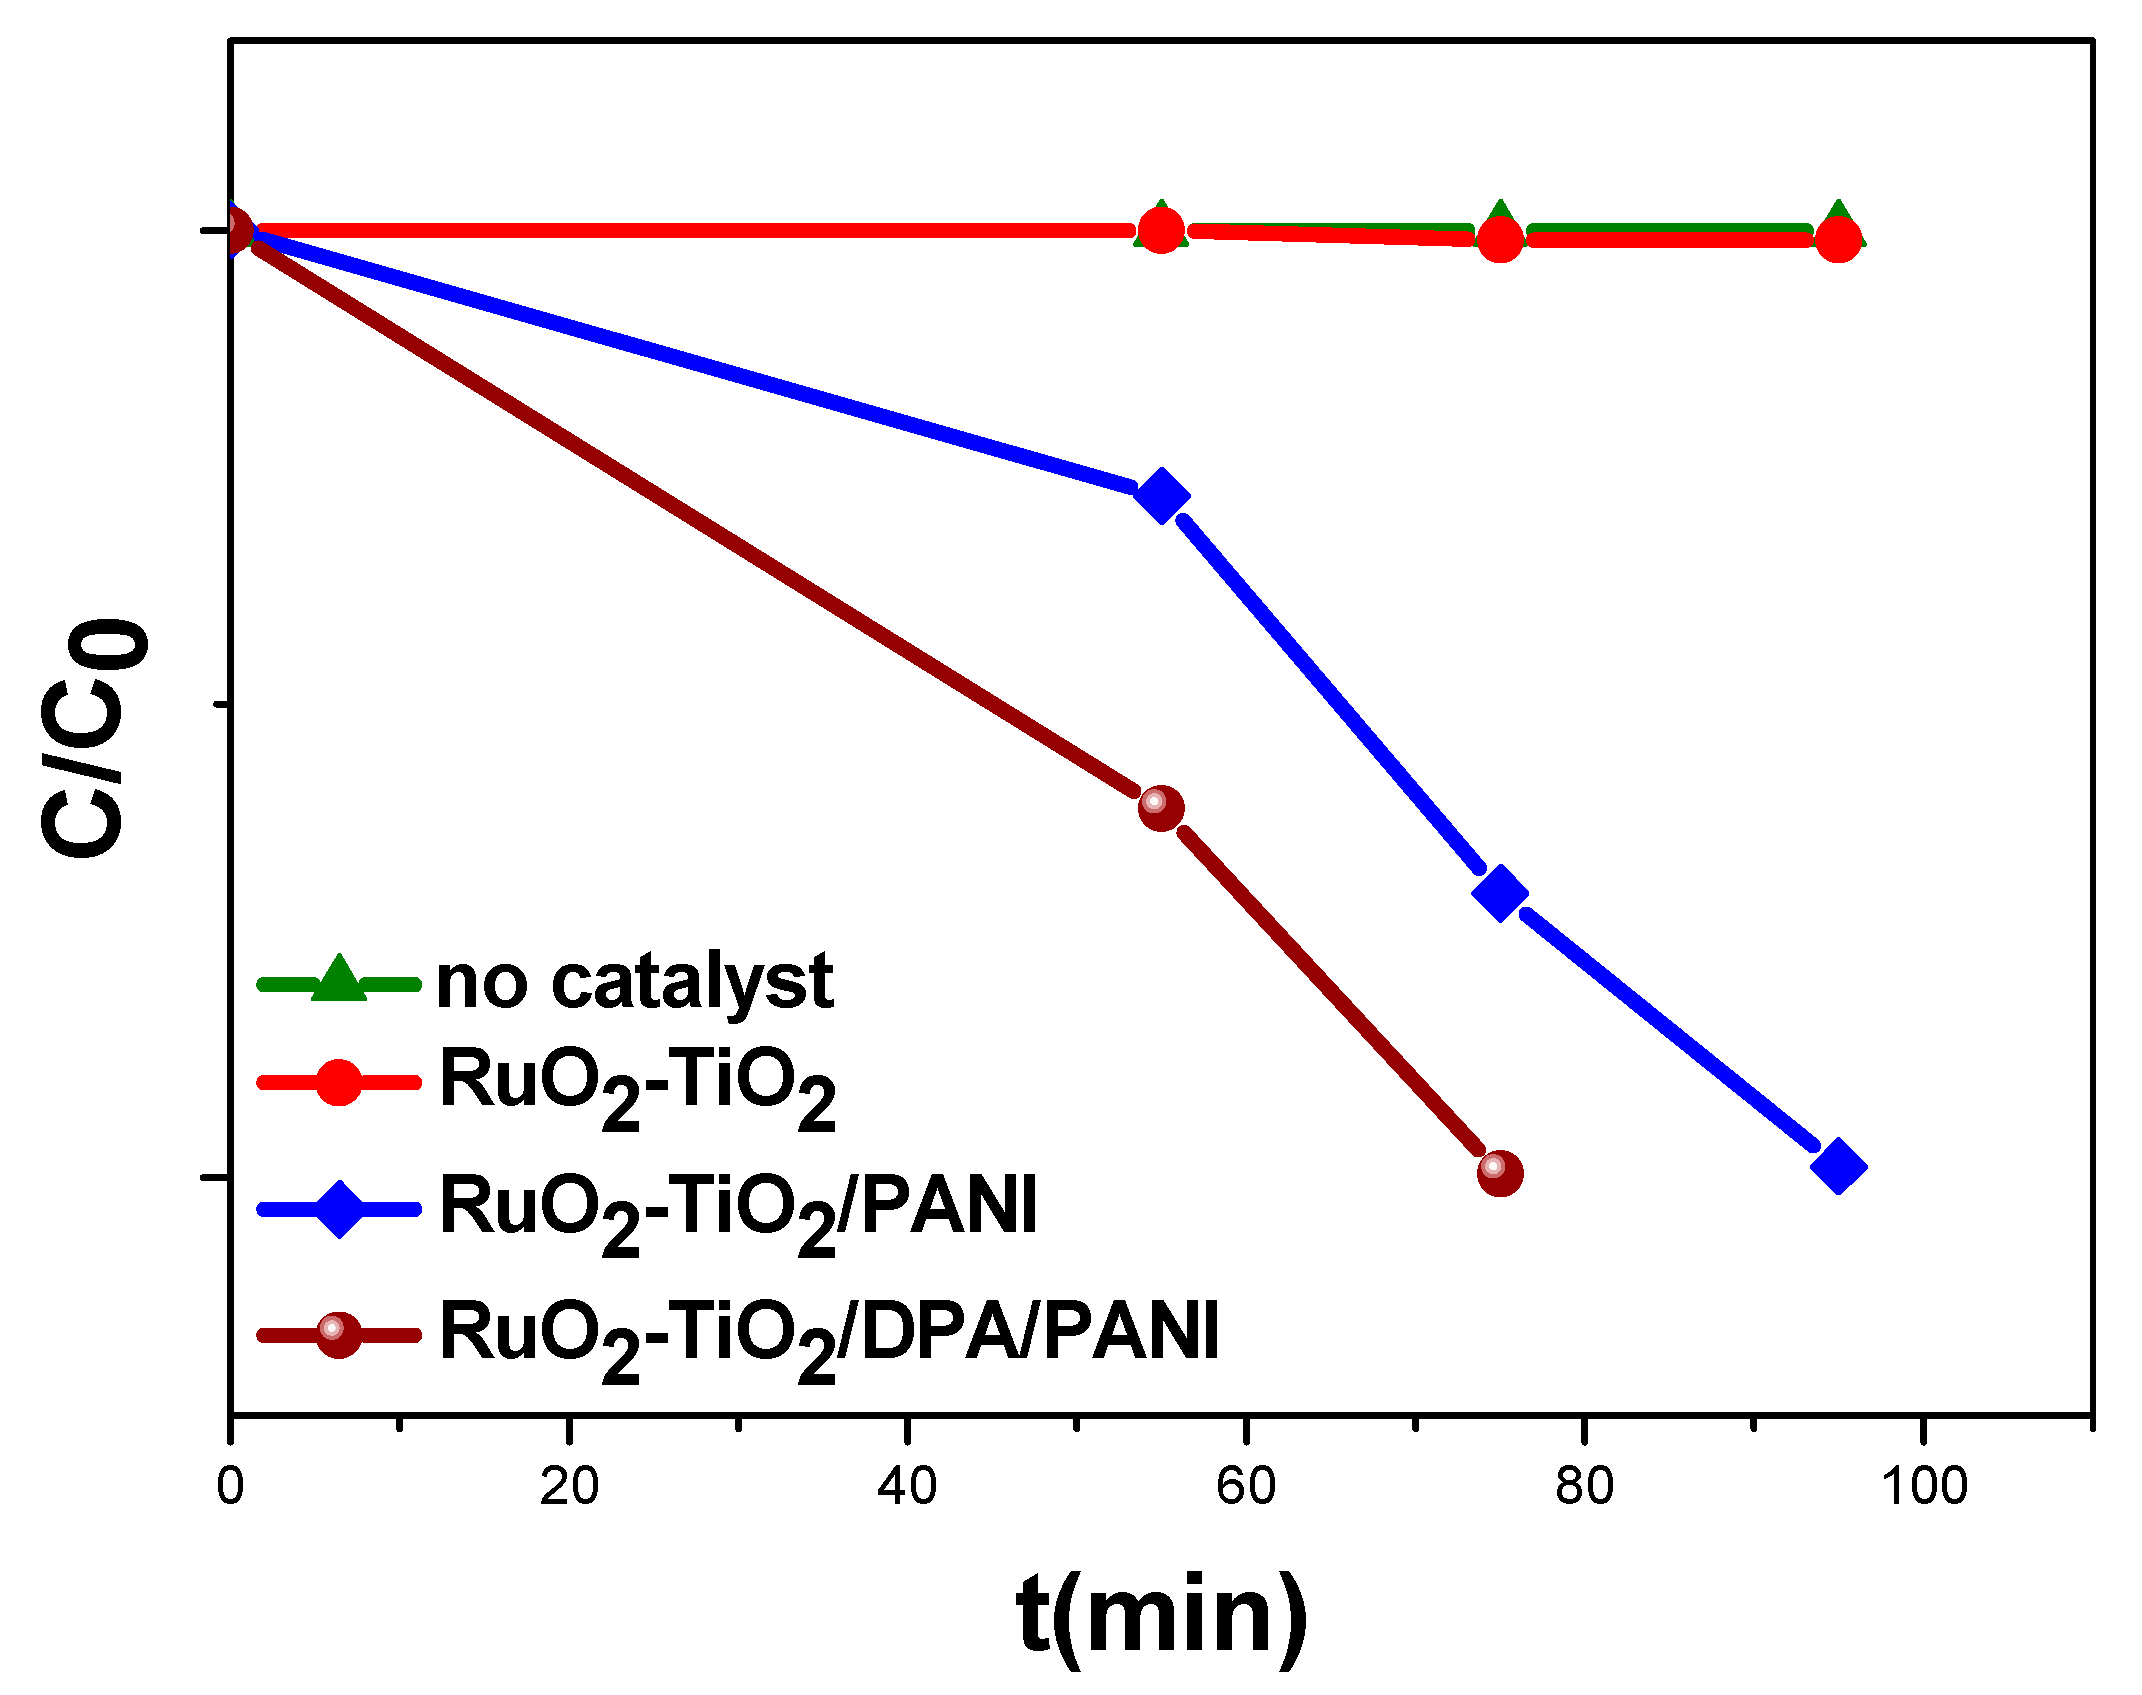
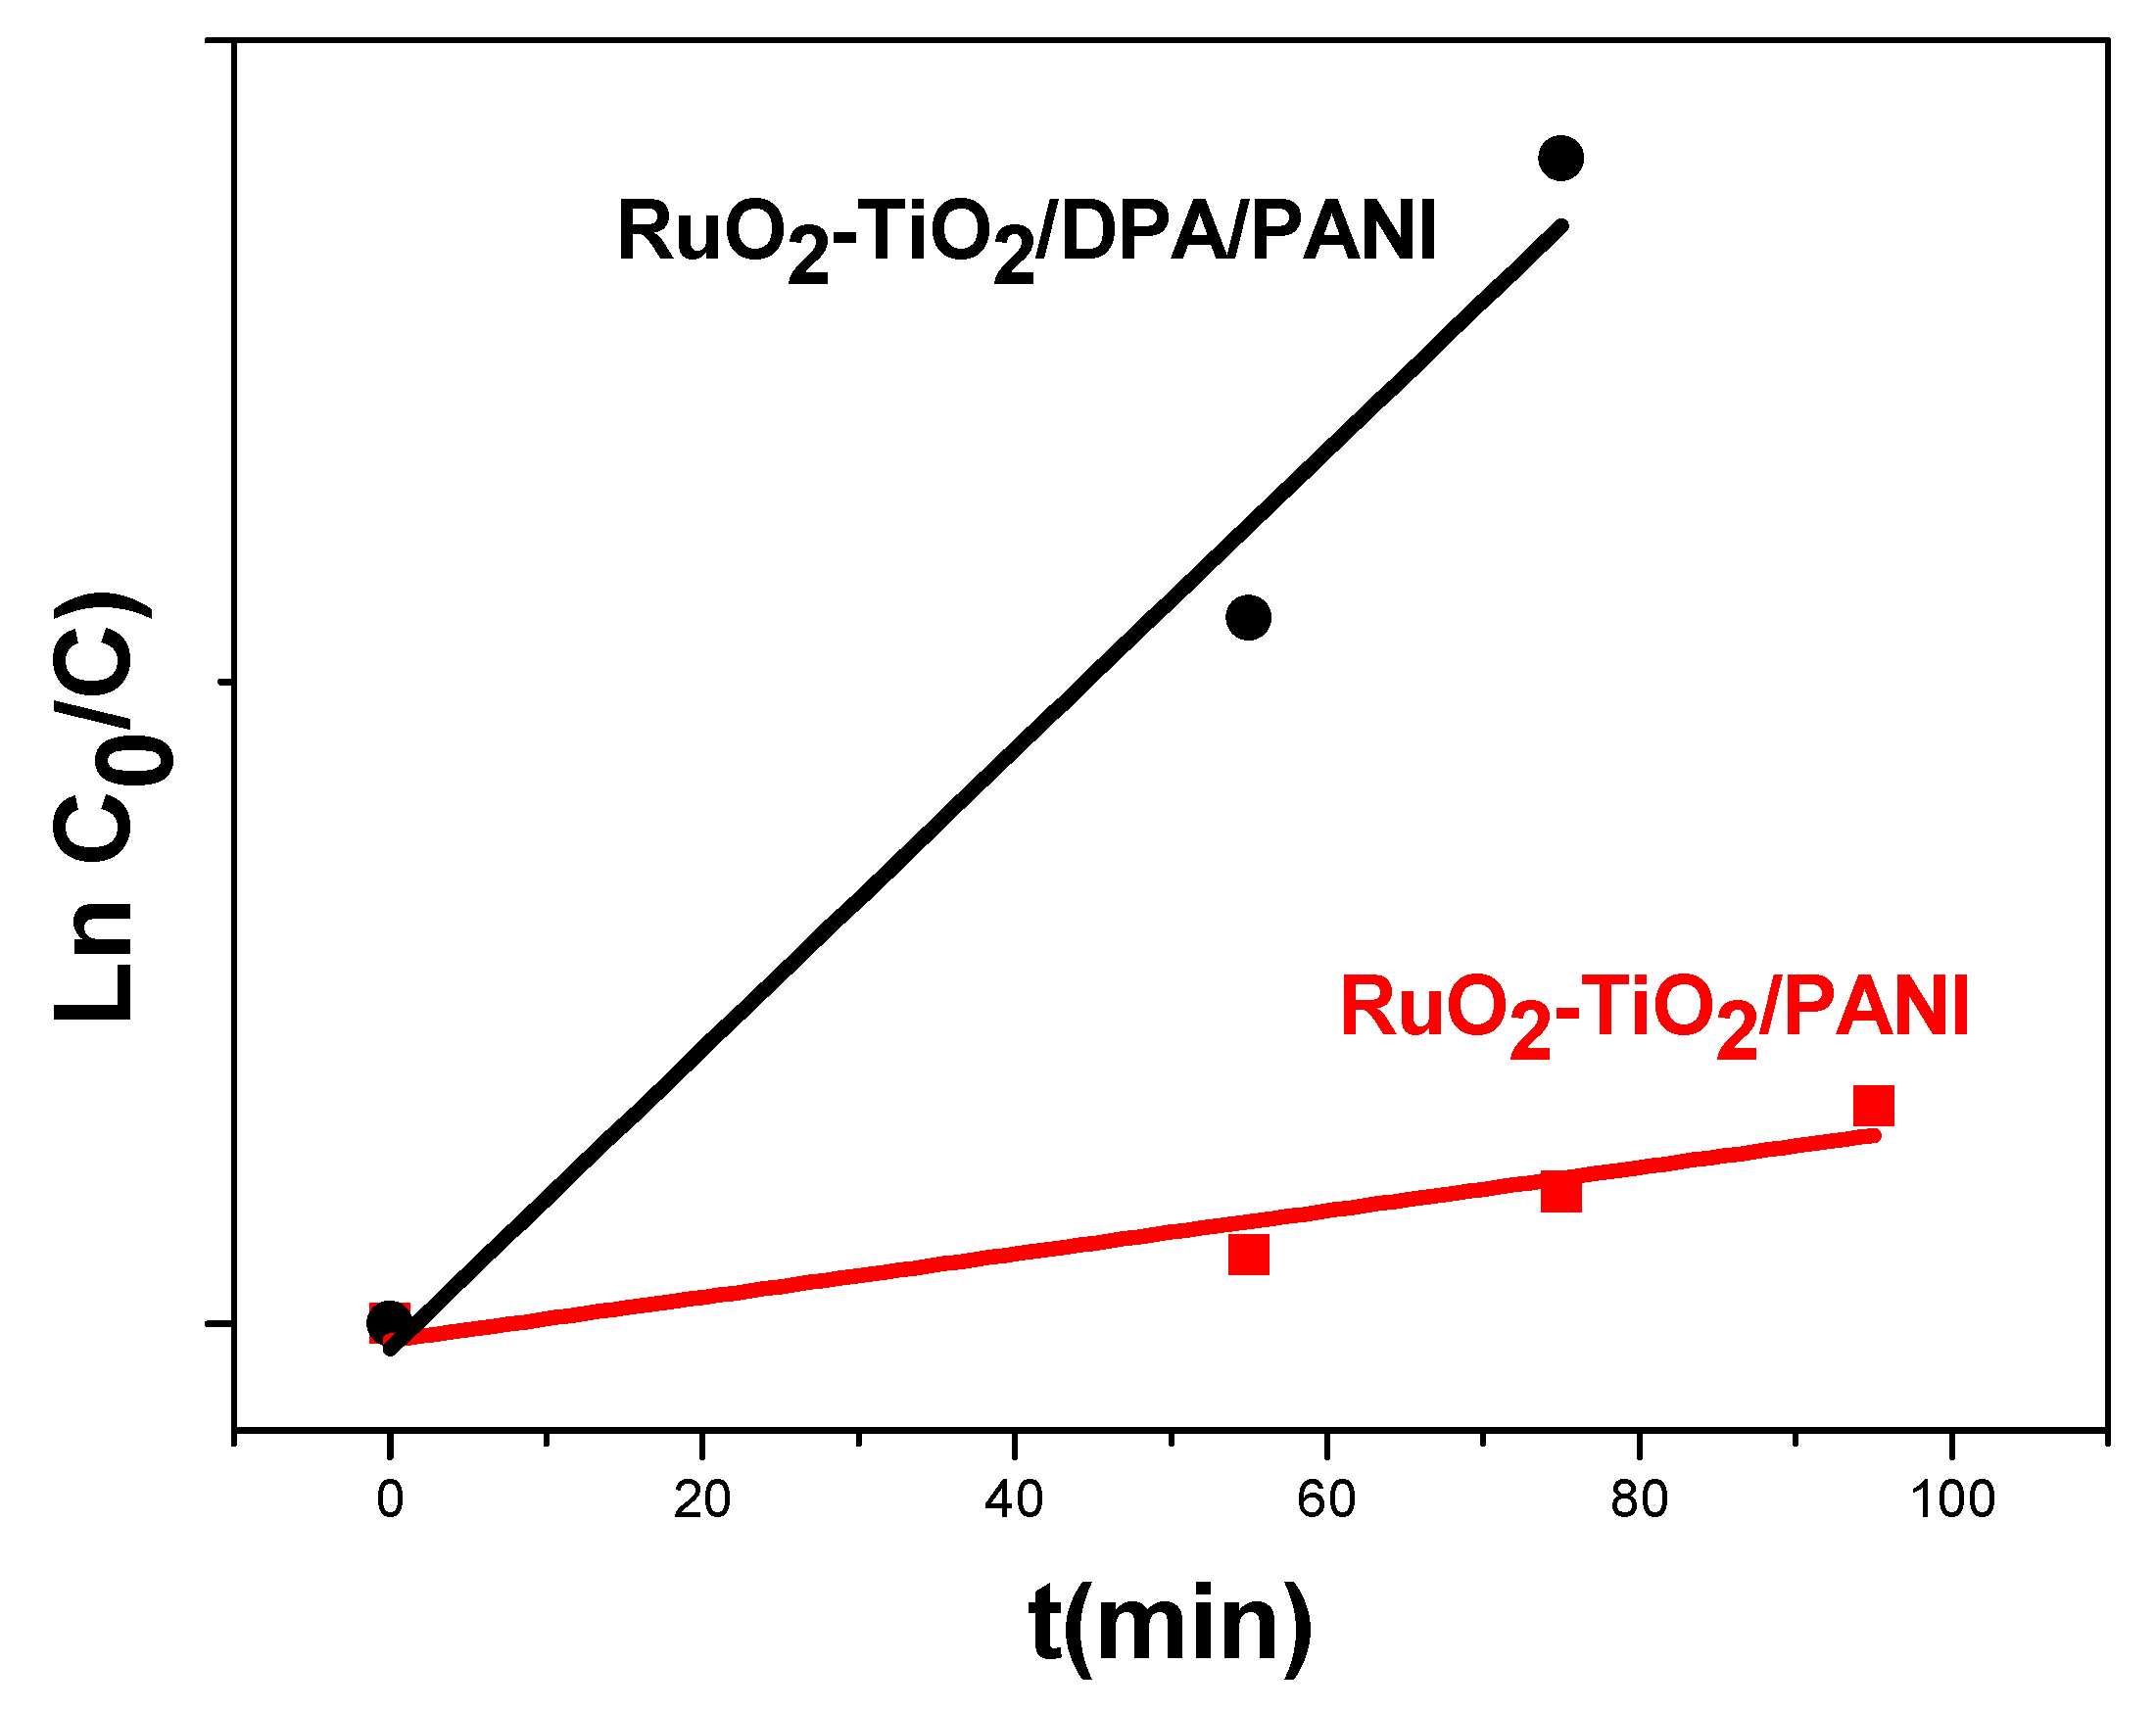
2.5.1. Kinetic Analysis in Darkness
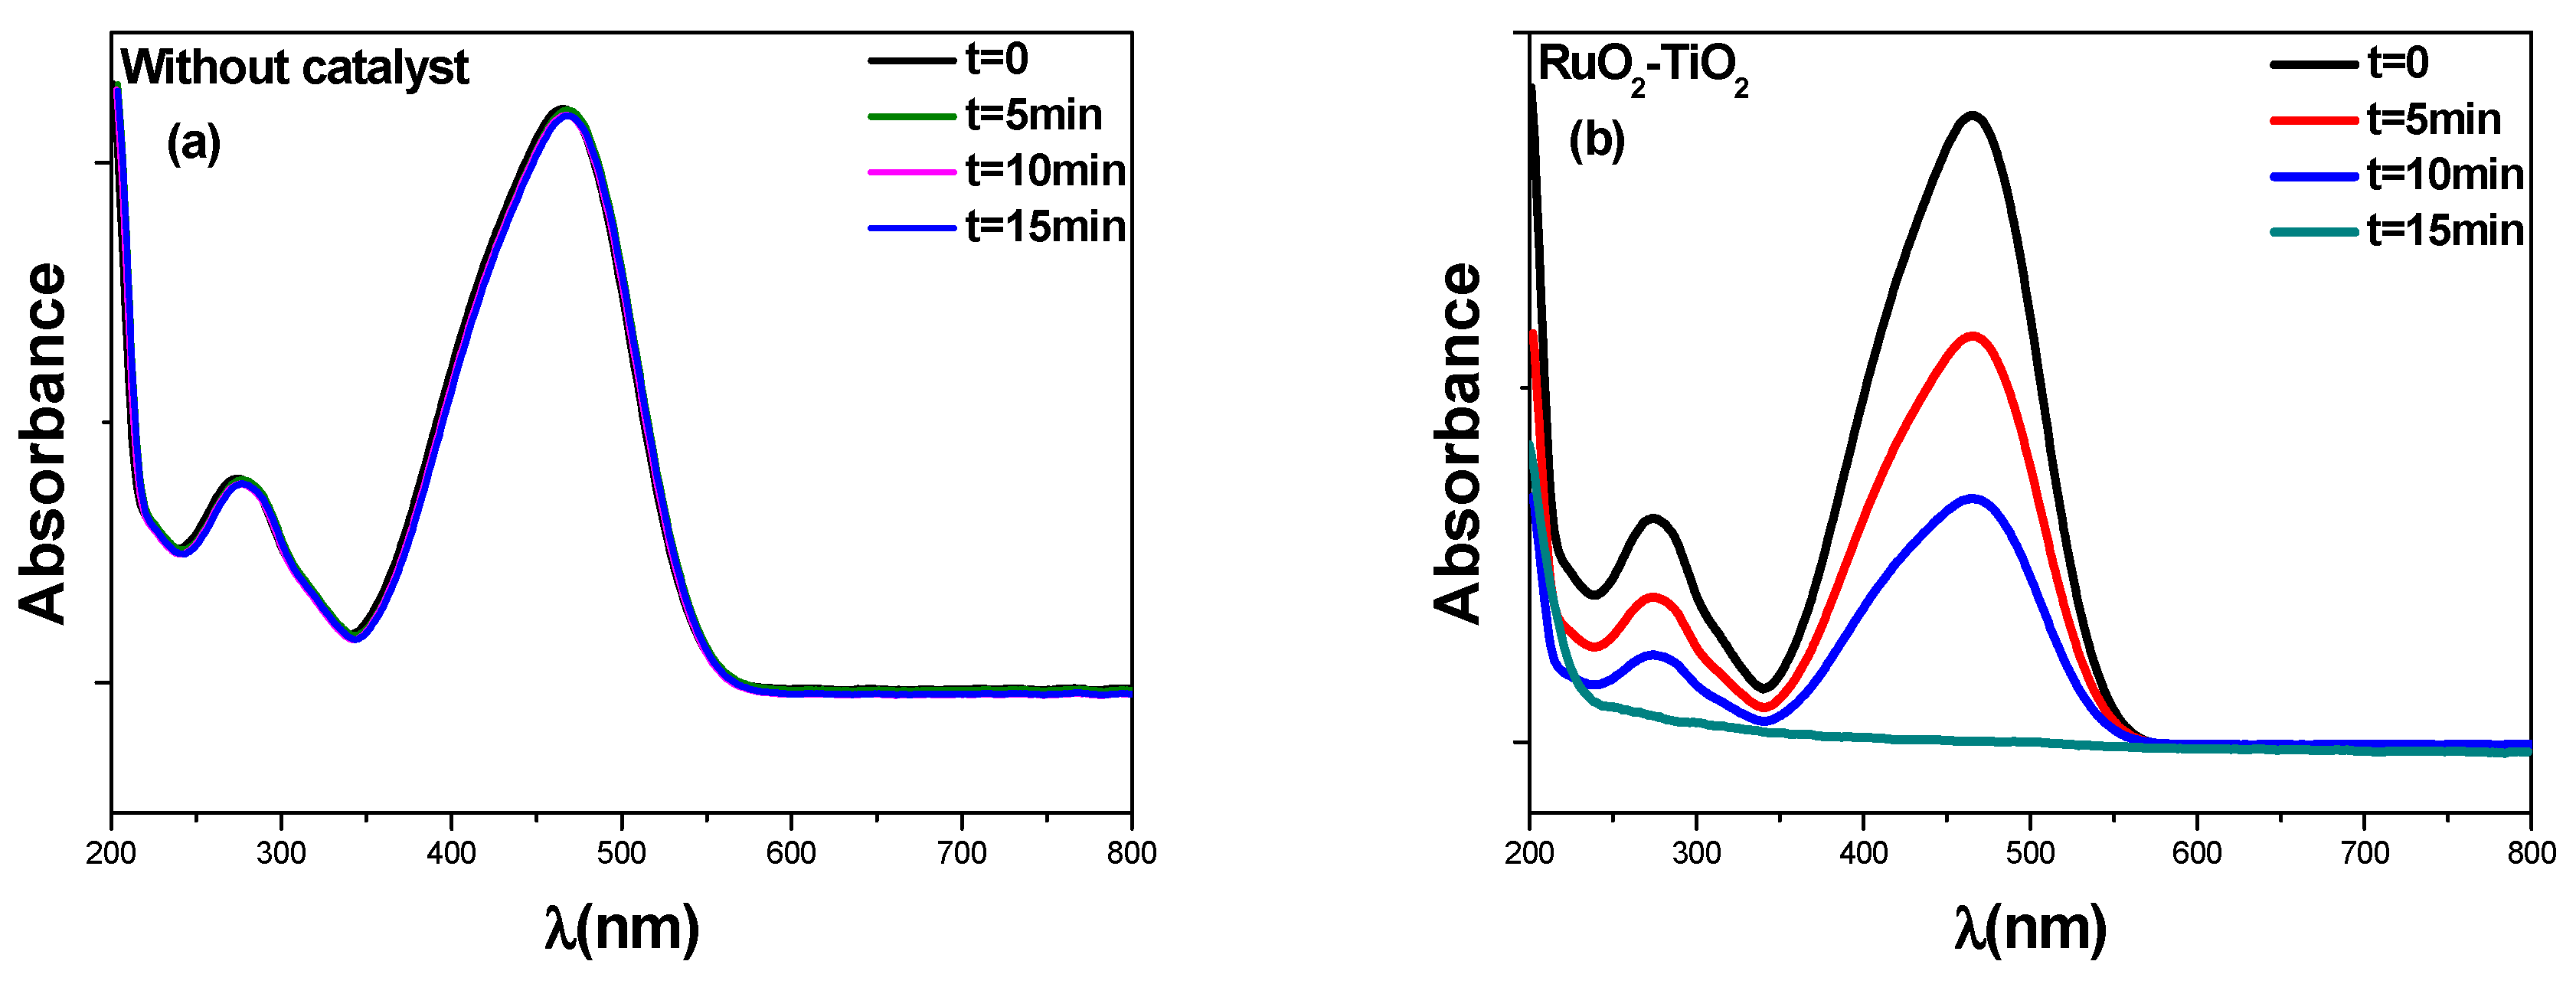
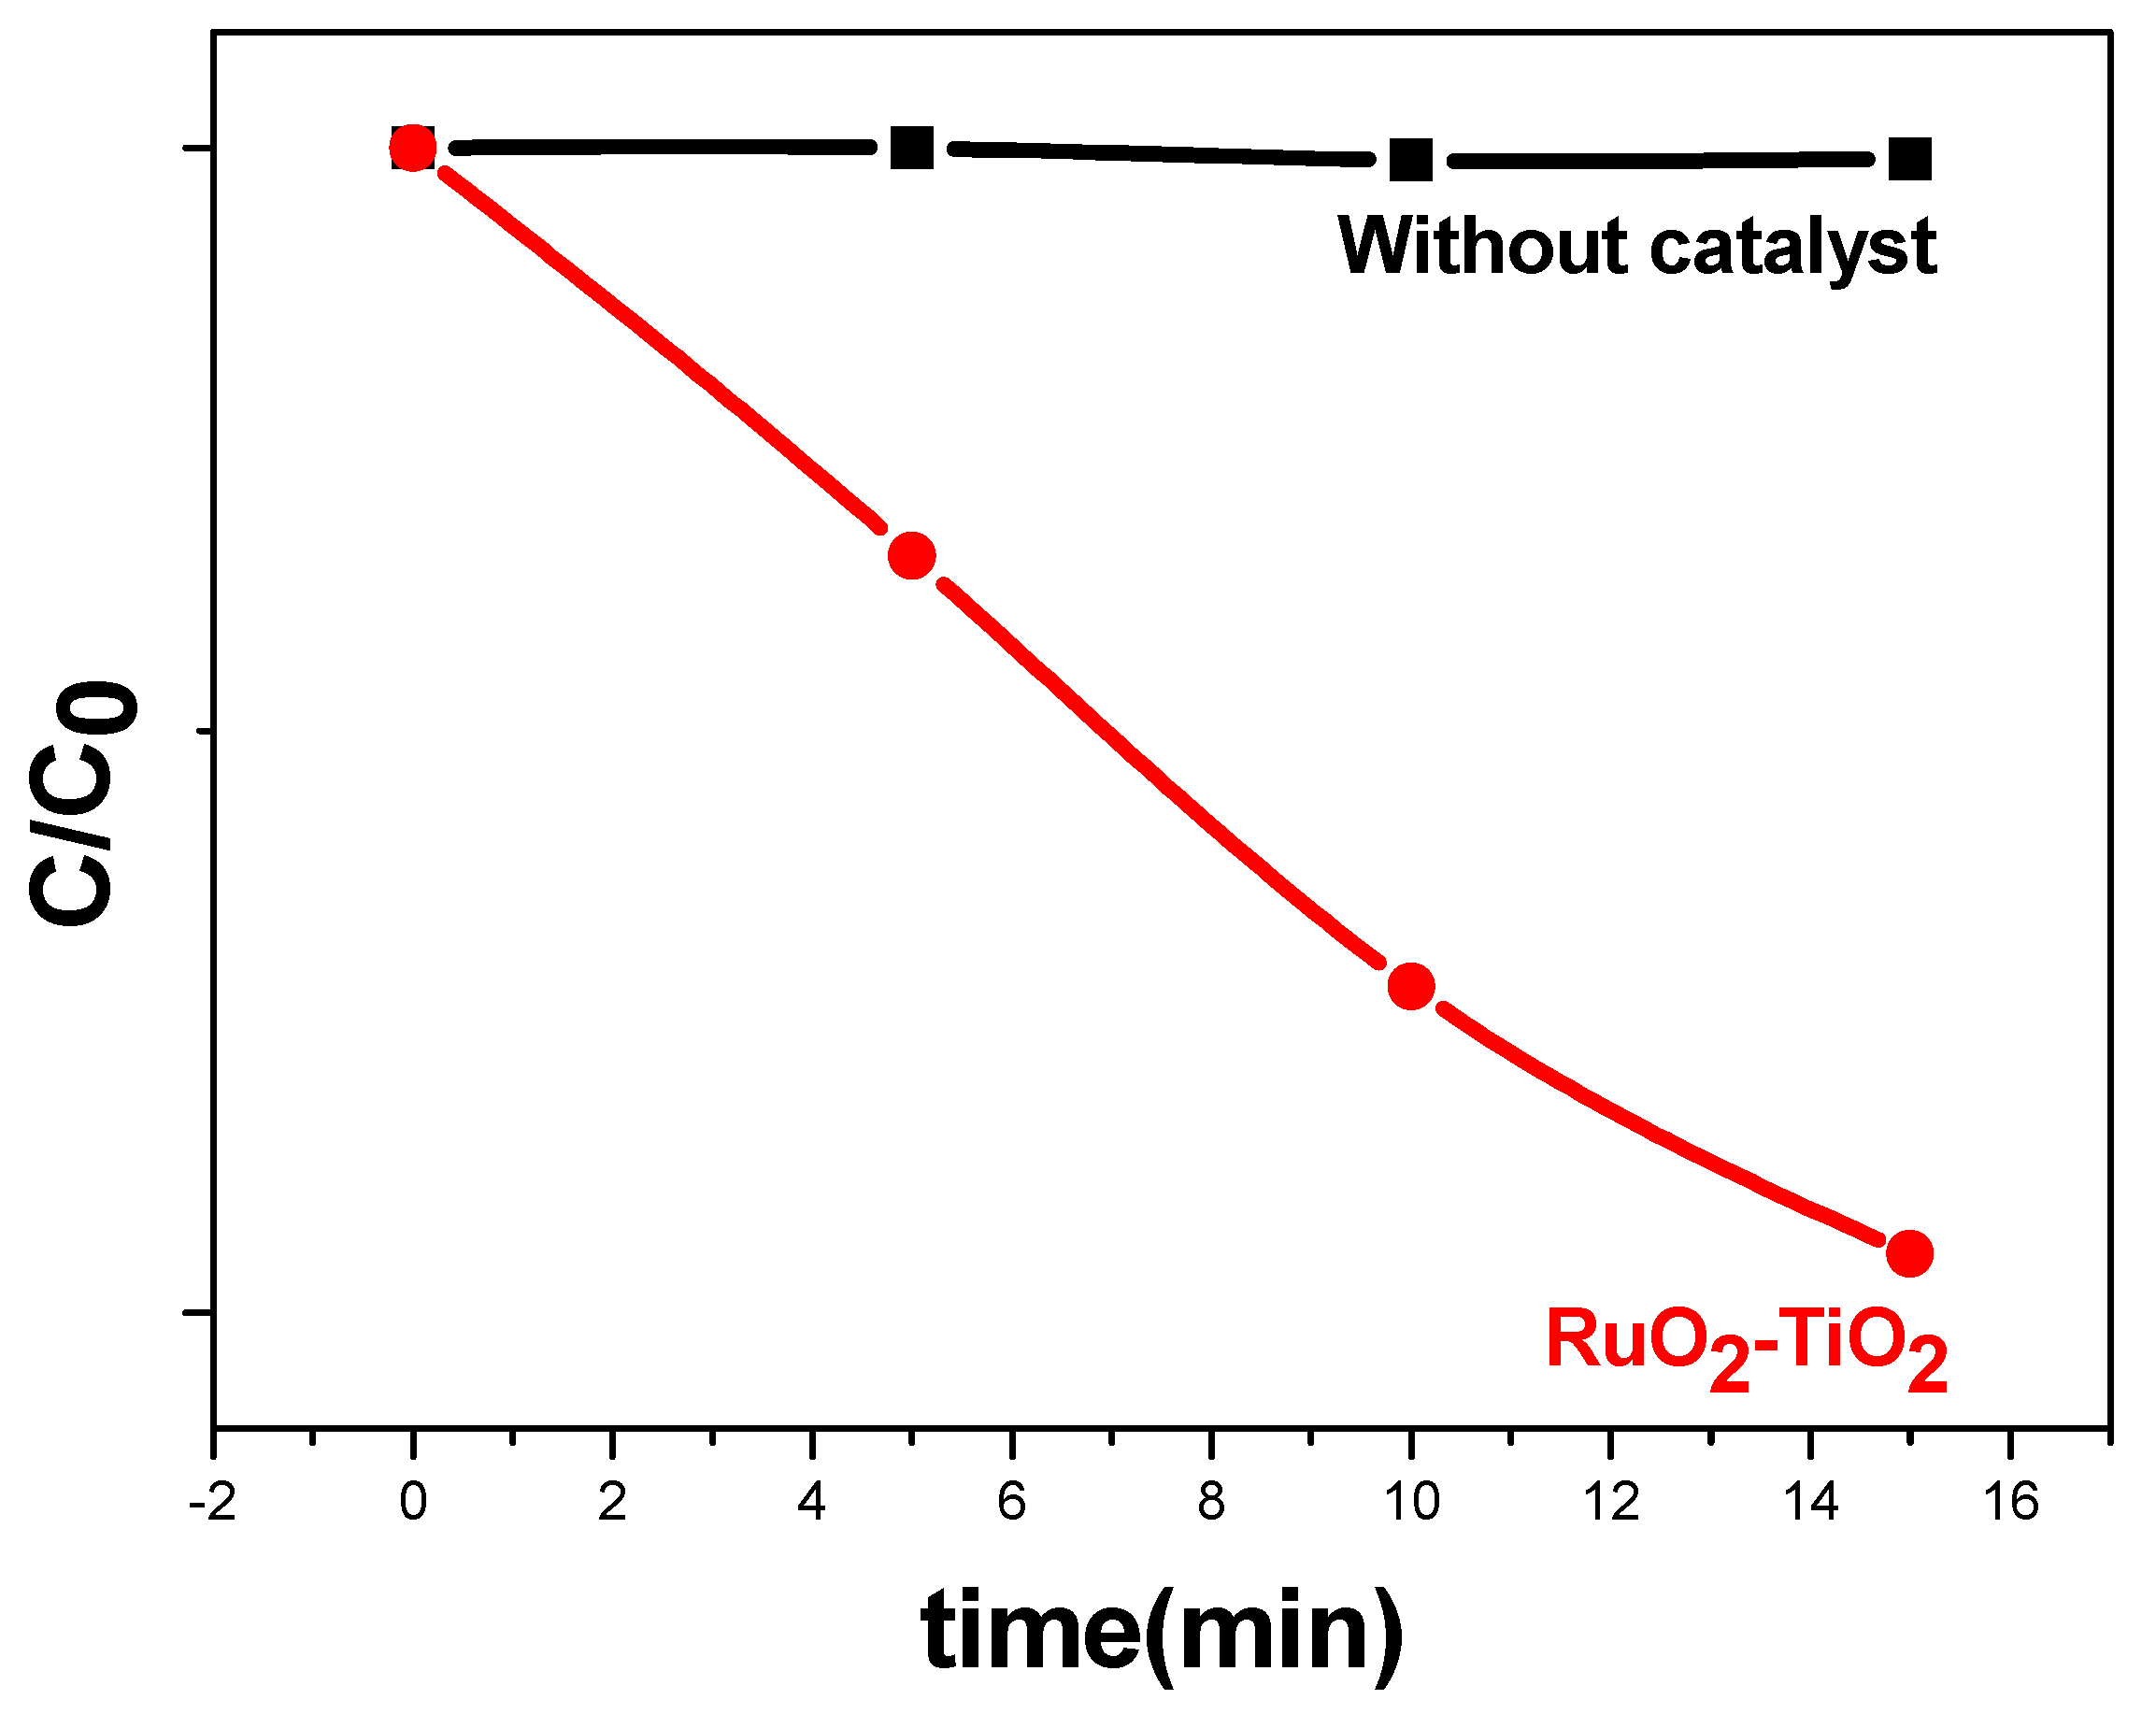
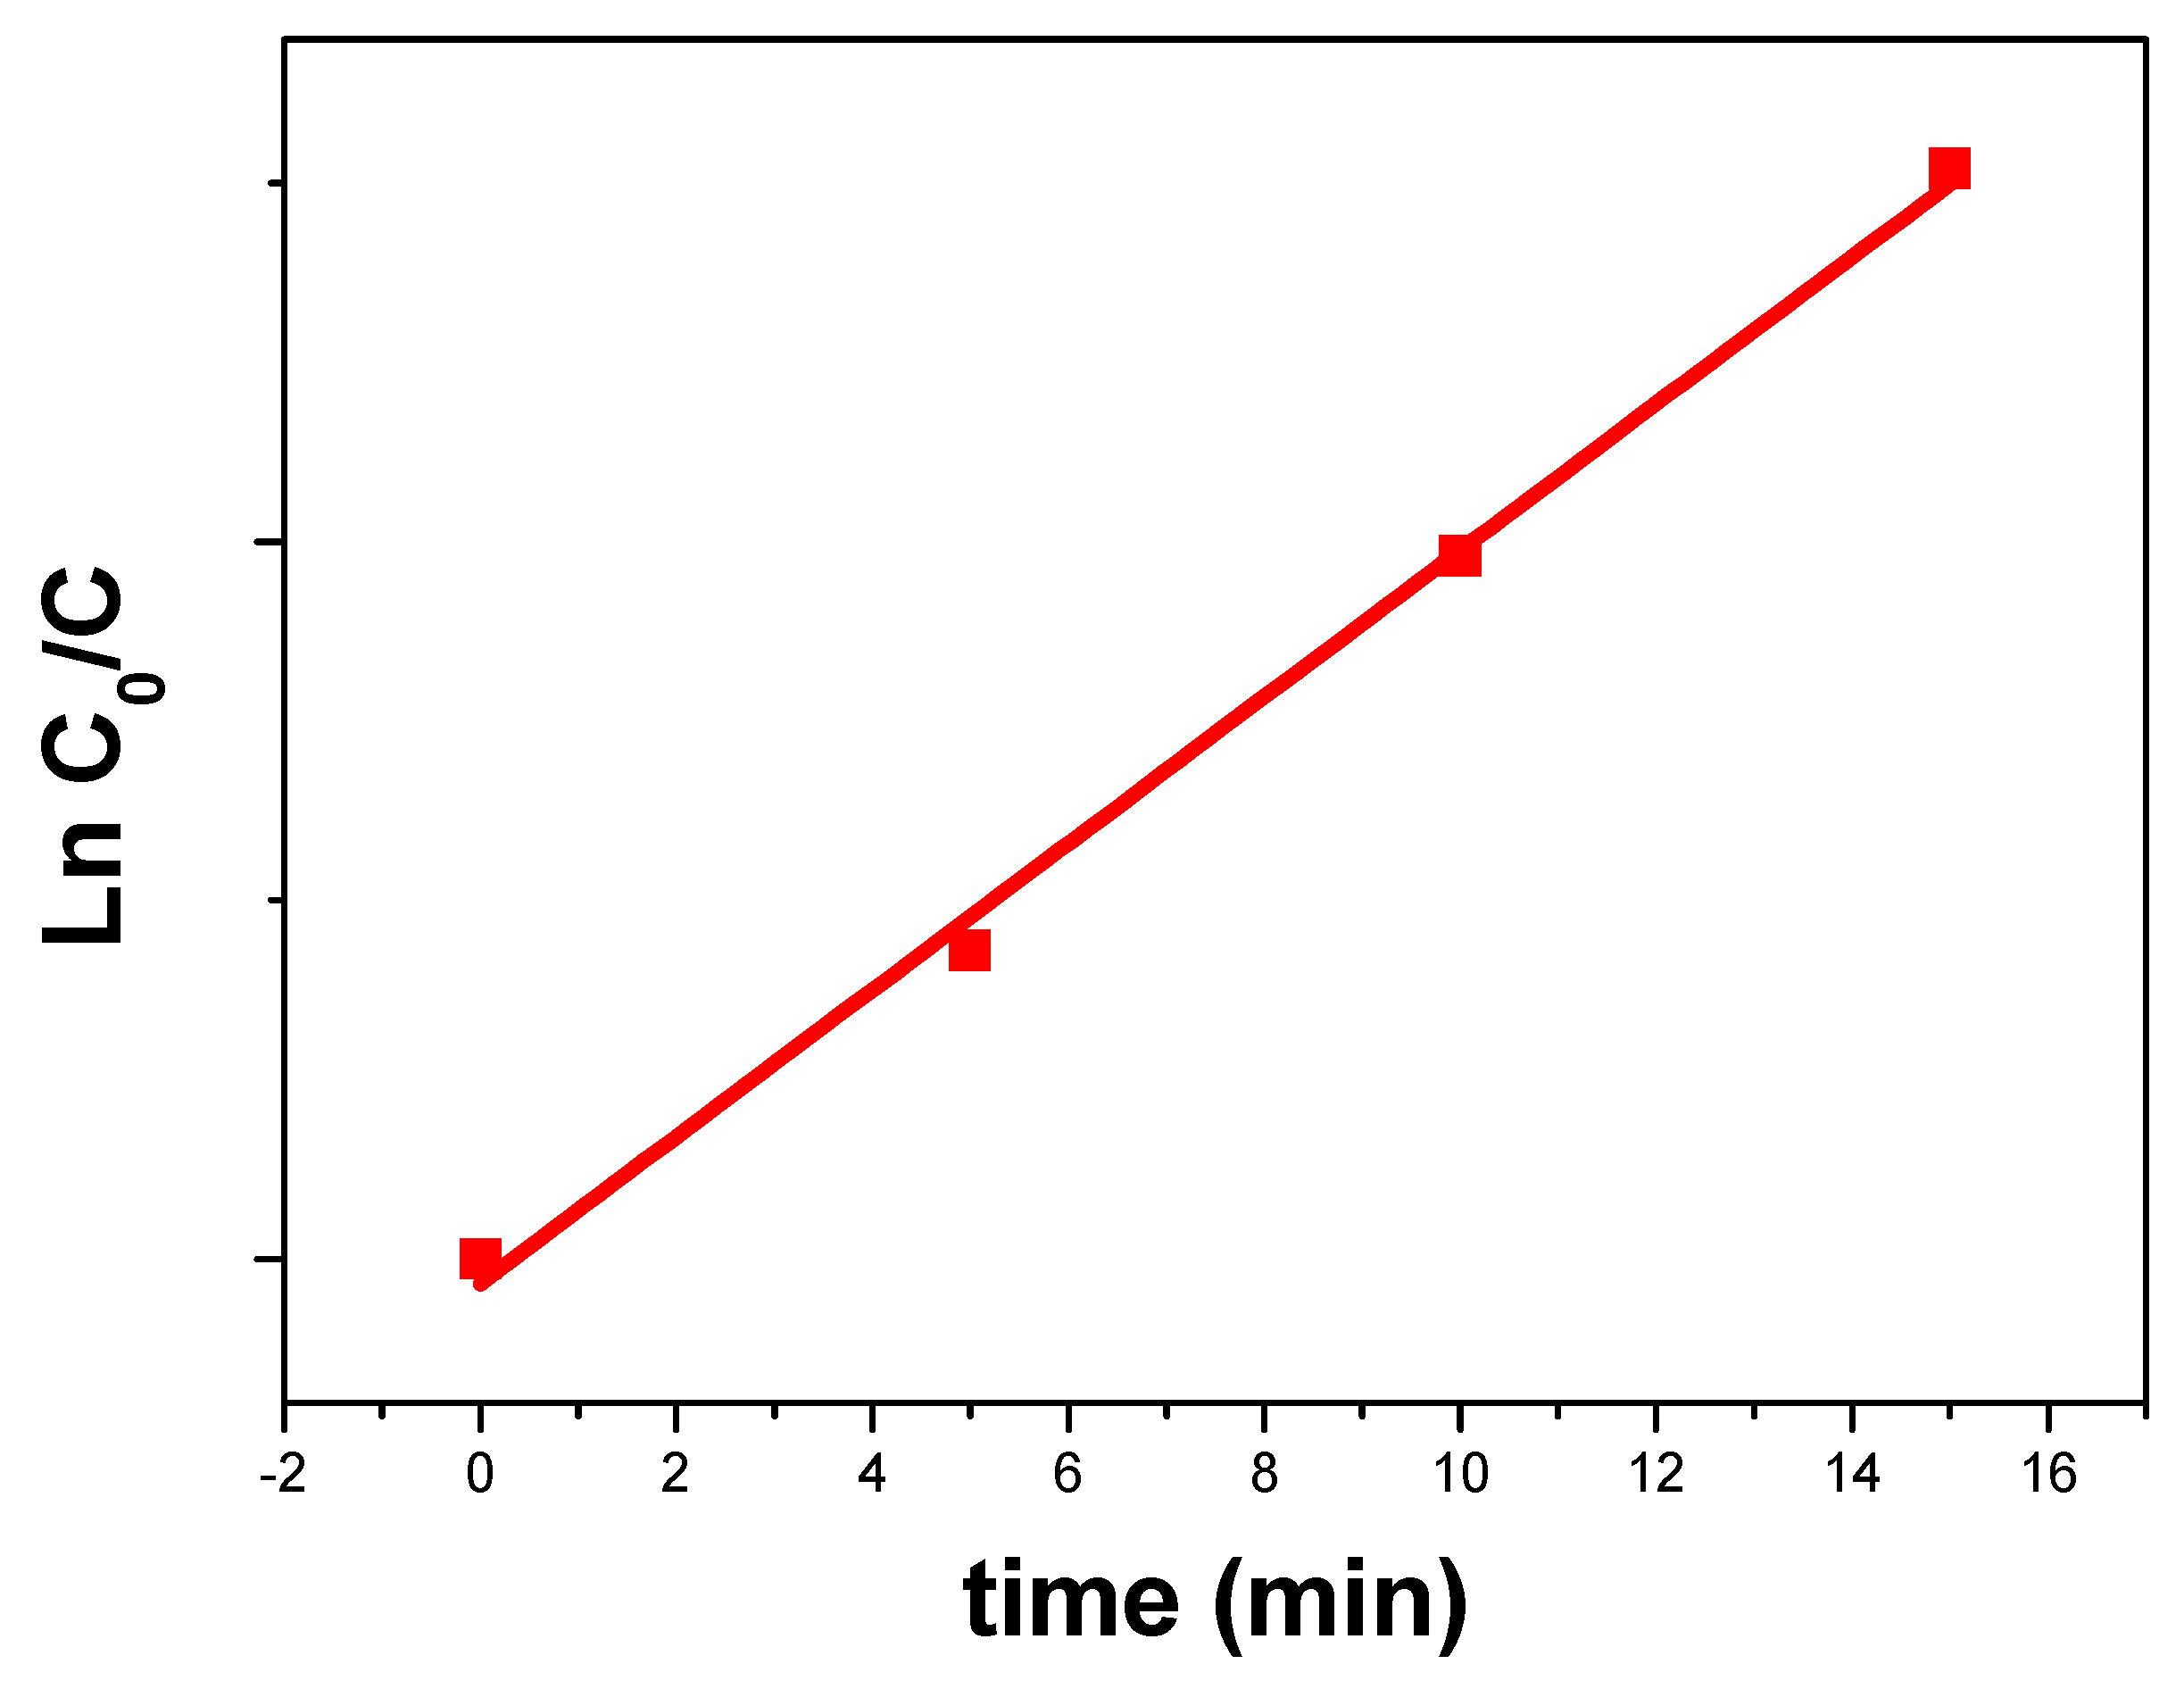
2.5.2. Kinetic Analysis under Visible Light
2.5.3. Degradation Extent (%) of Methyl Orange
2.5.4. Degradation Products: Mineralization
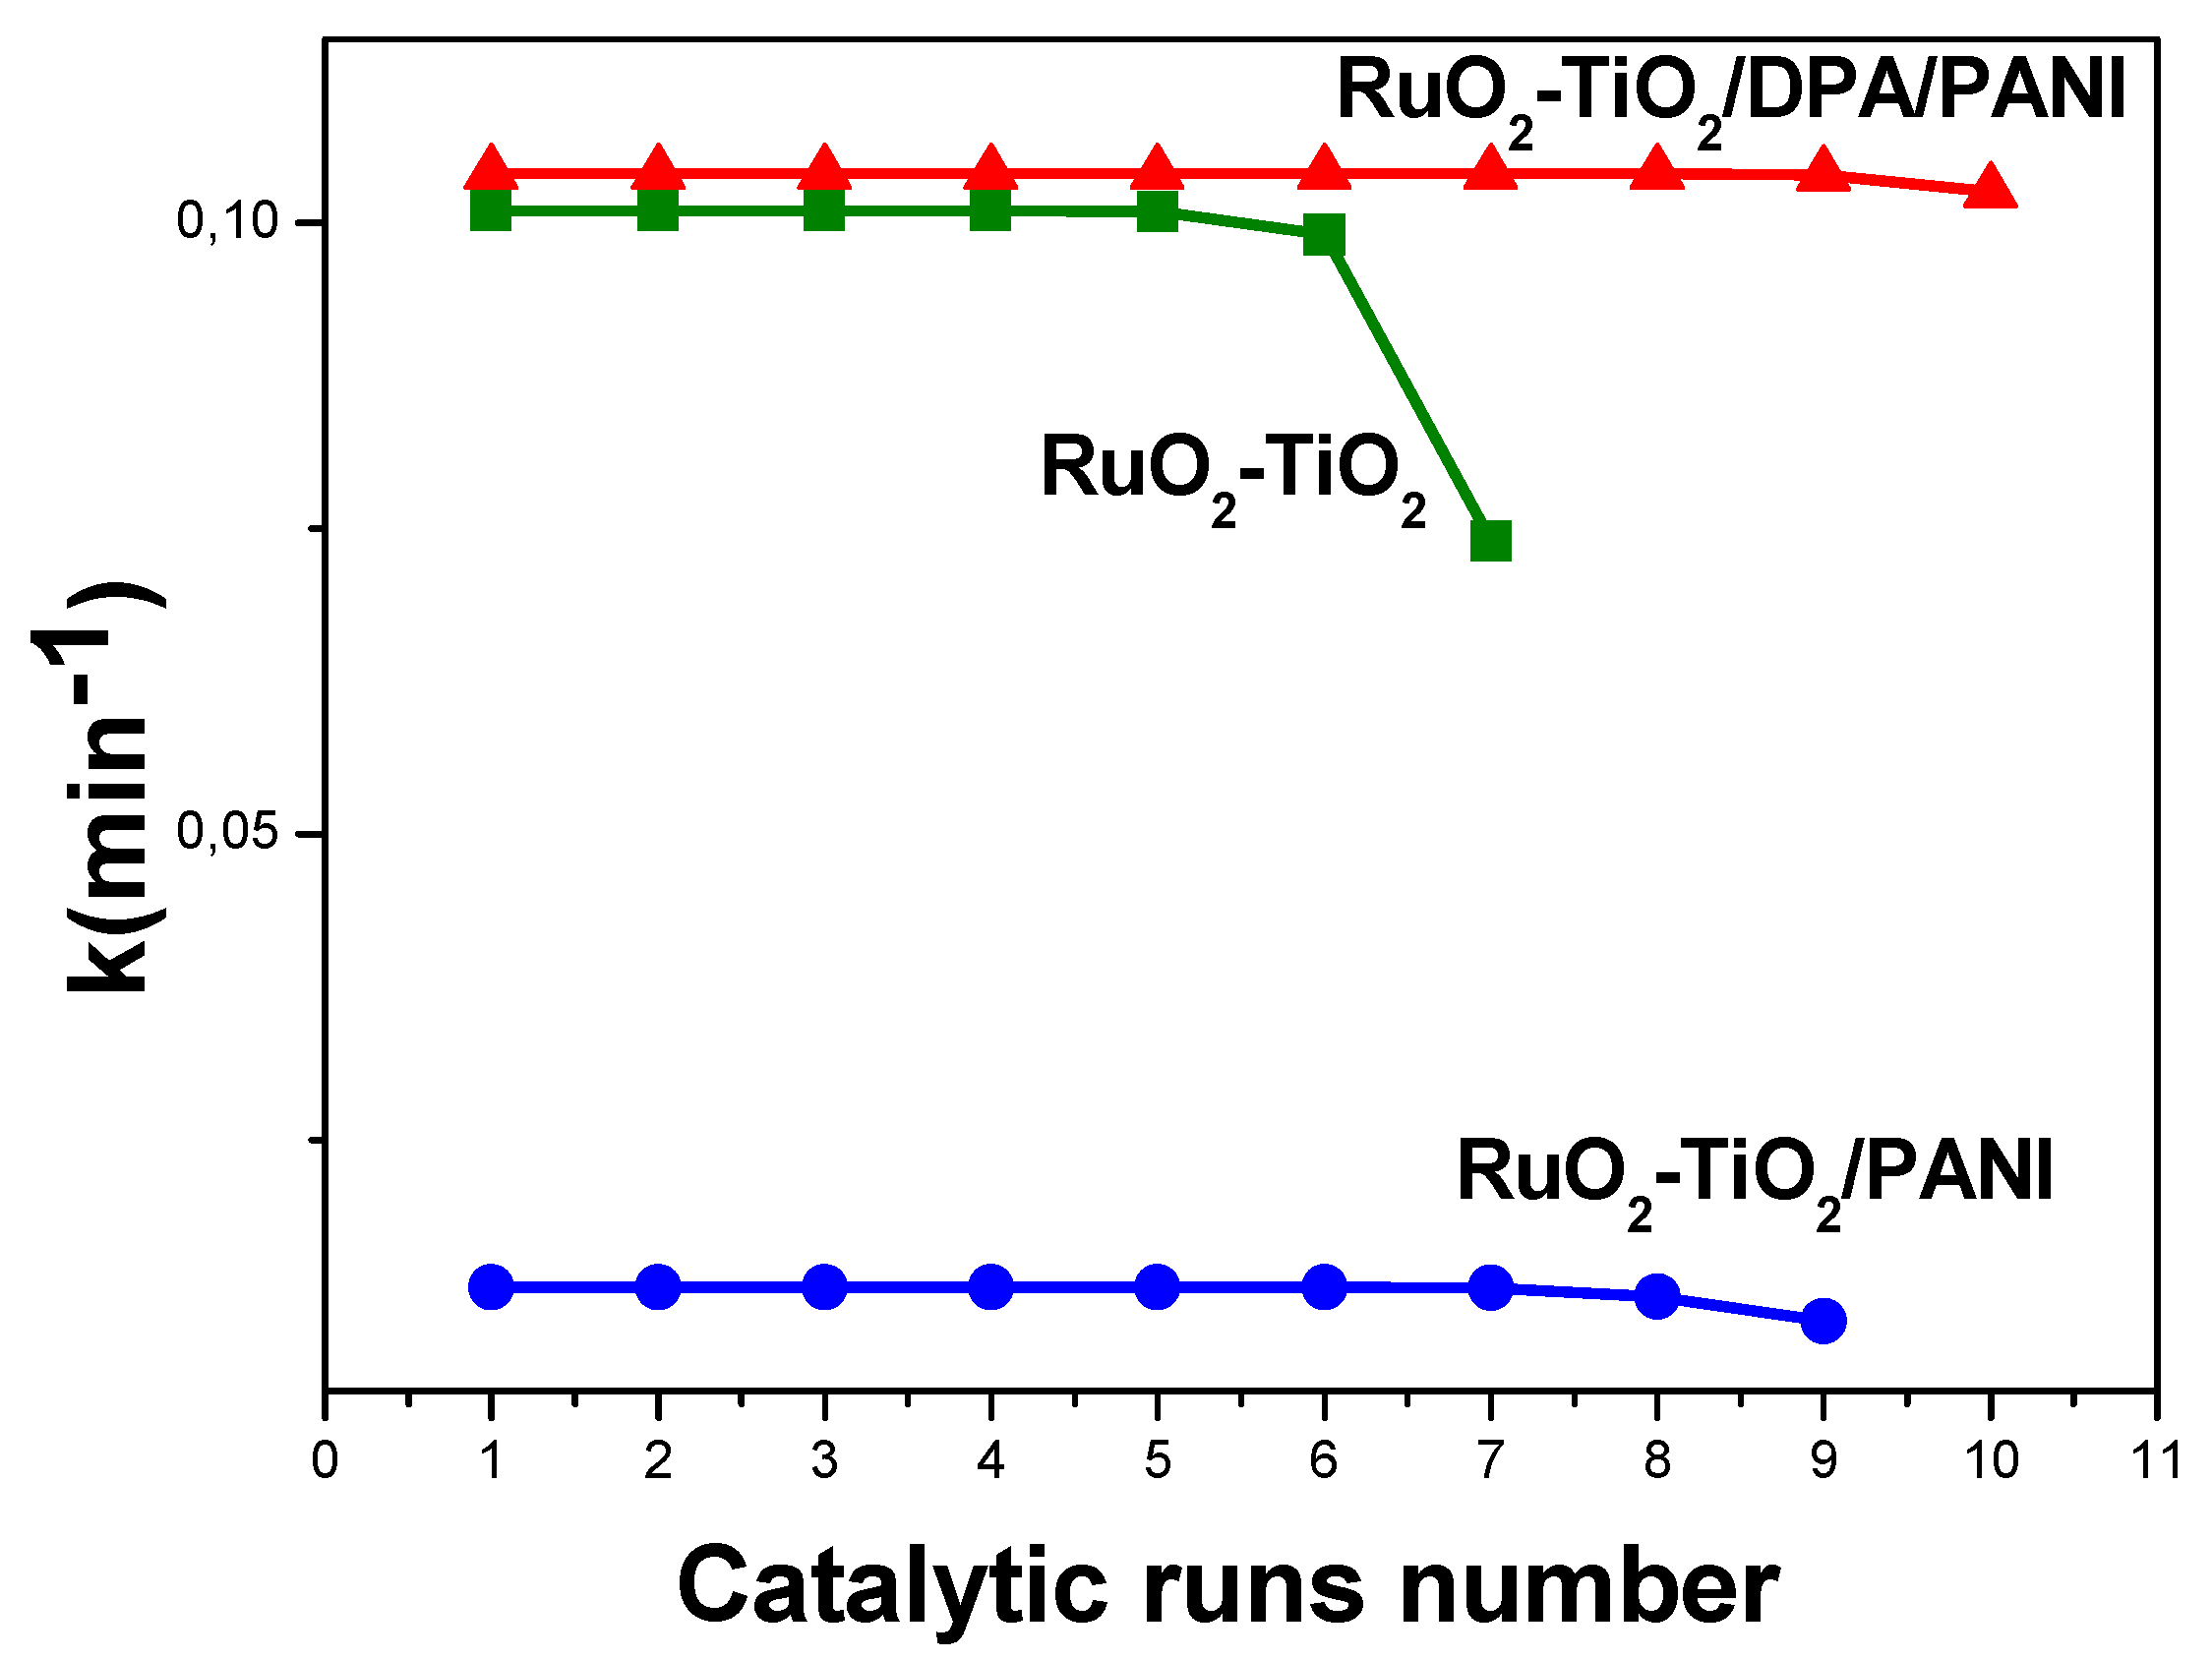
2.5.5. Stability of the Catalysts
3. Experimental
3.1. Chemicals
3.2. Methods
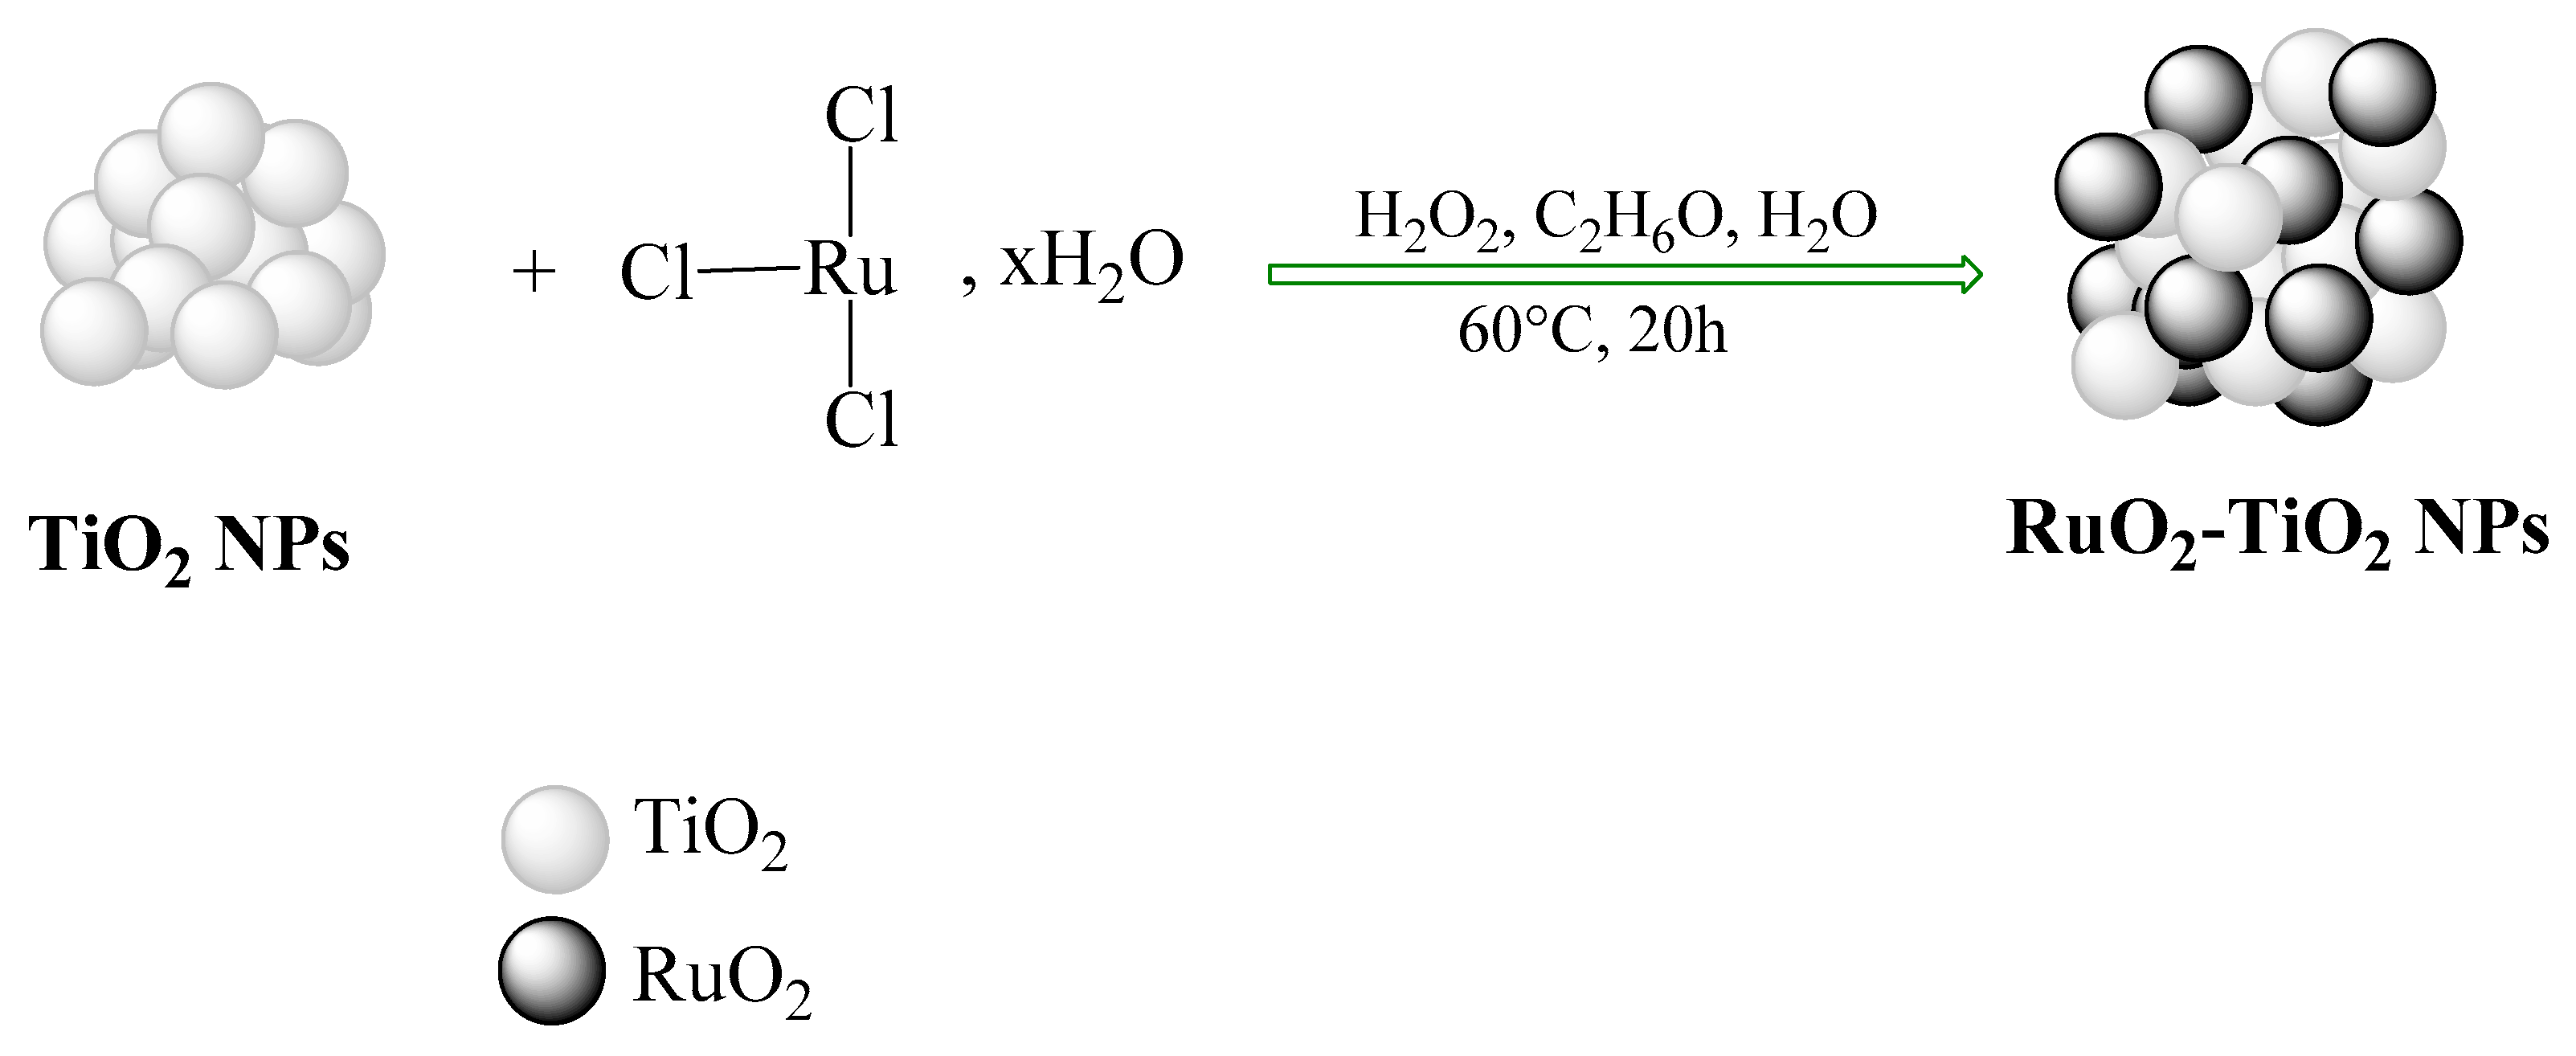
3.2.1. Preparation of RuO2-TiO2 Powders
3.2.2. Synthesis of 4-diphenylamine Diazonium Tetrafluoroborate
3.2.3. Preparation of RuO2-TiO2/PANI, RuO2-TiO2/DPA/PANI Nanocomposites
3.2.4. Catalytic and Photocatalytic Activity
3.3. Characterization and Instrumentation
4. Conclusions
Author Contributions
Funding
Conflicts of Interest
References
- Nguyen, C.C.; Vu, N.N.; Do, T.O. Efficient hollow double-shell photocatalysts for the degradation of organic pollutants under visible light and in darkness. J. Mater. Chem A 2016, 4, 4413–4419. [Google Scholar] [CrossRef]
- Wu, L.; Bresser, D.; Buchholz, D.; Giffin, G.A.; Castro, C.R.; Ochel, A.; Passerini, S. Unfolding the mechanism of sodium insertion in anatase TiO2 nanoparticles. Adv. Energy Mater. 2015, 5, 2. [Google Scholar] [CrossRef]
- Tahir, M.; Amin, N.S. Indium-doped TiO2 nanoparticles for photocatalytic CO2 reduction with H2O vapors to CH4. Appl. Catal. B Environ. 2015, 162, 98–109. [Google Scholar] [CrossRef]
- Bai, S.; Gao, C.; Low, J.; Xiong, Y. Crystal phase engineering on photocatalytic materials for energy and environmental applications. Nano. Res. 2018, 1–24. [Google Scholar] [CrossRef]
- Kang, X.; Liu, S.; Dai, Z.; He, Y.; Song, X.; Tan, Z. Titanium Dioxide: From Engineering to Applications. Catalysts 2019, 9, 191. [Google Scholar] [CrossRef]
- Zhou, W.; Yin, Z.; Du, Y.; Huang, X.; Zeng, Z.; Fan, Z.; Liu, H.; Wang, J.; Zhang, H. Synthesis of few-layer MoS2 nanosheet-coated TiO2 nanobelt heterostructures for enhanced photocatalytic activities. Small 2013, 9, 140–147. [Google Scholar] [CrossRef]
- Uddin, M.T.; Nicolas, Y.; Olivier, C.; Toupance, T.ä.; Müller, M.M.; Kleebe, H.J.; Rachut, K.; Ziegler, J.; Klein, A.; Jaegermann, W. Preparation of RuO2/TiO2 mesoporous heterostructures and rationalization of their enhanced photocatalytic properties by band alignment investigations. J. Phys. Chem. C 2013, 117, 22098–22110. [Google Scholar] [CrossRef]
- Cao, B.; Li, G.; Li, H. Hollow spherical RuO2@TiO2@Pt bifunctional photocatalyst for coupled H2 production and pollutant degradation. Appl. Catal. B Environ. 2016, 194, 42–49. [Google Scholar] [CrossRef]
- Yang, H.; Bright, J.; Kasani, S.; Zheng, P.; Musho, T.; Chen, B.; Huang, L.; Wu, N. Metal–organic framework coated titanium dioxide nanorod array p–n heterojunction photoanode for solar water-splitting. Nano. Res. 2019, 12, 643–650. [Google Scholar] [CrossRef]
- Chakraborty, A.K.; Hossain, M.E.; Rhaman, M.M.; Sobahan, K.M.A. Fabrication of Bi2O3/TiO2 nanocomposites and their applications to the degradation of pollutants in air and water under visible-light. J. Environ. Sci. 2014, 26, 458–465. [Google Scholar] [CrossRef]
- Kongsong, P.; Sikong, L.; Masae, M.; Singsang, W.; Niyomwas, S.; Rachpech, V. Photocatalytic antibacterial performance of PVP-doped SnO2/TiO2 thin films coated on glass fibers. Songklanakarin J. Sci. Technol. 2018, 40, 659–665. [Google Scholar] [CrossRef]
- Zhang, L.; Yu, W.; Han, C.; Guo, J.; Zhang, Q.; Xie, H.; Guo, Z. Large scaled synthesis of heterostructured electrospun TiO2/SnO2 nanofibers with an enhanced photocatalytic activity. J. Electrochem. Soc. 2017, 164, H651–H656. [Google Scholar] [CrossRef]
- Rudakova, A.V.; Emeline, A.V.; Bahnemann, D.W. Effect of the TiO2-ZnO Heterostructure on the Photoinduced Hydrophilic Conversion of TiO2 and ZnO Surfaces. J. Phys. Chem. C 2019, 123. [Google Scholar] [CrossRef]
- Wang, D.P.; Zeng, H.C. Multifunctional roles of TiO2 nanoparticles for architecture of complex core− shells and hollow spheres of SiO2−TiO2−polyaniline system. Chem. Mater. 2009, 21, 4811–4823. [Google Scholar] [CrossRef]
- Eskandari, P.; Farhadian, M.; Solaimany Nazar, A.R.; Jeon, B.H. Adsorption and photodegradation efficiency of TiO2/Fe2O3/PAC and TiO2/Fe2O3/zeolite nanophotocatalysts for the removal of cyanide. Ind. Eng. Chem. Res. 2019, 58, 2099–2112. [Google Scholar] [CrossRef]
- Yao, L.; Wang, W.; Wang, L.; Liang, Y.; Fu, J.; Shi, H. Chemical bath deposition synthesis of TiO2/Cu2O core/shell nanowire arrays with enhanced photoelectrochemical water splitting for H2 evolution and photostability. Inter. J. Hydrogen Energy. 2018, 43, 15907–15917. [Google Scholar] [CrossRef]
- Chen, Z.; Gao, Y.; Zhang, Q.; Li, L.; Ma, P.; Xing, B.; Zhang, Z. TiO2/NiO/reduced graphene oxide nanocomposites as anode materials for high-performance lithium ion batteries. J. Alloys. Compd. 2019, 774, 873–878. [Google Scholar] [CrossRef]
- Saavedra, J.; Pursell, C.J.; Chandler, B.D. CO oxidation kinetics over Au/TiO2 and Au/Al2O3 catalysts: evidence for a common water-assisted mechanism. J. Am. Chem. Soc. 2018, 140, 3712–3723. [Google Scholar] [CrossRef]
- Petronella, F.; Truppi, A.; Striccoli, M.; Curri, M.L.; Comparelli, R. Photocatalytic Application of Ag/TiO2 Hybrid Nanoparticles. In Noble Metal-Metal Oxide Hybrid Nanoparticles; Woodhead Publishing: Cambridge, UK, 2019. [Google Scholar]
- Wang, F.; Wong, R.J.; Ho, J.H.; Jiang, Y.; Amal, R. Sensitization of Pt/TiO2 using plasmonic Au nanoparticles for hydrogen evolution under visible-light irradiation. ACS Appl. Mater. Inter. 2017, 9, 30575–30582. [Google Scholar] [CrossRef]
- Tian, J.; Zhao, Z.; Kumar, A.; Boughton, R.I.; Liu, H. Recent progress in design, synthesis, and applications of one-dimensional TiO2 nanostructured surface heterostructures: a review. Chem. Soc. Rev. 2014, 43, 6920–6937. [Google Scholar] [CrossRef]
- Panić, V.; Dekanski, A.; Wang, G.; Fedoroff, M.; Milonjić, S.; Nikolić, B. Morphology of RuO2–TiO2 coatings and TEM characterization of oxide sols used for their preparation. J. Colloid. Inter. Sci. 2003, 263, 68–73. [Google Scholar] [CrossRef]
- Tian, J.; Hu, X.; Wei, N.; Zhou, Y.; Xu, X.; Cui, H.; Liu, H. RuO2/TiO2 nanobelt heterostructures with enhanced photocatalytic activity and gas-phase selective oxidation of benzyl alcohol. Sol. Energy Mater. Sol. Cells. 2016, 151, 7–13. [Google Scholar] [CrossRef]
- Näslund, L.Å.; Sánchez-Sánchez, C.M.; Ingason, Á.S.; Bäckström, J.; Herrero, E.; Rosen, J.; Holmin, S. The role of TiO2 doping on RuO2-coated electrodes for the water oxidation reaction. J. Phys. Chem. C. 2013, 117, 6126–6135. [Google Scholar] [CrossRef]
- Mitsuhashi, T.; Watanabe, A. Anomalies in heat capacity measurements of RuO2-TiO2 system. J. Therm. Anal. Calorim. 2000, 60, 683–689. [Google Scholar] [CrossRef]
- Riga, J.; Tenret-Noel, C.; Pireaux, J.J.; Caudano, R.; Verbist, J.J.; Gobillon, Y. Electronic structure of rutile oxides TiO2, RuO2 and IrO2 studied by X-ray photoelectron spectroscopy. Phys. Scr. 1977, 16, 351. [Google Scholar] [CrossRef]
- Ismail, A.A.; Bahnemann, D.W.; Al-Sayari, S.A. Synthesis and photocatalytic properties of nanocrystalline Au, Pd and Pt photodeposited onto mesoporous RuO2-TiO2 nanocomposites. App. Catal A Gen. 2012, 431, 62–68. [Google Scholar] [CrossRef]
- Silva, L.M.; dos Santos, R.P.; Morais, C.C.; Vasconcelos, C.L.; Martínez-Huitle, C.A.; Castro, S.S. Anodic oxidation of the insecticide imidacloprid on mixed metal oxide (RuO2-TiO2 and IrO2-RuO2-TiO2) anodes. J. Electrochim. Soc. 2017, 164, E489–E495. [Google Scholar] [CrossRef]
- Jiao, Y.; Jiang, H.; Chen, F. RuO2/TiO2/Pt ternary photocatalysts with epitaxial heterojunction and their application in CO oxidation. Acs. Catal. 2014, 4, 2249–2257. [Google Scholar] [CrossRef]
- Kuramasu, K.; Saito, S.; Okano, K.; Takahashi, Y. Resistor film by thermal decomposition technique and thermal decomposition characteristics of its source materials. J. Ceram. Soc. Jpn. 1996, 104, 844–849. [Google Scholar] [CrossRef]
- Ismail, A.A.; Robben, L.; Bahnemann, D.W. Study of the Efficiency of UV and Visible-Light Photocatalytic Oxidation of Methanol on Mesoporous RuO2–TiO2 Nanocomposites. ChemPhysChem 2011, 12, 982–991. [Google Scholar] [CrossRef]
- Houšková, V.; Štengl, V.; Bakardjieva, S.; Murafa, N.; Tyrpekl, V. Efficient gas phase photodecomposition of acetone by Ru-doped Titania. Appl. Catal. B Environ. 2009, 89, 613–619. [Google Scholar] [CrossRef]
- Amama, P.B.; Itoh, K.; Murabayashi, M. Effect of RuO2 deposition on the activity of TiO2: Photocatalytic oxidation of trichloroethylene in aqueous phase. J. mater.Sci. 2004, 39, 4349–4351. [Google Scholar] [CrossRef]
- Košević, M.; Stopic, S.; Cvetković, V.; Schroeder, M.; Stevanović, J.; Panić, V.; Friedrich, B. Mixed RuO2/TiO2 uniform microspheres synthesized by low-temperature ultrasonic spray pyrolysis and their advanced electrochemical performances. Appl. Surf. Sci. 2019, 464, 1–9. [Google Scholar] [CrossRef]
- Panić, V.; Dekanski, A.; Milonjić, S.; Atanasoski, R.; Nikolić, B. The influence of the aging time of RuO2 and TiO2 sols on the electrochemical properties and behavior for the chlorine evolution reaction of activated titanium anodes obtained by the sol-gel procedure. Electrochim. Acta. 2000, 46, 415–421. [Google Scholar] [CrossRef]
- Mitrovic, D.; Panic, V.; Dekanski, A.L.E.K.S.A.N.D.A.R.; Milonjic, S.; Atanasoski, R.A.D.O.S.L.A.V.; Nikolic, B. The effect of the composition of the dispersing medium of oxide sols on the electrocatalytic activity of sol-gel obtained RuO2-TiO2/Ti anodes. J. Serb. Chem. Soc. 2001, 66, 847–858. [Google Scholar] [CrossRef]
- Buenviaje, J.S.C.; Usman, K.A.S.; Payawan, J.L.M. AIP Conference Proceedings; AIP Publishing: Melville, NY, USA, 2018; Volume 1958, p. 020015. [Google Scholar]
- Gnanasekaran, L.; Hemamalini, R.; Naushad, M. Efficient photocatalytic degradation of toxic dyes using nanostructured TiO2/polyaniline nanocomposite. Water Treat. 2018, 108, 322–328. [Google Scholar] [CrossRef]
- Zhao, Z.; Zhou, Y.; Wan, W.; Wang, F.; Zhang, Q.; Lin, Y. Nanoporous TiO2/polyaniline composite films with enhanced photoelectrochemical properties. Mater. Lett. 2014, 130, 150–153. [Google Scholar] [CrossRef]
- Li, J.; Xiao, Q.; Li, L.; Shen, J.; Hu, D. Novel ternary composites: Preparation, performance and application of ZnFe2O4/TiO2/polyaniline. Appl. Surf. Sci. 2015, 331, 108–114. [Google Scholar] [CrossRef]
- Mousli, F.; Chaouchi, A.; Hocine, S.; Lamouri, A.; Vilar, M.R.; Kadri, A.; Chehimi, M.M. Diazonium-modified TiO2/polyaniline core/shell nanoparticles. Structural characterization, interfacial aspects and photocatalytic performances. App. Surf. Sci. 2019, 465, 1078–1095. [Google Scholar] [CrossRef]
- Chehimi, M.M. Aryl Diazonium Salts: New Coupling Agents in Polymer and Surface Science; Wiley-VCH: Weinheim, Germany, 2012. [Google Scholar]
- Mohamed, A.A.; Salmi, Z.; Dahoumane, S.A.; Mekki, A.; Carbonnier, B.; Chehimi, M.M. Functionalization of nanomaterials with aryldiazonium salts. Adv. Colloid. Interface Sci. 2015, 225, 16–36. [Google Scholar] [CrossRef] [PubMed]
- Mirkhalaf, F.; Graves, J.E. Nanostructured electrocatalysts immobilised on electrode surfaces and organic film templates. Chem. Pap. 2012, 66, 472–483. [Google Scholar] [CrossRef]
- Salmi, Z.; Gam-Derouich, S.; Mahouche-Chergui, S.; Turmine, M.; Chehimi, M. On the interfacial chemistry of aryl diazonium compounds in polymer science. Chem. Pap. 2012, 66, 369–391. [Google Scholar] [CrossRef]
- Lo, M.; Pires, R.; Diaw, K.; Gningue-Sall, D.; Oturan, M.A.; Aaron, J.J.; Chehimi, M.M. Diazonium salts: versatile molecular glues for sticking conductive polymers to flexible electrodes. Surfaces 2018, 1, 5. [Google Scholar] [CrossRef]
- Marques, F.C.; Canela, M.C.; Stumbo, A.M. Hydrogen Production from Aqueous Solutions of Glycerol on TiO2/Ru-MCM-41 Photocatalysts Using Solar Light. Top. Catal. 2017, 60, 1196–1209. [Google Scholar] [CrossRef]
- Li, Y.; Qin, Z.; Guo, H.; Yang, H.; Zhang, G.; Ji, S.; Zeng, T. Low-temperature synthesis of anatase TiO2 nanoparticles with tunable surface charges for enhancing photocatalytic activity. PLoS ONE 2014, 9, e114638. [Google Scholar] [CrossRef] [PubMed]
- Mianxince, S.O.N.G.; Liang, B.; Tianliang, Z.; Xiaoyong, Z.H.A.O. Surface potential and photocatalytic activity of rare earths doped TiO2. J. Rare Earths. 2008, 26, 693–699. [Google Scholar]
- Uchikoshi, T.; Suzuki, T.S.; Iimura, S.; Tang, F.; Sakka, Y. Control of crystalline texture in polycrystalline TiO2 (Anatase) by electrophoretic deposition in a strong magnetic field. J. Eur. Ceram. Soc. 2006, 26, 559–563. [Google Scholar] [CrossRef]
- Gogoi, P.; Kumar, T.S.; Sharma, P.; Pamu, D. Structural, optical, dielectric and electrical studies on RF sputtered nanocrystalline Zr doped MgTiO3 thin films. J. Alloys Comp. 2015, 619, 527–537. [Google Scholar] [CrossRef]
- Tabib, A.; Sdiri, N.; Elhouichet, H.; Férid, M. Investigations on electrical conductivity and dielectric properties of Na doped ZnO synthesized from sol gel method. J. Alloys Compd. 2015, 622, 687–694. [Google Scholar] [CrossRef]
- Badr, A.M.; Elshaikh, H.A.; Ashraf, I.M. Impacts of temperature and frequency on the dielectric properties for insight into the nature of the charge transports in the Tl2S layered single crystals. J. Mod. Phys. 2011, 2, 12. [Google Scholar] [CrossRef]
- Fröhlich, K.; Cambel, V.; Machajdík, D.; Baumann, P.K.; Lindner, J.; Schumacher, M.; Juergensen, H. Low-temperature growth of RuO2 films for conductive electrode applications. Mater. Sci. Semicond. Proc. 2002, 5, 173–177. [Google Scholar] [CrossRef]
- Jelenkovic, E.V.; Tong, K.Y.; Cheung, W.Y.; Wong, S.P. RuO2–SiO2 composite thin films with wide resistivity range. Microelectron. Eng. 2004, 71, 237–241. [Google Scholar] [CrossRef]
- Huang, J.H.; Chen, J.S. Material characteristics and electrical property of reactively sputtered RuO2 thin films. Thin Solid Films. 2001, 382, 139–145. [Google Scholar] [CrossRef]
- Cao, Y.; Smith, P.; Heeger, A.J. Counter-ion induced processibility of conducting polyaniline and of conducting polyblends of polyaniline in bulk polymers. Synth. Met. 1992, 48, 91. [Google Scholar] [CrossRef]
- Hadj Salah, N. Etude de la dégradation photocatalytique de polluants organiques en présence de dioxyde de titane, en suspension aqueuse et en lit fixe. Ph.D. Thesis, Université de Grenoble, Saint-Martin-d’Hères, France, 2012. Available online: https://tel.archives-ouvertes.fr/tel-00781668/ (accessed on 28 March 2019).
- Gao, L.B.; Liu, S.H.; Zhang, L.Y.; Shi, L.X.; Chen, Z.N. Preparation, Characterization, Redox Properties, and UV− Vis− NIR Spectra of Binuclear Ruthenium Complexes [{(Phtpy)(PPh3)2Ru}2{C⋮C−(CH=CH)m−C⋮C}]n+ (Phtpy = 4′-phenyl-2,2′:6,2″-terpyridine). Organometallics 2006, 25, 506–512. [Google Scholar] [CrossRef]
- Uddin, M.T. Metal oxide heterostructures for efficient photocatalysts. Ph.D. Thesis, Université Sciences et Technologies-Bordeaux I, Talence, France, 2013. Available online: https://tel.archives-ouvertes.fr/tel-00879226/ (accessed on 1 April 2019).
- Li, X.; Wang, D.; Cheng, G.; Luo, Q.; An, J.; Wang, Y. Preparation of polyaniline-modified TiO2 nanoparticles and their photocatalytic activity under visible light illumination. Appl. Catal B Environ. 2008, 81, 267–273. [Google Scholar] [CrossRef]
- Wahyuni, S.; Kunarti, E.S.; Swasono, R.T.; Kartini, I. Characterization and Photocatalytic Activity of TiO2 (rod)-SiO2-Polyaniline Nanocomposite. Indones. J. Chem. 2018, 18, 321–330. [Google Scholar]
- Masid, S.; Tayade, R.; Rao, N.N. Efficient visible light active polyaniline/TiO2 nanocomposite photocatalyst for degradation of Reactive Blue 4. Int. J. Photocatal. Photon. 2015, 119, 190–203. [Google Scholar]
- Min, S.; Wang, F.; Han, Y. An investigation on synthesis and photocatalytic activity of polyaniline sensitized nanocrystalline TiO2 composites. J. Mater. Sci. 2007, 42, 9966–9972. [Google Scholar] [CrossRef]
- Musić, S.; Popović, S.; Maljković, M.; Furić, K.; Gajović, A. Influence of synthesis procedure on the formation of RuO2. Mater. Lett. 2002, 56, 806–811. [Google Scholar] [CrossRef]
- Leroux, Y.R.; Fei, H.; Noël, J.M.; Roux, C.; Hapiot, P. Efficient covalent modification of a carbon surface: use of a silyl protecting group to form an active monolayer. J. Am. Chem. Soc. 2010, 132, 14039–14041. [Google Scholar] [CrossRef] [PubMed]
- Orefuwa, S.A.; Ravanbakhsh, M.; Neal, S.N.; King, J.B.; Mohamed, A.A. Robust Organometallic Gold Nanoparticles. Organometallics 2013, 33, 439–442. [Google Scholar] [CrossRef]
- Tanzifi, M.; Hosseini, S.H.; Kiadehi, A.D.; Olazar, M.; Karimipour, K.; Rezaiemehr, R.; Ali, I. Artificial neural network optimization for methyl orange adsorption onto polyaniline nano-adsorbent: kinetic, isotherm and thermodynamic studies. J. Mol. Liquids. 2017, 244, 189–200. [Google Scholar] [CrossRef]
- Baibarac, M.; Baltog, I.; Frunza, S.; Magrez, A.; Schur, D.; Zaginaichenko, S.Y. Single-walled carbon nanotubes functionalized with polydiphenylamine as active materials for applications in the supercapacitors field. Diamond. Relat. Mater. 2013, 32, 72–82. [Google Scholar] [CrossRef]
- Chen, Y.M.; Korotcov, A.; Hsu, H.P.; Huang, Y.S.; Tsai, D.S. Raman scattering characterization of well-aligned RuO2 nanocrystals grown on sapphire substrates. New J. Phys. 2007, 9, 130. [Google Scholar] [CrossRef]
- Ceballos-Chuc, M.C.; Ramos-Castillo, C.M.; Alvarado-Gil, J.J.; Oskam, G.; Rodríguez-Gattorno, G. Influence of Brookite Impurities on the Raman Spectrum of TiO2 Anatase Nanocrystals. J. Phys. Chem. C 2018, 122, 19921–19930. [Google Scholar] [CrossRef]
- Mar, S.Y.; Chen, C.S.; Huang, Y.S.; Tiong, K.K. Characterization of RuO2 thin films by Raman spectroscopy. Appl. Surf. Sci. 1995, 90, 497–504. [Google Scholar] [CrossRef]
- Barthet, C.; Armes, S.P.; Chehimi, M.M.; Bilem, C.; Omastova, M. Surface characterization of polyaniline-coated polystyrene latexes. Langmuir. 1998, 14, 5032–5038. [Google Scholar] [CrossRef]
- Bıçak, N.; Şenkal, B.F.; Sezer, E. Preparation of organo-soluble polyanilines in ionic liquid. Synth. Met. 2005, 155, 105–109. [Google Scholar] [CrossRef]
- Wang, Y.; Zheng, H.; Jia, L.; Li, H.; Li, T.; Chen, K.; Gu, Y. Optimizing the polymerization conditions of soluble polyaniline doped with itaconic acid. J. Macromol. Sci. Part A 2014, 51, 577–581. [Google Scholar] [CrossRef]
- Wang, Z.; Shen, L.; Zhu, S. Synthesis of Core-Shell Fe3O4@SiO2@TiO2 microspheres and Their Application as Recyclable Photocatalysts. Int. J. Photoenergy. 2012. [Google Scholar] [CrossRef]
- Ammuri, A.; Hejiouej, S.; Ziat, K.; Saidi, M. Dégradation photo-catalytique d’un colorant azoïque, orange de méthyle, par une suspension aqueuse de trioxyde de bismuth (photodegradation of methyl orange in solution in presence of bismuth trioxide). Mater. Environ. Sci. 2014, 5, 2066–2072. [Google Scholar]
- Chen, L.C.; Tsai, F.R.; Huang, C.M. Photocatalytic decolorization of methyl orange in aqueous medium of TiO2 and Ag–TiO2 immobilized on γ-Al2O3. J. Photochem. Photobiol A Chem. 2005, 170, 7–14. [Google Scholar] [CrossRef]
- Islam, M.T.; Jing, H.; Yang, T.; Zubia, E.; Goos, A.G.; Bernal, R.A.; Noveron, J.C. Fullerene stabilized gold nanoparticles supported on titanium dioxide for enhanced photocatalytic degradation of methyl orange and catalytic reduction of 4-nitrophenol. J. Environ. Chem. Eng. 2018, 6, 3827–3836. [Google Scholar] [CrossRef]
- Saleh, T.A.; Gupta, V.K. Photo-catalyzed degradation of hazardous dye methyl orange by use of a composite catalyst consisting of multi-walled carbon nanotubes and titanium dioxide. J. Colloid. Interface. Sci. 2012, 371, 101–106. [Google Scholar] [CrossRef] [PubMed]
- Chen, H.; Motuzas, J.; Martens, W.; da Costa, J.C.D. Degradation of azo dye Orange II under dark ambient conditions by calcium strontium copper perovskite. Appl. Catal B Environ. 2018, 221, 691–700. [Google Scholar] [CrossRef] [Green Version]
- Zubir, N.A.; Yacou, C.; Motuzas, J.; Zhang, X.; Zhao, X.S.; da Costa, J.C.D. The sacrificial role of graphene oxide in stabilising a Fenton-like catalyst GO–Fe3O4. Chem. Commun. 2015, 51, 9291–9293. [Google Scholar] [CrossRef] [PubMed]
- Zheng, J.; Gao, Z.; He, H.; Yang, S.; Sun, C. Efficient degradation of Acid Orange 7 in aqueous solution by iron ore tailing Fenton-like process. Chemosphere 2016, 150, 40–48. [Google Scholar] [CrossRef]
- Liang, X.; Zhong, Y.; Zhu, S.; Zhu, J.; Yuan, P.; He, H.; Zhang, J. The decolorization of Acid Orange II in non-homogeneous Fenton reaction catalyzed by natural vanadium–titanium magnetite. J. Hazard. Mater. 2010, 181, 112–120. [Google Scholar] [CrossRef]
- Leiw, M.Y.; Guai, G.H.; Wang, X.; Tse, M.S.; Ng, C.M.; Tan, O.K. Dark ambient degradation of Bisphenol A and Acid Orange 8 as organic pollutants by perovskite SrFeO3− δ metal oxide. J. Hazard. Mater. 2013, 260, 1–8. [Google Scholar] [CrossRef] [PubMed]
- Sun, M.; Jiang, Y.; Li, F.; Xia, M.; Xue, B.; Liu, D. Structure, dye degradation activity and stability of oxygen defective BaFeO3− x. Mater. Trans. 2010, 51(11), 1981–1989. [Google Scholar] [CrossRef]
- Wei, S.; Hu, X.; Liu, H.; Wang, Q.; He, C. Rapid degradation of Congo red by molecularly imprinted polypyrrole-coated magnetic TiO2 nanoparticles in dark at ambient conditions. J. Hazard. Mater. 2015, 294, 168–176. [Google Scholar] [CrossRef] [PubMed]
- Momenia, M.M.; Nazari, Z. Preparation of TiO2 and WO3–TiO2 nanotubes decorated with PbO nanoparticles by chemical bath deposition process: A stable and efficient photo catalyst. Ceramics Int. 2016, 42, 8691–8697. [Google Scholar] [CrossRef]
- Wang, P.; Qi, C.; Wen, P.; Hao, L.; Xu, X.; Agathopoulos, S. Synthesis of Si, N co-Doped Nano-Sized TiO2 with High Thermal Stability and Photocatalytic Activity by Mechanochemical Method. Nanomaterials 2018, 8, 294. [Google Scholar] [CrossRef] [PubMed]
- Uddin, M.T.; Babot, O.; Thomas, L.; Olivier, C.; Redaelli, M.; D’Arienzo, M.; . Toupance, T. New insights into the photocatalytic properties of RuO2/TiO2 mesoporous heterostructures for hydrogen production and organic pollutant photodecomposition. J. Phys. Chem. C 2015, 119, 7006–7015. [Google Scholar] [CrossRef]
- Li, P.; Song, Y.; Wang, S.; Tao, Z.; Yu, S.; Liu, Y. Enhanced decolorization of methyl orange using zero-valent copper nanoparticles under assistance of hydrodynamic cavitation. Ultrason. Sonochem. 2015, 22, 132–138. [Google Scholar] [CrossRef] [PubMed]
- Shen, T.; Jiang, C.; Wang, C.; Sun, J.; Wang, X.; Li, X. A TiO2 modified abiotic–biotic process for the degradation of the azo dye methyl orange. RSC. Adv. 2015, 5, 58704–58712. [Google Scholar] [CrossRef]
- Parshetti, G.K.; Telke, A.A.; Kalyani, D.C.; Govindwar, S.P. Decolorization and detoxification of sulfonated azo dye methyl orange by Kocuria rosea MTCC 1532. J. Hazard. Mater. 2010, 176, 503–509. [Google Scholar] [CrossRef] [PubMed]
- Babushkina, M.S.; Nikitina, L.P.; Goncharov, A.G.; Ponomareva, N.I. Water in the structure of minerals from mantle peridotites as controlled bythermal and redox conditions in the upper mantle. Geol. Ore Deposits. 2009, 51, 712–722. [Google Scholar] [CrossRef]
- Garand, E.; Wende, T.; Goebbert, D.J.; Bergmann, R.; Meijer, G.; Neumark, D.M.; Asmis, K.R. Infrared spectroscopy of hydrated bicarbonate anion clusters: HCO3−(H2O)1−10. J. Am. Chem. Soc. 2009, 132, 849–856. [Google Scholar] [CrossRef] [PubMed]
- Ge, L.; Han, C.; Liu, J. Novel visible light-induced g-C3N4/Bi2WO6 composite photocatalysts for efficient degradation of methyl orange. Appl. Catal B Environ. 2011, 108, 100–107. [Google Scholar] [CrossRef]


| Materials | e (cm) | R (Ω) | ρ (Ω. cm) | σ (S/cm) |
|---|---|---|---|---|
| TiO2 | 0.20 | 0.0119 | 0.0109 | 91.7 |
| RuO2-TiO2 | 0.23 | 0.0030 | 0.0032 | 317 |
| PANI | 0.21 | 0.0111 | 0.0106 | 94 |
| RuO2-TiO2/PANI | 0.23 | 0.0028 | 0.003 | 343 |
| RuO2-TiO2/DPA/PANI | 0.24 | 0.0024 | 0.0026 | 384 |
| Time (min) | |||||||
|---|---|---|---|---|---|---|---|
| Darkness | Visible light | ||||||
| Catalysts | 0 | 55 | 75 | 95 | 5 | 10 | 15 |
| without | 0 | 0 | 0 | 0 | 0 | 0 | 0 |
| RuO2-TiO2 | 0 | 0 | 0 | 0.1 | 36 | 62 | 98 |
| RuO2-TiO2/PANI | 0 | 57 | 74 | 98.7 | _ | _ | _ |
| RuO2-TiO2/DPA/PANI | 0 | 67 | 99.4 | _ | _ | _ | _ |
© 2019 by the authors. Licensee MDPI, Basel, Switzerland. This article is an open access article distributed under the terms and conditions of the Creative Commons Attribution (CC BY) license (http://creativecommons.org/licenses/by/4.0/).
Share and Cite
Mousli, F.; Chaouchi, A.; Jouini, M.; Maurel, F.; Kadri, A.; Chehimi, M.M. Polyaniline-Grafted RuO2-TiO2 Heterostructure for the Catalysed Degradation of Methyl Orange in Darkness. Catalysts 2019, 9, 578. https://0-doi-org.brum.beds.ac.uk/10.3390/catal9070578
Mousli F, Chaouchi A, Jouini M, Maurel F, Kadri A, Chehimi MM. Polyaniline-Grafted RuO2-TiO2 Heterostructure for the Catalysed Degradation of Methyl Orange in Darkness. Catalysts. 2019; 9(7):578. https://0-doi-org.brum.beds.ac.uk/10.3390/catal9070578
Chicago/Turabian StyleMousli, Fatima, Ahcène Chaouchi, Mohamed Jouini, François Maurel, Abdelaziz Kadri, and Mohamed M. Chehimi. 2019. "Polyaniline-Grafted RuO2-TiO2 Heterostructure for the Catalysed Degradation of Methyl Orange in Darkness" Catalysts 9, no. 7: 578. https://0-doi-org.brum.beds.ac.uk/10.3390/catal9070578