Performance Analysis of Biocathode in Bioelectrochemical CO2 Reduction

Department of Process, Energy and Environmental Technology, University of South-Eastern Norway, Kjølnes ring 56, 3918 Porsgrunn, Norway
*
Author to whom correspondence should be addressed.
Catalysts 2019, 9(8), 683; https://0-doi-org.brum.beds.ac.uk/10.3390/catal9080683
Submission received: 18 July 2019
/
Revised: 3 August 2019
/
Accepted: 8 August 2019
/
Published: 12 August 2019
(This article belongs to the Special Issue CO2 Capture and / or Its Transformation into Fuels or Valuable Chemicals)
Abstract
:Microbial electrosynthesis (MES) biogas upgrading is done via reduction of carbon dioxide to methane through electroactive microbial catalysis. The baseline MES mode of operation showed about a 39% increase in the methane production rate compared to the open circuit mode of operation. MES is capable of producing acetic acid at relatively more negative potential (−0.80 to –0.90 V vs. Standard Hydrogen Electrode (SHE)) than the potential at which it produces methane (−0.65 V vs. SHE). The optimum pH for enhancing the electroactive acetogens is found to be around 6.8–7.0 while a pH of around 7.0–7.5 enhances the electroactive methanogens performance. The biocathode adaptation test reveals that 45% of the methane was produced through the electrochemical pathway with a coulombic efficiency of 100% while maintaining heterotrophic efficiency above 99%.
1. Introduction
Anaerobic digestion (AD) is the most preferred method to treat communal sludge and other organic waste worldwide. AD is used to reduce large quantities of pollutants for safe disposal of organic waste generated from various domestic and industrial activities [1,2]. The main product of AD is the methane-containing biogas, which is a renewable source of energy used for various applications such as cooking, transport fuel, and to generate electricity [3,4,5]. The quality of biogas is determined by its methane content, which can be increased either by increasing the waste treatment efficiency or by reducing the carbon dioxide concentration.
Carbon capture utilisation and storage (CCUS) or carbon dioxide removal from industrial and transport emissions has lately been a prime focus of researchers, politicians, and environmentalists [6]. CCUS technologies have also been used to increase the quality of biogas to make AD more of a renewable energy technology than just as a waste treatment solution [7]. Several methods have been researched and put into practice for the commercial use of CCUS [8,9,10,11,12,13]. However, many of the methods have proven to be unsustainable or unprofitable in long term operational scenarios [14,15,16]. These studies reveal that standalone carbon capture and storage technologies are more expensive than the ones combined with biogas upgradation using methanation (Scenario 3, [14]).
The other way to increase biogas or methane production from AD plants is by increasing the efficiency of waste treatment. Currently, AD plants around the world are unable to retrieve the maximum possible methane production from the chemical oxygen demand (COD) of the waste fed into the plant. According to Dębowski et al. [17], the residual COD of effluent streams in many AD plants ranges from 1000 to 8000 mg/L, depending on the type of feed and the mode of operation of the biogas plant. In order to achieve lower residual COD levels in the effluent streams from AD plants, a post-treatment of reject water or process water is necessitated.
A microbial electrosynthesis system (MES), is one such technology that is able to act both as a post-treatment system for AD plants and as a CCU for the biogas produced. MES are capable of reducing carbon dioxide to various biochemicals (acetic acid, methane, etc.) of high industrial value, depending the operating conditions [18]. Different methods of reducing carbon dioxide to methane and the optimisation of such electrochemical operations has been previously discussed in Reference [19,20]. In this article, we study different pathways involved in bioelectrochemical CO2 reduction to methane and dissect the operating conditions and activities involved in these pathways. Additionally, the article presents a novel method to observe the transition in biocathode performance from the heterotrophic dominant to the electrochemical dominant pathway. Listed below are the different paths to methane production.
Acetoclastic (heterotrophic) methanogenesis;
Hydrogenotrophic (autotrophic) methanogenesis;
Direct electron transfer (electrosynthesis reaction-bioelectrochemical methane);
(Electroactive hydrogenotrophic methanogens as biocatalysts)
Indirect electron transfer (electrolysis-methanation reaction);
(Hydrogenotrophic bacteria as biocatalysts)
Direct electron transfer (electrochemical acetate production);
(Electroactive acetogens as biocatalysts.)
Methane that is produced by acetoclastic methanogens (Reaction (R1)) is called heterotrophic methane as the electron donor (acetate) is organic [20]. Methane that is produced from CO2 reduction with the help of hydrogen as an electron donor (Reaction (R2)) is called hydrogenotrophic methane [20]. The aforementioned pathways of methane production have been extensively studied for decades [21,22,23]. Methane that is produced through CO2 reduction directly via electron and proton transfer with the help of hydrogenotrophic bacteria as biocatalysts is here called bioelectrochemical methane (Reactions (R2), (R3), and (R4)). Methane production pathways in electrochemical reactors have been theoretically established and are termed indirect and direct (interspecies) electron transfer (DIET: Reactions (R3) and (R6)) [24].
In DIET methane production, the electrons are transferred through methanogenic archaea with the help of electrically conductive pili (hair-like appendage found on the surface of many bacteria and archaea) [25]. DIET is an efficient electron transfer mechanism that occurs at lower standard reduction potentials as compared to indirect electron transfer (Reactions (R2), (R3), and (R5)). DIET can lead to product diversity that depends on both applied cathode potential and the microbial species in the electrode-attached biofilm. However, the margin for applied cathode potential is quite small and the biofilm selectivity is sensitive to physicochemical characteristics such as pH, temperature, and ion concentrations. Indirect electron transfer occurs when the electrons from an external power source are transferred indirectly via hydrogen gas or other mediator molecules, followed by hydrogenotrophic methanogenesis, to produce methane (Reactions (R2), (R3), and (R5)).
Research on DIET is at its initial stages and it is important to conduct a number of different studies that are able to provide deeper insight into the electron transfer mechanism. This article is one such work that lays out different pathways and parameters that influence DIET and, thereby, electrochemical CO2 reduction. The study involves electrochemical treatment of reject water under different cathode potentials and feed conditions and parameters such as pH, COD, volatile fatty acids, (VFA), alkalinity, biogas production, and biogas quality are evaluated.
2. Results and Discussion
The reactor studied has been used continuously before [19] and after the tests presented here for more than a year, showing stability of such biological catalysts as it is self-replicating and rejuvenating.
2.1. Open Circuit and Blank Operation
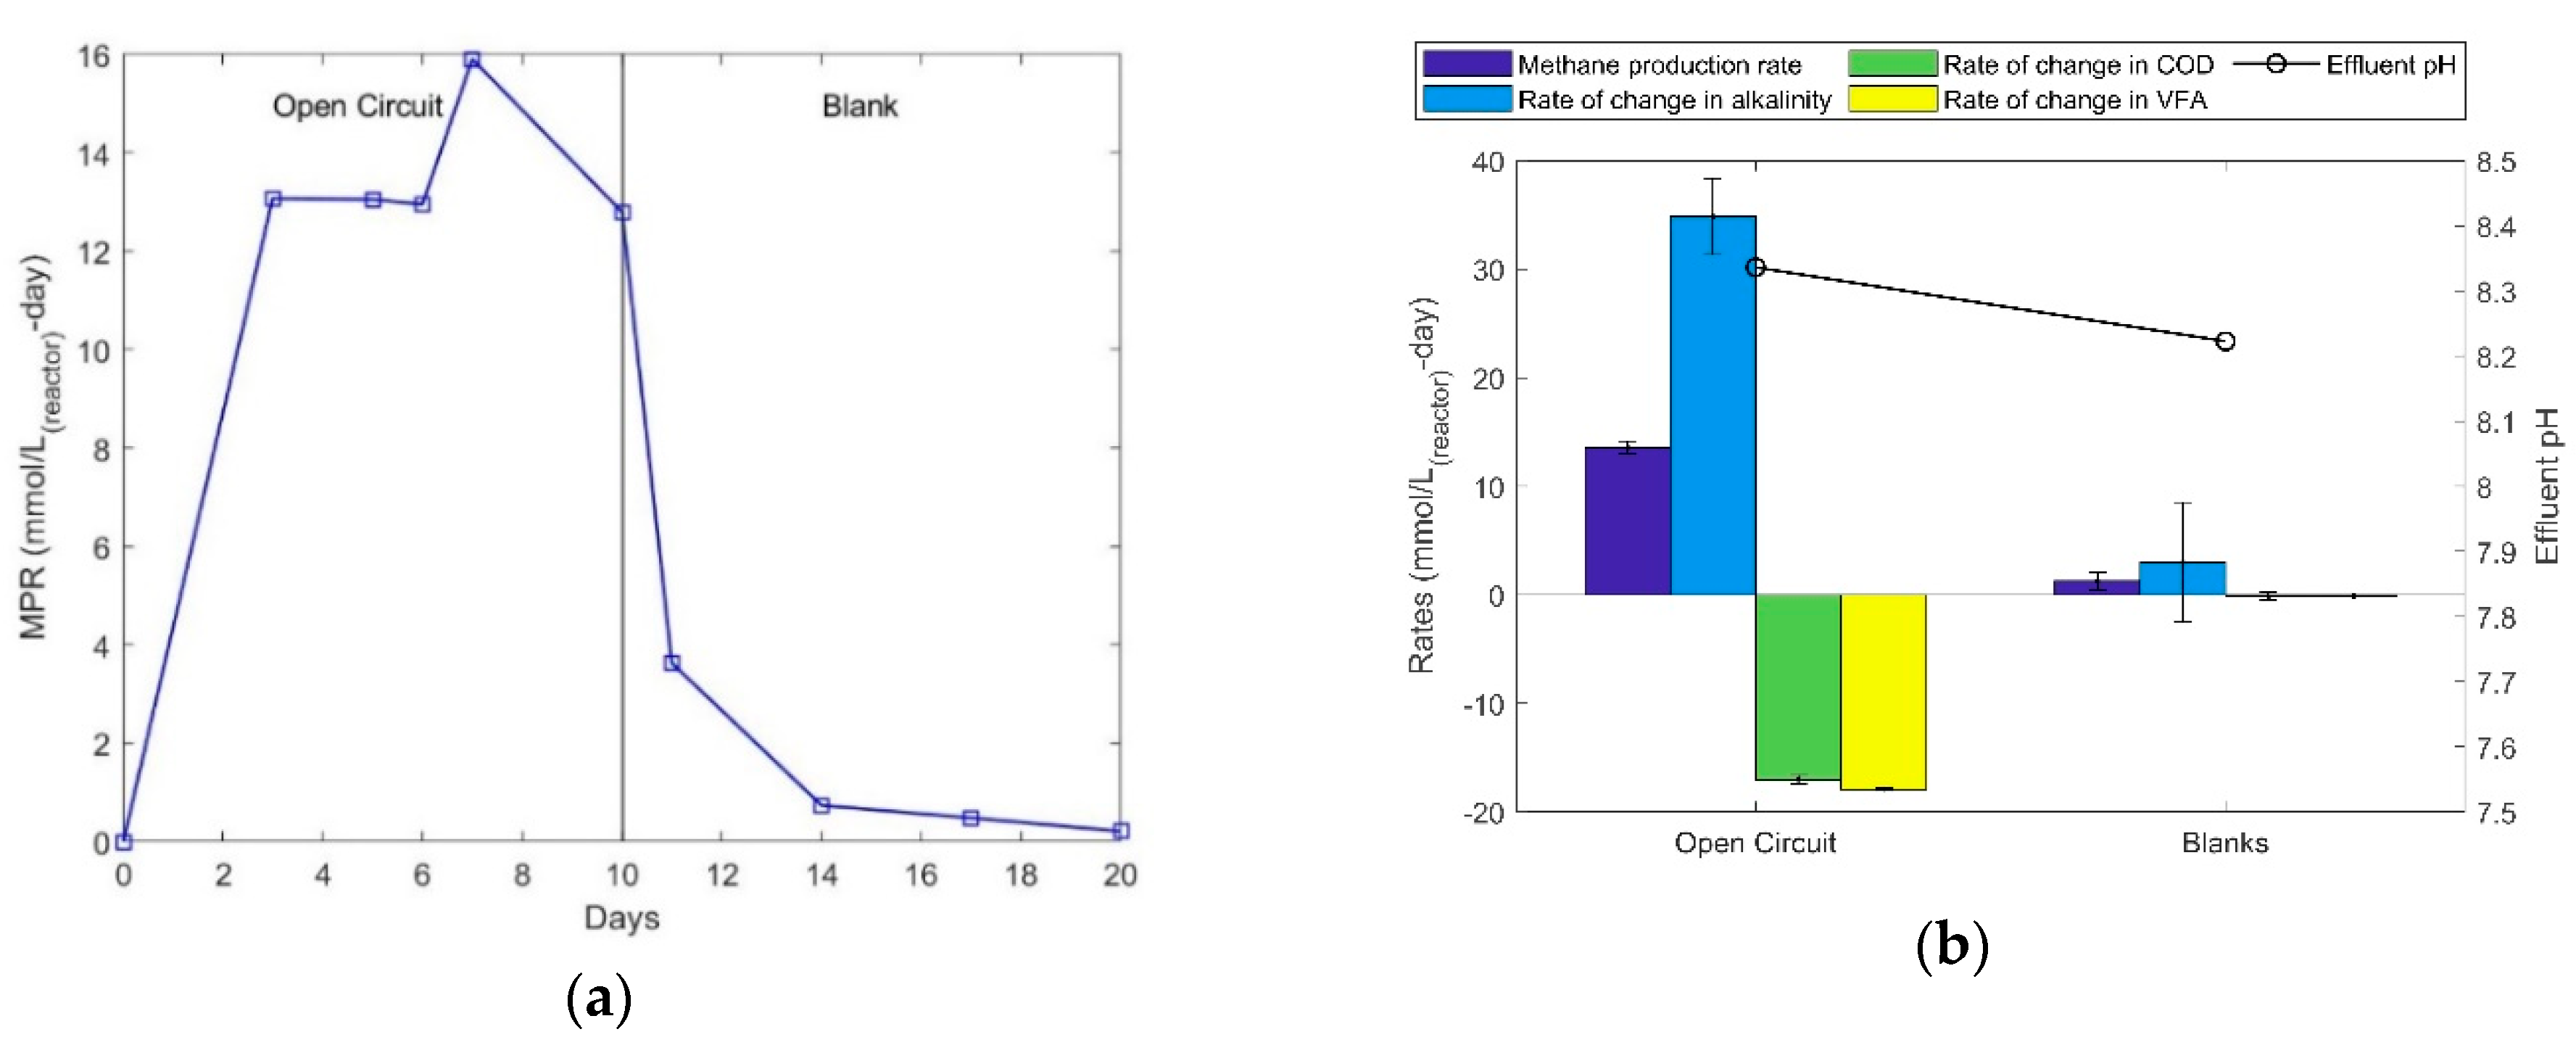
Figure 1a shows the methane production rate (MPR) during open circuit and blank experiments, which were operated for 10 days each. It is observed that MPR was in the range of 13.0 to 16.0 mmol/L-d in open circuit and quickly came down to 0 in the absence of acetic acid. The effluent pH during open circuit (OC) operation was around 8.35, suggesting that CO2 produced via acetate fermentation is in the form of bicarbonate (since pKa of [CO2]/[HCO3−] = 6.35 [26,27]). CO2 can exist in three different forms depending on the pH of the electrolyte. At a pH range of 8.00 to 8.53 (which is commonly found in the effluent of the experiments described in the present article) the equilibrium between CO2 and HCO3− tends to be towards HCO3−. The changes in alkalinity can be represented as equivalent (not absolute) changes in HCO3− concentration, since the alkalinity of wastewater comprises of many other dissolved mineral salts that do not necessarily contribute to methane production. These experiments form the basis for the following experiments as control experiments.
It can be observed in Figure 1b that both COD and VFA were consumed at a similar rate in the open circuit experiment corresponding to the production of methane. Since the initial VFA concentration was about 50% of the total initial COD concentration, the similar consumption rates imply that the biocathodes were not able to oxidize any extra COD in the absence of current. The COD consumed during the 10 day open circuit experiment produced methane with a heterotrophic efficiency of approximately 77%. The blank experiments show negligible VFA and COD consumption and work as a negative control. The low MPR and alkalinity values observed could be the residual methane and alkalinity from the open circuit experiments (MPR dropping with time (Figure 1a). The effluent pH, in both OC and blank experiments, remained between 8.20 and 8.35, increased from the feed pH of about 7.00. This pH in the OC mode supports solubilisation of bicarbonate, which is released heterotrophically, within the reactor and is represented through the increased value in alkalinity (Open Circuit, Figure 1b).
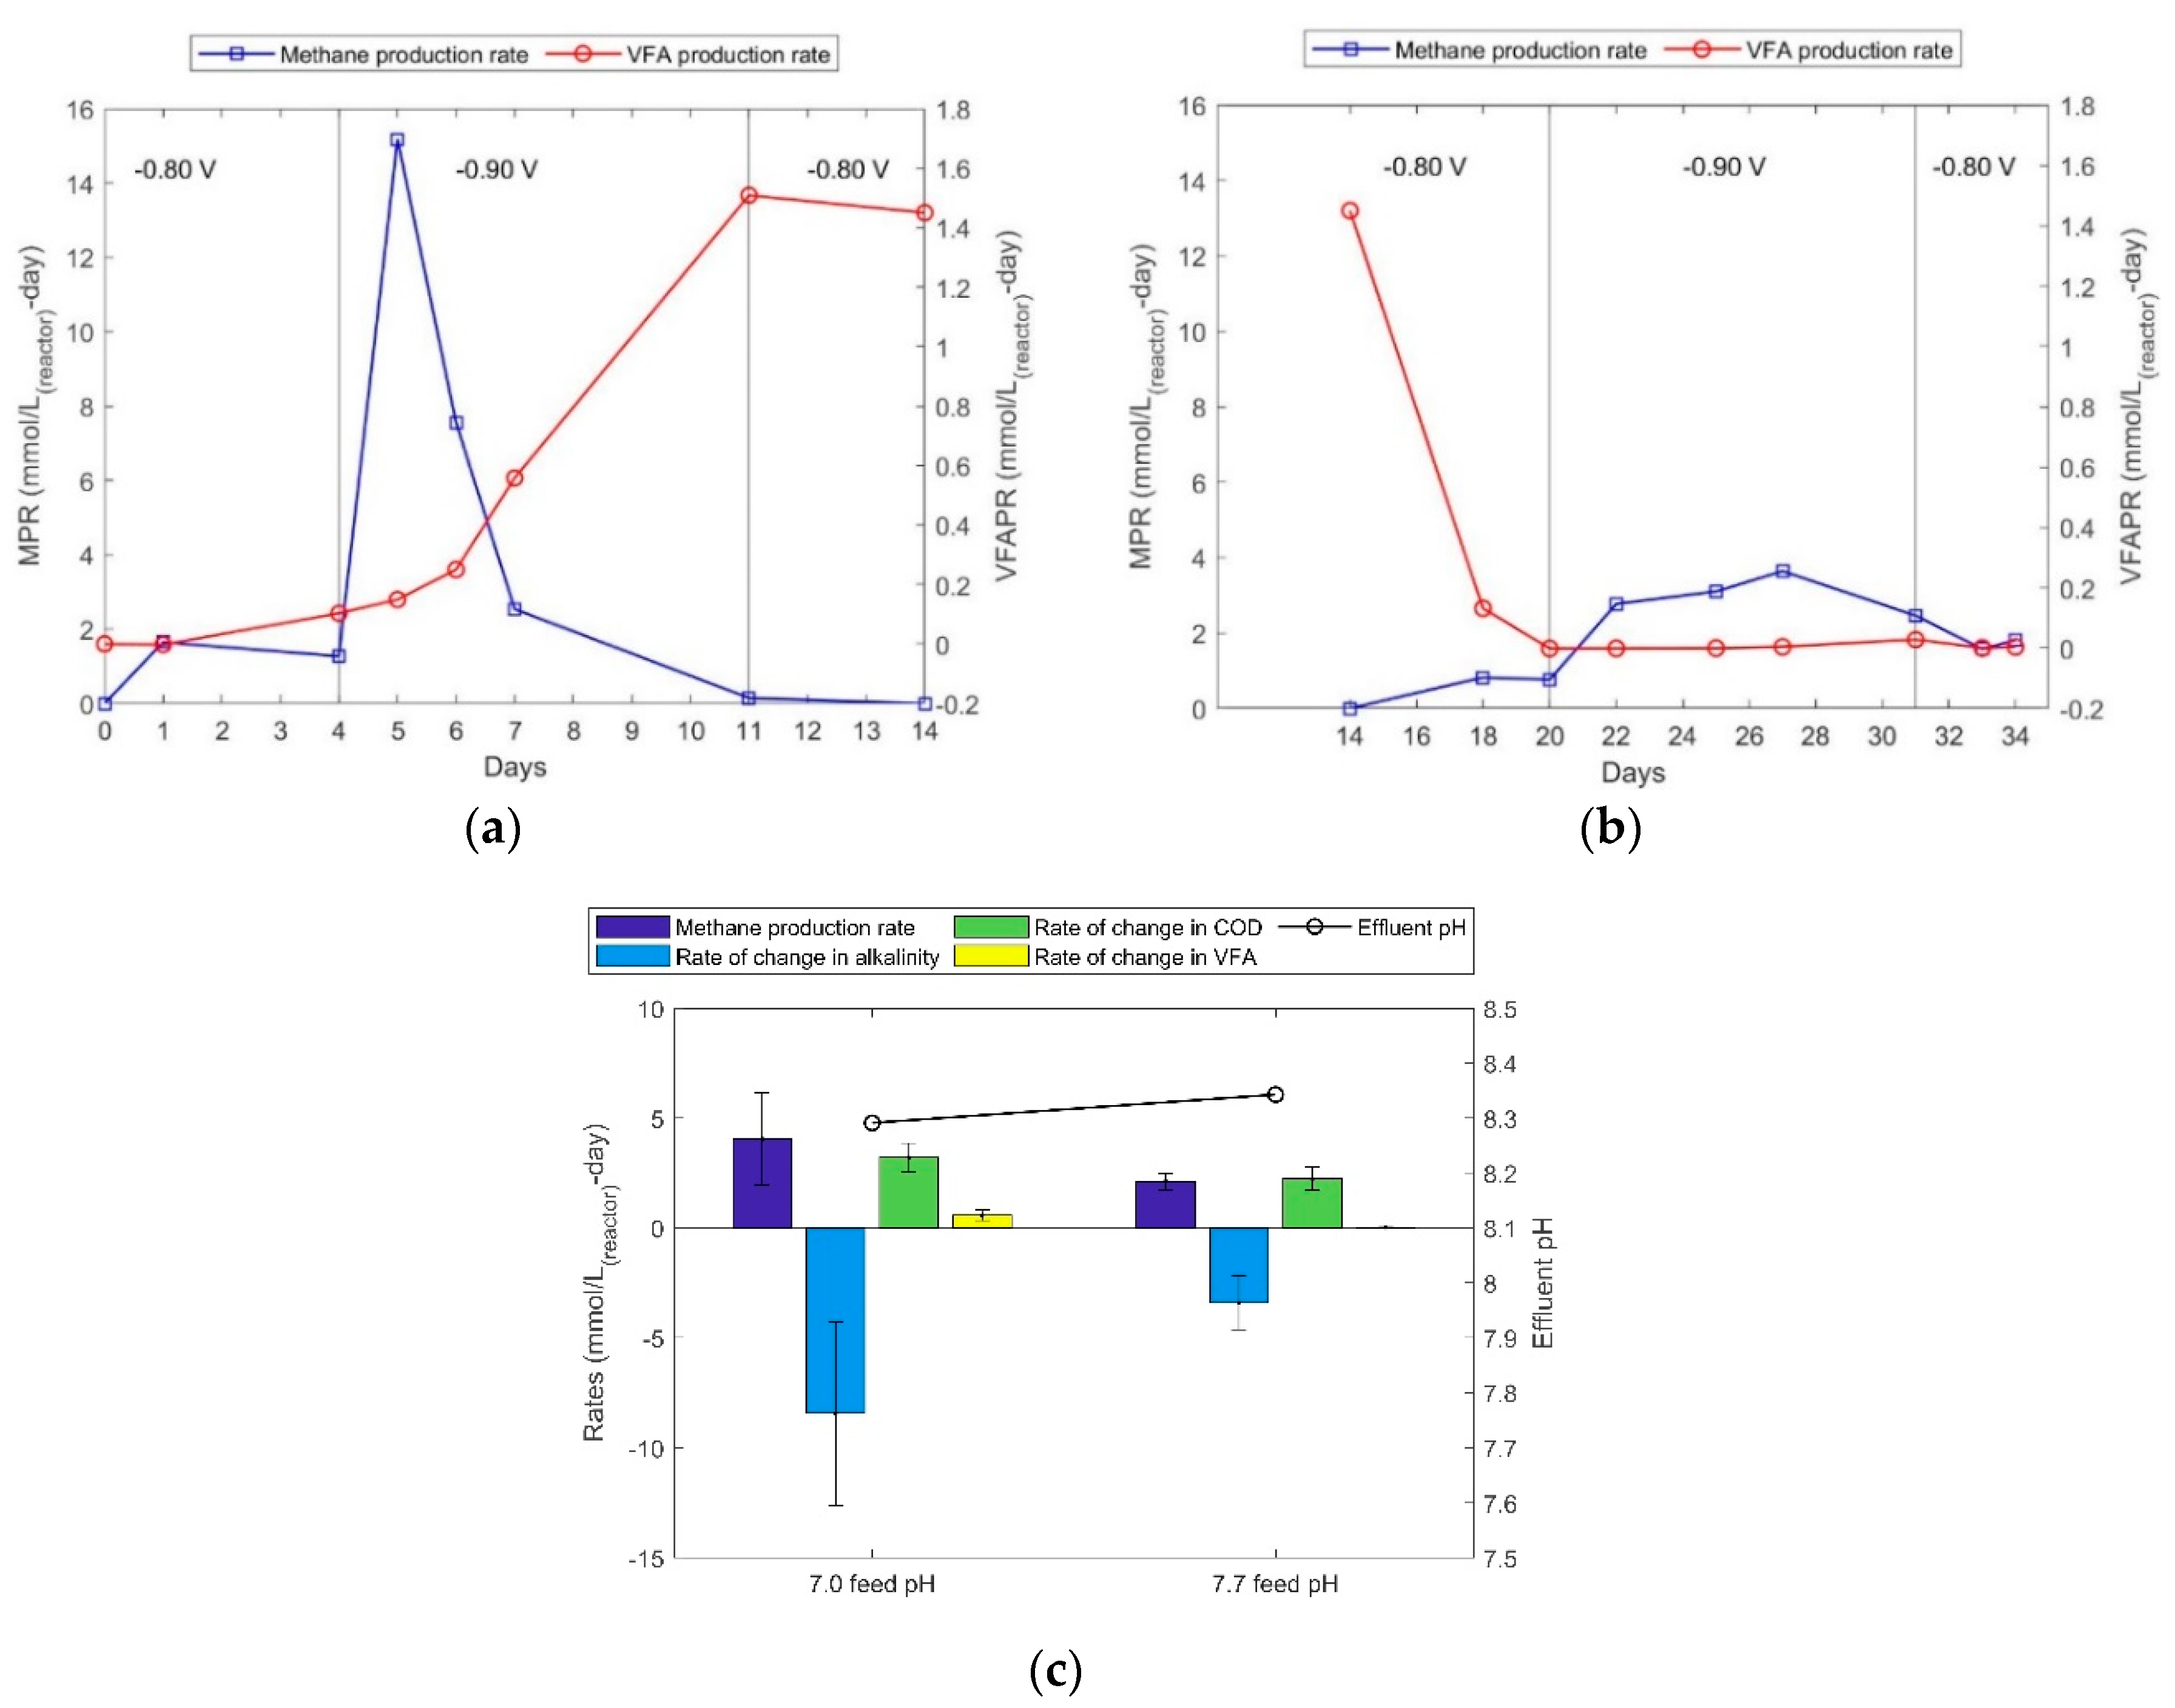
2.2. MES at High Cathode Potentials
The open circuit and blank experiments were followed by an MES operation to observe methane and acetic acid production at higher potentials. In Nelabhotla and Dinamarca [19], it was suggested that the optimum potential for methane production is around −0.65 V and at potentials more negative than −0.65 V the MES system supports simultaneous acetic acid and methane production. In Figure 2a,b the MPR and volatile fatty acid production rates (VFAPR) are presented in a time series plot at two different feed pH values. It can be observed that at a cathode potential of −0.80 V both MPR and VFAPR remained at low levels. This could be due to the need for incubation period after 10 days of blank operation. The cathode potential was then increased to −0.90 V and a sudden surge was observed in the methane production rate within 1 day, but it dropped gradually to ca. zero in 5 d, navigating the reaction towards acetic acid production.
The MPR increased to approximately 15.2 mmol/L-d and decreased to 7.6 mmol/L-d in one day, to 2.5 mmol/L-d in three days, and to 0.0 within a week (Figure 2a). On a molar basis, the methane production was approximately completely replaced by the acetic acid production (VFAPR). This VFAPR was also sustained at −0.80 V SHE cathode potentials. The transformation of MES from producing methane to producing acetic acid could be due to inhibition of methane-forming hydrogenotrophic bacteria (due to ‘electro-shock’). A more likely reason could be that the applied potential favours acetic acid production under the given conditions. Reaction (R6) shows that electrochemical acetic acid production theoretically occurs at a standard potential of −0.280 V vs. Normal Hydrogen Electrode (NHE), which is slightly higher than the standard potential for methane production, which occurs at −0.244 V vs. NHE (Reaction (R4)).
When the feed pH is changed to 7.7 keeping the cathode potential constant at -0.80 V an immediate drop in acetic acid production is observed with a slight increase in methane production. This could be due to the effect of pH on the electroactive acetogens (acetate producing bacteria) that are known to be efficient at lower pH ranges. Electroactive acetogen, Clostridium ljungdahlii produces volatile fatty acids in a range of pH from about 6.0 to 7.0 [28]. Many other studies show feed pH in the range of 6.8 to 7.0 for electrochemical acetic acid production using Clostridium ljungdahlii [29] and Sporumusa spp. [30,31]. The methanogens on the other hand seem to be more resilient to the higher pH conditions, as increased methane production rates (low level MPRs of about 2.0-4.0 mmol/L-d, from days 18 to 27) are observed (Figure 2b). This methane may partly be from the consumption of acetic acid previously produced and via the electrochemical pathway, leading to a decline in the MPRs from days 28 to 33 as the acetic acid was depleted. The optimum value of pH for methanogens is observed to be around 7.2 [32] while its range can be 6.5 – 8.0 [33] which supports tolerance for higher pH observed in the experiment.
The negative impact of higher feed pH is reflected even on the source, as consumption of bicarbonate (alkalinity) is less than half of what was consumed at the lower feed pH (Figure 2c). It is also interesting to compare the rates of CODs and VFA as COD is produced at a rate of 4.0 mmol/L-d, which is significantly more than the production rate of VFA (0.5 mmol/L-d). At the higher feed pH, the VFA production rate is approximately 0.0 mmol/L-d, whereas the rate of increase in COD is approximately 3.0 mmol/L-d (Figure 2b). These higher COD concentrations in the effluent, that are not VFA, appear to belong to biomass and were probably caused by biofilm detachment, implying a reduced electrode biofilm biomass. This may explain the lower MPRs during the second half of the experiments. The biofilm may contain less electroactive hydrogenotrophic methanogens. It is not obvious what may have caused such biofilm deterioration but microorganisms can be sensitive to abrupt environmental changes, such as in pH, perhaps enhanced by cathode potential changes in this case.
Analysing the reactants, it is clear that the source of both acetic acid and methane in this experiment was bicarbonate (decrease in alkalinity; Figure 2c). It was also observed that the average reduction in alkalinity is more significant when the pH of feed was maintained at 7.0 than at 7.7, reinforcing the low electrocatalytic activity at higher feed pH. With these experiments it is concluded that a sudden change in either pH or in cathode potential could significantly affect the biofilm structure and function. The next set of experiments were carried out to establish baseline parameters for bioelectrochemical methane production and how a biocathode can be adapted to methane production via CO2 reduction.
2.3. Open Circuit and Baseline MES Operation
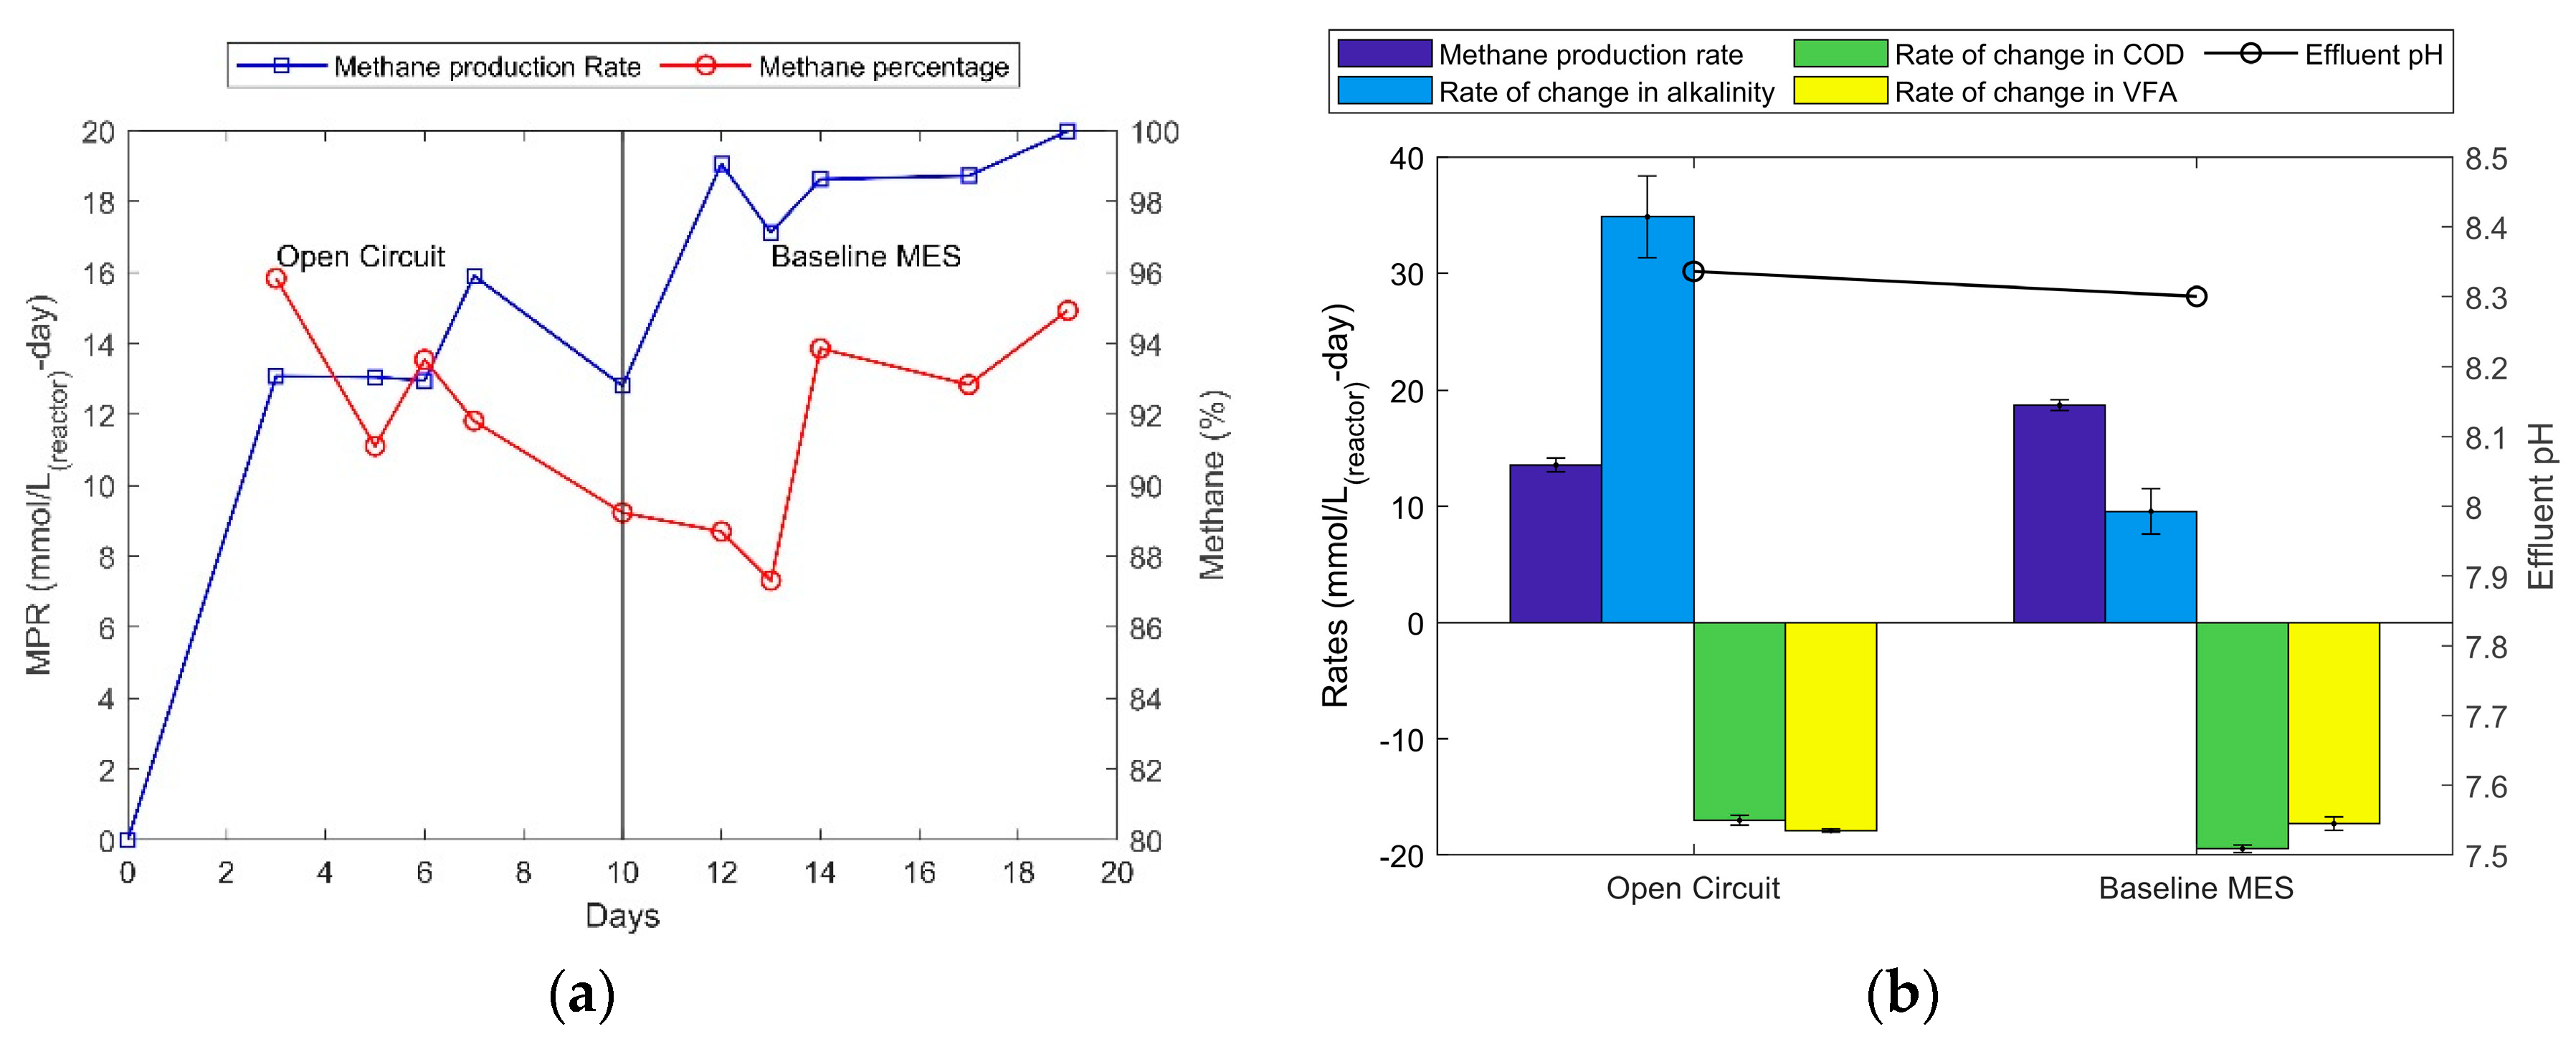
The average MPR during open circuit mode was measured to be around 14.0 mmol/L-d whereas for MES mode it was around 19.5 mmol/L-d (Figure 3), which is an increase of 39% in terms of MPR. Further observations made regarding the change in alkalinity from feed to effluent, wherein the MES mode shows only one-third of what the increase in alkalinity was for the open circuit mode. This denotes the consumption of bicarbonate as it is being released in the reactor via heterotrophic methanogenesis through the consumption of VFAs.
In the open circuit mode, the COD and VFA reduction rates were very similar to each other whereas in the MES mode the COD reduction rate is approximately 15% more than VFA reduction rate. This implies that the oxygen produced via electrochemical activity (Reaction 5) may include oxidation at the anode of some part of soluble COD that is not VFA. Some studies have reported electrochemical processes capable of utilising chloride and hypochlorite ions for oxidising ammonia-nitrogen and COD present in wastewater [34,35,36]. Therefore, it can be said that the 39% increase in MPR could be due to a combination of electrochemical CO2 reduction and electrochemical oxidation of COD followed by heterotrophic methane production. Further investigations are required to establish the latter. Such oxidation of organic matter present in the effluent of a wastewater treatment plant would be beneficial by reduced organic output to the environment and enhanced methane production.
2.4. Biocathode Adaptation
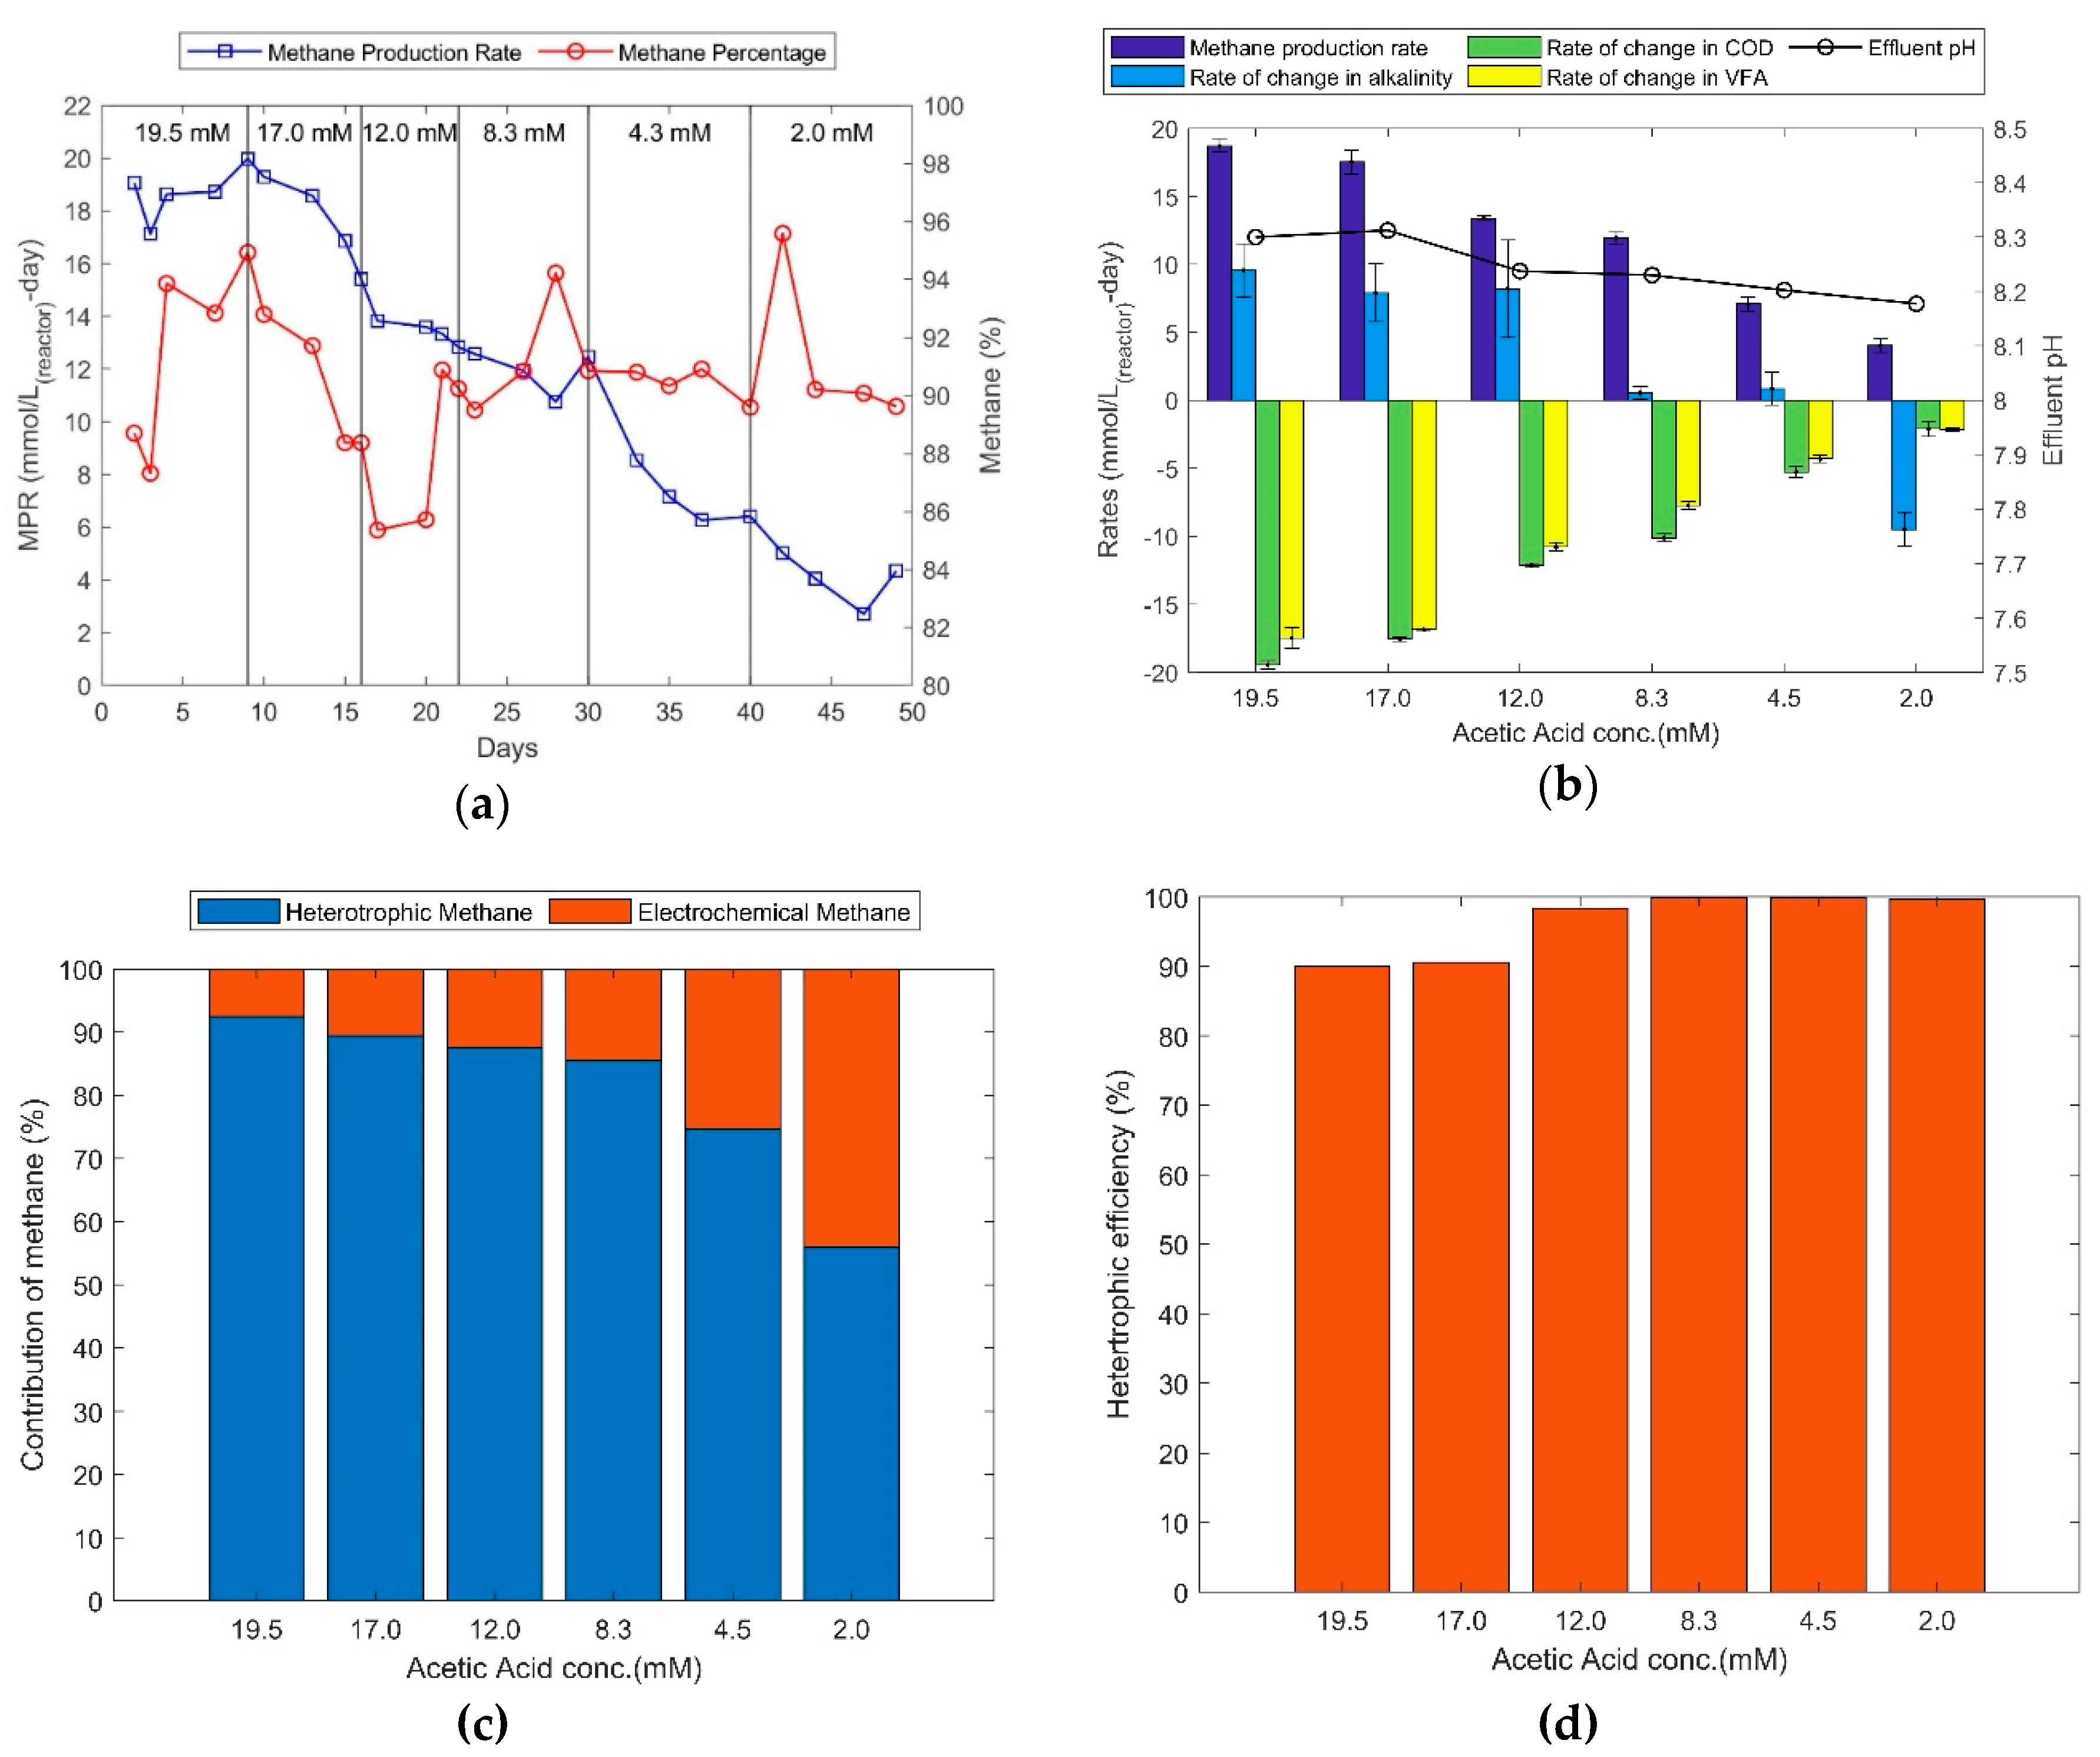
To further explore the shares of heterotrophic methane and electrochemical methane, a series of biocathode adaptation experiments were carried out, targeted on the reject water feed that was supplemented with sodium bicarbonate (85 mM) and decreasing concentrations of acetic acid, designed to adapt the biocathode towards CO2 reduction to methane as a primary product.
In Figure 4a, it can be observed that the methane production rates dropped with feed concentrations of acetic acid. The average methane percentage remained about 92% over the course of 49 days. It is important to note that the methane percentages were around 90% during days 22 through 49 when the acetic acid concentrations in the feed were low, indicating reduced heterotrophic methane and a reduced amount of heterotrophic bicarbonate being released. During the same time, it was observed that the alkalinity within the reactor suddenly stopped increasing and was followed by a significant reduction (Figure 4b). This suggests that the biocatalysts switch to utilize bicarbonate to produce methane when acetic acid becomes limited. The gas analysis during days 40 to 49 revealed 4.0 mmol/L-d and 0.3 mmol/L-d of methane and CO2 production rates respectively. Correspondingly, the alkalinity reduction rate was about 9.8 mmol/L-d, whereas the COD and VFA reduction rates were only 2.0 mmol/L-d (Figure 4a). It implies that most of the methane was produced via electrochemical reduction/consumption of bicarbonate for methane production.
It was also observed that when the feed acetic acid concentration was decreased by about 90% (19.5 to 2.0 mM), the methane production rate was decreased by only 79% (19.0 mmol/L-d to 4.0 mmol/L-d). The additional methane production can be accounted to have produced via the bicarbonate based electrochemical pathway. Figure 4c shows the contribution of methane through two available pathways, heterotrophic (COD) and electrochemical (HCO3−/CO2 and electrons), based on such mass balance analysis. The blue bars represent methane produced through degradation of COD and the orange bars represent the methane produced via bicarbonate. To distinguish bio-electrochemical and heterotrophic methane production it is assumed that the electrochemical pathway is 100% efficient in terms of electrons converting to methane and heterotrophic methane is calculated by subtracting the electrochemical methane from total methane measured. At 19.5 mM acetic acid conc. (Figure 4c) 92.5% of methane was by heterotrophic production and 7.5% was produced via the bio-electrochemical pathway. A gradual increase in the contribution of the bio-electrochemical pathway is observed with reduction feed acetate (45% at 2.0 mM acetic acid conc.).
In Figure 4d, it can be observed that the heterotrophic methane efficiency at 19.5 and 17.0 mM acetic acid feeds was approximately 90%. This implies that not all the COD consumed was utilised for methane production and that 10% of the consumed COD was utilised for biofilm growth and maintenance instead of methane production. The heterotrophic methane efficiency was > 98% for the lower feed acetic acid concentrations tested. This would imply that the concentration of COD required to support biomass growth and maintenance became limited at feed acetic acid concentration of approximately 8.3 mM. Correspondingly, the electrochemical pathway contributions increased from 7.5, to 45.0% of the total methane production with the step drops in feed acetate (Figure 4d). On the other hand, acetic acid feed concentration of about 17.0 mM and above would not only support biofilm growth and maintenance, but also promote heterotrophic methane production over electrochemical activity. This shows the sensitivity of the biofilm in utilising carbon dioxide for methane production when acetic acid is freely available and the importance of biocathode adaptation. Further improvements can be made to the electrochemical activity when the pH within the reactor can be brought down to less than 8.0, increasing the activity of electroactive hydrogenotrophic methanogens. This can be done, probably most easily, by increasing the feed flowrate, in other words, decreasing the hydraulic retention time (HRT) to maintain a higher level of un-reacted reactants in the MES.
3. Materials and Methods
3.1. Reactor and Feed Preparation
The experiments were performed in a 135 mL reactor, a modified version of a standard 135 mL Duran glass bottle with a 3-port Teflon screw cap, used as a continuous-flow stirred tank reactor, with ports for feed inlet, outlet, and electrodes. The cathode was a Carbon felt (20 mm × 20 mm × 3 mm; Alfa Aesar, Thermo Fisher GmbH, Karlsruhe, Germany) while the anode was a Graphite rod (L: 152 mm × D: 6.15 mm; Alfa Aesar, Thermo Fisher GmbH, Karlsruhe, Germany). The two biocathodes were tied together using a titanium wire, which also acted as the electrode terminal and was connected to the potentiostat. The graphite rod electrode was used as the anode and an Ag/AgCl electrode (+0.209 V vs. SHE; 3 M NaCl, QVMF2052, ProSense, BB Oosterhout, The Netherlands) was used as the reference electrode. All the potentials mentioned in this article are presented as vs Standard Hydrogen Electrode (SHE). The electrode selection criteria has been carried out using a cyclic voltammetry study previously published in Nelabhotla and Dinamarca [37].
The continuous flow stirred tank reactor was operated for a total of 150 days at 1-day hydraulic retention time (HRT) and at 35 °C. The feed was prepared using reject water from AD treated sewage sludge (separated by centrifugation) obtained from the Knarrdalstrand wastewater treatment plant, Porsgrunn, Norway. The basic reactor setup was used to carry out tests of different experimental conditions, such as open circuit, blank, high, and low cathode potential operations (Table 1). The MES feed was prepared by supplementing the reject water with 17 mM acetic acid (most of the time) and 85 mM sodium bicarbonate (all the time). 1M HCl solution was used to adjust the pH of the feed to 7.0 wherever mentioned.
3.2. Open Circuit and Blank Operations
A series of open circuit (OC) and blank (B) experiments were run in a continuous flow stirred tank reactor at 1-day HRT, at 35 °C, and with no applied potential. Prior to this experiment, the reactor was operated electrochemically at a cathode potential of −0.65 V vs. SHE for 120 days until a stable biofilm was established. The OC was carried out with reject water feed that was supplemented with 17 mM acetic acid and 85 mM sodium bicarbonate, whereas the blank experiment used a feed with only 85 mM sodium bicarbonate. A total of 1M HCl was used to adjust the feed pH to the same level as open circuit feed pH, i.e., 7.0.
3.3. MES at High Cathode Potentials
The experiments were carried out at cathode potentials of −0.8 and −0.9 V vs. SHE, both at two different feed pH levels (feed pH was adjusted to 7.0 with addition of 1M HCl, while 7.7 was the pH of the feed without adding HCl). The feed was supplemented with 85 mM NaHCO3 but was not provided with any acetic acid to avoid endogenous heterotrophic methane production and to identify electrochemical acetic acid production.
3.4. Open Circuit and Baseline Operation
The baseline MES mode of operation in this article is defined as an electrosynthesis operation of the feed supplemented with both acetic acid (17 mM) and sodium bicarbonate (85 mM) at a cathode potential of −0.65 V vs. SHE, 1-day HRT, and at 35 °C. The reactor was operated in baseline mode for 35 days prior to recording the data for 9 days. This data was compared to the open circuit mode of operation, discussed in Section 2.2 and Section 3.1.
3.5. Biocathode Adaptation
This test followed the baseline experiment that contained a similar concentration of HCO3− and, initially, with 80% of the previously supplemented concentration of acetic acid. The reactor was continually operated for a week and similar sets of experiments were continued every week with 60%, 40%, 20%, and 0% acetic acid supplemented to the reject water as feed. The unmodified reject water had a native concentration of about 2.0–2.5 mM of acetic acid (included as part of the VFA concentrations in all mass balances of all the experiments). All the experiments were carried out at −0.65 V vs. SHE, 1-day HRT, and at 35 °C. The feed pH was maintained at 7.0 by replacing acetic acid with 1M HCl.
3.6. Analytical Methods and Calculations
COD was analysed using Merck COD cell test kit 110047 which follows the standard method APHA SMWW 5220. VFA was analysed using the standard method APHA SMWW 6200B [38] and a Gas Chromatograph Hewlett-Packard 6890 where the carrier gas helium and hydrogen at 4 KPa pressure are passed through the DB-FFAP GC column (30 m, 0.25 mm, 0.50 µm, 7 inch cage) and are detected using a Flame Ionisation Detector (FID). Alkalinity was measured using the Merck cell test kit 11009 following the standard method APHA SMWW 2320 [38]. The voltage and current were both set and measured using Gamry 1000B potentiostat and the Gamry Framework v7.06 (Gamry Instruments, Warminster, PA, USA) respectively. Biogas was analysed using the 8610C gas chromatograph (SRI Instruments, Torrance, CA, USA) equipped with a thermal conductivity detector and with a Haysep-D (HD) and MoleSieve (MS13X) column which separates oxygen, nitrogen, methane and carbon dioxide. The carrier gas was Helium at 4 bar pressure and the oven temperature was kept constant at 80 °C.
Several parameters were analysed and compared amongst to achieve material balance and conversion efficiency. These are defined as follows:
where the actual amount of methane is produced and is the amount of methane calculated by converting 100% of the COD consumed and is the amount methane calculated by converting 8 electrons transferred to 1 mole of methane.
where, 24450 mL = standard volume of a gas at RT; 64 mg/L = maximum theoretical conversion of COD to methane; AA = Acetic acid; PA = Propionic acid; eff = effluent; ne is the amount electrons consumed; F is the Faradaic constant 96845 C/mol e−; * Ignoring COD expenses for biomass growth and inorganic COD contributions.
The current article addresses a multitude of aspects of bioelectrochemical CO2 reduction, discussed previously. This study started with a set of blank and open circuit operations carried out for 10 days each. This was followed by a set of experiments differentiating between two different ranges of feed pH and its effect on bioelectrochemical acetate production, which occurs at a higher cathode potential than required by bioelectrochemical methane production. A second run of open circuit and a baseline MES operation at −0.65 V were used as control experiments for the biocathode adaptation experiment that followed. These experiments were designed to differentiate how the heterotrophic activity dominates electrochemical activity to evaluate methods of improving electrochemical CO2 reduction efficiency.
4. Conclusions
The current article analyses the performance of MES at different cathode potentials and feed conditions and evaluates how the biocatalysts perform under excess and limited acetic acid availability, with the help of control and blank experiments. An increased amount of methane production rate (39%) was observed in the baseline electrochemical operation when compared to the open circuit and blank operations. The performance analysis also showed how multiple parameters, such as pH and cathode potential, strongly influence the MES end product distribution. It is concluded that the optimum pH for electrochemical acetic acid production is around 6.8–7.0 and the optimum cathode potential is between −0.8 and −0.9 V vs. SHE. The optimum pH range for electroactive methanogens is wider and the optimum cathode potential is −0.65 V vs. SHE. Both heterotrophic and autotrophic methane production can be enhanced and their relative contributions depend on the feed composition. The biocathode adaptation experiments showed about 99%–99.5% heterotrophic methane efficiency when the acetic acid concentrations were lower than or equal to 12.0 mM in the feed assuming coulombic efficiency to be 100%. 45% of methane production was obtained via the electrochemical pathway when feed acetic acid concentration was brought down to 2.0 mM.
Author Contributions
Conceptualization, A.B.T.N. and C.D.; Methodology, A.B.T.N., C.D.; Validation, C.D.; Investigation, A.B.T.N.; Resources, C.D.; Data curation, A.B.T.N.; Writing—original draft preparation, A.B.T.N.; Writing—review and editing A.B.T.N., R.B., and C.D.
Funding
This research was funded by the Norwegian Ministry of Education and Research through core funding of the Ph.D. program in Process, Energy and Automation Engineering at University of South-Eastern Norway. The APC was funded by University of South-Eastern Norway.
Conflicts of Interest
The authors declare no conflict of interest.
References
- Li, R.; Chen, S.; Li, X. Biogas production from anaerobic co-digestion of food waste with dairy manure in a two-phase digestion system. Appl. Biochem. Biotechnol. 2010, 160, 643–654. [Google Scholar] [CrossRef] [PubMed]
- Monnet, F. An Introduction to Anaerobic Digestion of Organic Wastes; Remade: Crieff, Scotland, UK, 2003. [Google Scholar]
- Mastellone, M.L.; Brunner, P.H.; Arena, U. Scenarios of waste management for a waste emergency area: A substance flow analysis. J. Ind. Ecol. 2009, 13, 735–757. [Google Scholar] [CrossRef]
- Martin, M.; Eklund, M. Improving the environmental performance of biofuels with industrial symbiosis. Biomass Bioenergy 2011, 35, 1747–1755. [Google Scholar] [CrossRef]
- Iacovidou, E.; Ohandja, D.G.; Voulvoulis, N. Food waste co-digestion with sewage sludge—Realising its potential in the UK. J. Environ. Manag. 2012, 112, 267–274. [Google Scholar] [CrossRef] [PubMed]
- Edwards, R.W.J.; Celia, M.A. Infrastructure to enable deployment of carbon capture, utilization, and storage in the United States. Proc. Natl. Acad. Sci. USA 2018, 115, E8815–E8824. [Google Scholar] [CrossRef] [PubMed] [Green Version]
- Esposito, E.; Dellamuzia, L.; Moretti, U.; Fuoco, A.; Giorno, L.; Jansen, J.C. Simultaneous production of biomethane and food grade CO2 from biogas: An industrial case study. Energy Environ. Sci. 2019, 12, 281–289. [Google Scholar] [CrossRef]
- Koornneef, J.; Van Breevoort, P.; Noothout, P.; Hendriks, C.; Luning, L.; Camps, A. Global potential for biomethane production with carbon capture, transport and storage up to 2050. Energy Proc. 2013, 37, 6043–6052. [Google Scholar] [CrossRef]
- Sutanto, S.; Dijkstra, J.W.; Pieterse, J.A.Z.; Boon, J.; Hauwert, P.; Brilman, D.W.F. CO2 removal from biogas with supported amine sorbents: First technical evaluation based on experimental data. Sep. Purif. Technol. 2017, 184, 12–25. [Google Scholar] [CrossRef]
- Bajón Fernández, Y.; Soares, A.; Villa, R.; Vale, P.; Cartmell, E. Carbon capture and biogas enhancement by carbon dioxide enrichment of anaerobic digesters treating sewage sludge or food waste. Bioresour. Technol. 2014, 159, 1–7. [Google Scholar] [CrossRef] [PubMed] [Green Version]
- Bajón Fernández, Y.; Green, K.; Schuler, K.; Soares, A.; Vale, P.; Alibardi, L.; Cartmell, E. Biological carbon dioxide utilisation in food waste anaerobic digesters. Water Res. 2015, 87, 467–475. [Google Scholar] [CrossRef]
- Yousef, A.M.I.; Eldrainy, Y.A.; El-Maghlany, W.M.; Attia, A. Upgrading biogas by a low-temperature CO2 removal technique. Alexandria Eng. J. 2016, 55, 1143–1150. [Google Scholar] [CrossRef]
- Li, H.; Tan, Y.; Ditaranto, M.; Yan, J.; Yu, Z. Capturing CO2 from biogas plants. Energy Procedia 2017, 114, 6030–6035. [Google Scholar] [CrossRef]
- Vo, T.T.Q.; Wall, D.M.; Ring, D.; Rajendran, K.; Murphy, J.D. Techno-economic analysis of biogas upgrading via amine scrubber, carbon capture and ex-situ methanation. Appl. Energy 2018, 212, 1191–1202. [Google Scholar] [CrossRef]
- García-Gutiérrez, P.; Jacquemin, J.; McCrellis, C.; Dimitriou, I.; Taylor, S.F.R.; Hardacre, C.; Allen, R.W.K. Techno-economic feasibility of selective CO2 capture processes from biogas streams using ionic liquids as physical absorbents. Energy Fuels 2016, 30, 5052–5064. [Google Scholar] [CrossRef]
- Scholz, M.; Frank, B.; Stockmeier, F.; Falß, S.; Wessling, M. Techno-economic analysis of hybrid processes for biogas upgrading. Ind. Eng. Chem. Res. 2013, 52, 16929–16938. [Google Scholar] [CrossRef]
- Dębowski, M.; Szwaja, S.; Zieliński, M.; Kisielewska, M.; Stańczyk-Mazanek, E. The Influence of Anaerobic Digestion Effluents (ADEs) Used as the Nutrient Sources for Chlorella sp. Cultivation on Fermentative Biogas Production. Waste and Biomass Valorization 2017, 8, 1153–1161. [Google Scholar] [CrossRef]
- Aryal, N.; Ammam, F.; Patil, S.A.; Pant, D. An overview of cathode materials for microbial electrosynthesis of chemicals from carbon dioxide. Green Chem. 2017, 19, 5748–5760. [Google Scholar] [CrossRef]
- Nelabhotla, A.B.T.; Dinamarca, C. Bioelectrochemical CO2 Reduction to Methane: MES Integration in Biogas Production Processes. Appl. Sci. 2019, 9, 1056. [Google Scholar] [CrossRef]
- Lackner, N.; Hintersonnleitner, A.; Wagner, A.O.; Illmer, P. Hydrogenotrophic Methanogenesis and Autotrophic Growth of Methanosarcina thermophila. Hindawi Archaea 2018, 2018, 4712608. [Google Scholar] [CrossRef]
- Xu, H.; Gong, S.; Sun, Y.; Ma, H.; Zheng, M.; Wang, K. High-rate hydrogenotrophic methanogenesis for biogas upgrading: The role of anaerobic granules. Environ. Technol. 2015, 36, 529–537. [Google Scholar] [CrossRef]
- Demirel, B.; Scherer, P. The roles of acetotrophic and hydrogenotrophic methanogens during anaerobic conversion of biomass to methane: A review. Rev. Environ. Sci. Biotechnol. 2008, 7, 173–190. [Google Scholar] [CrossRef]
- Ali Shah, F.; Mahmood, Q.; Maroof Shah, M.; Pervez, A.; Ahmad Asad, S. Microbial ecology of anaerobic digesters: The key players of anaerobiosis. Sci. World J. 2014, 2014, 183752. [Google Scholar] [CrossRef]
- van Eerten-Jansen, M.C.A.A.; Heijne, A.T.; Buisman, C.J.N.; Hamelers, H.V.M. Microbial electrolysis cells for production of methane from CO2: long-term performance and perspectives. Int. J. Energy Res. 2012, 36, 809–819. [Google Scholar] [CrossRef]
- Rotaru, A.-E.; Shrestha, P.M.; Liu, F.; Shrestha, M.; Shrestha, D.; Embree, M.; Zengler, K.; Wardman, C.; Nevin, K.P.; Lovley, D.R. A new model for electron flow during anaerobic digestion: direct interspecies electron transfer to Methanosaeta for the reduction of carbon dioxide to methane. Energy Environ. Sci. 2014, 7, 408–415. [Google Scholar] [CrossRef]
- Boyd, C.E.; Tucker, C.S.; Somridhivej, B. Alkalinity and Hardness: Critical but Elusive Concepts in Aquaculture. J. World Aquac. Soc. 2016, 47, 6–41. [Google Scholar] [CrossRef]
- Stabenau, E.K.; Heming, T.A. Determination of the Constants of the Henderson–Hasselbalch Equation, αCO2 and pKa, in Sea Turtle Plasma. J. Exp. Biol. 1993, 180, 311–314. [Google Scholar]
- Mohammadi, M.; Mohamed, A.R.; Najafpour, G.D.; Younesi, H.; Uzir, M.H. Effect of organic substrate on promoting solventogenesis in ethanologenic acetogene Clostridium ljungdahlii ATCC 55383. Int. J. Eng. Trans. B Appl. 2014, 27, 185–194. [Google Scholar] [CrossRef]
- Jabeen, G.; Farooq, R. Bio-electrochemical synthesis of commodity chemicals by autotrophic acetogens utilizing CO2 for environmental remediation. J. Biosci. 2016, 41, 367–380. [Google Scholar] [CrossRef]
- Aryal, N.; Tremblay, P.L.; Lizak, D.M.; Zhang, T. Performance of different Sporomusa species for the microbial electrosynthesis of acetate from carbon dioxide. Bioresour. Technol. 2017, 233, 184–190. [Google Scholar] [CrossRef]
- Aryal, N.; Zhang, T.; Tremblay, P.-L. Microbial Electrosynthesis for Acetate Production from Carbon Dioxide: Innovative Biocatalysts Leading to Enhanced Performance. Ph.D. Thesis, Technical University of Denmark, Lingbi, Denmark, 2017. [Google Scholar]
- Cheng, S.; Xing, D.; Call, D.F.; Logan, B.E.; Cheng, S.; Xing, D.; Call, D.F.; Logan, B.E. Direct Biological Conversion of Electrical Current into Methane by Electromethanogenesis. Environ. Sci. Technol. 2009, 43, 3953–3958. [Google Scholar] [CrossRef]
- Park, J.; Lee, B.; Shin, W.; Jo, S.; Jun, H. Application of a rotating impeller anode in a bioelectrochemical anaerobic digestion reactor for methane production from high-strength food waste. Bioresour. Technol. 2018, 259, 423–432. [Google Scholar] [CrossRef]
- Cho, K.; Kwon, D.; Hoffmann, M.R. Electrochemical treatment of human waste coupled with molecular hydrogen production. RSC Adv. 2014, 4, 4596–4608. [Google Scholar] [CrossRef]
- Ghimire, U.; Jang, M.; Jung, S.P.; Park, D.; Park, S.J.; Yu, H.; Oh, S.E. Electrochemical removal of ammonium nitrogen and cod of domestic wastewater using platinum coated titanium as an anode electrode. Energies 2019, 12, 883. [Google Scholar] [CrossRef]
- Candido, L.; Ponciano Gomes, A.A.; Medaber Jambo, H.C. Electrochemical treatment of oil refinery wastewater for NH3-N and COD removal. Int. J. Electrochem. Sci. 2013, 8, 9187–9200. [Google Scholar]
- Nelabhotla, A.B.T.; Dinamarca, C. Optimisation of Electrochemical Treatment of Artificial Wastewater using Cyclic Voltammetry. Int. J. Environ. Sci. Dev. 2018, 9, 218–221. [Google Scholar] [CrossRef]
- APHA. Standard Methods For the Examination of Water and Wastewater; Standard Methods for the Examination of Water and Wastewater; American Public Health Association: Washington, DC, USA, 2018. [Google Scholar]
Figure 1.
(a) Methane production rates in open circuit and blank operating modes. (b) Rate of different parameters and pH in open circuit and blank operating modes.
Figure 1.
(a) Methane production rates in open circuit and blank operating modes. (b) Rate of different parameters and pH in open circuit and blank operating modes.

Figure 2.
(a) Methane and VFA production rates at low feed pH. (b) Methane VFA production rates at high feed pH. (c) Yields of different parameters at different feed conditions.
Figure 2.
(a) Methane and VFA production rates at low feed pH. (b) Methane VFA production rates at high feed pH. (c) Yields of different parameters at different feed conditions.

Figure 3.
(a) Methane production rates in open circuit and baseline MES operations. (b) Yields of different parameters in open circuit and MES operating mode.
Figure 3.
(a) Methane production rates in open circuit and baseline MES operations. (b) Yields of different parameters in open circuit and MES operating mode.

Figure 4.
(a) Methane production rate (blue) and biogas methane percentage (red) at decreasing feed concentrations of acetic acid. (b) pH, methane production and rates of change in COD, VFA and alkalinity at tested acetic acid feed concentrations. (c) Methane source distribution between heterotrophic (blue) and electrochemical (red) methane. (d) Heterotrophic efficiency to methane considering 100% electrochemical efficiency.


Table 1.
Experimental and feed conditions used in the current study.
| Experiments | Duration (days) | Bicarbonate (mM) | Acetic Acid (mM) | Inlet COD (mg/L) | Inlet Acetate (mg/L) | Feed pH | Cathode Potential (V vs. SHE) |
|---|---|---|---|---|---|---|---|
| Open Circuit | 10 | 85 | 17 | 2700–2800 | 1200–1300 | 7.0 | - |
| Blank | 10 | 85 | 0 | 1400–1500 | 3–5 | 7.2 | - |
| MES for Acetic Acid | 34 | 85 | 0 | 1300–1600 | 2–8.5 | 7.0 (HCl) & 7.7 (No HCl) | −0.8 to −0.9 |
| Baseline Methane Production | 9 | 85 | 17 | 2500–2700 | 1150–1200 | 7.0 | −0.65 |
| Biocathode Adaptation | 49 * | 85 | 17 to 0 (gradual) | 2700–1500 | 1200–110 | 7.0 (AA and HCl) | −0.65 |
AA= acetic acid; * includes 9 days of baseline operation used as baseline for the adaptation experiments.
© 2019 by the authors. Licensee MDPI, Basel, Switzerland. This article is an open access article distributed under the terms and conditions of the Creative Commons Attribution (CC BY) license (http://creativecommons.org/licenses/by/4.0/).
Share and Cite
MDPI and ACS Style
Nelabhotla, A.B.T.; Bakke, R.; Dinamarca, C. Performance Analysis of Biocathode in Bioelectrochemical CO2 Reduction. Catalysts 2019, 9, 683. https://0-doi-org.brum.beds.ac.uk/10.3390/catal9080683
AMA Style
Nelabhotla ABT, Bakke R, Dinamarca C. Performance Analysis of Biocathode in Bioelectrochemical CO2 Reduction. Catalysts. 2019; 9(8):683. https://0-doi-org.brum.beds.ac.uk/10.3390/catal9080683
Chicago/Turabian StyleNelabhotla, Anirudh Bhanu Teja, Rune Bakke, and Carlos Dinamarca. 2019. "Performance Analysis of Biocathode in Bioelectrochemical CO2 Reduction" Catalysts 9, no. 8: 683. https://0-doi-org.brum.beds.ac.uk/10.3390/catal9080683
Note that from the first issue of 2016, this journal uses article numbers instead of page numbers. See further details here.