The Interstitial Carbon–Dioxygen Center in Irradiated Silicon

 , ,
, ,  ,
,  and
and 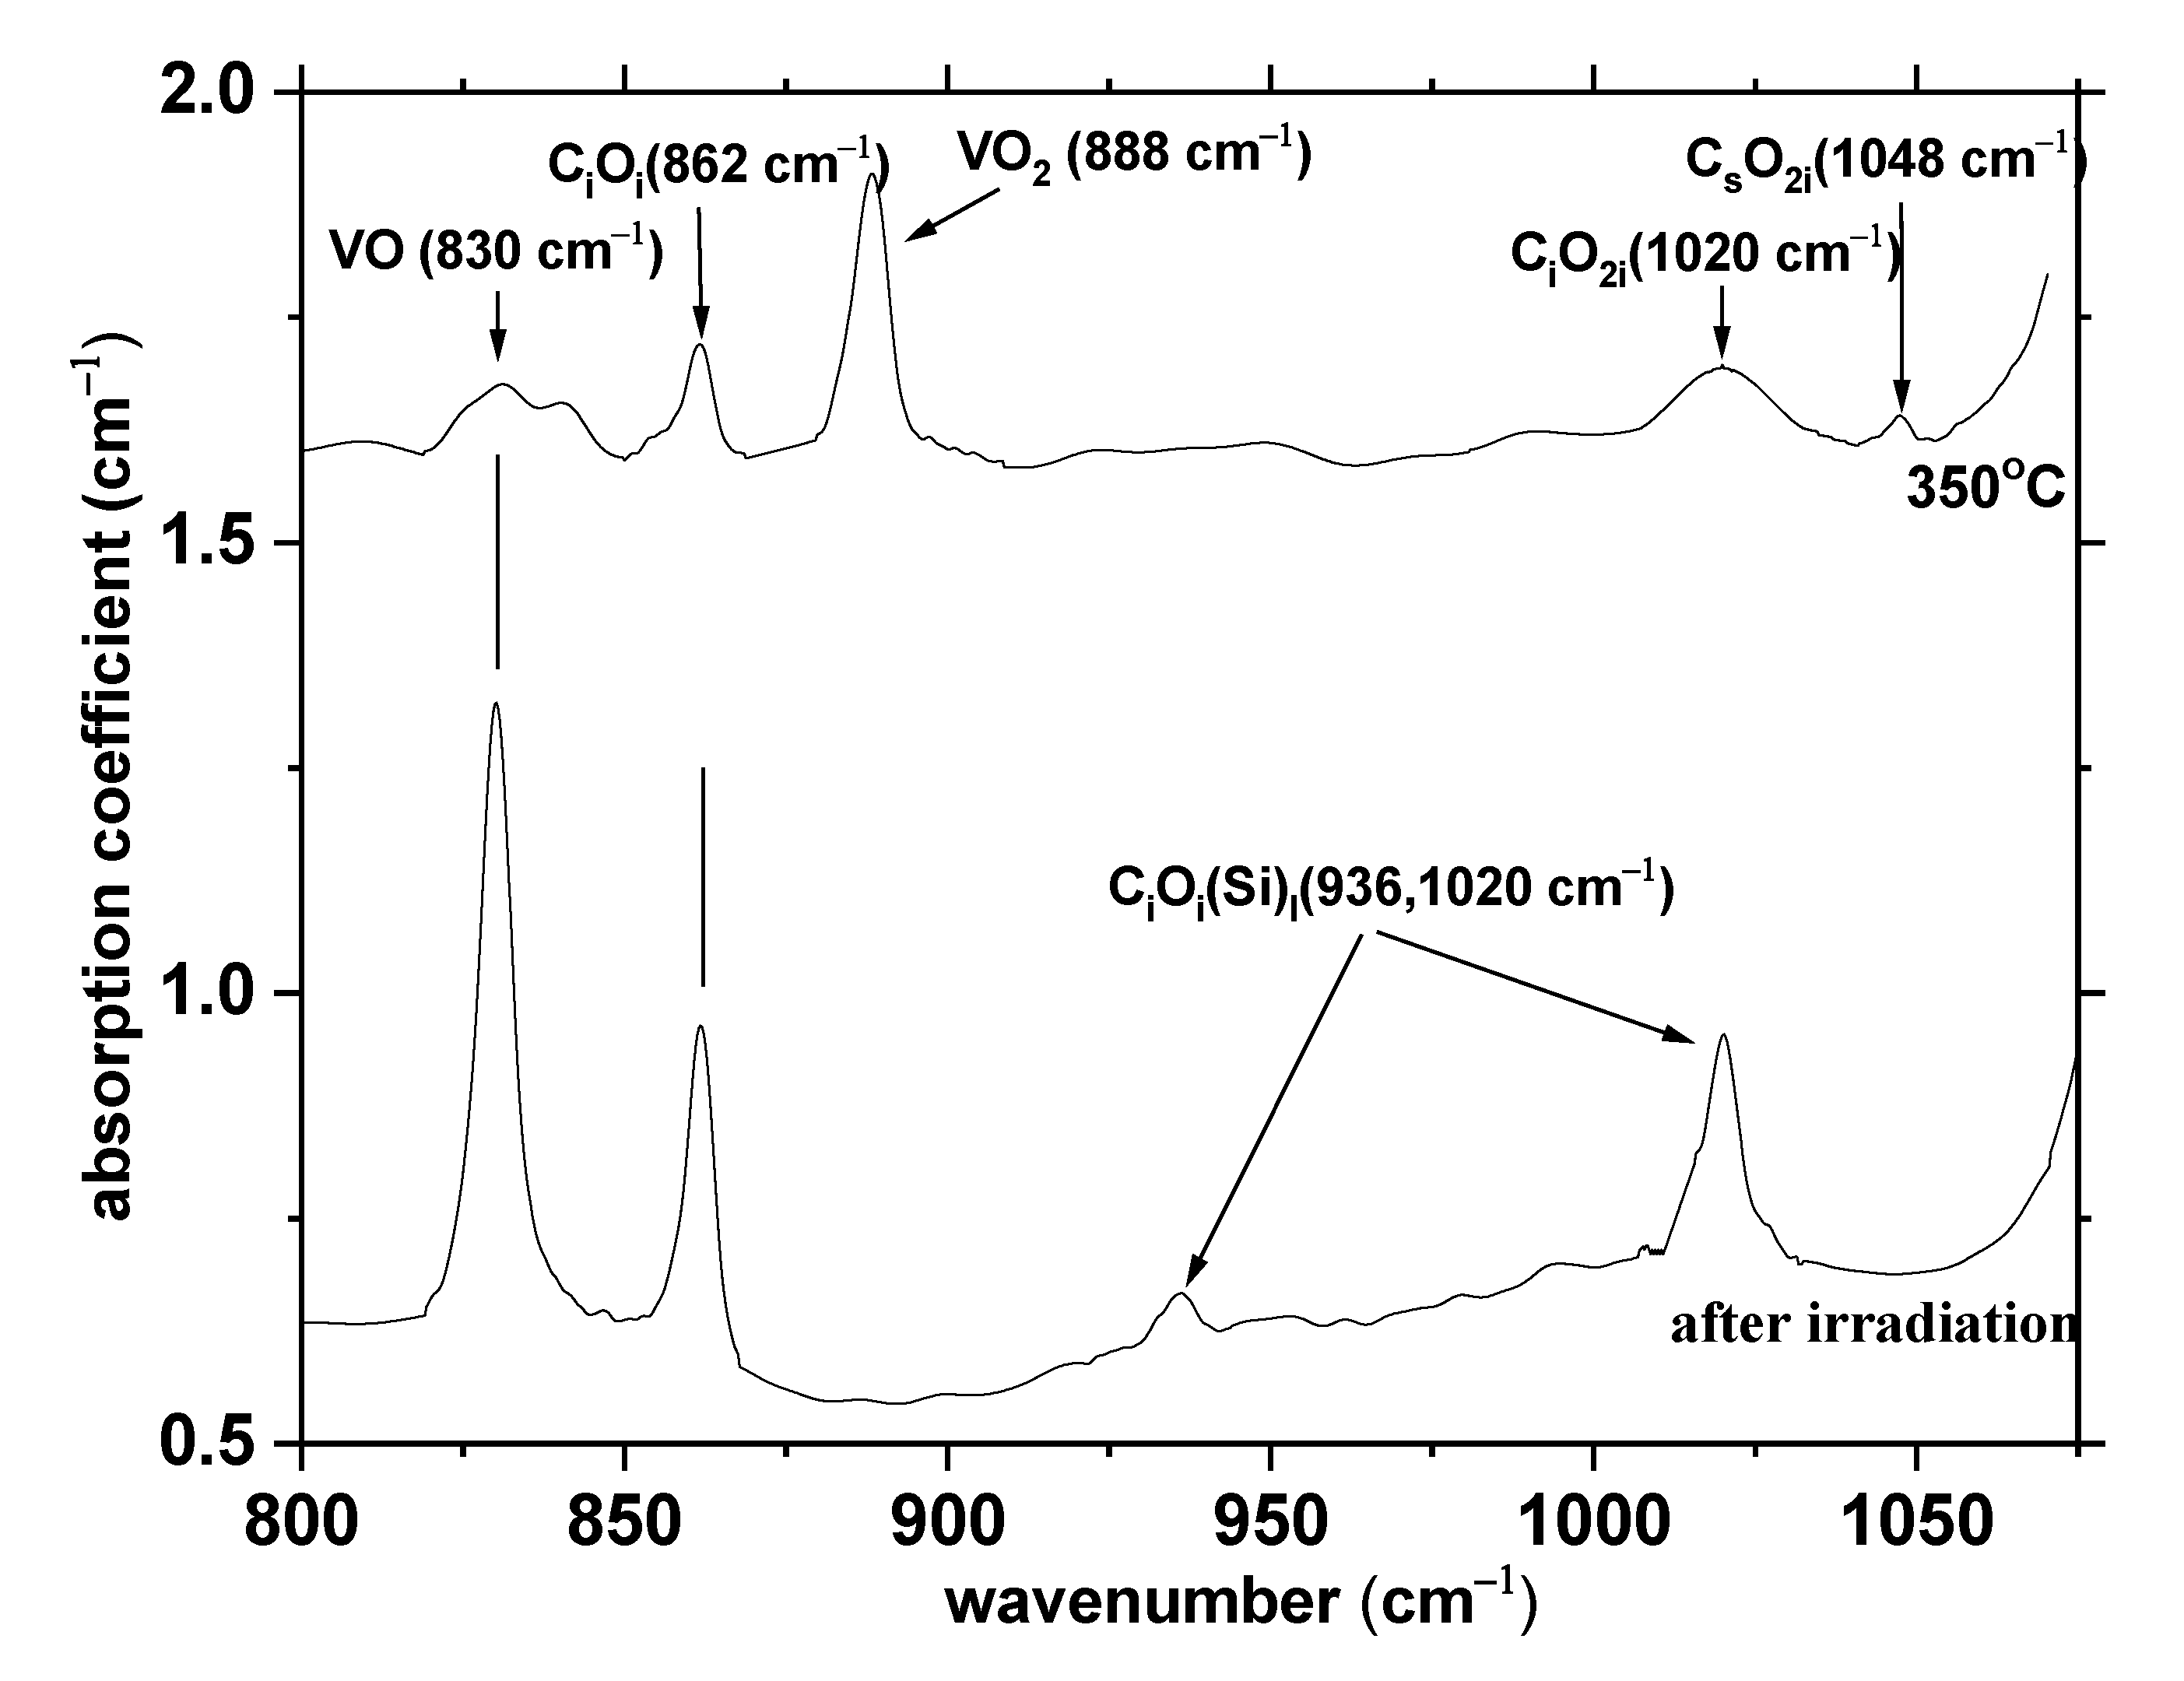
Abstract
:1. Introduction
2. Materials and Methods
2.1. Experimental
2.2. Theoretical
3. Results
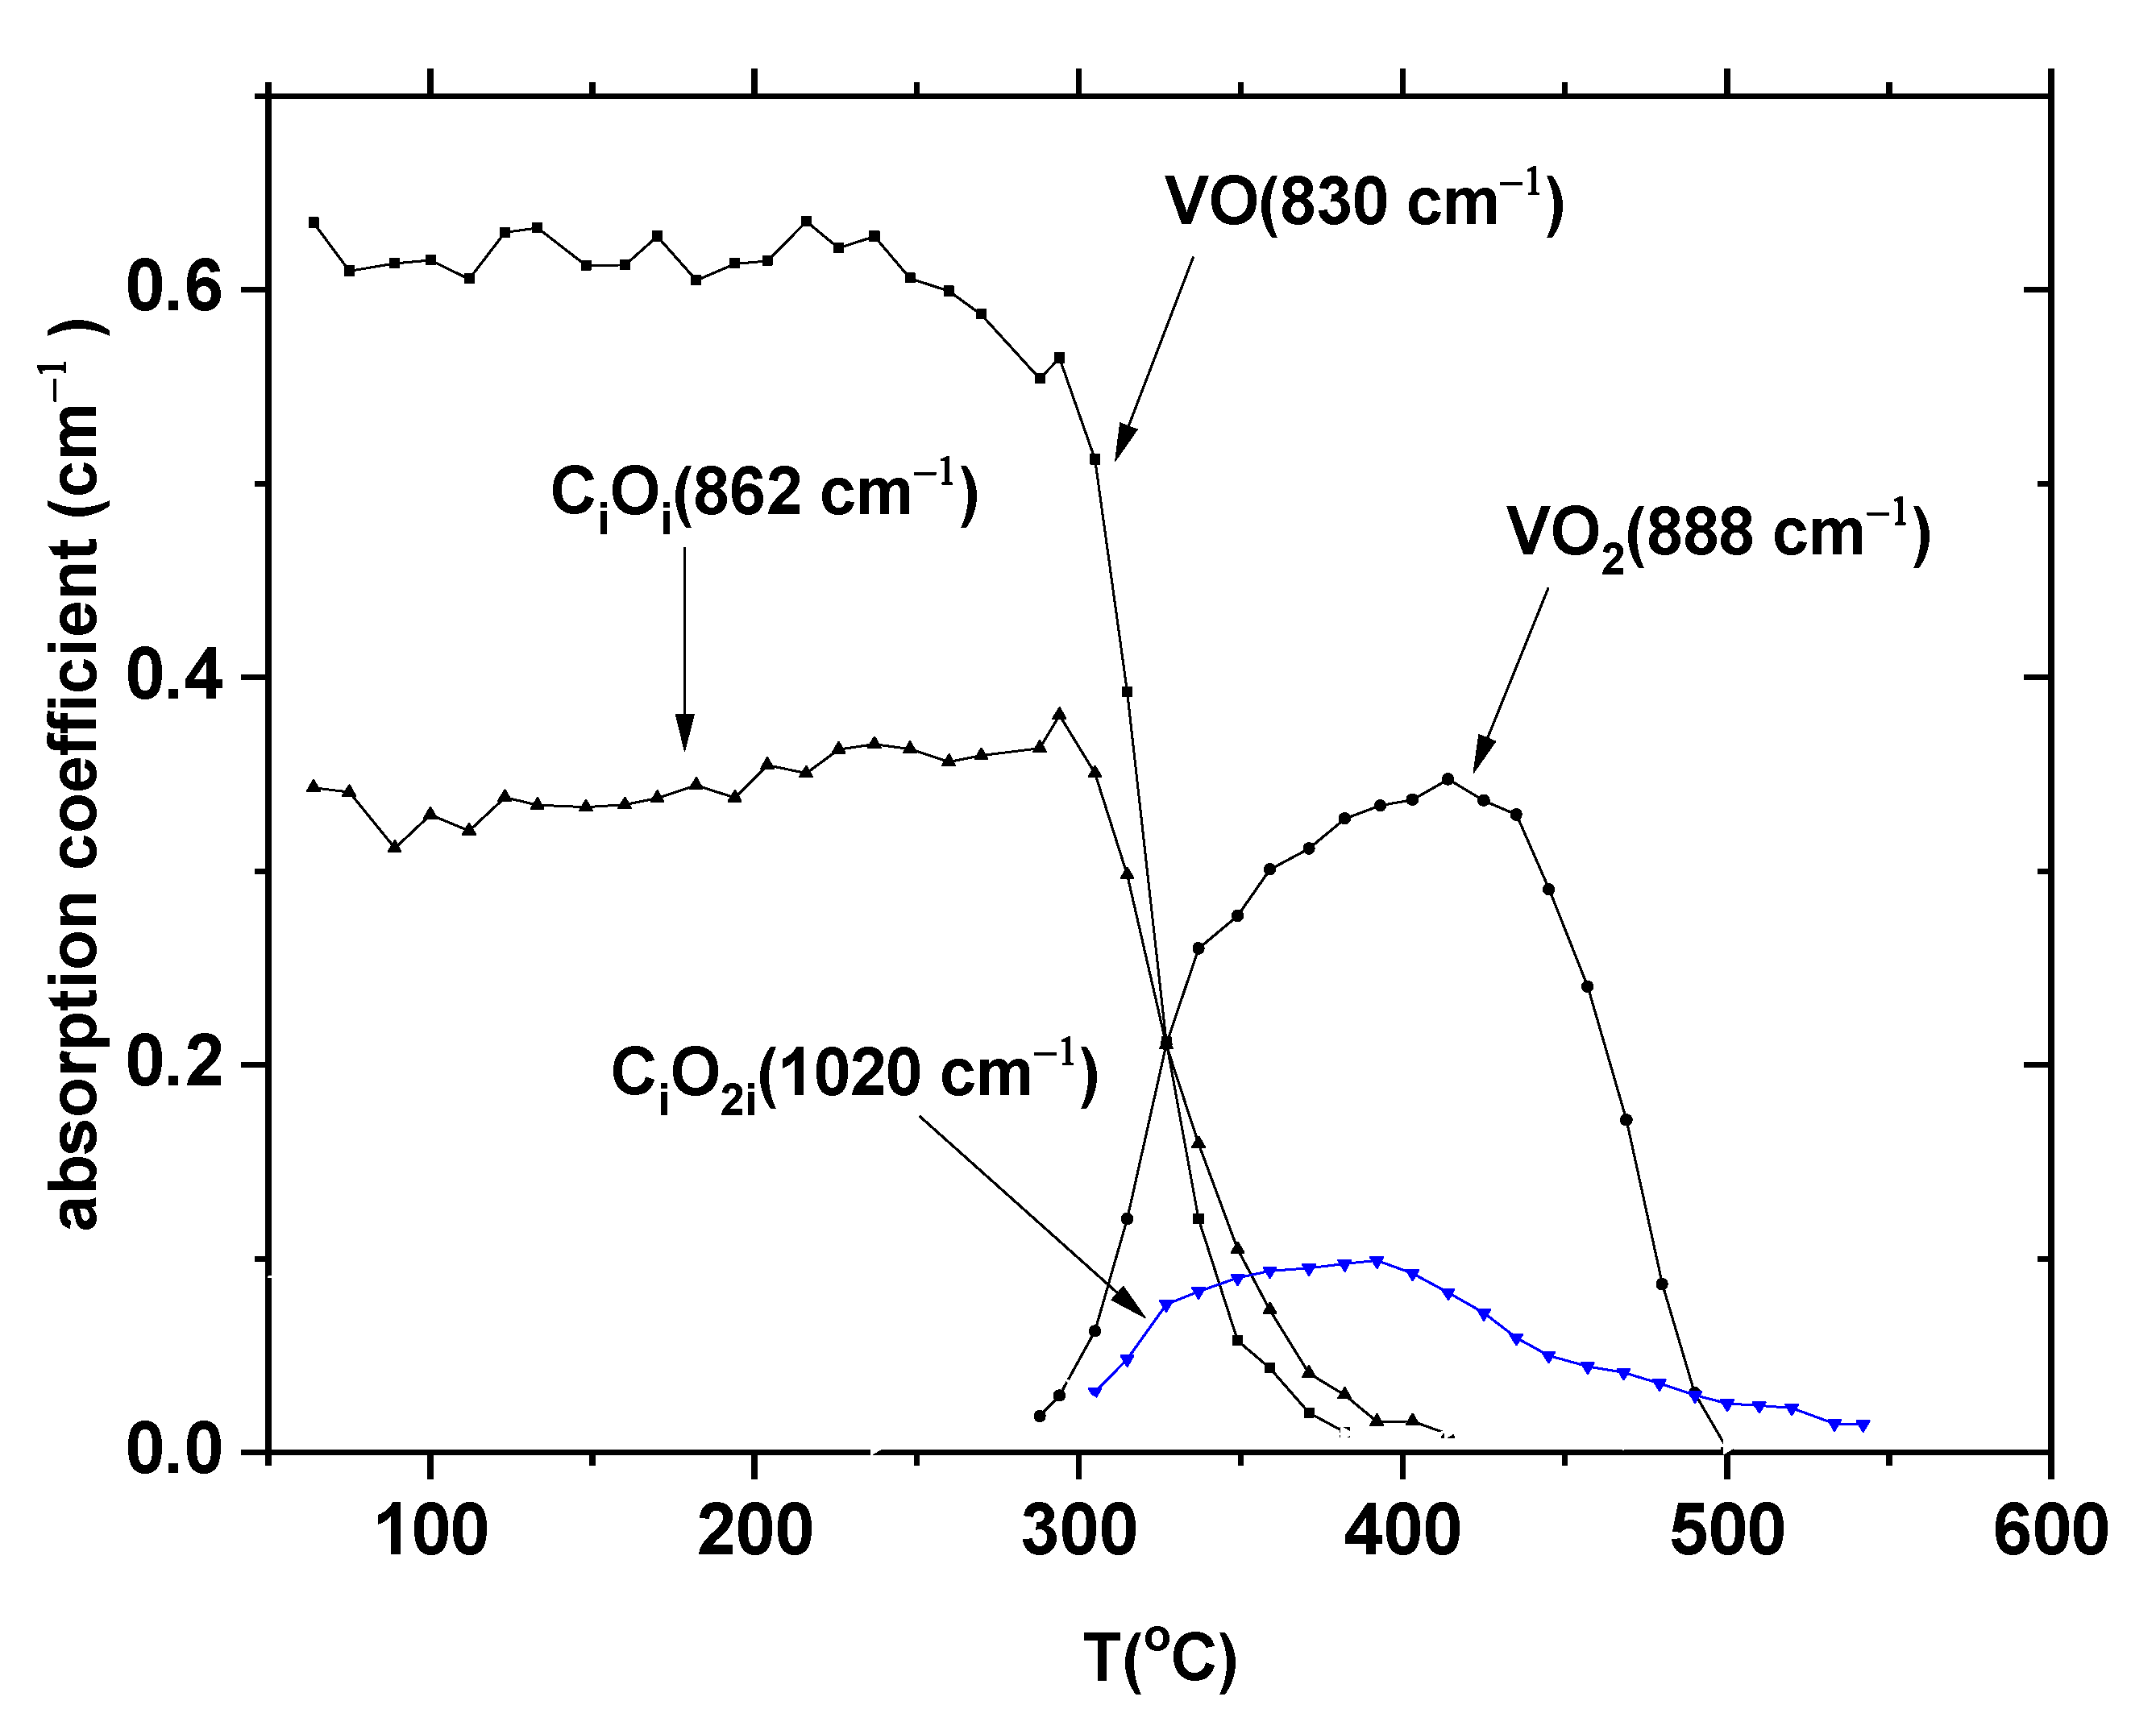
3.1. IR Measurements
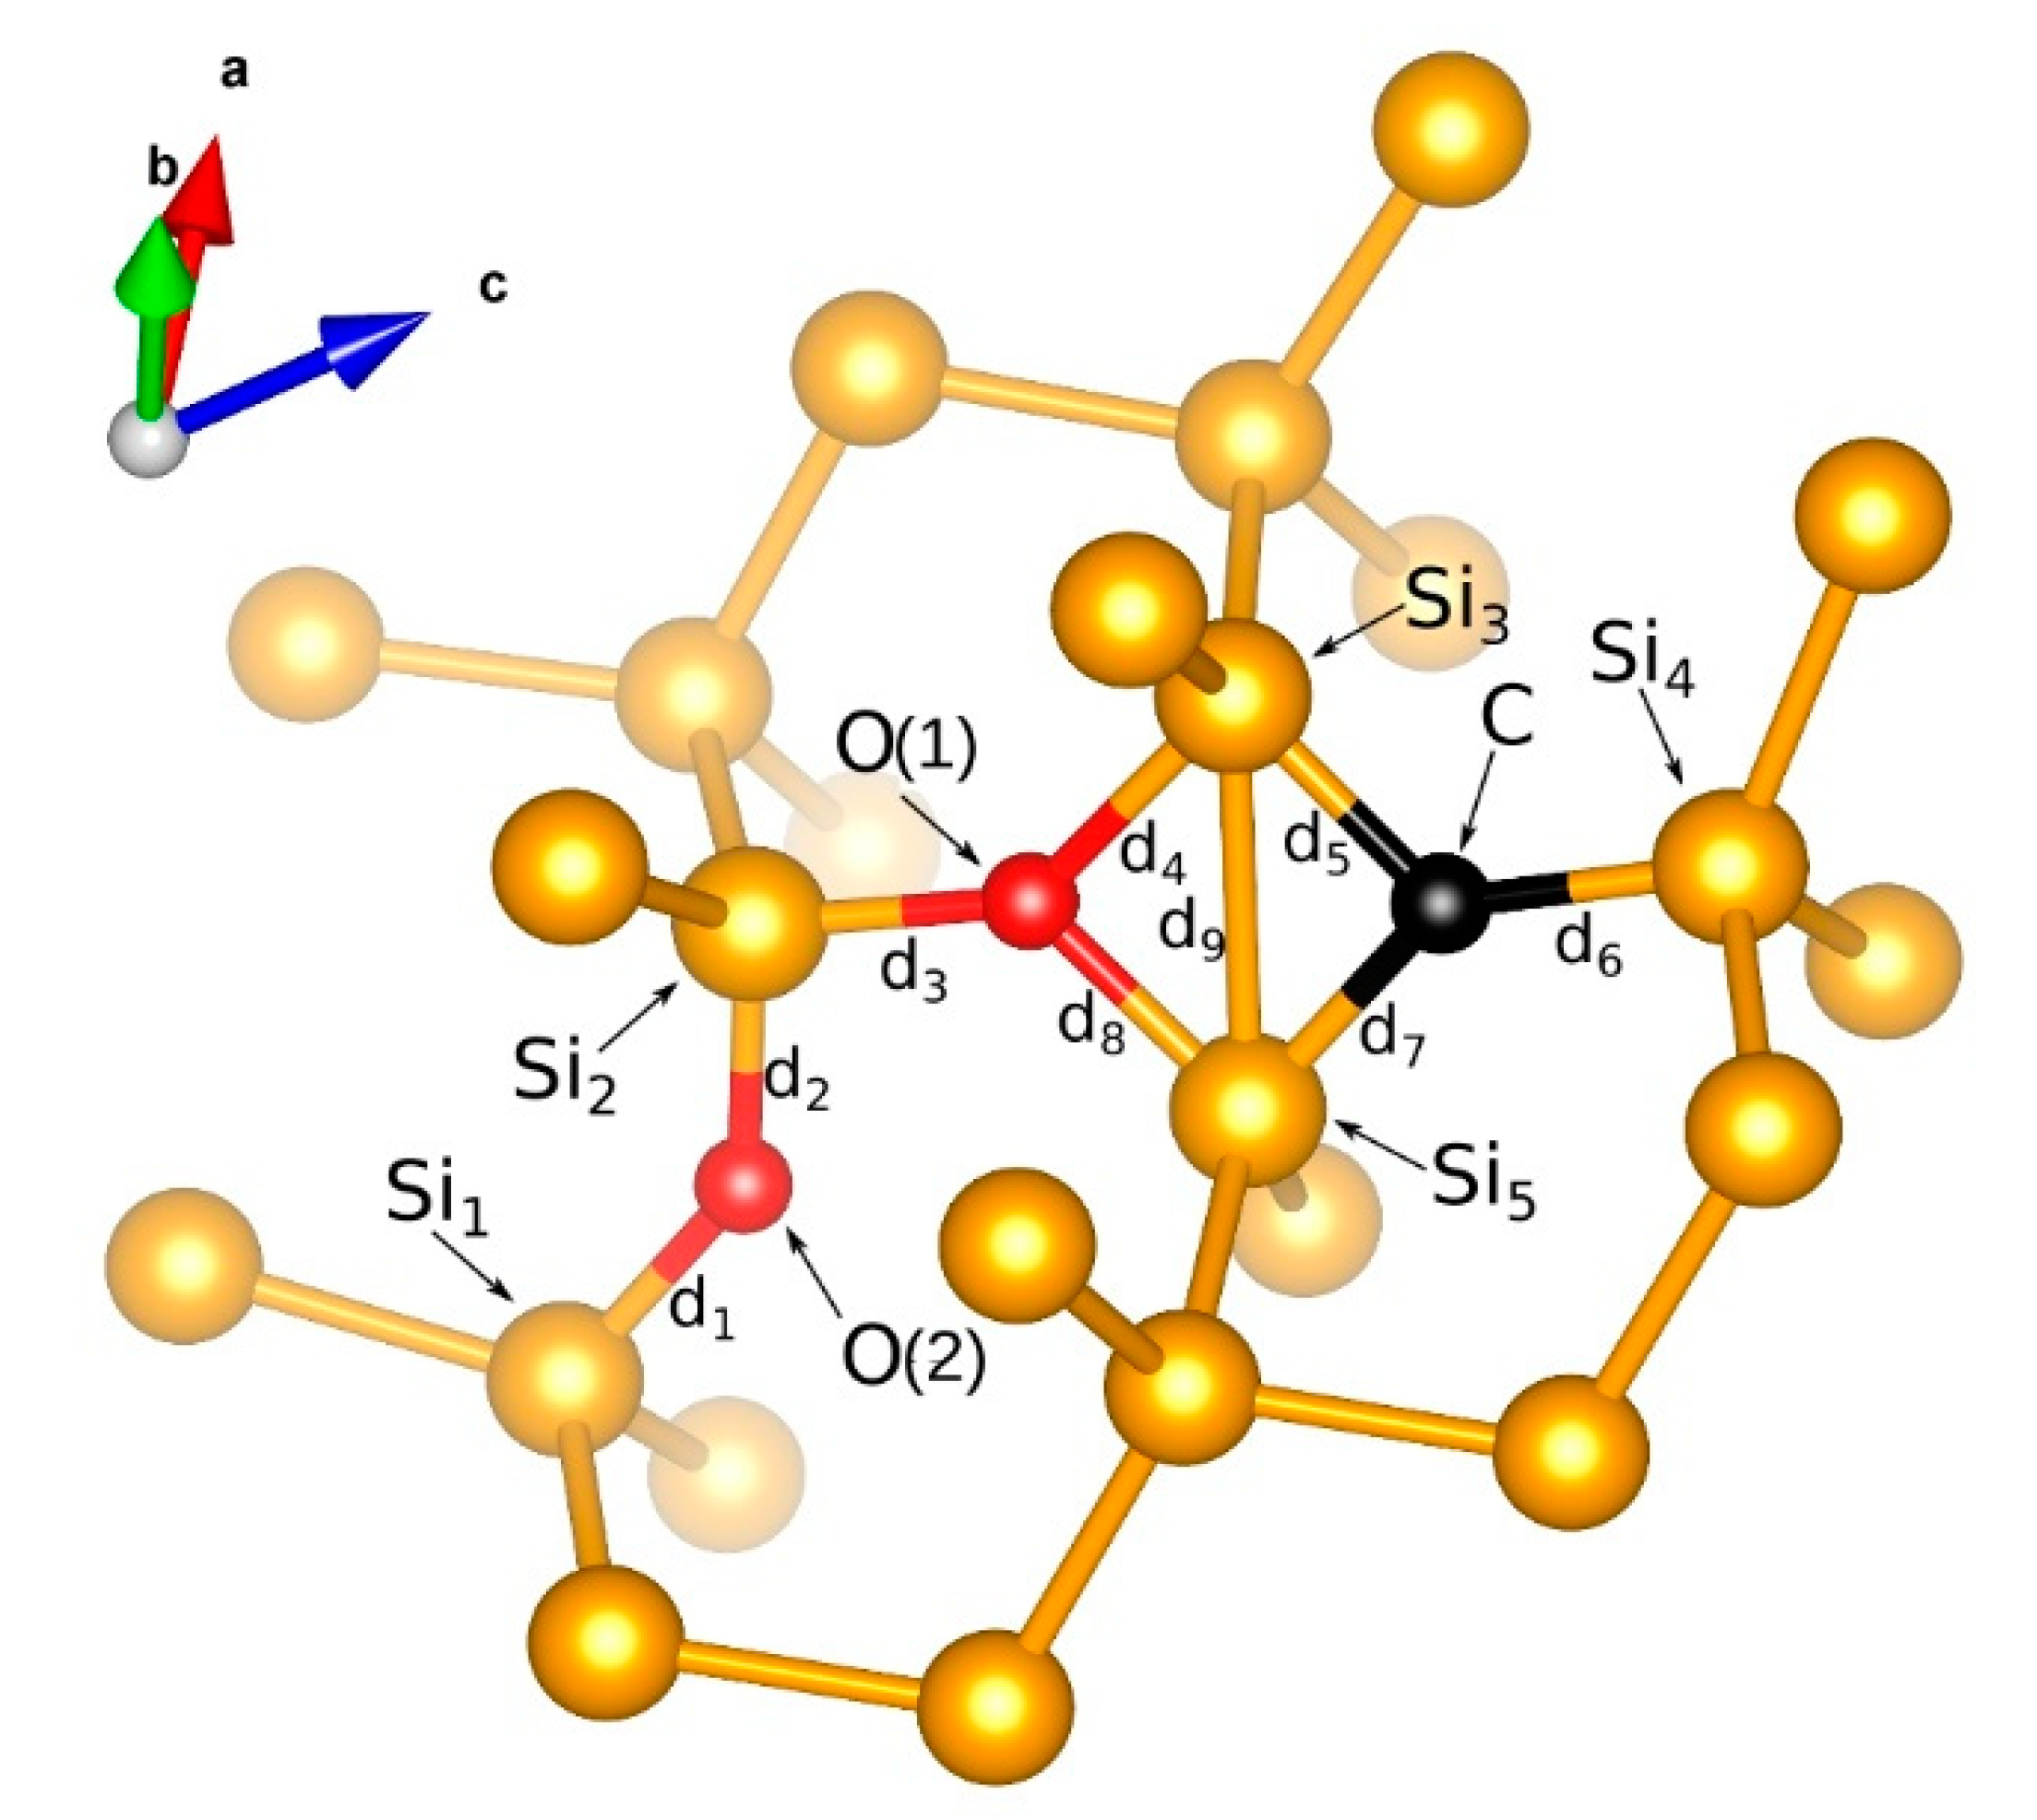
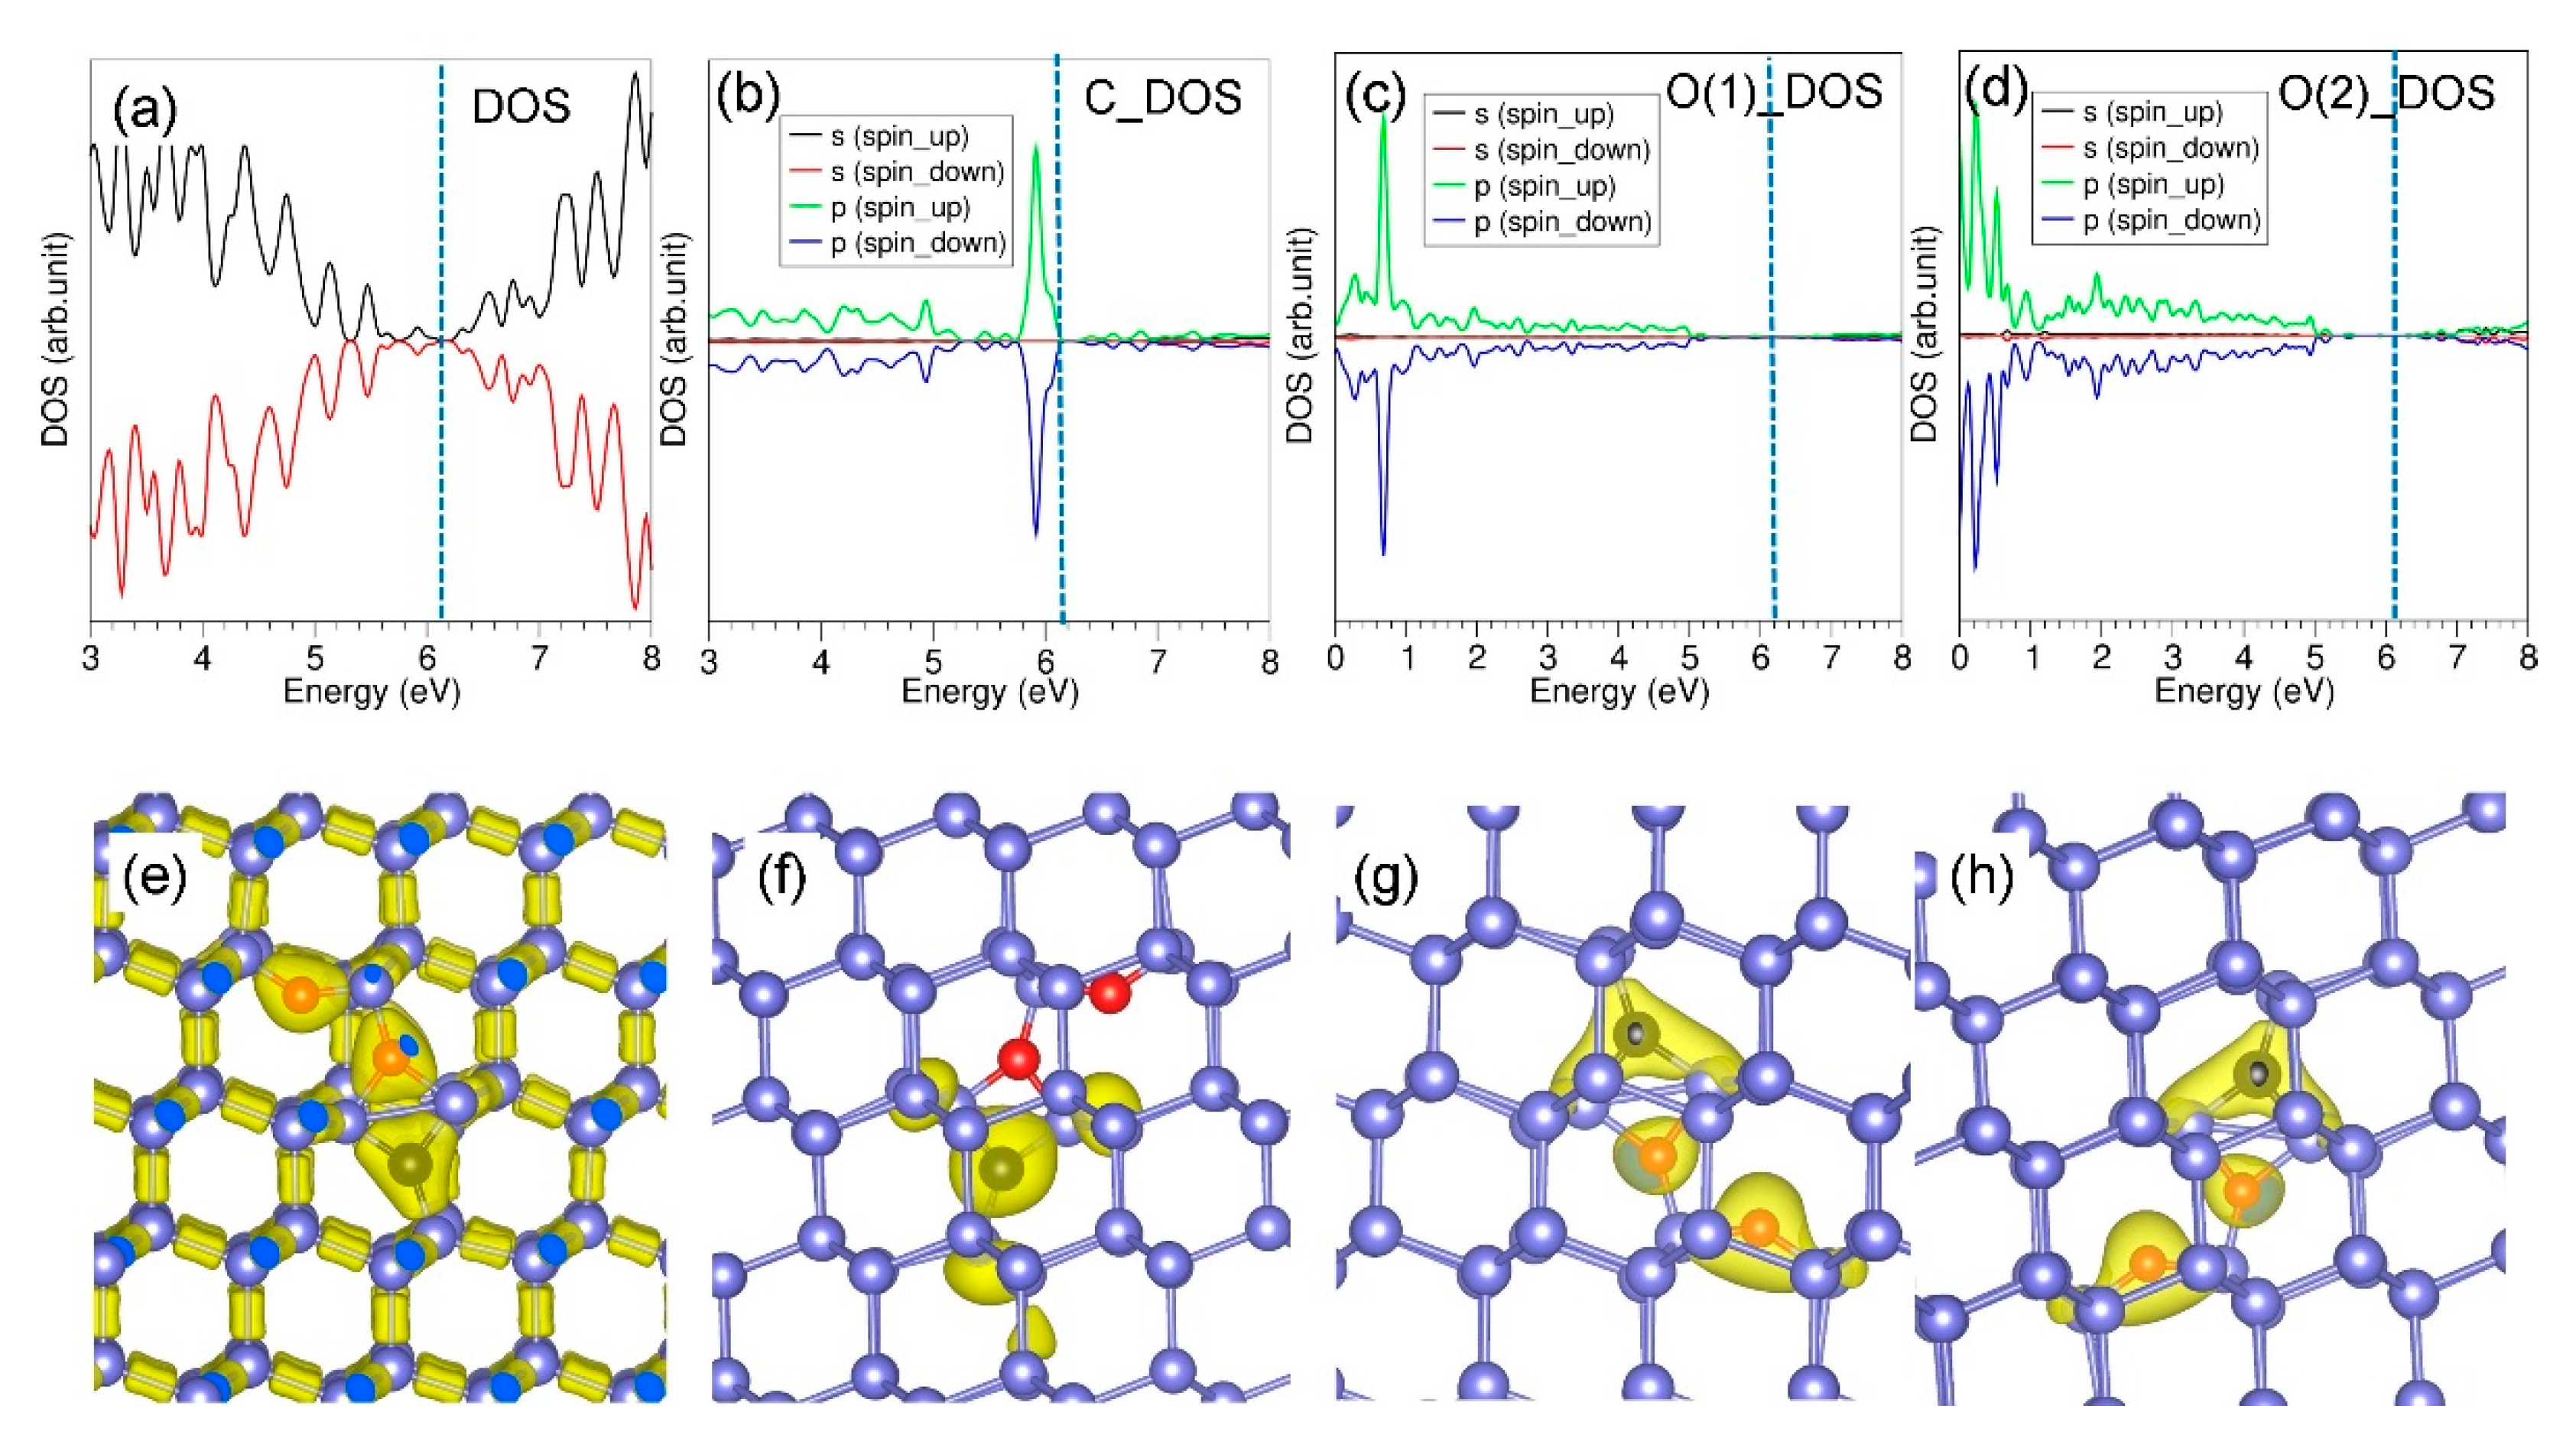
3.2. DFT Results
3.3. LVM Estimations via the Dipole–Dipole Interaction Method
4. Discussion
5. Conclusions
Author Contributions
Funding
Acknowledgments
Conflicts of Interest
References
- Davies, G.; Newman, R.C. Carbon in Monocrystalline Silicon. In Handbook on Semiconductors; Completely Revised ed.; Moss, T.S., Mahajan, S., Eds.; Elsevier Science, B.V.: Amsterdam, The Netherlands, 1994; Volume 3, pp. 1557–1635. [Google Scholar]
- Newman, R.C.; Jones, R. Diffusion of Oxygen in Silicon. In Semiconductors and Semimetals: Oxygen in Silicon; Shimura, F., Ed.; Academic Press: Orlando, FL, USA, 1994; Volume 42, pp. 289–352. [Google Scholar]
- Londos, C.A. Annealing Studies of Defects Pertinent to Radiation Damage in Silicon. Phys. Stat. Sol. 1987, 102, 639–644. [Google Scholar] [CrossRef]
- Ferenczi, G.; Londos, C.A.; Pavelka, T.; Somogyi, M. Correlation of the concentration of the carbon-associated radiation damage levels with the total carbon concentration in silicon. J. Appl. Phys. 1988, 63, 183–189. [Google Scholar] [CrossRef]
- Chappell, S.P.; Claybourn, M.; Newman, R.C.; Barraclough, K.G. The production of Ci-Oi complexes during irradiation of Czochralski silicon at 130 K. Semicond. Sci. Technol. 1988, 3, 1047–1051. [Google Scholar] [CrossRef]
- Watkins, G.D.; Corbett, J.W. Defects in Irradiated Silicon. I. Electron Spin Resonance of the Si-A Center. Phys. Rev. 1961, 121, 1001–1014. [Google Scholar] [CrossRef]
- Londos, C.A.; Andrianakis, A.; Sgourou, E.N.; Emtsev, V.V.; Ohyama, H. IR studies of the impact of Ge doping on the successive conversion of VOn defects in Czochralski-Si containing carbon. J. Appl. Phys. 2011, 109, 1–8. [Google Scholar] [CrossRef] [Green Version]
- Tsuchiya, D.; Sueoka, K.; Yamamoto, H. Density Functional Theory Study on Defect Behavior Related to the Bulk Lifetime of Silicon Crystals for Power device Application. Phys. Status Solidi A 2019, 216, 1–17. [Google Scholar] [CrossRef]
- Brotherton, S.D.; Bradley, P.J. Defect production and lifetime control in electron and γ-irradiated silicon. Appl. Phys. 1982, 53, 5720–5732. [Google Scholar] [CrossRef]
- Siemieniec, M.; Niedernostheide, F.-J.; Schlze, H.-J.; Sudkamp, W.; Kellner-Werdehausen, U.; Lutz, J. Irradiation-Induced Deep Levels in Silicon for Power Device Tailoring. J. Electroch. Soc. 2006, 153, G108–G118. [Google Scholar] [CrossRef]
- Svensson, B.G.; Lindström, J.L. Annealing Studies of the 862 cm−1 Infrared Band in Silicon. Phys. Stat. Sol. 1987, 95, 537–542. [Google Scholar] [CrossRef]
- Inoue, N.; Ohyama, H.; Goto, Y.; Sugiyama, T. Quantitative analysis of complexes in electron irradiated CZ silicon. Physica B 2007, 401, 477–482. [Google Scholar] [CrossRef]
- Murin, L.I.; Markevich, V.P.; Lindstrom, J.L.; Kleverman, M.; Hermansson, J.; Hallberg, T.; Svensson, B.G. Carbon-Oxygen-Related Complexes in Irradiated and Heat-Treated Silicon: IR Absorption Studies. Solid State Phenom. 2002, 82, 57–62. [Google Scholar] [CrossRef]
- Ewels, C.P.; Jones, R.; Oberg, S. Oxygen-Carbon, Oxygen-Nitrogen and Oxygen Dimer Defects in Silicon. In Early Stages of Oxygen Precipitation in Silicon; Jones, R., Ed.; Kluwer Academic Publishers: London, UK, 1996; Volume 17, pp. 141–162. [Google Scholar]
- Ayed, H.M.; Monakhov, E.V.; Coutinho, J. Formation and dissociation reactions of complexes involving interstitial carbon and oxygen defects in silicon. Phys. Rev. Mater. 2020, 4, 064601. [Google Scholar] [CrossRef]
- Kürner, W.; Sauer, R.; Dornen, A.; Thonke, K. Structure of the 0.767-eV oxygen-carbon luminescence defect in 450 oC thermally annealed Czochralski-grown silicon. Phys. Rev. B 1989, 39, 13327–13337. [Google Scholar] [CrossRef] [PubMed]
- Ayedh, H.M.; Grigorev, A.A.; Galeckas, A.; Svensson, B.G.; Monakhov, E.V. Annealing Kinetics of the Interstitial Carbon-Dioxygen Complex in Silicon. Phys. Status Solidi A 2019, 216, 1–5. [Google Scholar] [CrossRef]
- Ganagona, N.; Raeissi, B.; Vines, L.; Monakhov, E.V.; Svensson, B.G. Defects in p-type Cz-silicon irradiated at elevated temperatures. Phys. Status Solidi C 2012, 9, 2009–2012. [Google Scholar] [CrossRef]
- Raeissi, B.; Ganagona, N.; Galeckas, A.; Monakhov, E.V.; Svensson, B.G. PL and DLTS analysis of carbon-related centers in irradiated p-type Cz-Si. Solid State Phenom. 2014, 205, 224–227. [Google Scholar] [CrossRef]
- Kresse, G.; Furthmüller, J. Efficient iterative schemes for ab initio-energy calculations using a plane-wave basis set. Phys. Rev. B 1996, 54, 11169–11186. [Google Scholar] [CrossRef]
- Kresse, G.; Joubert, D. From ultrasoft pseudopotentials to the projector augmented-wave method. Phys. Rev. B 1999, 59, 1758–1775. [Google Scholar] [CrossRef]
- Blöchl, P.E. Projector augmented-wave method. Phys. Rev. B 1994, 50, 17953–17979. [Google Scholar] [CrossRef] [Green Version]
- Perdew, J.P.; Burke, K.; Ernzerhof, M. Generalized Gradient Approximation Made Simple. Phys. Rev. Lett. 1996, 77, 3865–3868. [Google Scholar] [CrossRef] [Green Version]
- Monkhorst, H.J.; Pack, J.D. Special points for Brillouin-zone integration. Phys. Rev. B 1976, 13, 5188–5192. [Google Scholar] [CrossRef]
- Press, W.H.; Teukolsky, S.A.; Vetterling, W.T.; Flannery, B.P. Numerical Recipes in C: The Art of Scientific Computing, 2nd ed.; Cambridge University Press: Cambridge, UK, 1992. [Google Scholar]
- Grimme, S.; Antony, J.; Ehrlich, S.; Krieg, H. A consistent and accurate ab initio parametrization of density functional dispersion correction (DFT-D) for the 94 elements H-Pu. J. Chem. Phys. 2010, 132, 1–19. [Google Scholar] [CrossRef] [Green Version]
- Chroneos, A.; Bracht, H.; Grimes, R.W.; Uberuaga, B.P. Phosphorus clustering in germanium-rich silicon germanium. Mater. Sci. Eng. B 2008, 154, 72–75. [Google Scholar] [CrossRef]
- Chroneos, A.; Jiang, C.; Grimes, R.W.; Schwingenschlögl, U.; Bracht, H. E centers in ternany Si1−x−yGexSny random alloys. Appl. Phys. Lett. 2009, 95, 1–3. [Google Scholar] [CrossRef] [Green Version]
- Chroneos, A.; Londos, C.A. Interaction of A-centers with isovalent impurities in silicon. J. Appl. Phys. 2010, 107, 1–4. [Google Scholar] [CrossRef] [Green Version]
- Sgourou, E.N.; Timerkaeva, D.; Londos, C.A.; Aliprantis, D.; Chroneos, A.; Caliste, D.; Pochet, P. Impact of isovalent doping on the trapping of vacancy and interstitial defects in silicon. J. Appl. Phys. 2013, 113, 113506. [Google Scholar] [CrossRef] [Green Version]
- Wang, H.; Chroneos, A.; Londos, C.A.; Sgourou, E.N.; Schwingenschlögl, U. A-centers in silicon with hybrid density functional theory. Appl. Phys. Lett. 2013, 103, 052101. [Google Scholar] [CrossRef] [Green Version]
- Londos, C.A.; Sgourou, E.N.; Chroneos, A.; Emtsev, V.V. Carbon, oxygen and intrinsic defect interactions in germanium-doped silicon. Semicond. Sci. Technol. 2011, 26, 1–6. [Google Scholar] [CrossRef]
- Chroneos, A.; Sgourou, E.N.; Londos, C.A.; Schwingenschlögl, U. Oxygen defect processes in silicon and silicon germanium. Appl. Phys. Rev. 2015, 2, 021306. [Google Scholar] [CrossRef] [Green Version]
- Khirunenko, L.I.; Sosnin, M.G.; Pomozov, Y.V.; Murin, L.I.; Markevich, V.P.; Peaker, A.R.; Almeida, L.M.; Coutinho, J.; Torres, V.J.B. Formation of interstitial carbon-interstitial oxygen complexes in silicon: Local vibrational mode spectroscopy and density functional theory. Phys. Rev. B 2008, 78, 155203. [Google Scholar] [CrossRef]
- Coutinho, J.; Jones, R.; Briddon, P.R.; Ӧberg, S.; Murin, L.I.; Markevich, V.P.; Lindstrӧm, J.L. Interstitial carbon-oxygen center and hydrogen related shallow thermal donors in Si. Phys. Rev. B 2001, 65, 014109. [Google Scholar] [CrossRef]
- Backlund, D.J.; Estreicher, S.K. C4 defect and its precursors in Si: First principles theory. Phys. Rev B 2008, 77, 1–8. [Google Scholar] [CrossRef]
- Wang, H.; Chroneos, A.; Londos, C.A.; Sgourou, E.N.; Schwingenschlögl, U. Carbon related defects in irradiated silicon revisited. Sci. Rep. 2014, 4, 1–9. [Google Scholar] [CrossRef] [PubMed] [Green Version]
- Sarlis, N.V.; Londos, C.A.; Fytros, L.G. Origin of infrared bands in neutron-irradiated silicon. J. Appl. Phys. 1997, 81, 1645–1650. [Google Scholar] [CrossRef] [Green Version]
- Potsidi, M.S.; Londos, C.A. The CiCs(SiI) defect in silicon: An infrared spectroscopy study. J. Appl. Phys. 2006, 100, 1–4. [Google Scholar] [CrossRef]
- Davies, G.; Hayama, S.; Hao, S.; Bech Nielsen, B.; Coutinho, J.; Sanati, M.; Estreicher, S.K.; Itoh, K.M. Host isotope effects on midinfrared optical transitions in silicon. Phys. Rev. B 2005, 71, 1–7. [Google Scholar] [CrossRef] [Green Version]
- Mc Cluskey, M.D. Local vibrational modes of impurities in semiconductors. J. Appl. Phys. 2000, 87, 3593–3617. [Google Scholar] [CrossRef]
- Jackson, J. Classical Electrodynamics, 2nd ed.; Wiley: New York, NY, USA, 1975; p. 136. [Google Scholar]
- Bean, A.R.; Newman, R.C. The effect of carbon on thermal donor formation in heat treated pulled silicon crystals. J. Phys. Chem. Solids 1972, 33, 251–268. [Google Scholar] [CrossRef]
- Newman, R.C.; Oates, A.S.; Livingston, F.M. Self-interstitials and thermal donor formation in silicon: New measurements and a model for the defects. J. Phys. C Solid State Phys. 1983, 16, L667–L674. [Google Scholar] [CrossRef]
- Lindström, J.L.; Werman, H.; Oehrlein, G.S. Thermal donors and carbon-Oxygen defects in silicon. Phys. Status Solid A 1987, 99, 581–591. [Google Scholar] [CrossRef]


Publisher’s Note: MDPI stays neutral with regard to jurisdictional claims in published maps and institutional affiliations. |
© 2020 by the authors. Licensee MDPI, Basel, Switzerland. This article is an open access article distributed under the terms and conditions of the Creative Commons Attribution (CC BY) license (http://creativecommons.org/licenses/by/4.0/).
Share and Cite
Potsidi, M.S.; Kuganathan, N.; Christopoulos, S.-R.G.; Chroneos, A.; Angeletos, T.; Sarlis, N.V.; Londos, C.A. The Interstitial Carbon–Dioxygen Center in Irradiated Silicon. Crystals 2020, 10, 1005. https://0-doi-org.brum.beds.ac.uk/10.3390/cryst10111005
Potsidi MS, Kuganathan N, Christopoulos S-RG, Chroneos A, Angeletos T, Sarlis NV, Londos CA. The Interstitial Carbon–Dioxygen Center in Irradiated Silicon. Crystals. 2020; 10(11):1005. https://0-doi-org.brum.beds.ac.uk/10.3390/cryst10111005
Chicago/Turabian StylePotsidi, Marianna S., Navaratnarajah Kuganathan, Stavros-Richard G. Christopoulos, Alexander Chroneos, Theoharis Angeletos, Nicholas V. Sarlis, and Charalampos A. Londos. 2020. "The Interstitial Carbon–Dioxygen Center in Irradiated Silicon" Crystals 10, no. 11: 1005. https://0-doi-org.brum.beds.ac.uk/10.3390/cryst10111005