Article

Analysis of Optical Performance Degradation in an Ion-Doped Liquid-Crystal Cell with Electrical Circuit Modeling

1
Departments of Electronics Engineering, Pusan National University, Busan 46241, Korea
2
LG Chem. R & D Campus Daejeon, Daejeon 34122, Korea
*
Author to whom correspondence should be addressed.
Submission received: 27 December 2019 / Revised: 16 January 2020 / Accepted: 20 January 2020 / Published: 21 January 2020
(This article belongs to the Special Issue Organic Optoelectronic Materials)

Abstract

:
We reported electrical circuit modeling to analyze the optical performance degradation in an ion-doped liquid-crystal (LC) cell, which exhibited advantages, such as excellent optical performance and simple switching process, but suffered from long-term reliability issues. When an electric field was applied to the cell for an extended period of time, the optical performance became nonuniform, and the haze in the opaque state decreased. By measuring the impedance and fitting the measured data by using an equivalent circuit model, we confirmed the changes of the parameters in the electrochemical impedance spectroscopy and electrophysical properties of the ion-doped LC cell with time. According to the measurement of the optical and physical characteristics, the optical performance degradation was caused mainly by the ionic materials.

Graphical Abstract

1. Introduction

Recently, light-shutter technologies, such as liquid crystals (LCs), electrochromic materials, and suspended particles, have been actively studied for automotive, architecture, outdoor, and display applications [1,2,3,4,5,6,7,8,9,10,11,12,13,14,15,16,17,18,19,20]. Among them, the LCs have attracted considerable attention because of their promising characteristics, including the ability to control the haze [2,3,4,8,9,10,12,13,14,15,16,17,18,19,20].
Various LC light-shutter technologies have been intensively studied, such as polymer-dispersed [2,3,4], polymer-stabilized [12,17,18], cholesteric [4,8,9], phase-grating [13,16,20], and ion-doped [14,15,19] LCs. Among them, the ion-doped LC cell has various advantages, such as excellent optical performance and a simple switching process [15,19]. It can provide a haze-free transparent state because it does not contain a polymer structure. Moreover, the haze in the opaque state is very high, owing to the strong scattering of the incident light by the electrohydrodynamic instability without polymer structure or complicated patterned electrodes [18,19]. Furthermore, it is switchable between the three states—the initial transparent, haze-free opaque, and high-haze opaque states—simply by changing the applied voltage without complicated switching process or patterned electrodes [19]. Despite the excellent optical performance, the reliability of the ion-doped LC device remains a critical issue.
The behaviors of ionic materials in LC cells have been extensively studied to increase the performance of display devices [21,22,23] and the dynamic scattering effect [24,25,26,27,28]. The behavior of ions under an applied electric field and ion accumulation at the alignment layer has been studied because they can influence the optical performance of an LC display and may lead to image sticking, image flickering, and reduced voltage holding ratio [21,23]. A light shutter based on an ion-doped LC cell can suffer from reliability issues, such as a decrease in haze and uniformity, in the opaque state. The mechanism of the electrohydrodynamic instabilities in the LCs has been investigated through several theoretical and experimental approaches [28]. However, studies about the long-term reliability issue in an ion-doped LC cell is still necessary for light shutter applications. To overcome these critical issues caused by the ionic materials, investigation of the changes in the optical and physical parameters during performance degradation is essential.
In this study, we analyzed the optical performance degradation of an ion-doped LC cell by electrical circuit modeling. When an electric field was applied to the cell for a long time, the cell exhibited a decrease in haze and the presence of nonuniformity. The degradation may be caused by complicated mechanisms related to the materials, such as the LC mixture, ionic material, and alignment layer. To analyze the degradation with time, we fabricated an ion-doped LC cell and measured the haze and impedance. Impedance and dielectric spectroscopic analyses were carried out to extract the impedance parameters, such as the resistance and capacitance of the LCs and physical parameters of the ionic materials in the bulk regions and near the alignment layers [29,30,31,32,33,34,35]. With the increase in time under the applied electric field, the LC cell exhibited nonuniformity with the decrease of the haze, capacitance of the LC cell, and thickness of the diffusion layer, along with the increase of the resistance of the LC cell and surface concentration of the ions. We expect that the measurement of the optical and physical characteristics can be used for the analysis of the optical performance degradation in the ion-doped LC cell. This could provide an effective analysis method to improve its reliability.

2. Measurement Setup and Cell Fabrication

To analyze the degradation issue, we measured the optical and physical characteristics of the ion-doped LC cell as a function of time. For the measurement of the optical characteristics, we used a haze meter (HM-65W, Murakami Color Research Laboratory, Tokyo, Japan). For the measurement of the physical characteristics, we used an inductance–capacitance–resistance meter (LCR-817, GWINSTEK, Taipei, Taiwan), which covered the frequency range from 12 Hz to 10 kHz. All measurements were carried out by applying a voltage of 0.3 V to the LC cell at 30 °C.
To evaluate the changes in the ion-doped LC cell with time, we fabricated an LC cell by using a mixture of negative LC, dichroic dyes, and ionic materials. We mixed a negative nematic LC (BHR28300-400, Δn: 0.230, Δε: −9.3, Bayi, Beijing, China) with 0.1 wt % of an ionic material (tetra-butylammonium bromide, Sigma-Aldrich, St. Louis, MO, USA) and 2 wt % of a dichroic black dye (X12, BASF, Ludwigshafen, Germany) [15,19]. The negative nematic LC is in the nematic phase for temperatures between −40 °C and 88 °C. The top and bottom substrates were coated with a homeotropic alignment layer (SE-5662, Nissan Chemical, Tokyo, Japan). The cell gap was maintained at 10 μm by using silica ball spacers. The electrode area was 625 mm2.

3. Experimental Results and Discussion

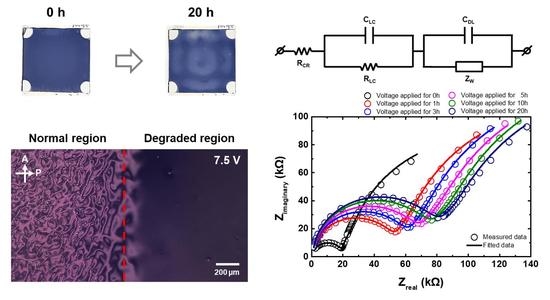
3.1. Change in the Optical Characteristics of the Ion-Doped LC Cell

The degradation of the ion-doped LC cell was caused by the non-uniform turbulence in the LC cell. Figure 1 illustrates the structure and operation principle of the ion-doped LC cell. Black dichroic dye was used to achieve black color through light absorption. Ionic material was used to control the haze through light scattering. In the initial transparent state, the LC and dye molecules were aligned perpendicular to the two substrates. The turbulence is generated by the electrohydrodynamic instability caused by the behavior of the ionic materials under an applied electric field [24,25,26,27,28]. In the opaque state, the incident light was strongly absorbed, because most of the dye molecules were oriented parallel to the substrates and were strongly scattered by the randomly distributed negative LCs with small domains [15,19,28]. Under the long-term operation, the distribution of the haze became less uniform because of the non-uniform turbulence caused by the ion accumulation at the surface of the electrodes with time. The white and red regions in the schematic represent the normal and degraded regions, respectively. In the degraded region of the LC cell, the turbulence weakened as time went on because of ion accumulation at the electrode surface. When the applied electric field was removed, the LCs returned to the initial transparent state. However, the non-uniform turbulence still existed when the electric field was applied again.
We analyzed the long-term reliability of the fabricated ion-doped LC cell to evaluate its degradation. The amplitude and frequency of the applied voltage wave were set to 60 V and 100 Hz, respectively. Figure 2 shows photographs of the fabricated LC cell in the opaque state. They were taken by placing it on top of a white backlight without polarizers. The fabricated LC cell exhibited a uniform opaque state in the beginning. However, the opaque state of the fabricated LC cell became nonuniform with time. It exhibited a nonuniform opaque state, changing with time, as shown in Figure 2. We believe that the shape of the bright pattern is related to complicated mechanisms, such as the position of the silica ball spacers and the cell gap difference. Further study is needed to understand the observed patterns.
To evaluate the changes in optical characteristics, we measured the haze of the fabricated ion-doped LC cell in the time range of 0 to 20 h. In the measurement, the amplitude and frequency of the applied voltage wave were set to 60 V and 100 Hz, respectively. Figure 3 shows the measured haze and photographs of the fabricated LC cell. Initially, the LC cell was in a transparent state. The haze increased with applied voltage through the electrohydrodynamic instability. The degraded ion-doped LC cell exhibited a nonuniform opaque state. As shown in the photographs of the fabricated cell, the degraded region was brighter than the normal region. We measured the haze in each region of the fabricated LC cell. The measurement points are marked as dotted circles in the photographs of the LC cell in the opaque state. In the dark region of the degraded ion-doped LC cell, the measured haze was 98.2% with a small deviation over time, as shown in Figure 3a. However, in its bright region, the haze was 97.9% at t = 0, which decreased to 91.9% at t = 20 h when the applied voltage was 60 V, as shown in Figure 3b.
To evaluate the origin of the decreased haze in a degraded ion-doped LC cell, the cell was observed by using polarized optical microscopy (POM) at the boundaries between the normal and degraded regions, as shown in Figure 4a. When the cell was in the turbulent state, the POM images show patterns corresponding to the “dynamic scattering mode” [36,37]. In this state, molecular orientation of the LCs shows a disordered structure, and the domains move randomly and dynamically [36]. The turbulence resulted in light scattering, and the haze increased as the applied voltage was increased. In the normal region, we can observe the turbulence when the applied voltage is higher than 7.5 V. On the other hand, the turbulence was not observed in the degraded region, as shown in the POM image of Figure 4b, when the applied voltage was 7.5 V or 10 V. When the applied voltage was higher than 20 V, we can observe the turbulence in the degraded region. The strength of the turbulence can be confirmed through the brightness in the POM image. The stronger the turbulence, the darker the POM image because of light scattering [36]. When the applied voltage was higher than 20 V, we observed higher density of small disclination loops and darker images in the normal region than those in the degraded region. Through the POM images, we observed strong turbulence in the normal region of the POM image and weak turbulence in the degraded region. However, further study about the reason for the sharp boundaries between the normal and degraded regions is needed.
We assume that the changes in the optical characteristics were caused by a decrease in the number of mobile ionic molecules in the LCs. Ionic molecules in the LCs accumulated near the surfaces of the electrodes with time. When the number of accumulated ionic molecules near the surface of the electrode was increased, the number of ionic molecules in the bulk region of the LCs was decreased, which led to decreases in the current, turbulence, and haze.

3.2. Change in the Impedance of the Ion-Doped LC Cell

To analyze the variations in optical characteristics, we measured the impedance of the fabricated LC cell. The LC cell can be modeled as a parallel combination of a resistance Rcell and capacitance Ccell. By measuring the impedance, each element of the equivalent circuit can be estimated. To study the variations in physical characteristics under the operation voltage, we measured the impedance of the fabricated LC cell over time and extracted the values of Rcell and Ccell. After operation for 20 h, Rcell increased from 32.4 to 141.4 kΩ; however, Ccell decreased from 20.8 to 2.55 nF, as depicted in Figure 5. The increase in resistance and decrease in capacitance could be related to the decrease in the haze. The decrease in the number of mobile ions decreased the current in the LCs and hindered the formation of space charges near the electrode. For a more detailed analysis, we carried out impedance spectroscopy to observe the changes in the degraded ion-doped LC cell.
Impedance spectroscopy is a useful method for the analyses of the mobile charges in both the bulk and interfacial regions. The overall impedance including the complex resistance can be expressed as
| Z | = Z r 2 + Z i 2 ,
φ = tan 1 ( Z i Z r ) ,
where Zr and Zi denote the real and imaginary components, respectively. The measured impedance can be modeled as a combination of resistance Rcell and capacitance Ccell. By using the measured impedance spectra, each component of the equivalent circuit, such as the resistance and capacitance, can be estimated by the numerical fitting.
Several equivalent circuits for LC cell modeling have been reported [32,33,34,35,38,39,40,41,42]. Sprokel has introduced an equivalent circuit model for the low-frequency behavior, including the LCs capacitance and resistance, and electrical double-layer capacitance induced by the space charges near the electrodes. The LC cell can be modeled as a series arrangement of double-layer capacitance with the parallel combination of resistance and capacitance of the LCs [38]. For the ion-doped LC cell, the impedance change in the low-frequency regime can be added to model the effects of the ion drift and diffusion. Belyaev and Drokin have added a Warburg diffusion element to the equivalent circuit model of the LC cell to model the diffusion [32,33].
First, we measured the impedance of a pure LC cell in the frequency range of 12 Hz to 10 kHz and used an equivalent circuit model with the electrode resistance RCR in series with the parallel combination of bulk LC resistance RLC and bulk LC capacitance CLC, as depicted in Figure 6a. We fitted the measured impedance spectrum (empty circle) by using the equivalent circuit model and obtained the impedance spectrum (solid line) in the frequency range of 0.1 Hz to 100 kHz, as shown in Figure 6b. With the decrease in frequency, the impedance of the pure LC cell, which represented the resistance of the LCs, increased to 21.44 MΩ, whereas the phase angle decreased to almost zero. With the increase in frequency, the impedance of the pure LC cell, which represented the resistance of the electrodes, decreased to 133.6 Ω. The extracted RCR, RLC, and CLC were 133.6 Ω, 21.44 MΩ, and 2.098 nF, respectively.
Second, we measured the impedance of the ion-doped LC cell in the frequency range of 12 Hz to 10 kHz. The ion-doped LC cell exhibited a considerably lower impedance than that of the pure LC cell, as shown in Figure 7a, owing to the increase in current by the ionic materials, which increased the conductivity of the LCs. In the frequency range of 100 Hz to 1 kHz, the impedance of the ion-doped LC cell exhibited a quasi-constant plateau [34]. The measured impedance increased over time, which implies that the current attributed to the ionic materials in the LCs decreased. With the increase in time, the quasi-constant plateau shifted to lower frequencies, which can be confirmed by the phase angle, as shown in Figure 7b. Peak frequency fpeak of the phase angle was considerably higher than that of the pure LC cell and decreased over time. In the impedance spectrum, fpeak corresponded to a large increase in imaginary impedance Zi, which represented the reactive components of the LC cell. The behavior of the ions under the applied electric field could be confirmed by the capacitance and dielectric-loss tangent spectra.
The dielectric loss represents the power dissipated by an alternating-current (AC) electric field in the dielectric material, which can be parameterized in terms of tan δ = Z / Z . When the polarity of the external field changes sufficiently slowly, such that the mobile ions move toward the oppositely charged interface, the dielectric loss tanδ reaches the maximum at the frequency fpeak. In this regime, a space charge is formed near the electrode, and the capacitance of the cell is increased [29,33,34,42,43,44].
To evaluate the characteristics of the ion behavior in the LCs when a low-frequency electric field was applied to the fabricated LC cell, we analyzed the frequency dependences of the measured capacitance and dielectric loss tangent. As shown in Figure 8a, Ccell increased at frequencies below fpeak because of the screening of the internal electric field in the measured LC cell by the space charges near the electrodes. At frequencies above fpeak, Ccell exhibited a small deviation regardless of the dopants or time. As the frequency was too high, the polarity changed too rapidly for the ions to respond; thus, space charges were not formed near the electrodes. Moreover, the dichroic dye and ionic materials did not significantly affect the capacitance of the LCs [33,34]. With time, Ccell also decreased, which explains the decrease in the concentrations of space charges near the electrodes, owing to the decrease in the content of mobile ions. We can confirm the ion behavior in the LCs by the decrease in fpeak, as shown in Figure 8b. In this regime, when the polarity of the electric field was maintained, the ions traveled a distance d between the electrodes during transit time ttr. Ion mobility µ can be expressed as [29,44]
μ = v E = 2 d 2 f p e a k α V 0 ,
where v is the drift velocity of the ions, E is the electric field intensity, fpeak is the frequency of the maximum value of the dielectric-loss–tangent spectrum, V0 is the effective voltage across the electrodes of the LC cell, and α = C D L / C L C is the attenuation coefficient measured under an applied voltage, in which CDL represents the double-layer capacitance governed by the space charges near the electrodes [33,35]. The ion mobility is related to the diffusion coefficient by the Einstein relationship,
D = μ k B T e ,
where e is the elementary charge, kB is Boltzmann’s constant, and T is the temperature (expressed in Kelvin).
To model the ion-doped LC cell with an equivalent circuit, ion drift, and diffusion need to be considered. Each component of the equivalent circuit, such as the resistance and capacitance, can be estimated by using the measured data and combination of the three previously introduced elements, the resistance, capacitance, and Warburg impedance [32,33]. Based on these circuit elements, we propose an equivalent circuit for the ion-doped LC cell, as shown in Figure 9a. When the equivalent circuit model shown in Figure 9a is applied to a pure LC cell, the effects of ZW and CDL can be neglected. Because the impedance of an LC cell is not affected by the ionic impurities, a pure LC cell can be modeled with an equivalent circuit shown in Figure 6a. ZW is the generalized finite-length Warburg impedance [34,35], which can be expressed as
Z W = W s r i ω ( 1 i ) tanh ( W s c i ω ) ,
where the coefficients Wsr and Wsc can be expressed as
W s r = R T N A F 2 A n s 2 D ,
W s c = δ N D ,
where ω is the angular frequency, R is the gas constant, T is the temperature (expressed in Kelvin), NA is the Avogadro’s number, F is the Faraday constant, A is the surface area, ns is the surface concentration of the ions, D is the diffusion coefficient of the mobile ions, and δN is the thickness of the Nernst diffusion layer [33,34,35].
Figure 9b shows Nyquist plots of the measured (empty circle) and fitted (solid line) impedance spectra of the equivalent circuit shown in Figure 9a. The Nyquist plot is a parametric plot of the frequency response. In the Cartesian coordinates, the x- and y-axes represent Zr and Zi, respectively. The empty circles show the measured data, while the solid line represents the fitting with the equivalent circuit. In the high-frequency regime, the ion drift and diffusion could not affect the impedance because the polarity of the electric field was not maintained. The Warburg impedance and double-layer capacitance were negligible. Moreover, the resistance and capacitance of the LCs were also negligible because of the displacement current. Therefore, the parallel combinations of RLC and CLC, CDL, and ZW could hardly affect the impedance and, thus, the measured impedance represents RCR. When the frequency was decreased, the Warburg impedance and double-layer capacitance were still negligible. To consider the conductivity of the LCs, the LC cell was modeled as RCR in series with the parallel combination of CLC and RLC. The semicircle in the Nyquist plot corresponded to the parallel combination of RLC and CLC. Moreover, the diameter of the semicircle reveals RLC, while its edge reveals RCR. In the low-frequency regime, the drift and diffusion of the ions were considered by adding the parallel combination of CDL and ZW. The straight line in the Nyquist plot corresponded to the parallel combination of ZW and CDL. Through measurement and numerical calculation, we confirmed that the equivalent circuit model is suitable for the fabricated LC cell and that the measured impedance can be fitted with high accuracy.
To analyze the origin of the optical performance degradation, we obtained the electrochemical impedance spectroscopy parameters of the equivalent circuit by using the measured impedance spectra. Each component of the equivalent model is shown in Table 1. RCR was 404.7 Ω in the beginning. With time, RCR slightly increased to 498.9 Ω, owing to the electrode wear and tear. CLC was 2.447 nF in the beginning and did not change over time because the ionic materials did not affect the capacitance of the LCs. RLC was 18.48 kΩ at t = 0 and increased to 78.24 kΩ at t = 20 h. This implies that the conductivity of the LCs decreased because of the decrease in the number of ions in the LCs. As the number of ions in the LCs decreased, surface charges could not easily form near the electrodes under the applied electric field. CDL was 70.41 nF at t = 0 and decreased to 47.77 nF at t = 20 h. This implies a decrease in the content of space charges near the electrodes, owing to the decrease in the number of mobile ions.
Furthermore, to evaluate the ion behaviors near the electrodes, we calculated the electrophysical parameters. The ion mobility μ and diffusion coefficient D can be calculated by using Equations (3) and (4), respectively, and fpeak, which can be obtained by using the results in Figure 8b. The surface concentration of the ions ns and thickness of the Nernst diffusion layer δN can be calculated by using the Warburg impedance elements Wsr and Wsc (Equations (6) and (7), respectively). The physical parameters obtained by using the measured impedance spectra are shown in Table 2. The ion concentration near the surface ns was 12.828 × 10¹⁸ m−3 at t = 0, which increased to 18.260 × 10¹⁸ m−3 at t = 20 h. This confirms that the ionic molecules in the LCs moved to the surfaces of the electrodes. The thickness of the Nernst diffusion layer was decreased from 3.4958 to 2.3582 µm for 20 h because the difference in ion concentration between the bulk and surface region was reduced. This led to decreases in the mobility and diffusion coefficient with time.
Through the measurement of the parameters in the electrochemical impedance spectroscopy and electrophysical properties, we confirmed the optical performance degradation of the ion-doped LC cell caused by the ion accumulation at the surfaces of the electrodes with time. It led to decreases in the current, turbulence, and haze. To improve the long-term reliability, further study about the structure of the negative nematic LC and ion material is necessary.

4. Conclusion

We studied the degradation issue in the ion-doped LC cell for light-shutter applications. With the increase in time, the ion-doped LC cell exhibited a decrease in haze and became less uniform. To analyze the degradation with time, we measured the optical and physical characteristics and compared them to those of the pure LC cell. We confirmed that an ion-doped LC cell shows the ion drift and diffusion, and space charges near the electrodes. Through the measurement and numerical calculation, we confirmed that an equivalent circuit model can be used for the analysis of an ion-doped LC cell and that the measured impedance can be fitted with high accuracy. With the increase in time, the bright region of the degraded ion-doped LC cell exhibited decreases in the haze, electrical double-layer capacitance, mobility, diffusion coefficient, and thickness of the Nernst diffusion layer, along with increases in the resistance and surface concentration of the ions. The number of accumulated ionic molecules at the surface of the electrode increased; however, the number of ionic molecules in the bulk region decreased, which led to the decreases in the current, turbulence, and haze. The measured variations in the optical and physical characteristics of the ion-doped LC cell demonstrated that its performance degradation was attributed mainly to the ion accumulation at the surfaces of the electrodes.

Author Contributions

J.-H.S., J.-W.H., E.L., and T.-H.Y. planned the study. J.-H.S. wrote the manuscript; J.-H.S. and J.-W.H. conceived and designed the ion-doped liquid crystal cell. J.-H.S. and H.-J.S. performed the experiments; J.-H.S., H.-J.S., and E.L. analyzed the experimental and calculated data; T.-H.Y. supervised the analysis and co-wrote the manuscript. All authors discussed the results and commented on the manuscript at all stages. All authors have read and agreed to the published version of the manuscript.

Funding

This work was supported by a 2-Year Research Grant of Pusan National University.

Conflicts of Interest

The authors declare no conflict of interest.

References

  1. Heilmeier, G.H.; Zanoni, L.A. Guest-Host interactions in nematic liquid crystals. A new electrooptic effect. Appl. Phys. Lett. 1968, 13, 91–92. [Google Scholar] [CrossRef]
  2. Doane, J.W.; Vaz, N.A.; Wu, B.-G.; Zumer, S. Field controlled light scattering from nematic microdroplets. Appl. Phys. Lett. 1986, 48, 269–271. [Google Scholar] [CrossRef]
  3. Drzaic, P.S. Polymer dispersed nematic liquid crystal for large area displays and light valves. J. Appl. Phys. 1986, 60, 2142–2148. [Google Scholar] [CrossRef]
  4. Yang, D.-K.; Chien, L.-C.; Doane, J.W. Cholesteric liquid crystal/polymer dispersion for haze-free light shutters. Appl. Phys. Lett. 1992, 60, 3102–3104. [Google Scholar] [CrossRef] [Green Version]
  5. Granqvist, C.G.; Wittwer, V. Materials for solar energy conversion: An overview. Sol. Energy Mater. Sol. Cells 1998, 54, 39–48. [Google Scholar] [CrossRef]
  6. Azens, A.; Granqvist, C. Electrochromic smart windows: Energy efficiency and device aspects. J. Solid State Electrochem. 2003, 7, 64–68. [Google Scholar] [CrossRef]
  7. Vergaz, R.; Sánchez-Pena, J.-M.; Barrios, D.; Vazquez, M.C.; Contreras-Lallana, P. Modelling and electro-optical testing of suspended particle devices. Sol. Energy Mater. Sol. Cells 2008, 92, 1483–1487. [Google Scholar] [CrossRef] [Green Version]
  8. Wang, C.-T.; Lin, T.-H. Bistable reflective polarizer-free optical switch based on dye-doped cholesteric liquid crystal. Opt. Mater. Express 2011, 1, 1457–1462. [Google Scholar] [CrossRef]
  9. Yu, B.-H.; Huh, J.-W.; Heo, J.; Yoon, T.-H. Simultaneous control of haze and transmittance using a dye-doped cholesteric liquid crystal cell. Liq. Cryst. 2015, 42, 1460–1464. [Google Scholar] [CrossRef]
  10. Jensen, J.; Hösel, M.; Dyer, A.L.; Krebs, F.C. Development and Manufacture of Polymer-Based Electrochromic Devices. Adv. Funct. Mater. 2015, 25, 2073–2090. [Google Scholar] [CrossRef]
  11. Barrios, D.; Vergaz, R.; Sánchez-Pena, J.M.; García-Cámara, B.; Granqvist, C.G.; Niklasson, G.A. Simulation of the thickness dependence of the optical properties of suspended particle devices. Sol. Energy Mater. Sol. Cells 2015, 143, 613–622. [Google Scholar] [CrossRef]
  12. Lorenz, A.; Omairat, F.; Braun, L.; Kolosova, V. Nematic copolymer network LCs for swift continuous phase modulation and opaque scattering states. Mol. Cryst. Liq. Cryst. 2017, 646, 220–225. [Google Scholar] [CrossRef] [Green Version]
  13. Choi, T.-H.; Woo, J.-H.; Baek, J.-M.; Choi, Y.; Yoon, T.-H. Fast Control of Haze Value Using Electrically Switchable Diffraction in a Fringe-Field Switching Liquid Crystal Device. IEEE Trans. Electron Devices 2017, 64, 3213–3218. [Google Scholar] [CrossRef]
  14. Zhan, Y.; Schenning, A.P.H.J.; Broer, D.J.; Zhou, G.; Liu, D. Light-Driven Electrohydrodynamic Instabilities in Liquid Crystals. Adv. Funct. Mater. 2018, 28, 1707436. [Google Scholar] [CrossRef] [Green Version]
  15. Huh, J.-W.; Kim, J.-H.; Oh, S.-W.; Ji, S.-M.; Yoon, T.-H. Ion-doped liquid-crystal cell with low opaque-state specular transmittance based on electro-hydrodynamic effect. Dye. Pigment. 2018, 150, 16–20. [Google Scholar] [CrossRef]
  16. Choi, T.-H.; Woo, J.-H.; Jeon, B.-G.; Kim, J.; Cha, M.; Yoon, T.-H. Fast fringe-field switching of vertically aligned liquid crystals between high-haze translucent and haze-free transparent states. Liq. Cryst. 2018, 45, 1419–1427. [Google Scholar] [CrossRef]
  17. Jeon, B.-G.; Choi, T.-H.; Do, S.-M.; Woo, J.-H.; Yoon, T.-H. Effects of Curing Temperature on Switching Between Transparent and Translucent States in a Polymer-Stabilized Liquid-Crystal Cell. IEEE Trans. Electron Devices 2018, 65, 4387–4393. [Google Scholar] [CrossRef]
  18. Choi, Y.; Oh, S.-W.; Choi, T.-H.; Yu, B.-H.; Yoon, T.-H. Formation of polymer structure by thermally-induced phase separation for a dye-doped liquid crystal light shutter. Dye. Pigment. 2019, 163, 749–753. [Google Scholar] [CrossRef]
  19. Huh, J.-W.; Seo, J.-H.; Oh, S.-W.; Kim, S.-H.; Yoon, T.-H. Tristate switching of a liquid-crystal cell among initial transparent, haze-free dark, and high-haze dark states. J. Mol. Liq. 2019, 281, 81–85. [Google Scholar] [CrossRef]
  20. Oh, S.-W.; Jeon, B.-G.; Choi, T.-H.; Do, S.-M.; Yoon, T.-H. Independent control of haze and total transmittance with a dye-doped liquid crystal phase-grating device. Appl. Opt. 2019, 58, 4315–4319. [Google Scholar] [CrossRef]
  21. Perlmutter, S.H.; Doroski, D.; Moddel, G. Degradation of liquid crystal device performance due to selective adsorption of ions. Appl. Phys. Lett. 1996, 69, 1182–1184. [Google Scholar] [CrossRef]
  22. Costa, M.R.; Altafim, R.A.C.; Mammana, A.P. Ionic impurities in nematic liquid crystal displays. Liq. Cryst. 2001, 28, 1779–1783. [Google Scholar] [CrossRef]
  23. Xu, D.; Peng, F.; Chen, H.; Yuan, J.; Wu, S.-T.; Li, M.-C.; Lee, S.-L.; Tsai, W.-C. Image sticking in liquid crystal displays with lateral electric fields. J. Appl. Phys. 2014, 116, 193102. [Google Scholar] [CrossRef] [Green Version]
  24. Heilmeier, G.H.; Zanoni, L.A.; Barton, L.A. Dynamic scattering: A new electrooptic effect in certain classes of nematic liquid crystals. Proc. IEEE 1968, 56, 1162–1171. [Google Scholar] [CrossRef]
  25. Heilmeier, G.H.; Zanoni, L.A.; Barton, L.A. Further studies of the dynamic scattering mode in nematic liquid crystals. IEEE Trans. Electron Dev. 1970, 17, 22–26. [Google Scholar] [CrossRef]
  26. Baise, A.; Teucher, I.; Labes, M.M. Effect of charge-transfer acceptors on dynamic scattering in a nematic liquid crystal. Appl. Phys. Lett. 1972, 21, 142–143. [Google Scholar] [CrossRef]
  27. Lim, H.S.; Margerum, J.D.; Graube, A. Electrochemical Properties of Dopants and the D-C Dynamic Scattering of a Nematic Liquid Crystal. J. Electrochem. Soc. 1977, 124, 1389–1394. [Google Scholar] [CrossRef]
  28. Blinov, L.M.; Chigrinov, V.G. Electrooptic Effects in Liquid Crystal Materials, 1st ed.; Springer New York: New York, NY, USA, 1996; pp. 235–307. [Google Scholar]
  29. Cho, Y.-K.; Granick, S. A surface forces platform for dielectric measurements. J. Chem. Phys. 2003, 119, 547–554. [Google Scholar] [CrossRef] [Green Version]
  30. Barbero, G.; Alexe-Ionescu, A.L. Role of the diffuse layer of the ionic charge on the impedance spectroscopy of a cell of liquid. Liq. Cryst. 2005, 32, 943–949. [Google Scholar] [CrossRef]
  31. Alexe-Ionescu, A.L.; Barbero, G.; Lelidis, I. Models for ionic contribution to the complex dielectric constant of nematic liquid crystals. Phys. Rev. E 2009, 80, 061203. [Google Scholar] [CrossRef]
  32. Belyaev, B.A.; Drokin, N.A.; Maslennikov, A.N. Impedance spectroscopy investigation of liquid crystals doped with ionic surfactants. Phys. Solid State 2014, 56, 1455–1462. [Google Scholar] [CrossRef]
  33. Belyaev, B.A.; Drokin, N.A. Impedance spectroscopy investigation of electrophysical characteristics of the electrode-liquid crystal interface. Phys. Solid State 2015, 57, 181–187. [Google Scholar] [CrossRef]
  34. Urbanski, M.; Lagerwall, J.P.F. Nanoparticles dispersed in liquid crystals: Impact on conductivity, low-frequency relaxation and electro-optical performance. J. Mater. Chem. C 2016, 4, 3485–3491. [Google Scholar] [CrossRef]
  35. Dalir, N.; Javadian, S.; Kakemam, J.; Yousefi, A. Evolution of electro-chemical and electro-optical properties of nematic liquid crystal doped with graphene oxide. J. Mol. Liq. 2018, 265, 398–407. [Google Scholar] [CrossRef]
  36. Joets, A.; Ribotta, R. Hydrodynamic transitions to chaos in the convection of an anisotropic fluid. J. Phys. 1986, 47, 595–606. [Google Scholar] [CrossRef] [Green Version]
  37. Kai, S.; Zimmermann, W.; Andoh, M.; Chizumi, N. Local transition to turbulence in electrohydrodynamic convection. Phys. Rev. Lett. 1990, 64, 1111–1114. [Google Scholar] [CrossRef]
  38. Sprokel, G.J. Resistivity, Permittivity and the Electrode Space Charge of Nematic Liquid Crystals. Mol. Cryst. Liq. Cryst. 1973, 22, 249–260. [Google Scholar] [CrossRef]
  39. Murakami, S.; Iga, H.; Naito, H. Dielectric properties of nematic liquid crystals in the ultralow frequency regime. J. Appl. Phys. 1996, 80, 6396–6400. [Google Scholar] [CrossRef]
  40. Costa, M.; Altafim, R.; Mammana, A. Electrical modeling of liquid crystal displays-LCDs. IEEE Trans. Dielectr. Electr. Insul. 2006, 13, 204–210. [Google Scholar] [CrossRef]
  41. Garbovskiy, Y.; Glushchenko, A. Frequency-dependent electro-optics of liquid crystal devices utilizing nematics and weakly conducting polymers. Adv. Opt. Technol. 2018, 7, 243–248. [Google Scholar] [CrossRef]
  42. Podgornov, F.V.; Gavrilyak, M.; Karaawi, A.; Boronin, V.; Haase, W. Mechanism of electrooptic switching time enhancement in ferroelectric liquid crystal/gold nanoparticles dispersion. Liq. Cryst. 2018, 45, 1594–1602. [Google Scholar] [CrossRef]
  43. Mada, H.; Ryuzaki, M. Ion Influence on Nematic Liquid Crystal Cell Impedance at Low Frequency. Jpn. J. Appl. Phys. 1995, 34, 1134–1136. [Google Scholar] [CrossRef]
  44. Serghei, A.; Tress, M.; Sangoro, J.R.; Kremer, F. Electrode polarization and charge transport at solid interfaces. Phys. Rev. B 2009, 80, 184301. [Google Scholar] [CrossRef]
Figure 1. Structure and operation of the ion-doped LC cell.
Crystals 10 00055 g001
Figure 2. Photographs of the fabricated LC cell in the opaque state. They were taken by placing it on top of a white backlight.
Crystals 10 00055 g002
Figure 3. Measured haze of the ion-doped LC cell in the (a) dark and (b) bright regions as a function of operation time. The measurement points are marked as dotted circles in the photograph of the LC cell in the opaque state.
Crystals 10 00055 g003
Figure 4. (a) The measurement points are marked as dotted circles in the photograph of the LC cell in the opaque state and (b) POM images of the degraded ion-doped LC cell at the boundary between the normal and degraded regions at applied voltages of 7.5, 10, 20, and 30 V.
Crystals 10 00055 g004
Figure 5. Measured resistance (Rcell) and capacitance (Ccell) of the ion-doped LC cell over time under an applied sinusoidal voltage wave (60 V, 100 Hz).
Crystals 10 00055 g005
Figure 6. (a) Equivalent circuit model of a pure LC cell. (b) Measured magnitude | Z | and phase angle φ in the impedance spectrum of a pure LC cell. The open circles and solid lines represent the measured and fitted results, respectively.
Crystals 10 00055 g006
Figure 7. Measured impedance spectra of the ion-doped LC cell: (a) magnitude | Z | and (b) phase angle φ.
Crystals 10 00055 g007
Figure 8. Frequency dependence of the measured (a) capacitance and (b) dielectric loss tangent for the ion-doped LC cell as a function of time and that of the pure LC cell.
Crystals 10 00055 g008
Figure 9. (a) Equivalent circuit model of the ion-doped LC cell and (b) its Nyquist plot as a function of time. The open circles and solid lines represent the measured and fitted results, respectively.
Crystals 10 00055 g009
Table 1. Electrochemical impedance spectroscopy parameters as the elements of the equivalent circuit model obtained by using the measured impedance spectra.
TimeRCR (Ω)RLC (kΩ)CLC (nF)CDL (nF)WSR (MΩ∙s−1/2)WSC (Ω∙s−1/2)
0 h404.718.482.44770.410.71730.1744
1 h401.951.252.45255.510.81840.1952
3 h372.559.472.46753.450.85280.2039
5 h420.867.112.47350.210.87210.2067
10 h414.873.662.47748.490.89300.2086
20 h498.978.242.46047.770.89730.2095
Table 2. Electrophysical parameters of the ion-doped LC cell obtained by using the measured impedance spectra.
Timeµ (10−9∙m2∙s−1∙V−1)D (10−12∙m2∙s−1)δN (µm)ns (1018∙m−3)
0 h15.381401.793.495812.828
1 h6.6649174.112.575617.081
3 h6.0044156.852.553317.272
5 h5.6785148.342.516617.366
10 h5.1490134.512.419317.812
20 h4.8520126.752.358218.260

