Article

Stereoselective Crystallization of Chiral 3,4-Dimethylphenyl Glycerol Ether Complicated by Plurality of Crystalline Modifications

by
Alexander A. Bredikhin
*,
Dmitry V. Zakharychev
,
Zemfira A. Bredikhina
,
Alexey V. Kurenkov
,
Aida I. Samigullina
and
Aidar T. Gubaidullin
Arbuzov Institute of Organic and Physical Chemistry, FRC Kazan Scientific Center of RAS, Arbuzov St., 8, 420088 Kazan, Russia
*
Author to whom correspondence should be addressed.
Submission received: 28 February 2020 / Revised: 11 March 2020 / Accepted: 12 March 2020 / Published: 14 March 2020
(This article belongs to the Special Issue Advances in Industrial Crystallization)

Abstract

:
Spontaneous resolution of Pasteur’s salt was historically the first way to obtain pure enantiomers from the racemate. The current increase in interest in the direct racemates resolution during crystallization is largely due to the opened prospects for the industrial application of this approach. The chiral 3-(3,4-dimethylphenoxy) propane-1,2-diol 1 is a synthetic precursor of practically useful amino alcohols, the enantiomers of which exhibit different biological effects. In this work, it was first discovered that racemic diol 1 is prone to spontaneous resolution. However, the crystallization process is complicated by the existence, along with the conglomerate, of two other crystalline forms. Using the differential scanning calorimetry (DSC) approach, methods have been developed to obtain individual metastable phases, and all identified modifications ((R)-1, (R+S)-1, α-rac-1, β-rac-1) were ranked by energy. The IR spectroscopy and powder X-ray diffraction (PXRD) methods demonstrated the identity of the first two forms and their proximity to the third, while β-rac-1 is significantly different from the rest. The crystal structure of the forms (R)-1 and α-rac-1 was established by the single crystal X-ray diffraction (SC-XRD) method. Preliminary information on the structure of β-rac-1 phase was obtained by the PXRD approach. Based on the information received, the experimental conditions for a successful direct resolution of racemic 1 into individual enantiomers by a preferential crystallization procedure were selected.

Graphical Abstract

1. Introduction

Chirality (the ability of an object to exist in the form of non-superimposable mirror copies) is a fundamental property that has numerous manifestations, including various biological effects of enantiomers on a living organism [1]. For this reason, since the beginning of the century, among the new active pharmaceutical ingredients (APIs), chiral substances, represented by a single enantiomer, have dominated [2]. This trend continues to the present. For instance, 45 new drugs have been approved in the USA in 2015, 33 of which were monomeric chiral compounds and, with only one exception, were pure enantiomers [3]. According to the information provided in the review [4], 30 new chiral APIs of a monomeric nature were registered in USA in 2018, of which only two were approved as racemates.
Crystallization, employed in batch or continuous format, is used almost universally for the purification and isolation of solid crystalline APIs [5,6]. Crystallization is widely used for the deracemization of chiral APIs through the separation of their diastereomeric derivatives [7,8,9]. Compared with the classical methods for the preparation of non-racemic substances [10], direct methods of racemates resolution based on the preferential crystallization of one of the enantiomers from racemic solutions (less often melts) have a number of significant advantages [7,8,11]. The direct methods of resolution of the racemic APIs themselves or their racemic synthetic precursors have been used for quite some time [12]. In the early stages, this approach was applied mainly on an empirical basis. Recently, there has been a steady trend towards turning it into modern technology. This is expressed in the mathematization of the description of the process itself [13,14,15], in the increasingly sophisticated use of the phase diagram technique [16,17], in the designing of specific reactors for implementing one or another modification of the deracemization process [18,19], finally, in enlarging one-time downloads of racemic raw materials [20]. But with all the modern improvements, an indispensable condition for the implementation of a particular type of direct resolution is the crystallization of the racemic starting material in the form of a conglomerate (i.e., a mixture of enantiopure crystals). Additionally, the search for new conglomerates, in particular, structurally related to bioactive substances, still does not lend itself to strict forecasts.
Expectorant guaifenesin, 3-(2-methoxyphenoxy) propane-1,2-diol, the object of deracemization in [20], as well as in our earlier work [21], refers to chiral glycerol aromatic ethers ArOCH2CH(OH)CH2OH. This series is notable, on the one hand, in that among its representatives there are registered APIs (for example, guaifenesin, mephenesin, chlorphenesin [22]), as well as drug precursors with different activities [12,23,24,25]. On the other hand, in this series the phenomenon of spontaneous resolution of enantiomers during crystallization is much more common than average [26]. Thus, among the 2,6-, 2,3- and 3,5-dimethylphenyl ethers of glycerol, which serve as the precursors of APIs mexiletine [27], xibenolol [28,29], and metaxalone [30] (Scheme 1), the first two diols crystallize as conglomerates and were obtained by us in an enantiopure form by preferential crystallization.
The object of this study is another dimethylphenyl glycerol ether, 3-(3,4-dimethylphenoxy) propane-1,2-diol 1, which we used in the synthesis of amino alcohols 2 and 3 (Scheme 2) [31]. Aminopropanol 2 hydrochloride coded as T0502-1048 was reported as a promising β2-adrenoceptor antagonist [32]. Furthermore, there are patent data according to which stereoisomers of 1-(3,4-dimethylphenoxy)-3-(morpholin-4-yl) propan-2-ol 3 show useful activities (but different for the racemate and individual enantiomers) in the treatment of neurodegenerative and neuromuscular disorders, as well as of Friedreich’s ataxia [33].
Previously we have obtained diol 1 by Sharpless asymmetric dihydroxylation of 3,4-dimethylphenyl allyl ether [31]. We have noticed that the melting point of diol (R)-1 (96–98 °C) was noticeably higher than that of rac-1 (75–77 °C). This situation is characteristic of organic compounds prone to spontaneous resolution. For this reason, we decided to study the possibility of direct resolution of its racemate and find out the features of phase behavior for this substance.

2. Materials and Methods

2.1. Instrumentation

The IR spectra of the polycrystalline samples of rac- and (R)-diols 1 under investigations in KBr pellets were recorded on a Bruker Tensor 27 spectrometer (Bruker Optic GmbH, Cermany). Optical rotations were measured on a Perkin–Elmer model 341 polarimeter (PerkinElmer, USA). The melting curves were measured on a NETZSCH 204 F1 Phoenix DSC differential scanning calorimeter (NETZSCH-Gerätebau GmbH, Germany) in sealing aluminum pans with the rate of heating of 5 °C∙min−1. The mass of the samples amounted to approximately ~ 1 mg in determining the enthalpies and temperatures of the phase transitions and ~ 7 mg when measuring the specific heats of the samples and was controlled with Sartorius CPA 2P balance (Sartorius AG, Goettingen, Germany). The heat capacity was measured by a continuous method, subtracting the previously measured heat capacity of the empty cell. Temperature scale and heat flux were calibrated against the data for indium and naphthalene. When measuring the heat capacities, the heat capacity of the corundum sample was used for calibration. HPLC analyses were performed on a Shimadzu LC-20AD system controller (SHIMADZU CORPORATION, Kyoto, Japan), UV monitor 275 nm was used as detector. The column used, from Daicel Inc., was Chiralcel OD (Daicel Chemical Industries, LTD - Chiral Technologies Inc., West Chester, PA, USA), (0.46 × 25 cm); eluent—hexane/2-propanol (7:3), flow rate—1 mL∙min−1, column temperature—22 °C.

2.2. Starting Materials

Racemic 3-chloropropane-1,2-diol and 3,4-dimethylhenol (Acros Organics) as well as (R)- and (S)-3-chloropropane-1,2-diol (Alfa Aesar) were commercially available.

2.3. Synthesis and Samples Preparation

Racemic and enantiopure 3-(3,4-dimethylphenoxy)propane-1,2-diols, rac-1 and (R)- or (S)-1, used as seed, were prepared from rac- and (R)- or (S)-3-chloropropane-1,2-diol by analogy with published procedure [21]. The crude diols were purified by recrystallization from hexane/EtOAc (3:1). Yield 67%–69%. Characteristics of the obtained diols are shown below:
  • rac-3-(3,4-Dimethylphenoxy)propane-1,2-diol, rac-1: mp 75–78 °C. (Lit. [31] mp 75–77 °C).
  • (R)-3-(3,4-Dimethylphenoxy)propane-1,2-diol, (R)-1: mp 96–98 °C, [α]D20 –7.7 (c 1.0, EtOH), 99.9% ee (chiral HPLC analysis, tR 7.7 min). [Lit. [31] mp 96–98 °C, [α]D20 –7.7 (c 1.0, EtOH), 99.7% ee].
  • (S)-3-(3,4-Dimethylphenoxy)propane-1,2-diol, (S)-1: mp 96–97 °C, [α]D20 +7.3 (c 1.0, EtOH), 99.2% ee (chiral HPLC analysis, tR 10.7 min). [Lit. [31] mp 96–97.5 °C, [α]D20 +6.7 (c 1.0, EtOH), 99.5% ee].

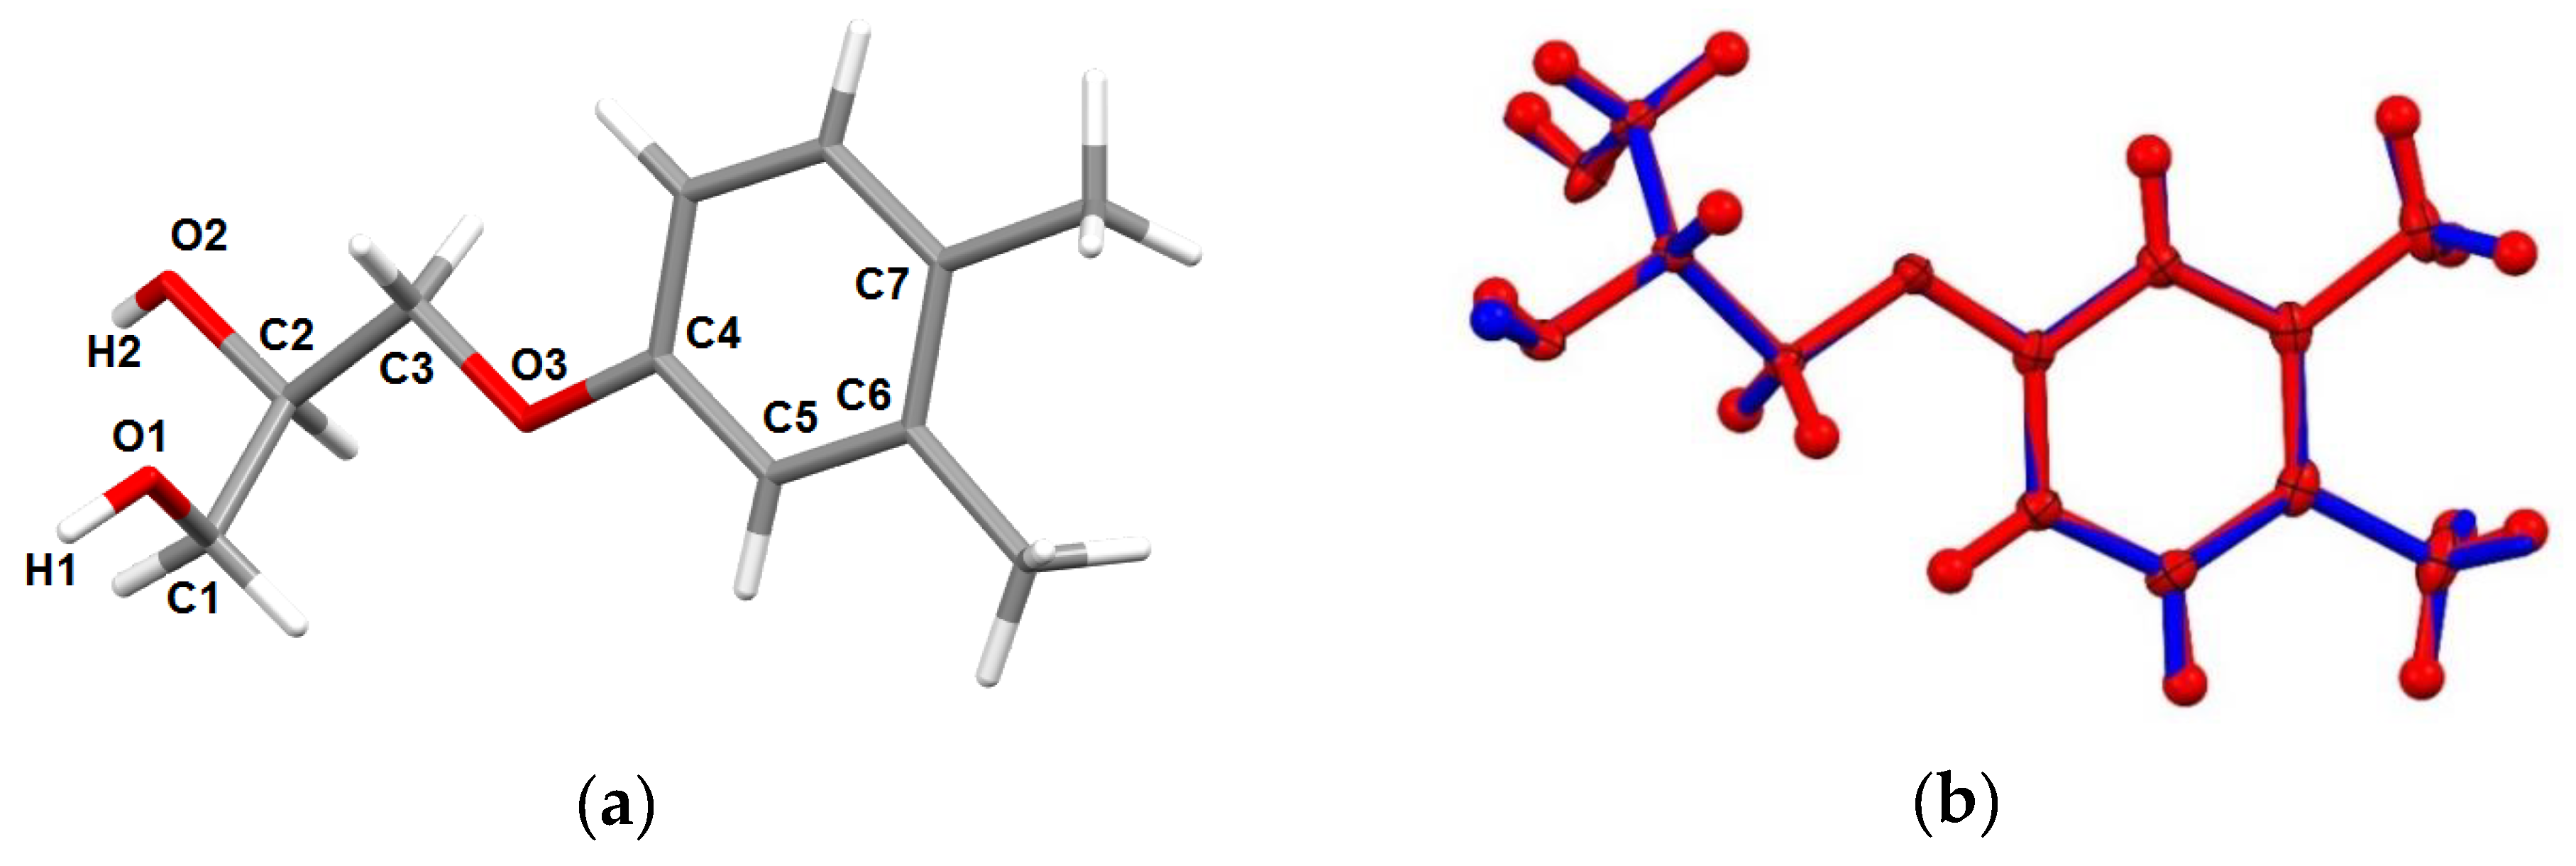
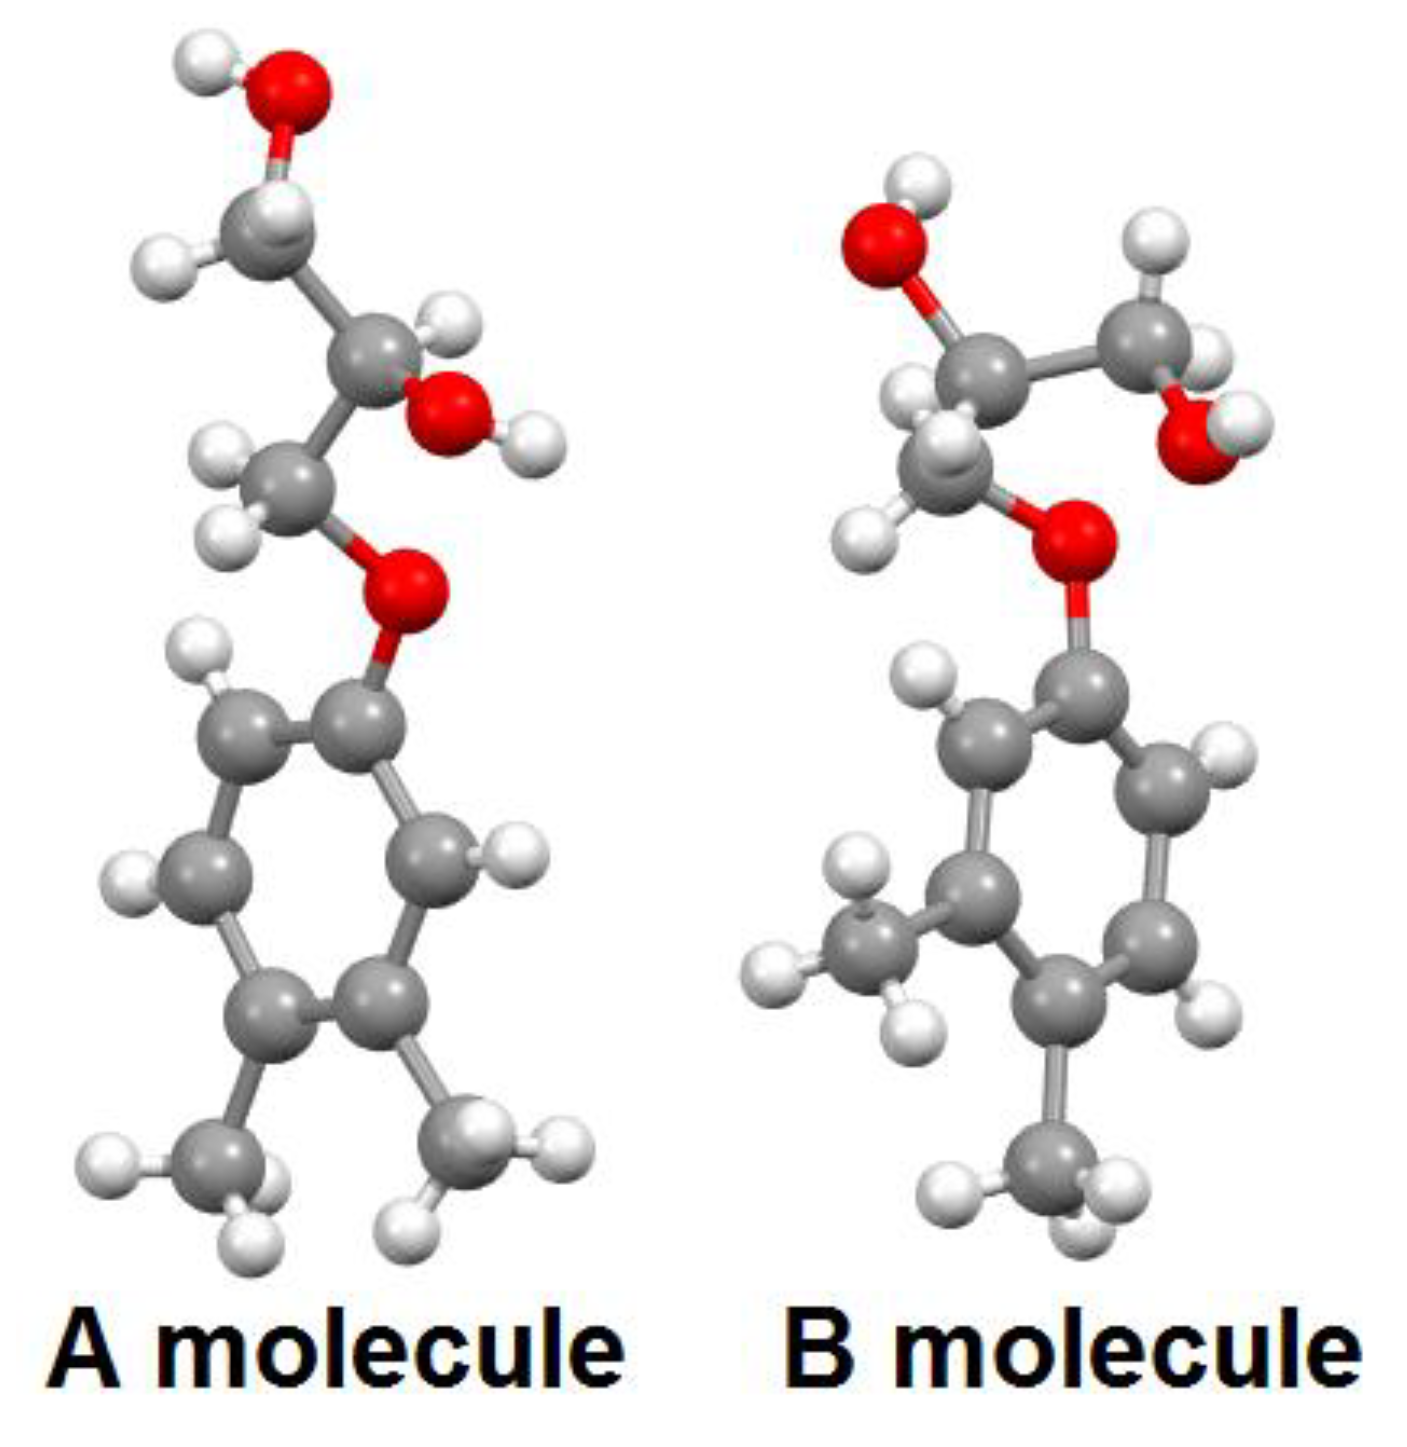
2.4. Single Crystal X-ray Analysis

The crystals of (R)-1 for single crystal X-ray diffraction (SC-XRD) analysis were prepared by slow evaporation of the saturated solution of the corresponding sample in mixture of ethyl acetate/hexane. The single crystal of α-rac-1 form was randomly selected from a racemic polycrystalline sample prepared by rapid crystallization of a saturated solution in the same solvent.
The X-ray diffraction data for these crystals were collected on a Bruker Smart Apex II CCD diffractometer (Bruker AXS GmbH, Karlsruhe, Germany) in the ω-scan and φ-scan modes using graphite monochromated Mo Kα (λ 0.71073 Å) radiation at 296(2) K. The crystal data, data collection, and the refinement parameters are given in Table 1.
Data were corrected for the absorption effect using SADABS program [34]. The structures were solved by direct method and refined by the full matrix least-squares using SHELX [35] and WinGX [36] programs. All non-hydrogen atoms were refined anisotropically. All hydrogen atoms in (R)-1 were located from difference maps and refined isotropically. In α-rac-1 hydrogen atoms were inserted at calculated positions and refined as riding atoms except the hydrogens of OH groups which were located from difference maps and refined isotropically. All figures were made using Mercury program [37]. Molecular structures and conformations were analyzed by PLATON [38].
Crystallographic data for the structure of (R)-1 and α-rac-1 reported in this paper were deposited with the Cambridge Crystallographic Data Centre as supplementary publication numbers CCDC 1984093 and 1985618, respectively. Copies of the data can be obtained, free of charge, on application to CCDC, 12 Union Road, Cambridge CB2 1EZ, UK, (fax: +44-(0)1223-336033 or e-mail: [email protected]).

2.5. Powder X-ray Diffraction Investigations

Powder X-ray diffraction (PXRD) data were collected on a Bruker D8 Advance X-ray diffractometer (Bruker AXS GmbH, Karlsruhe, Germany) equipped with a Vario attachment and Vantec linear PSD, using Cu radiation (40 kV, 40 mA) monochromated by a curved Johansson monochromator (λ Cu Kα1 1.5406 Å). Room-temperature data were collected in the reflection mode with a flat-plate sample. Samples were applied on the surface of a standard zero diffraction silicon plate. The samples were kept spinning (15 rpm) throughout the data collection. Patterns were recorded in the 2θ range between 3° and 90°, in 0.008° steps, with a step time of 0.1–4.0 s. Several diffraction patterns in various experimental modes were collected for the samples. Processing of the data obtained was performed using EVA [39], indexing of powder data and crystal structure solving of β-rac-1 were carried out with TOPAS [40], and EXPO2014 [41] software packages.

3. Results and Discussion

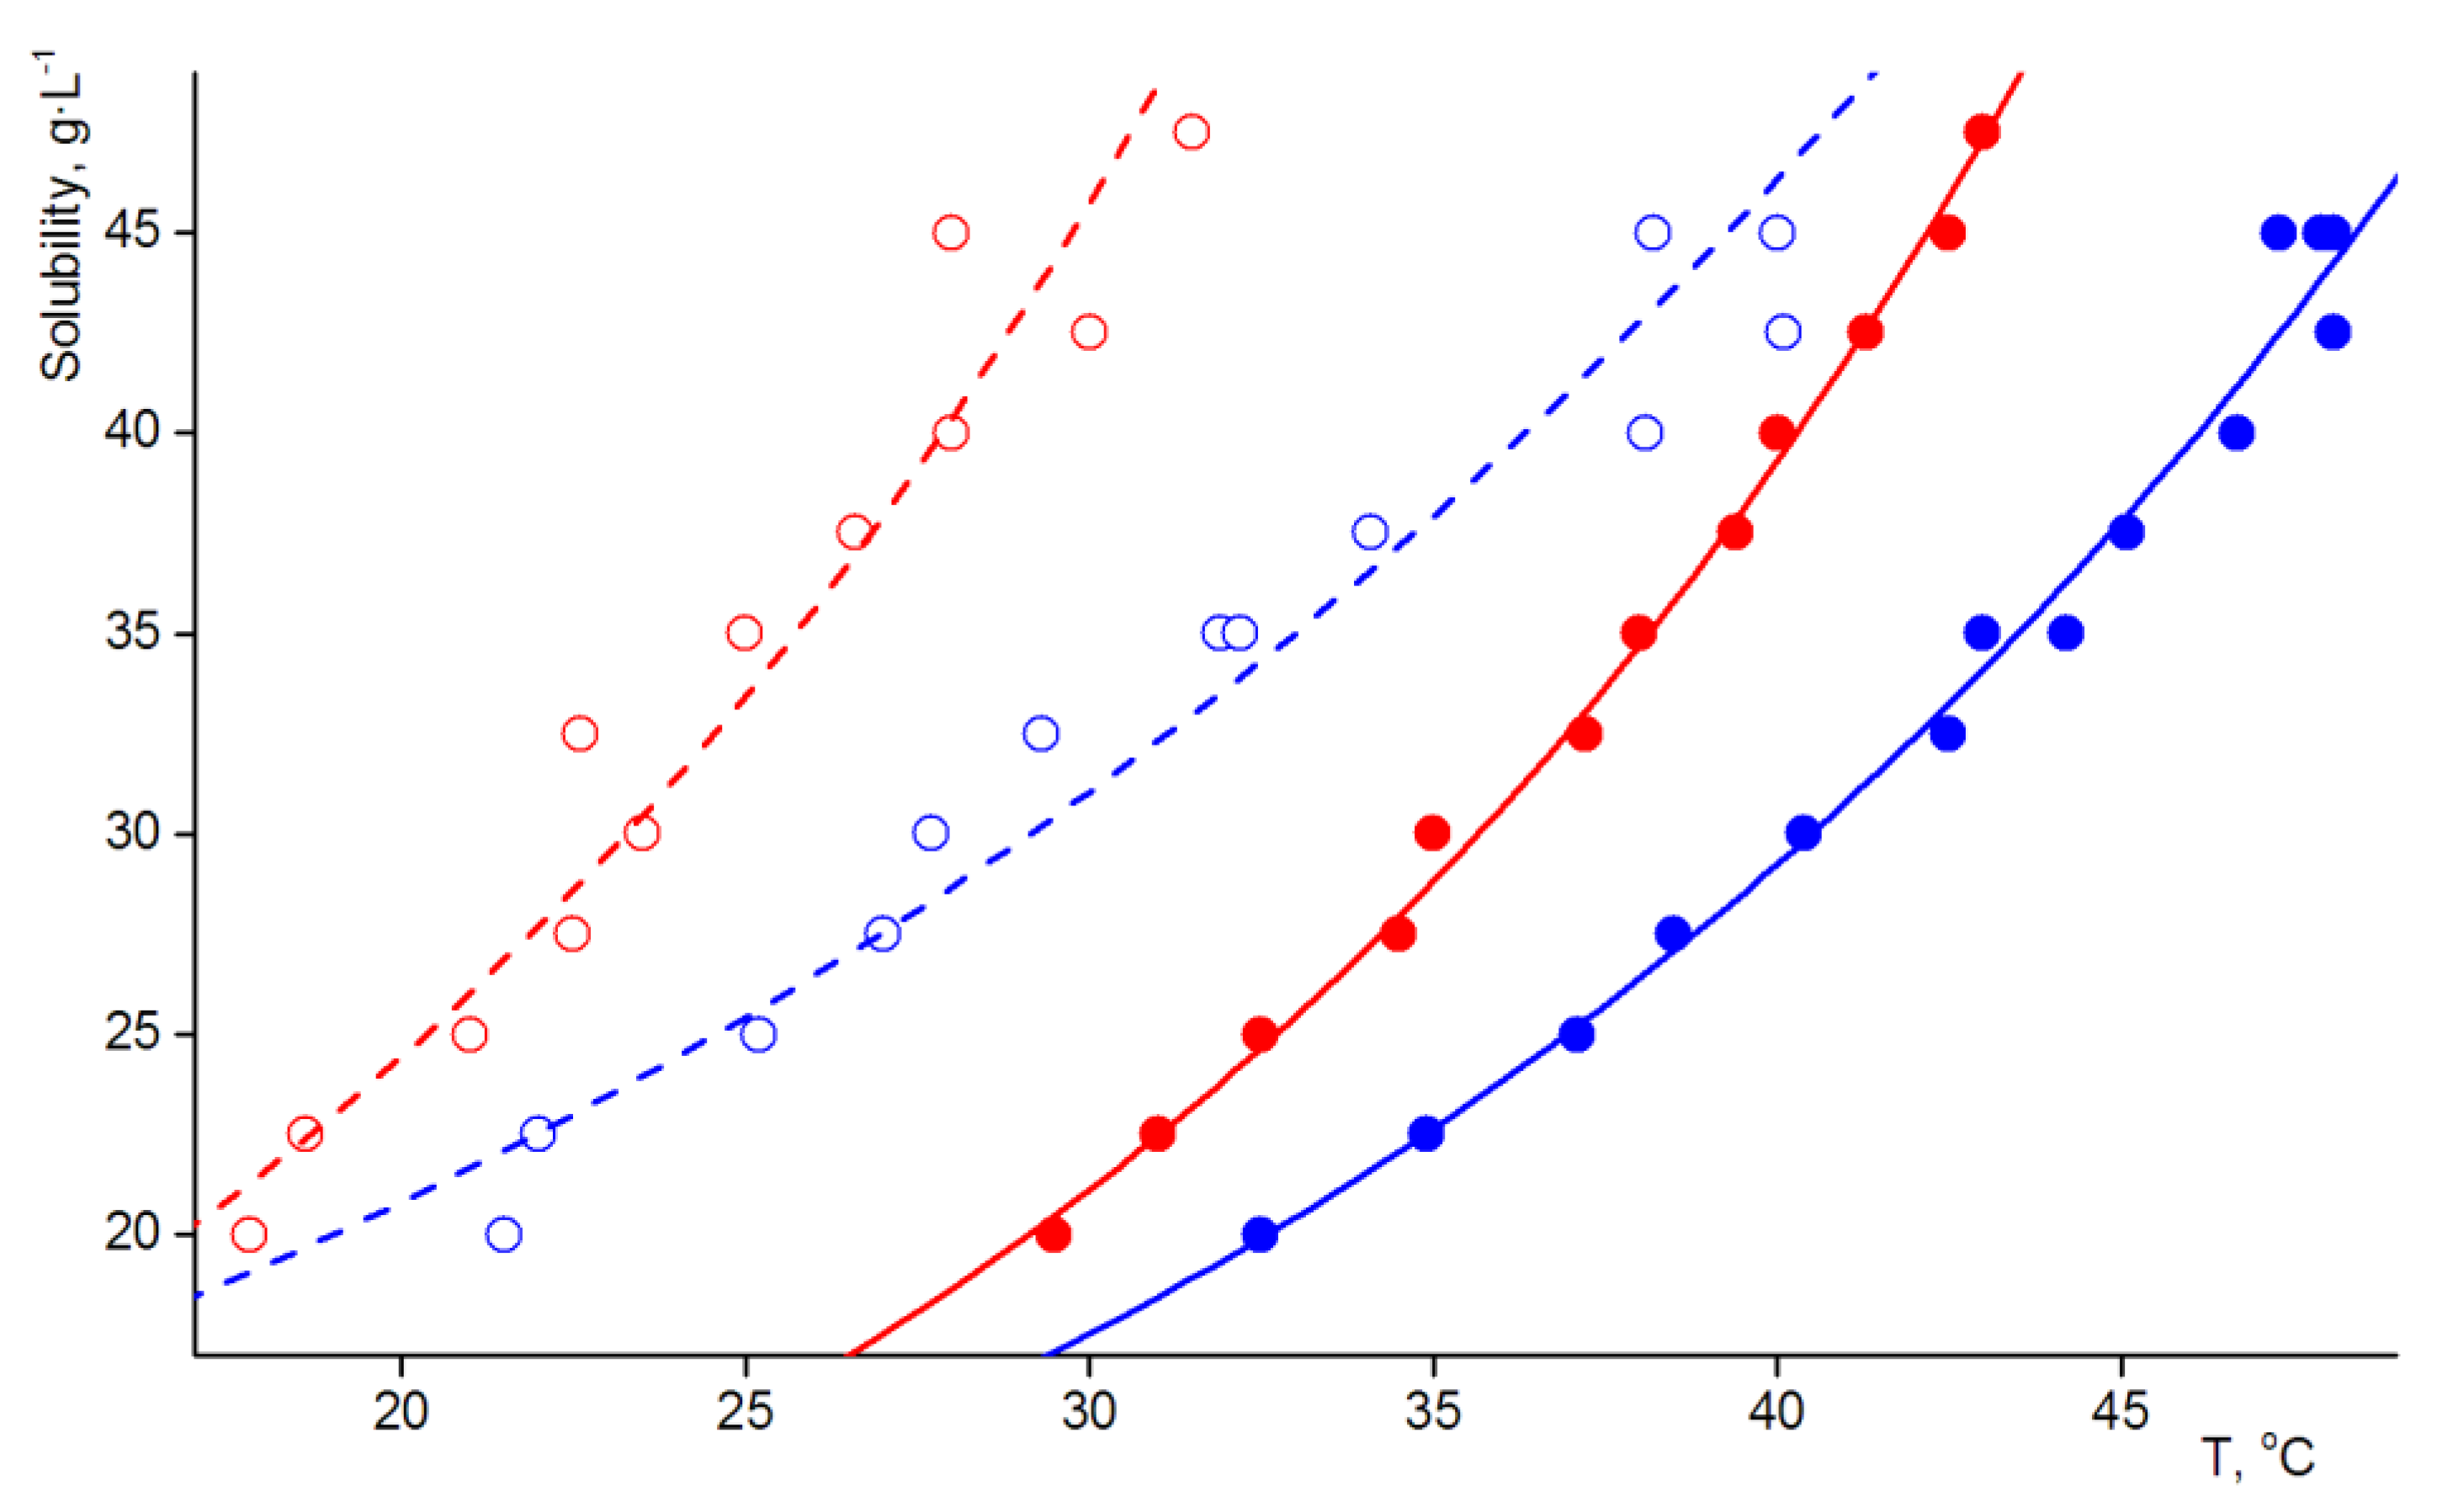
3.1. Solubility Test and Preliminary Entrainment Experiment

The tests showed that at room temperature rac-1 has fairly good solubility in ethyl acetate, chloroform, acetonitrile and poor solubility in water and hexane. Diol rac-1 is moderately soluble in CCl4, toluene and methyl tert-butyl ether (MTBE). Carbon tetrachloride turned out to be inconvenient for further experiments, since during the crystallization process, the formed crystals float to the surface of the solution and hardly form a distributed suspension. When cooling heated saturated solutions of diol 1 in toluene, an emulsion instead of suspension is initially obtained, which crystallizes only after a lapse of time. Of these three solvents, the reverse to the dissolution process, that is, effective spontaneous crystallization, runs smoothly only in MTBE. Therefore, a more detailed study of the dissolution and crystallization of both racemic and enantiopure 1 was carried out in this solvent.
Figure 1 shows the temperature dependence of the solubility of diol 1 stereoisomers in this solvent. The solid red circles identify the end of dissolution, and the red hollow circles—the starting points of crystallization for the racemic samples. Similarly, the behavior of enantiopure diol in the “dissolution–crystallization” cycle is characterized in blue. Concentration values for racemate are given per individual stereoisomer (i.e., the real values of racemate concentration are halved).
From the data obtained, it follows that the width of metastable zone for both rac-1 and (S)-1 varies slightly in the studied temperature range and amounts to 15 ± 2 °C. The chart analysis shows, that the experimental points, corresponding to the process of dissolution of enantiopure and racemic samples, do not lie on the common curve, and with increasing temperature the difference in solubility increases. This means that, for the system under study, Meyerhoffer’s rule, according to which the racemate solubility twice as high the solubility of single enantiomer [42,43], is not performed. In turn, this means that the dissolution process for diol 1 is complicated by some, for the moment, unobvious effects. Meyerhoffer’s coefficient high values are associated with a decrease of the metastable zone width and, consequently, with reduced spontaneous resolution efficiency [7]. Since in our case the width of the metastable zone is not very dependent on temperature, in the test experiment we carried out the crystallization stage during racemic diol 1 resolution by entrainment process at room temperature. The initial concentration of the individual stereoisomers was about 25 g·L−1, and the enantiomeric composition of the mother liquor was monitored by HPLC. The results for four cycles (eight runs) of resolution are shown in Table 2.
The results presented in the Table 2 allow us to state with certainty that spontaneous resolution during crystallization of rac-1 does occur. At the same time, the realized procedure cannot be considered as a satisfactory one. The individual runs are, firstly, too long, and secondly, irreproducible. The latter applies to the enantiomeric composition of the crystalline crop as well. All this, together with the non-compliance of Meyerhoffer’s rule, prompted us to study in more detail the phase behavior of diol 1.

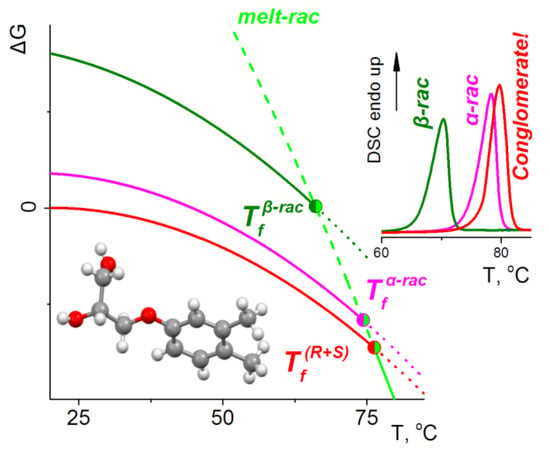
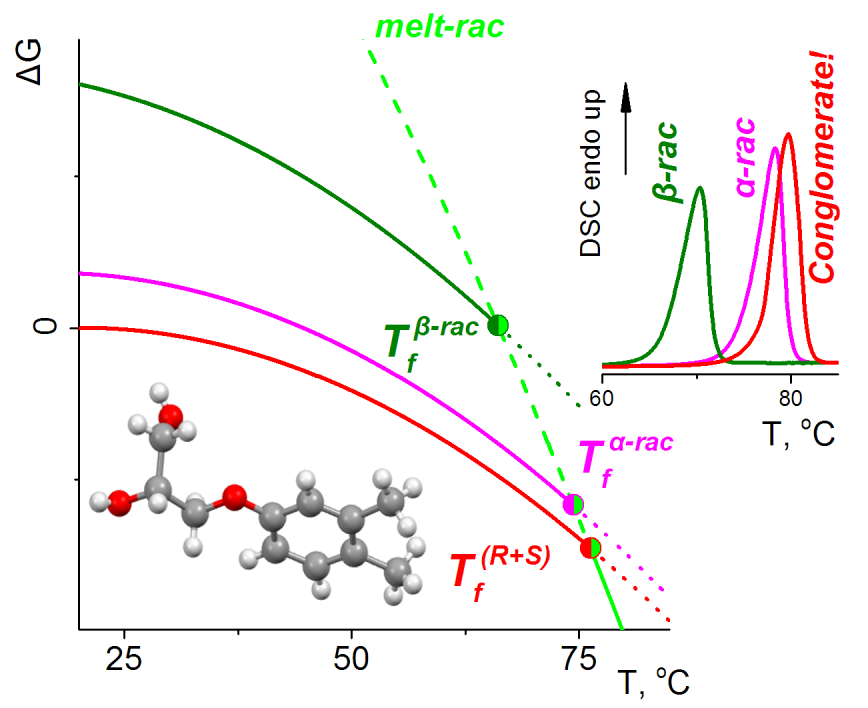
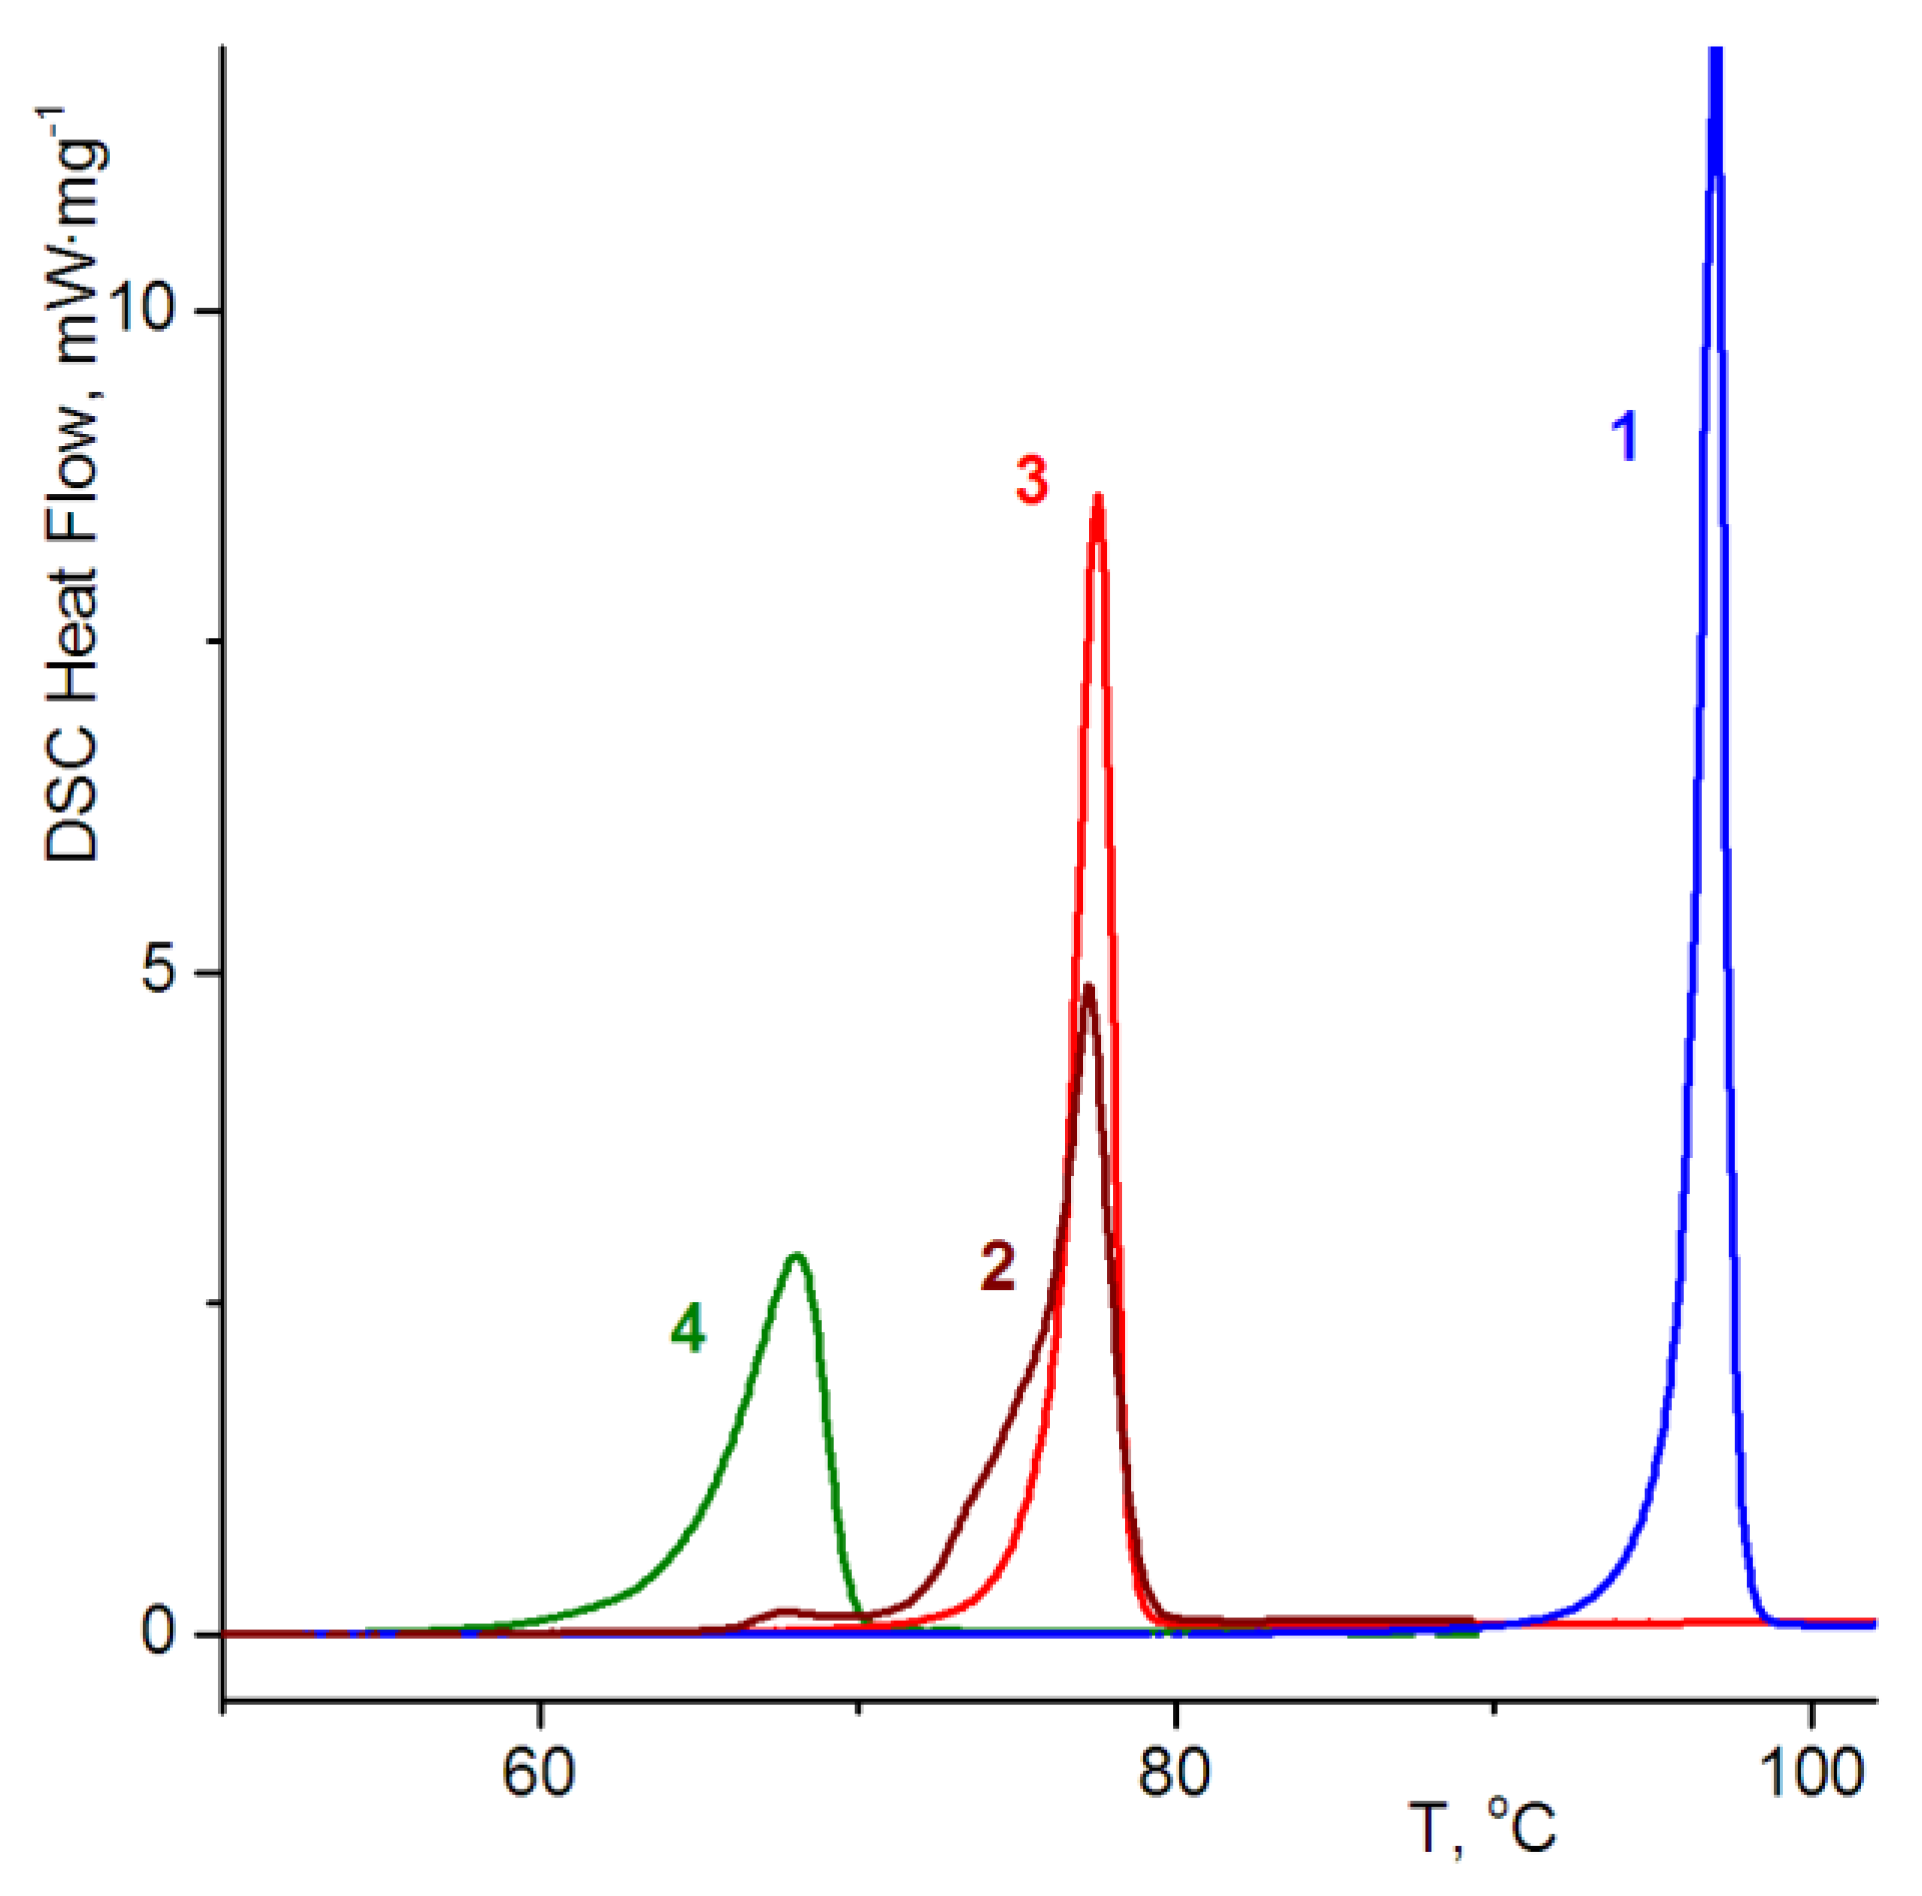
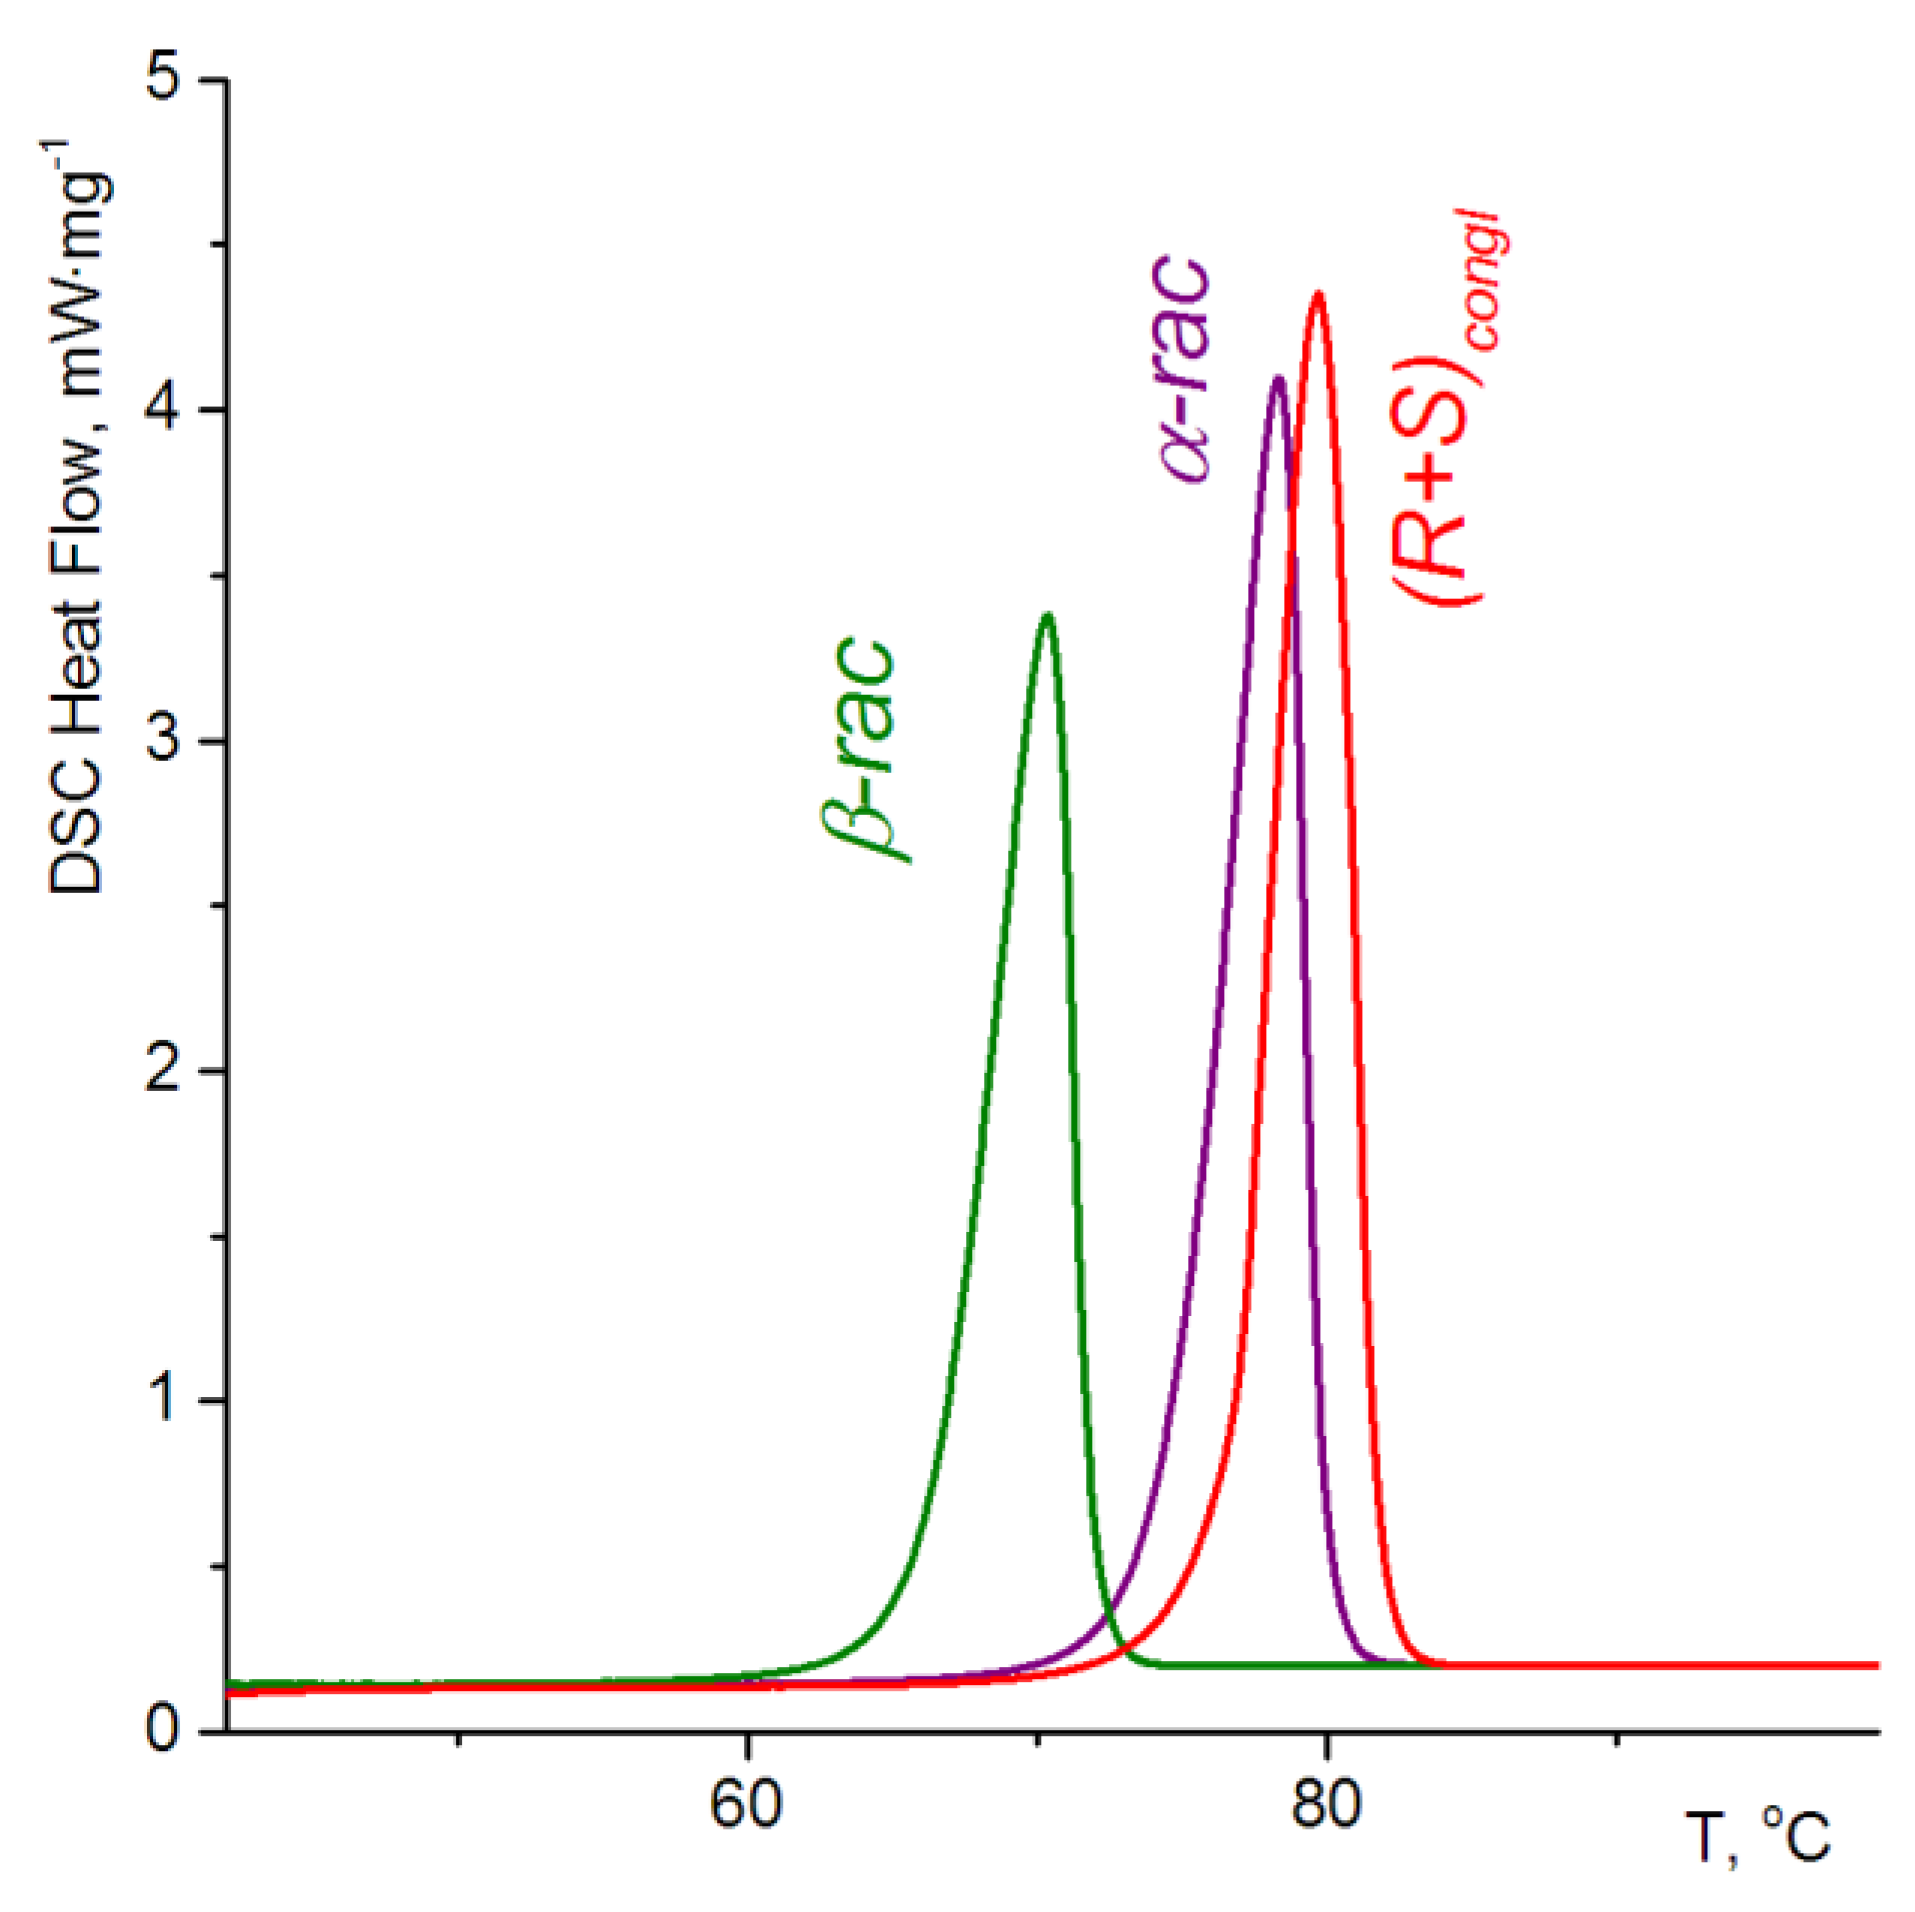
3.2. Thermochemical Investigations

Figure 2 shows differential scanning calorimetry (DSC) thermograms of enantiopure (curve 1) and racemic (curves 2-4) samples of diol 1. The thermogram of an enantiopure sample (R)-1 is represented by a single narrow peak, which indicates its phase uniformity. The thermochemical parameters for this sample are presented in Table 3. The same parameters for the sample (R)-1 obtained by crystallization from the melt practically do not differ from those for the sample crystallized from solution.
On the contrary, a thermogram of a freshly-prepared chemically-pure racemate obtained by crystallization from a hexane/ethyl acetate mixture demonstrates the complex contour of the melting process curve 2. The main peak, located in the temperature range of ~ 75 °C, has a leading edge with a pronounced kink, which is preceded by a minor endothermic peak, observed at a significantly lower temperature (~ 68 °C). This behavior is characteristic of phase-inhomogeneous systems represented by a mixture of several crystalline modifications. Intensive mixing of a suspension of such a sample in hexane for several hours at room temperature results in a thermodynamically equilibrium phase-homogeneous racemic sample, the thermogram of which is a narrow peak with a regular shape (curve 3). The demonstration of spontaneous resolution of rac-1 (Section 3.1) suggests that the main crystalline form of the racemate is a conglomerate, which we denote by the symbol (R+S). The melting point of the brought to equilibrium rac-1 sample, calculated as the intersection of the free energy curves of the crystalline enantiopure phase and melted (R+S)-1 (Figure 4) was 76.2 °C, which practically coincides with the actually observed for conglomerate (76.3 °C) (Table 3).
If a racemic sample of diol 1 of any prehistory is melted and quickly cooled to room temperature, then the supercooled melt in the range of ~10 min undergoes spontaneous crystallization. The melting of the phase thus obtained (β-rac-1) is described by a peak at ~ 66 °C (curve 4), which on the temperature scale is practically in the same region as the minor endothermic peak in curve 2, Figure 2. This suggests that the β-rac-1 phase is present in the samples, which initially precipitate from solutions, and the minor endothermic peak arises due to this.
The general appearance of melting curve 2 indicates that the phase behavior of the primary rac-1 crystals is even more complex and, in addition to the identified (R+S)-1 and β-rac-1, other crystalline modifications can be present in the system. Indeed, after the β-rac-1 phase is heated to 72 °C and held at this temperature, it melts almost completely, but then crystallizes again. The melting parameters of the resulting α-rac-1 phase (Figure 3, violet) are close, but not identical to those for the equilibrium racemic sample (Figure 3, red; Table 3).
Taken together, the thermochemical data show that for the enantiopure forms of diol 1 the only one crystalline phase is realized, and the racemate can be represented by a thermodynamically equilibrium conglomerate (R+S)-1, two polymorphs α-rac-1 and β-rac-1, as well as a mixture of these modifications. Table 3 shows the thermochemical parameters of the corresponding systems.

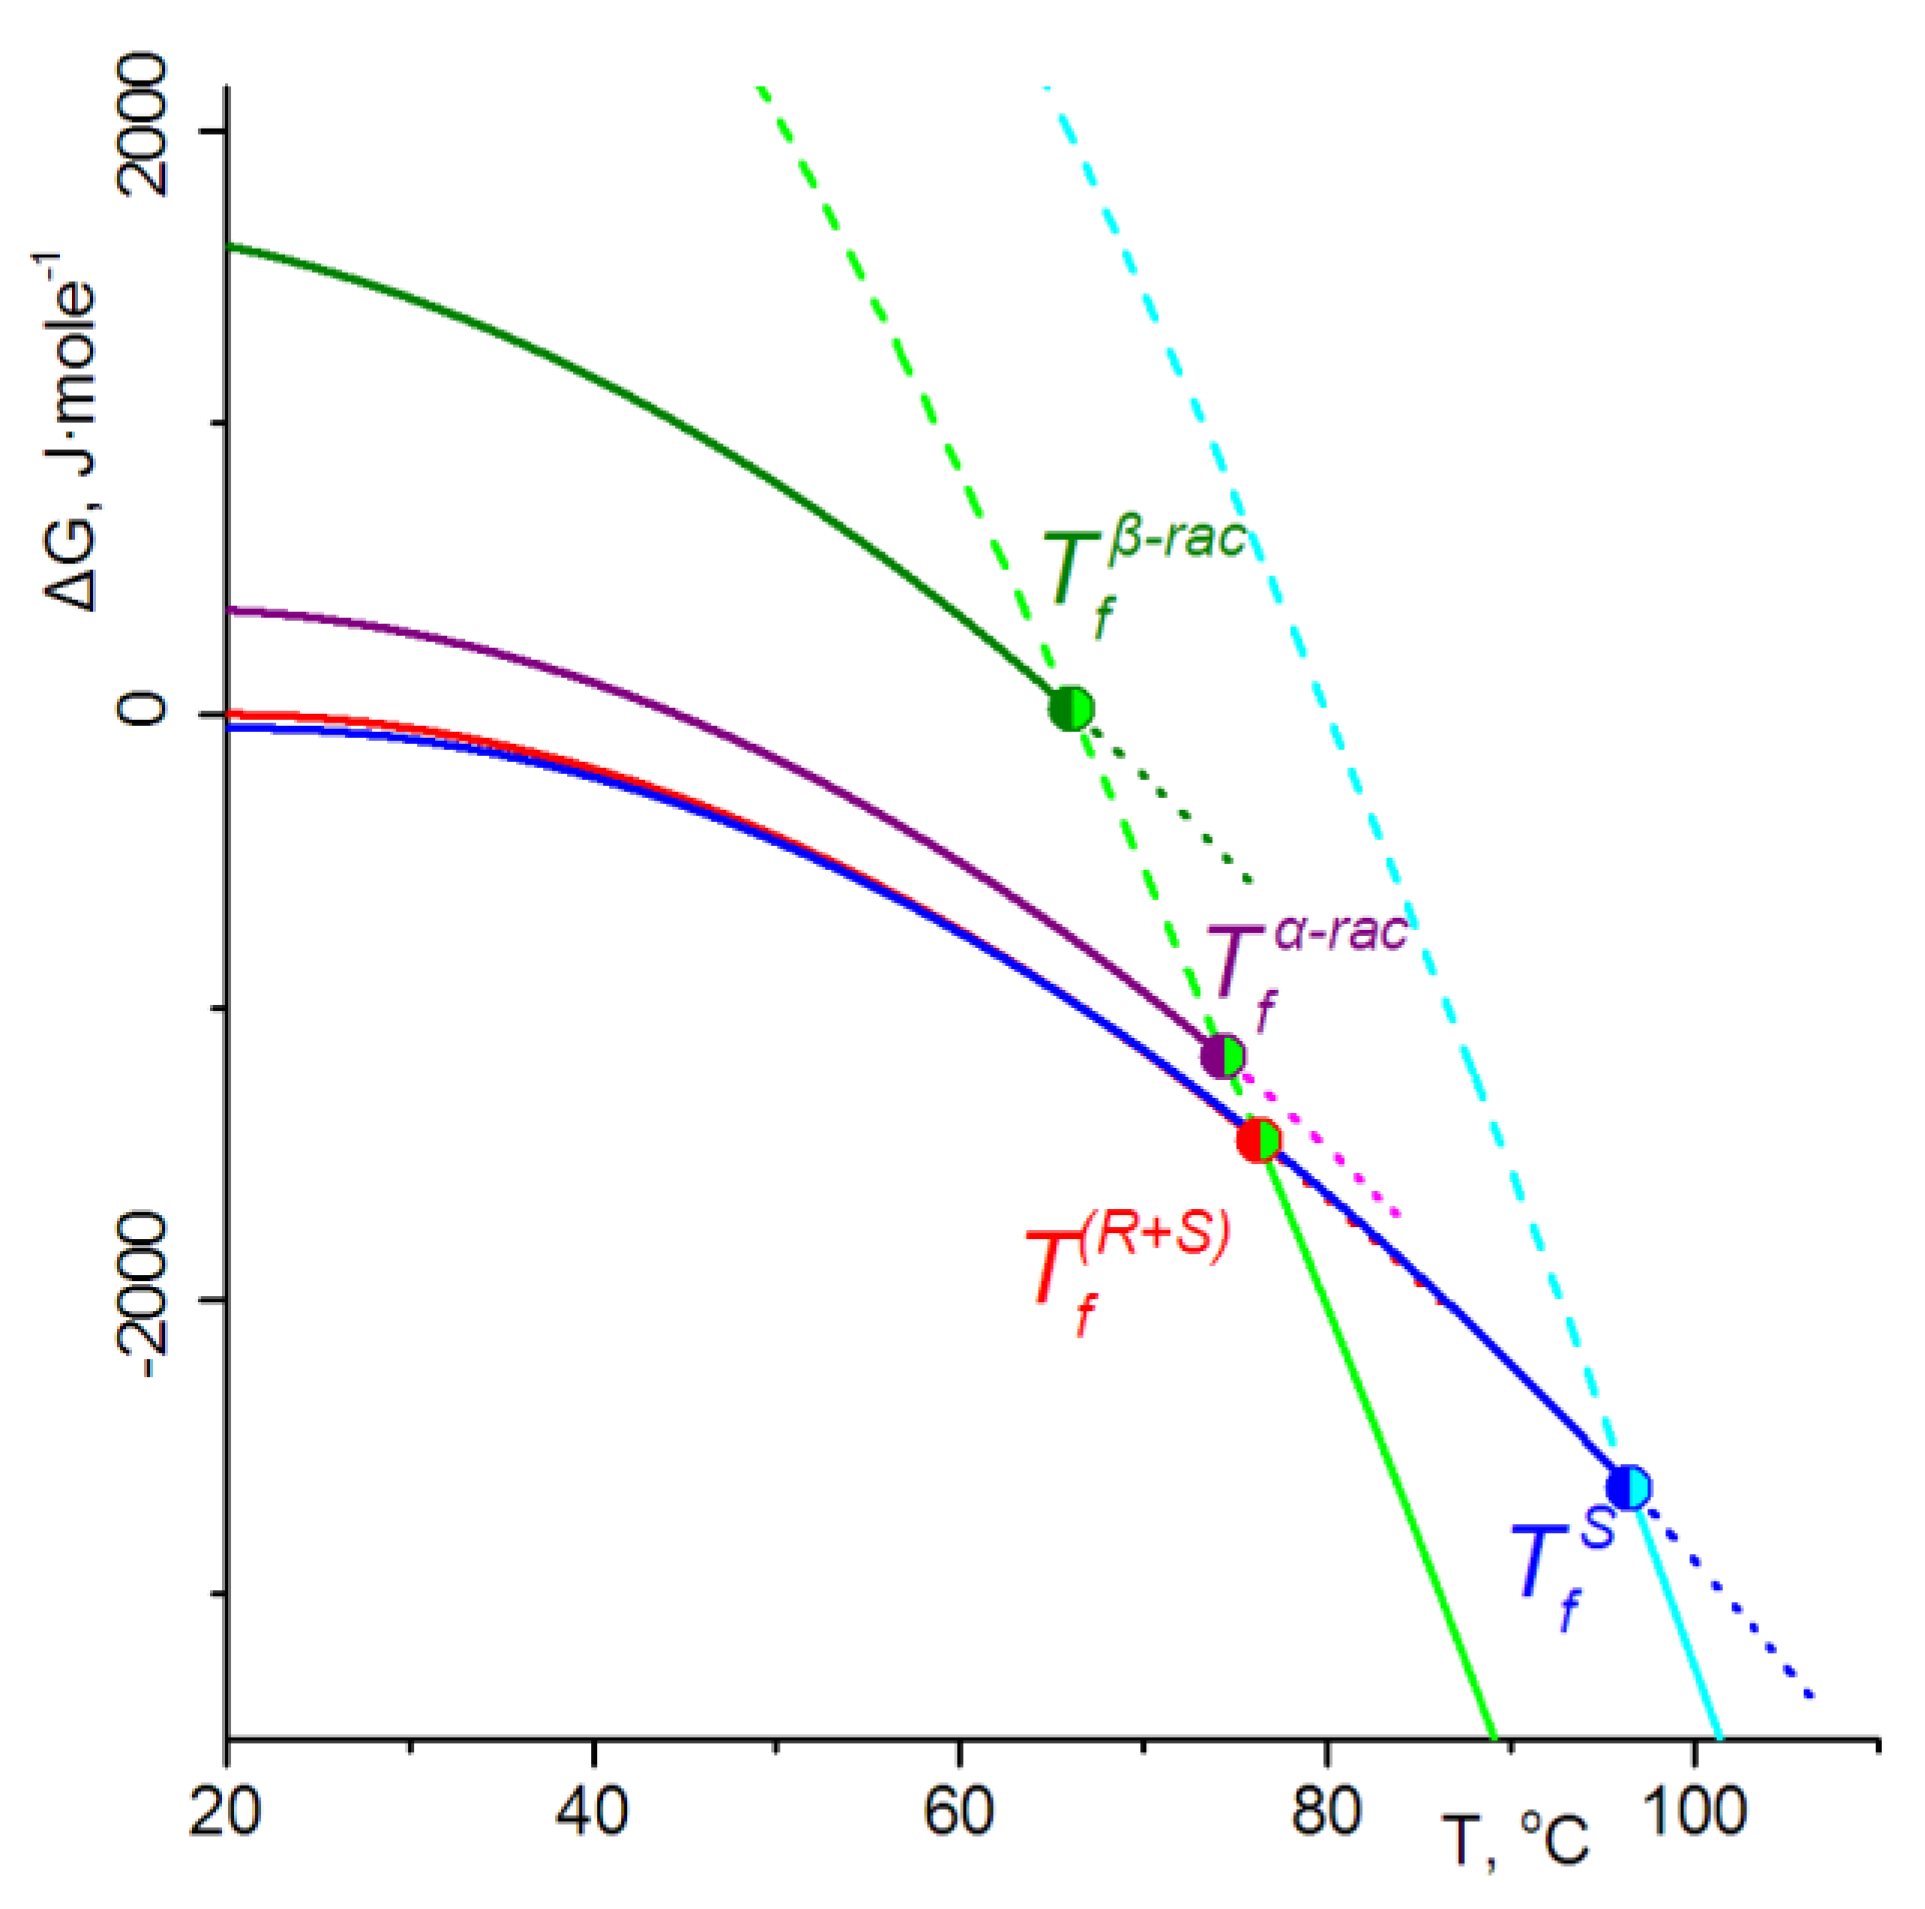
3.3. Phase Energetics

Taken on their own, the thermochemical characteristics do not say anything about the internal organization of a particular phase, but can be used to assess their thermodynamic stability. For a detailed analysis of the energy ratios between the forms realized in the system, the heat capacities of all the modifications observed in the system were measured by the DSC method in the temperature range from 20 to 110 °C. Changes in the thermodynamic parameters ΔH, ΔS and ΔG of a system with temperature can be described by Equations (1)–(3).
Δ H T 1 / T 0 = T 0 T 1 C p s o l i d ( T ) d T , T 1 < T f , T 0 T f C p s o l i d ( T ) d T + Δ H f + T f T 1 C p l q ( T ) d T , T 1 T f ,
Δ S T 1 / T 0 = T 0 T 1 C p s o l i d ( T ) T d T , T 1 < T f , T 0 T f C p s o l i d T ( T ) d T + Δ H f T f + T f T 1 C p l q ( T ) T d T , T 1 T f ,
Δ G T 1 / T 0 = Δ H T 1 / T 0 T 1 · Δ S T 1 / T 0 .
Based on these equations and the totality of the experimentally-obtained thermochemical information for diol 1, we constructed an energy diagram reflecting the relationship between the free energies of various crystalline modifications at different temperatures (Figure 4). The details of the calculations are given by us earlier [29].
It should be noted that we do not know the absolute values of the standard thermodynamic potentials of the considered forms. For this reason, the enthalpy and entropy of the enantiopure phase (R)-1 at 20 °C were taken as conventional zero in calculating the thermodynamic potentials. Accordingly, changes in the Gibbs energy were calculated by Equation (4).
Δ G x T = ( H x T H R 20 ° C ) T ( S x T S R 20 ° C ) = ( H x T T · S x T ) ( H R 20 ° C T · S R 20 ° C ) .
Thus, the Gibbs energy for each phase is calculated relative to a hypothetical system, the enthalpy and entropy of which coincides with the values of these parameters for the enantiopure phase at 20 °C. This approach leaves invariant the relative arrangement of curves and characteristic points on the graph.
The representation of the free energies of the putative racemic and enantiopure forms of the substance in a single scale is based on the fact that mixtures of enantiomers in the molten state well satisfy the conditions of the ideal solution model (zero enthalpy of mixing, constant (Rln2) entropy of mixing of enantiomers during the formation of racemic melt), which makes it possible to use the energy of the melt level as a reference point for bringing the free energies of all phases realized in the system to a common scale [44].
The complete coincidence of the thermodynamic characteristics of enantiopure crystals (R)-1 and conglomerate (racemic eutectic of the enantiomers), which finds its expression in the merger of the corresponding curves in Figure 4, means that there are no signs of solid solution formation in the (R+S)-1 form.
A useful consequence of the ranking of identified crystalline modifications of diol 1 is the ability to evaluate their relative solubility on this basis. Considering that, at least for dilute solutions, the solvation effects for α-rac-1, β-rac-1 and (R+S)-1 will be the same, their relative solubility will be determined only by differences in the free energies of crystalline modifications. The change in the free energy of the phase x upon dissolution, Δ G x / s o l n T , is described by Equation (5), in which [ c x s a t ] is the equilibrium concentration of the saturated solution (i.e., solubility) for phase x.
Δ G x / s o l n T = R T l n [ c x s a t ] .
Then the solubility ratio of the two phases x1 and x2 can be calculated on the basis of the difference of the free energies of these phases as follows:
[ c x 2 s a t ] [ c x 1 s a t ] = exp ( Δ G x 2 T Δ G x 1 T ) RT .
For α-rac-1 and (R+S)-1 forms, the difference calculated from the Gibbs free energies under standard conditions is Δ Δ G α / ( R + S ) 0 0.36   k J · m o l e 1 . Then the ratio of their solubilities calculated by Equation (6) will be [ C α ] [ C ( R + S ) ] 1.16 . For β-rac-1 and (R+S)-1 the calculated values of the corresponding quantities are Δ Δ G β / ( R + S ) 0 1.6   k J · m o l e 1 and [ C β ] [ C ( R + S ) ] 1.9 .

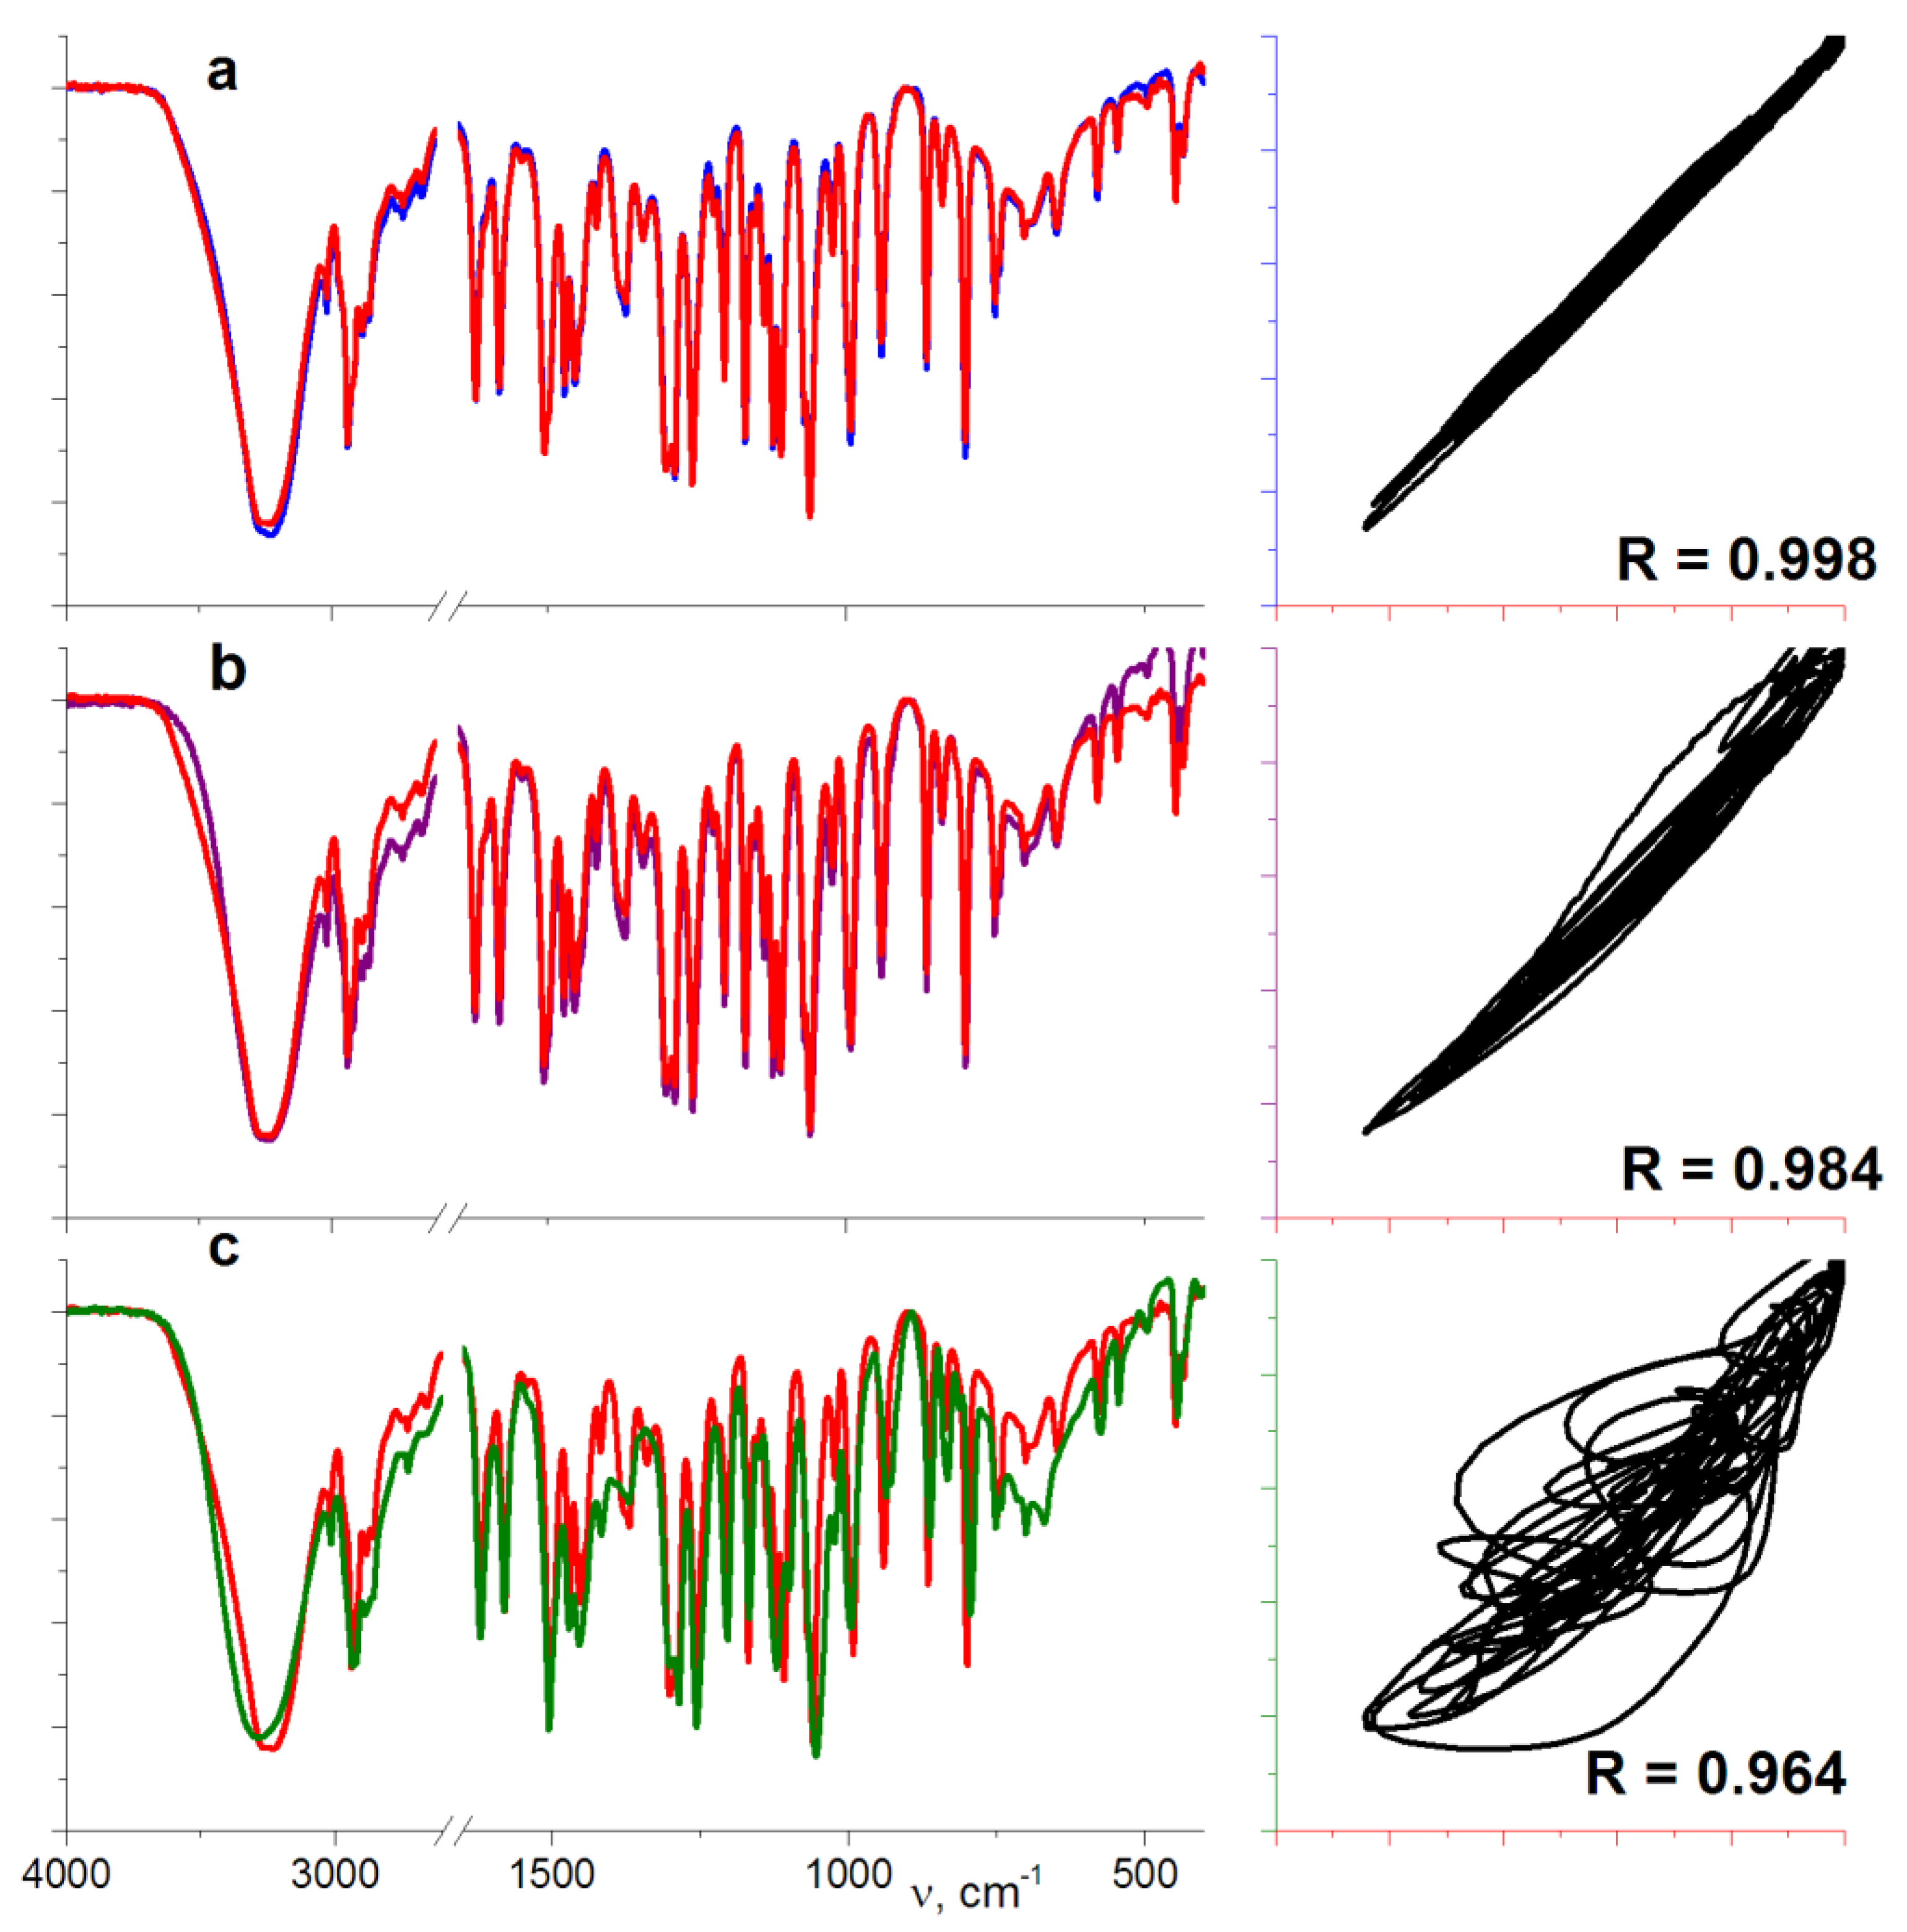
3.4. IR Investigations of All the Detected Phases

Differences in the vibrational spectra of crystalline modifications formed by identical (accurate to configuration) molecules, primarily, although not always explicitly, reflect differences in the internal organization of crystals. Some time ago, we proposed a quantitative and at the same time graphic way of pairwise comparison of such spectra [45,46]. In this case, the correlation coefficient between the spectral curves acts as a quantitative measure of the coincidence of the spectra, and the correlation trajectory, which degenerates into a straight line oriented along the main diagonal of the graph when the spectra are completely identical, serves the purposes of visibility. In Figure 5, the spectrum of the pure racemic conglomerate (R+S)-1 is alternately compared with the spectra of pure samples (R)-1, α-rac-1 and β-rac-1.
It can be seen from the figure that the internal organization of the conglomerate crystals and the enantiopure sample practically coincide, and the forms (R+S)-1 and α-rac-1 are structurally close. At the same time, both the correlation coefficient R and the appearance of the correlation diagram (the right fragment of the figure) indicate significant differences in the crystalline organization between these modifications and the metastable racemic phase β-rac-1. The information on similarities and differences revealed in this way is in complete agreement with the above data on the energy of crystalline modifications of diol 1 and with the results of XRD studies below.

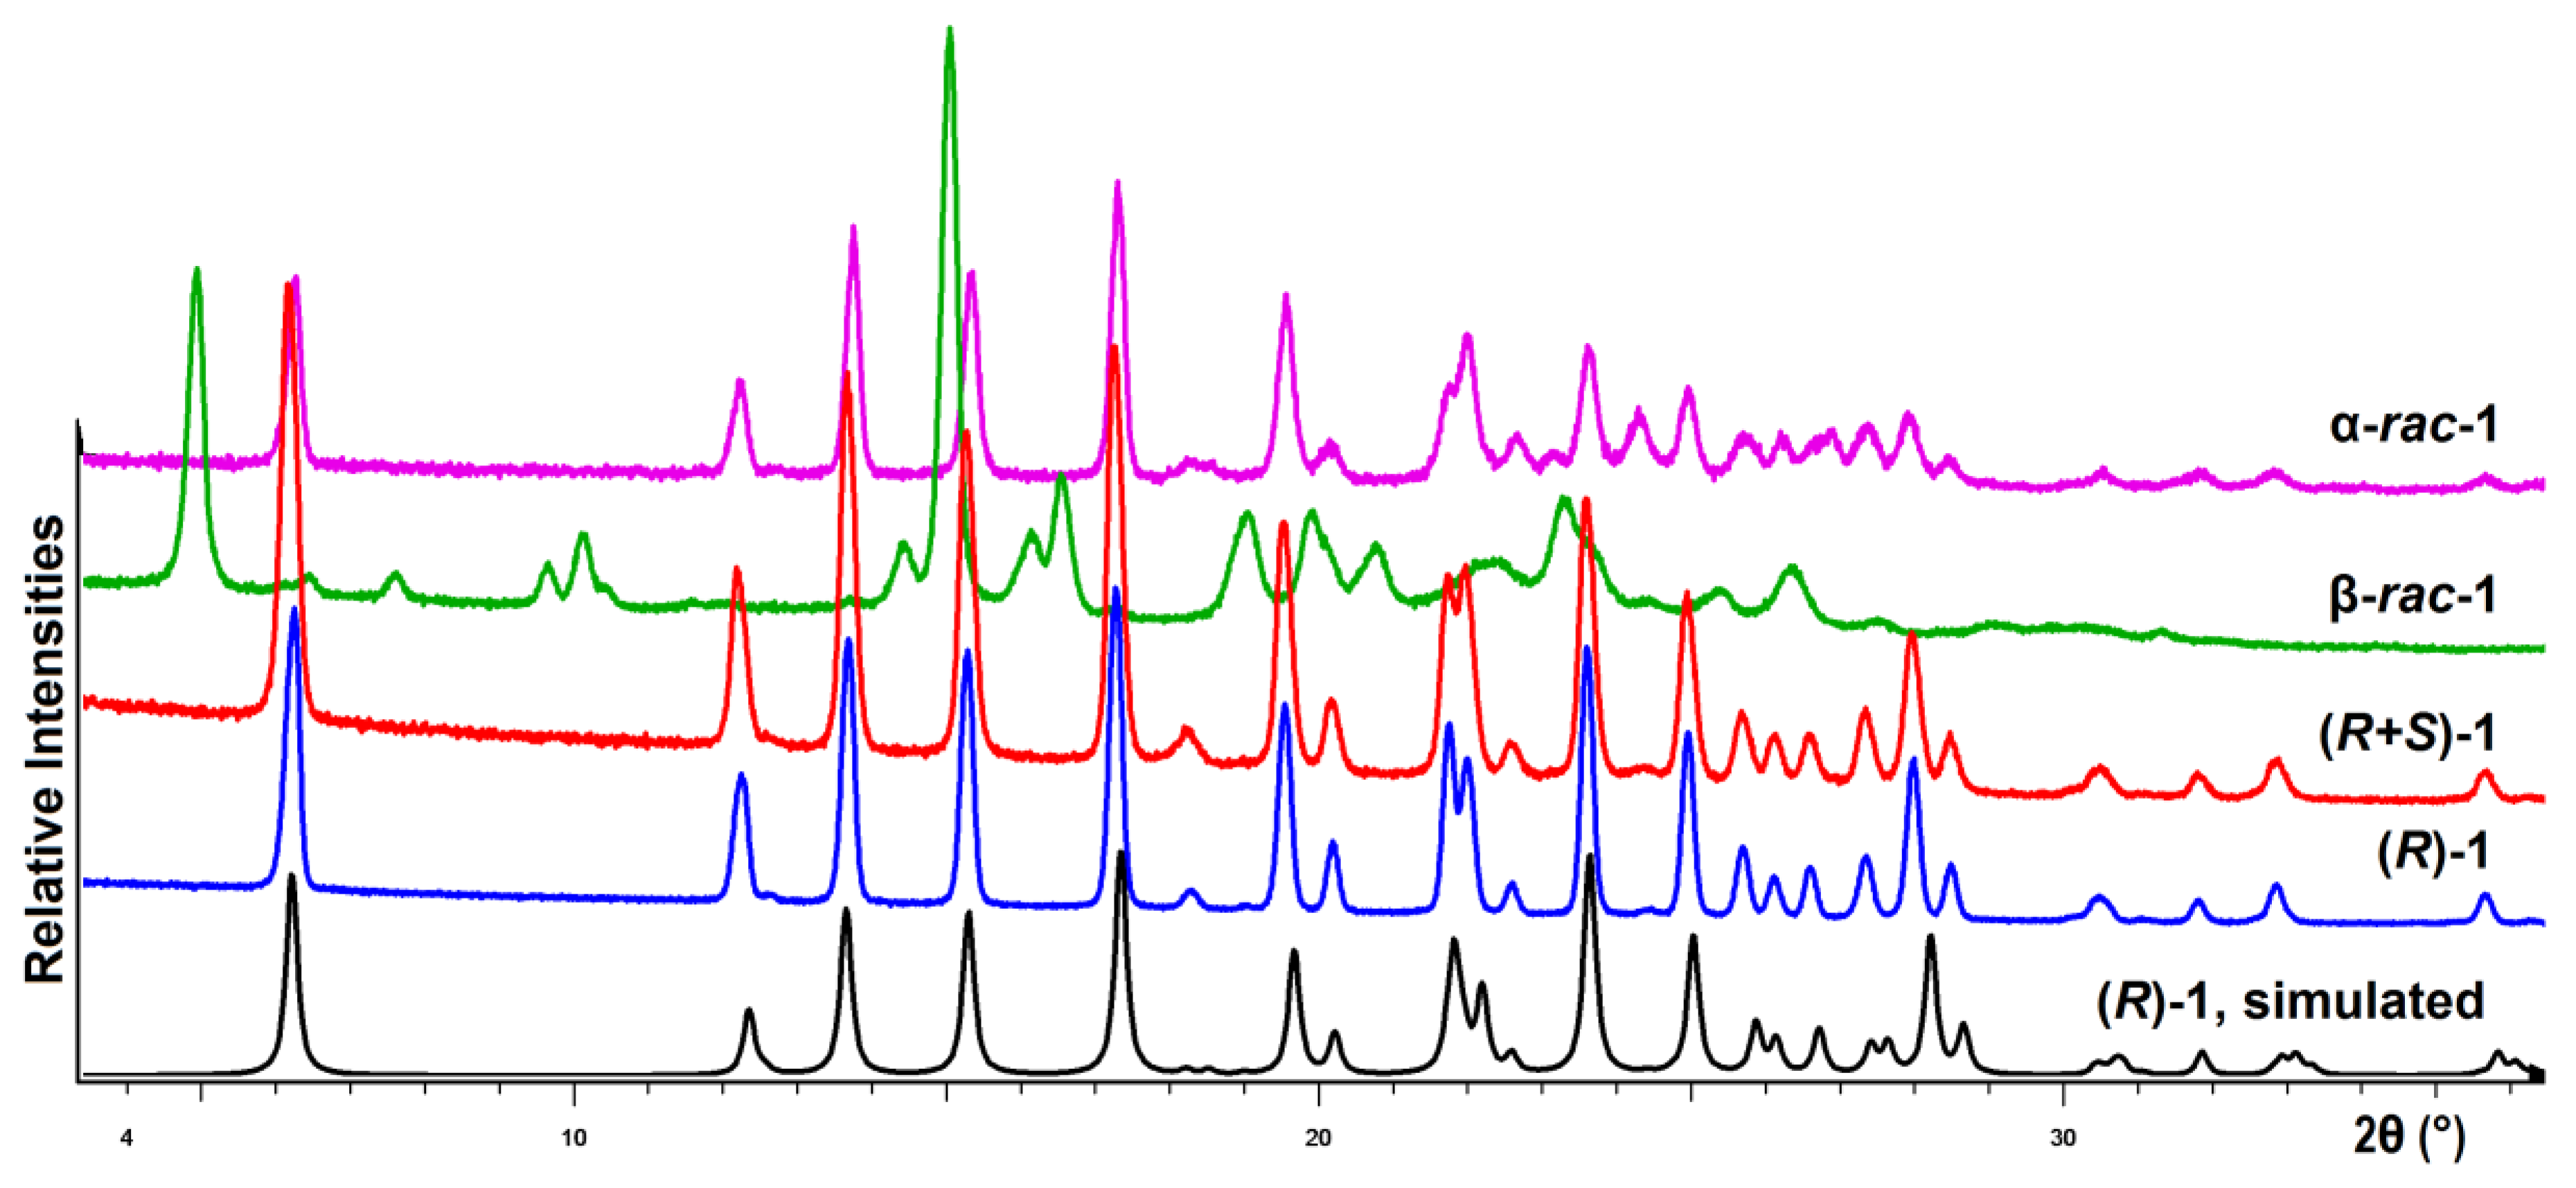
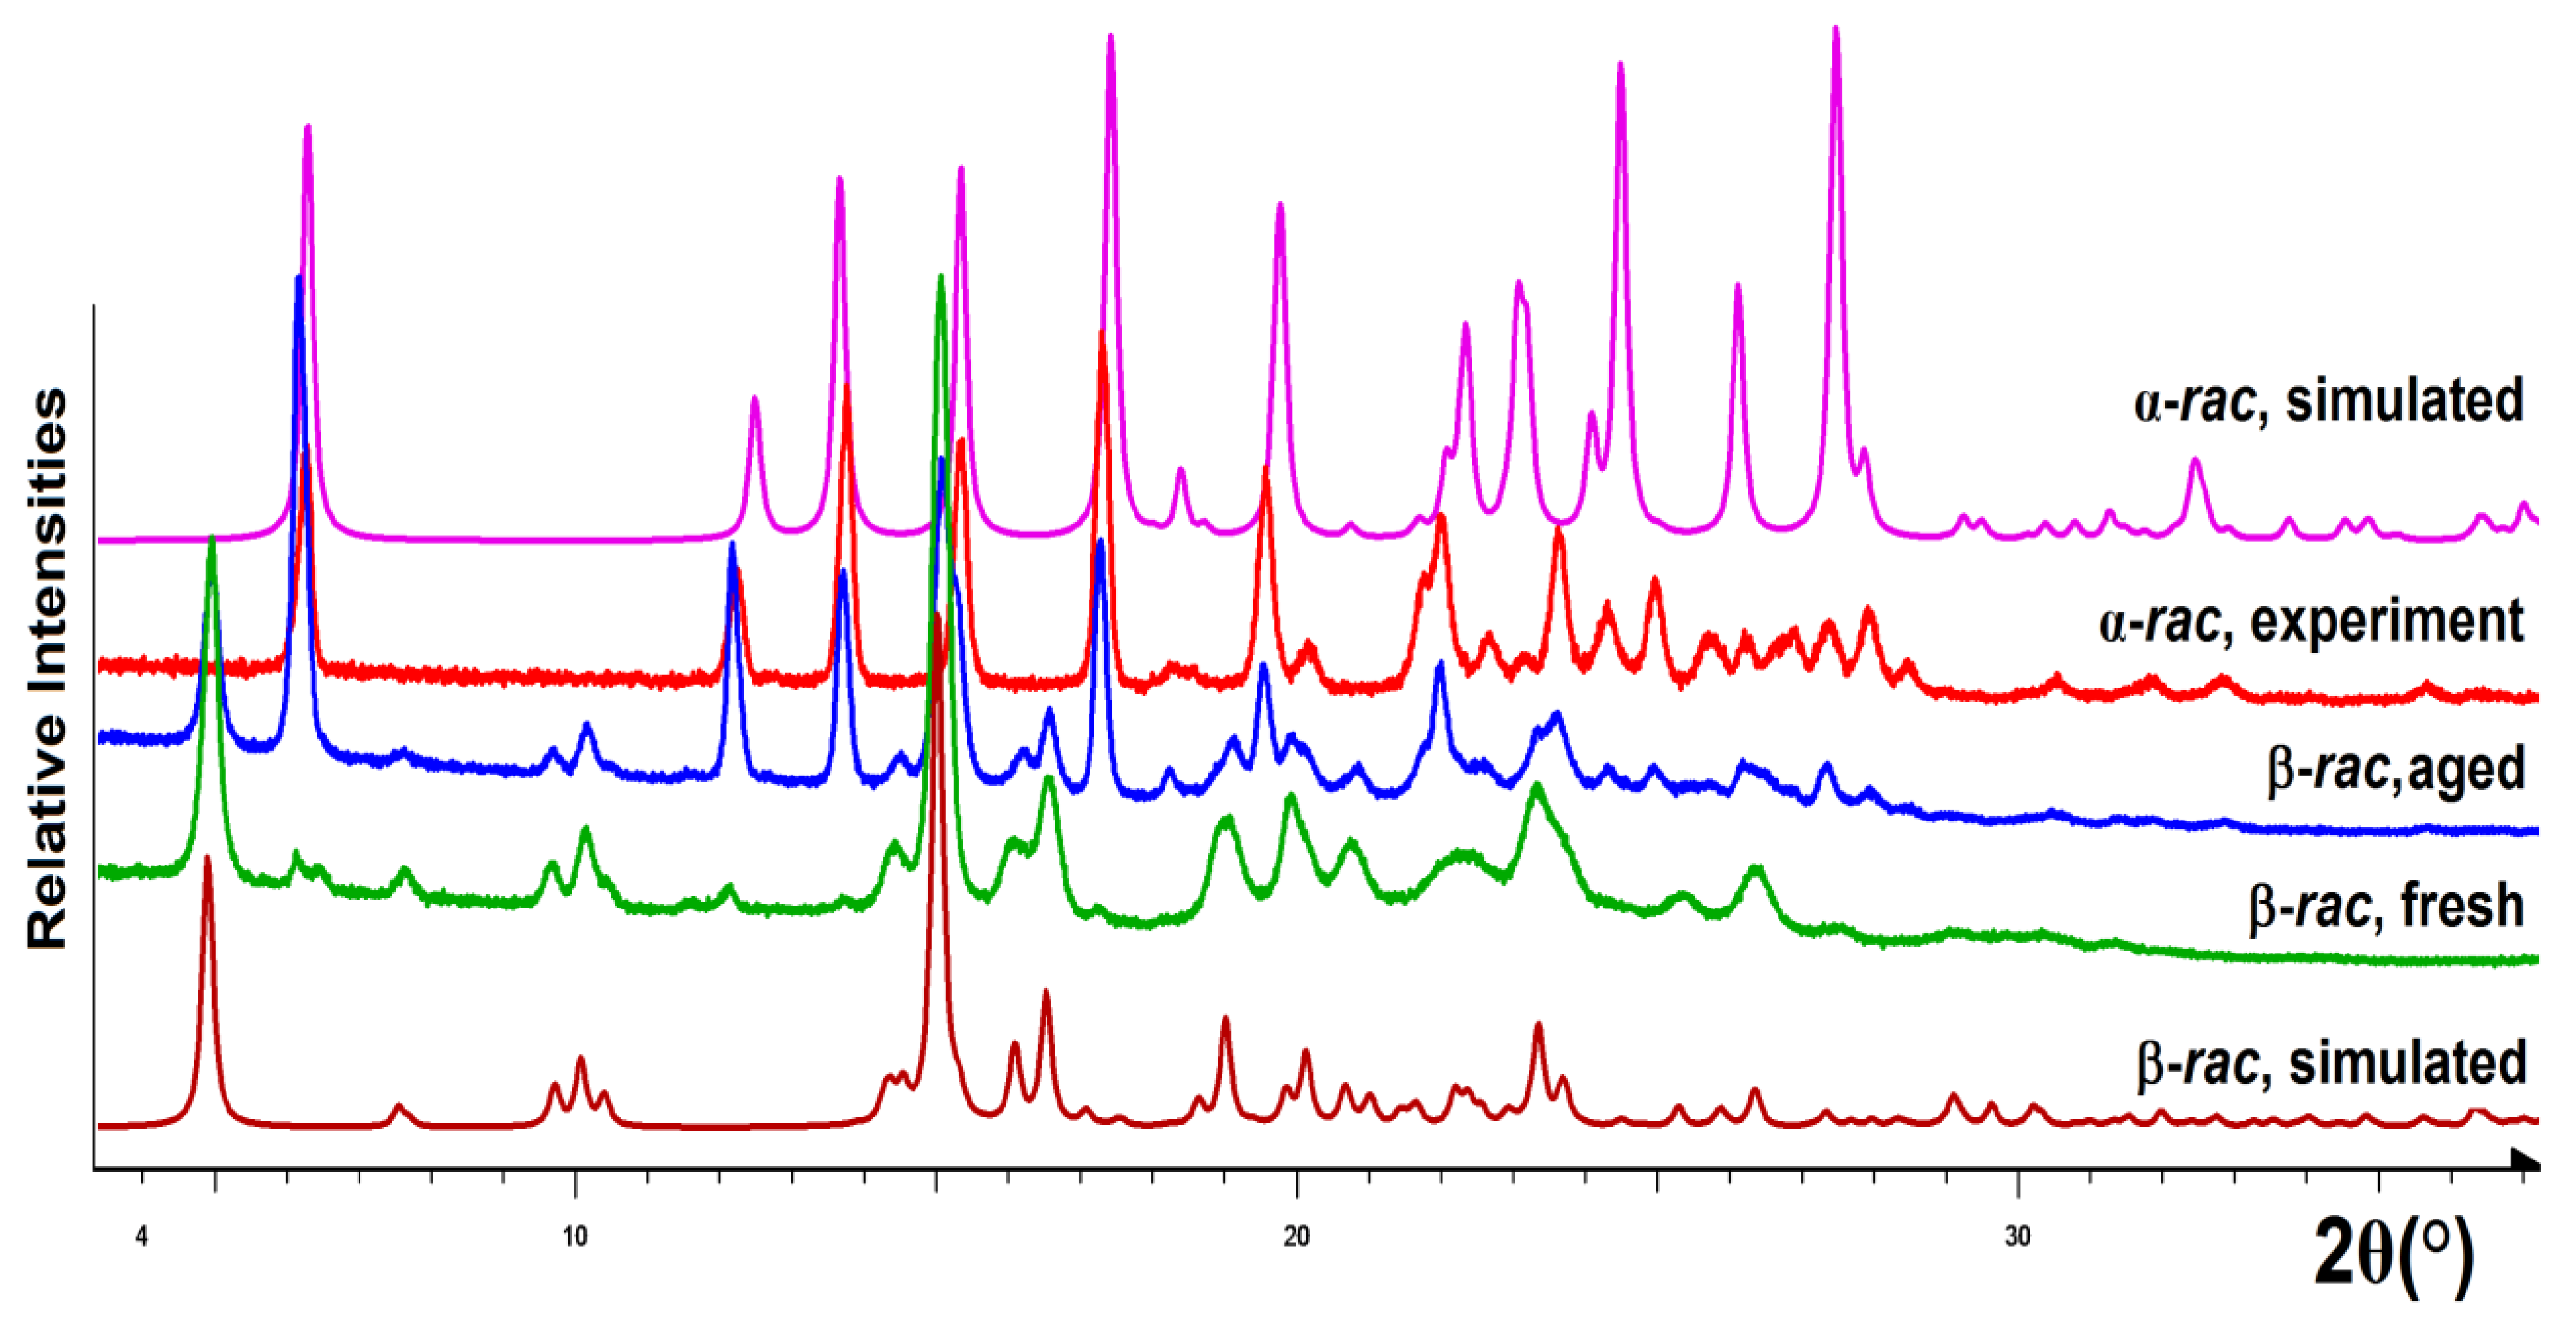
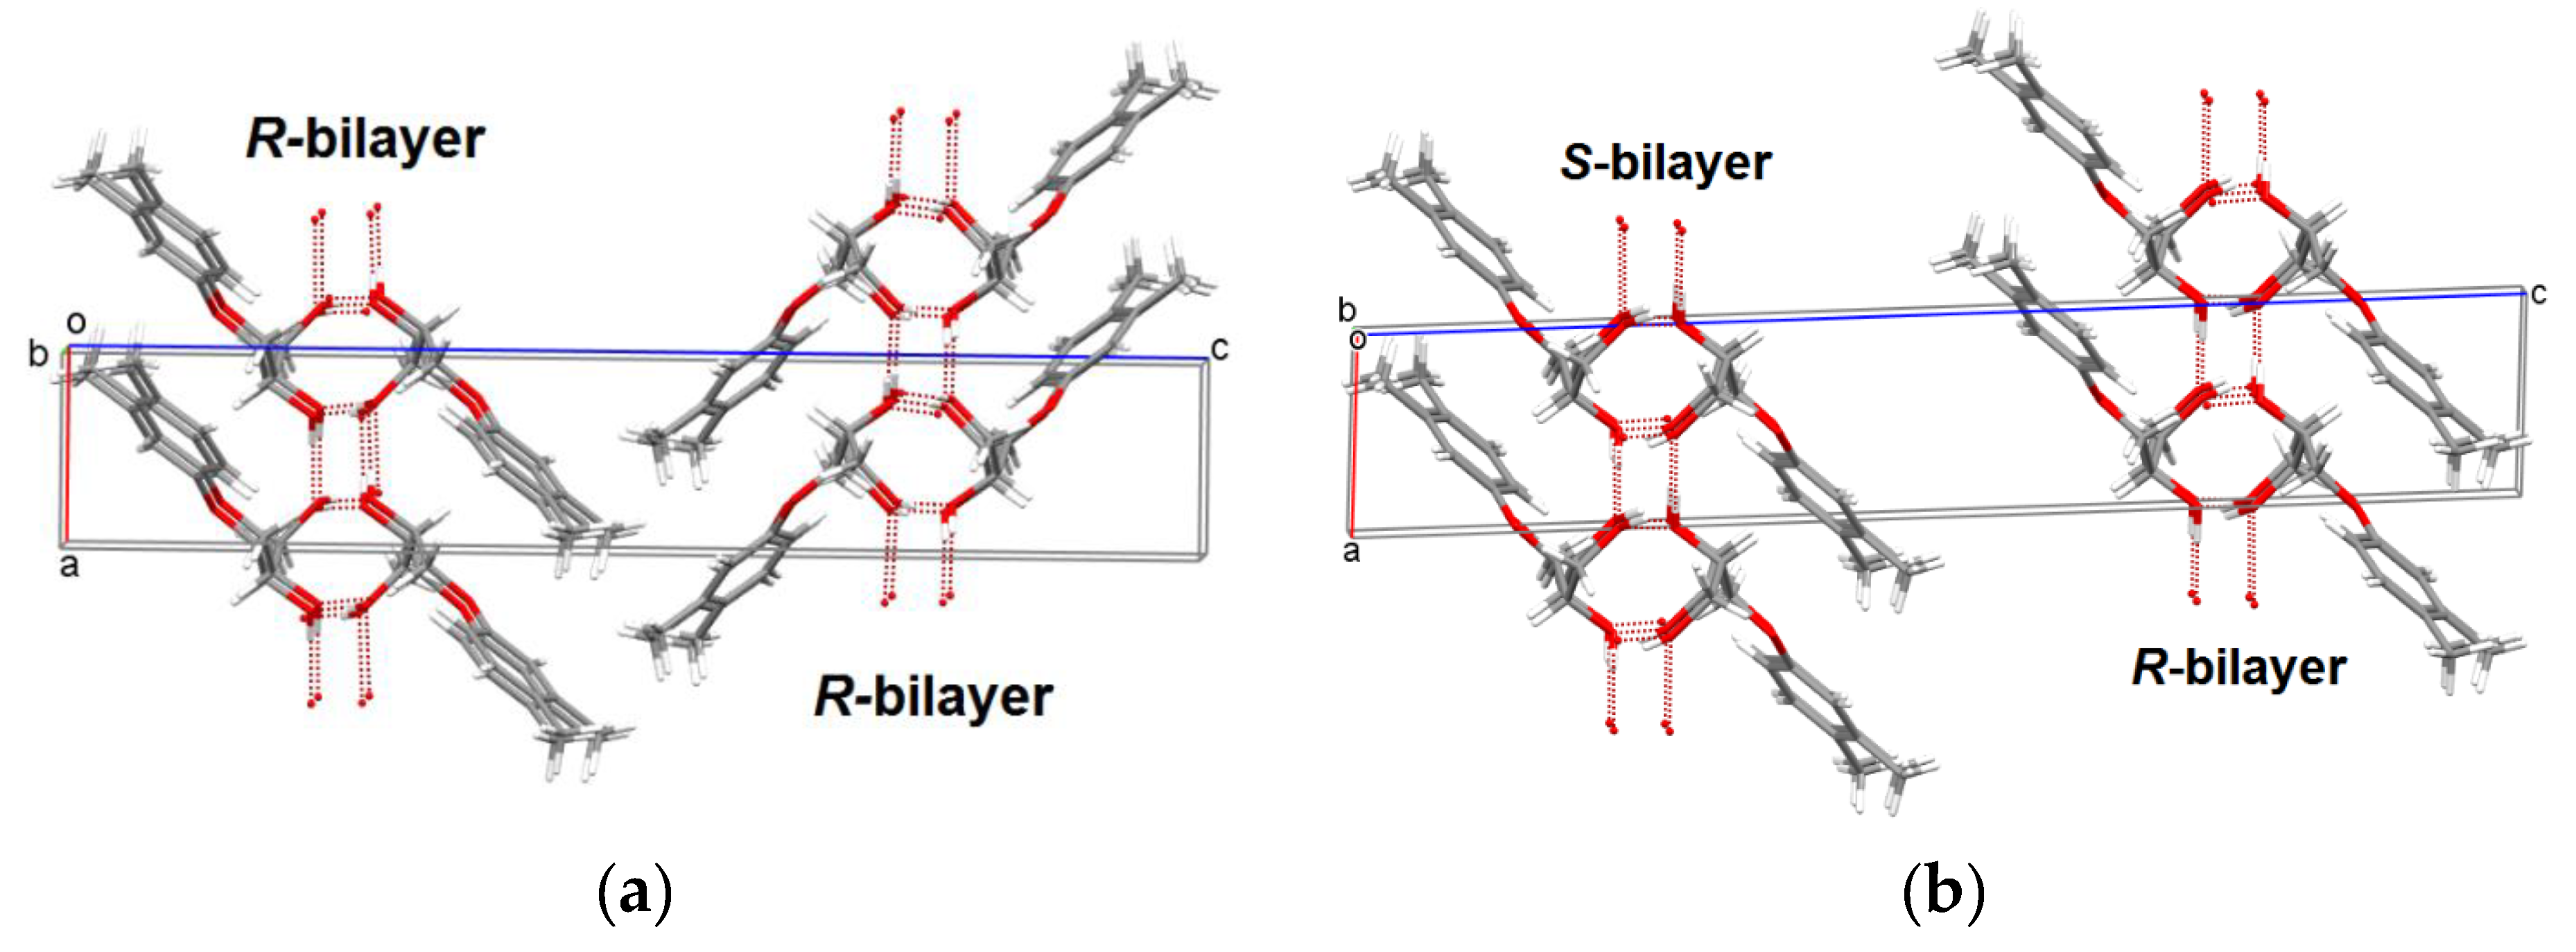
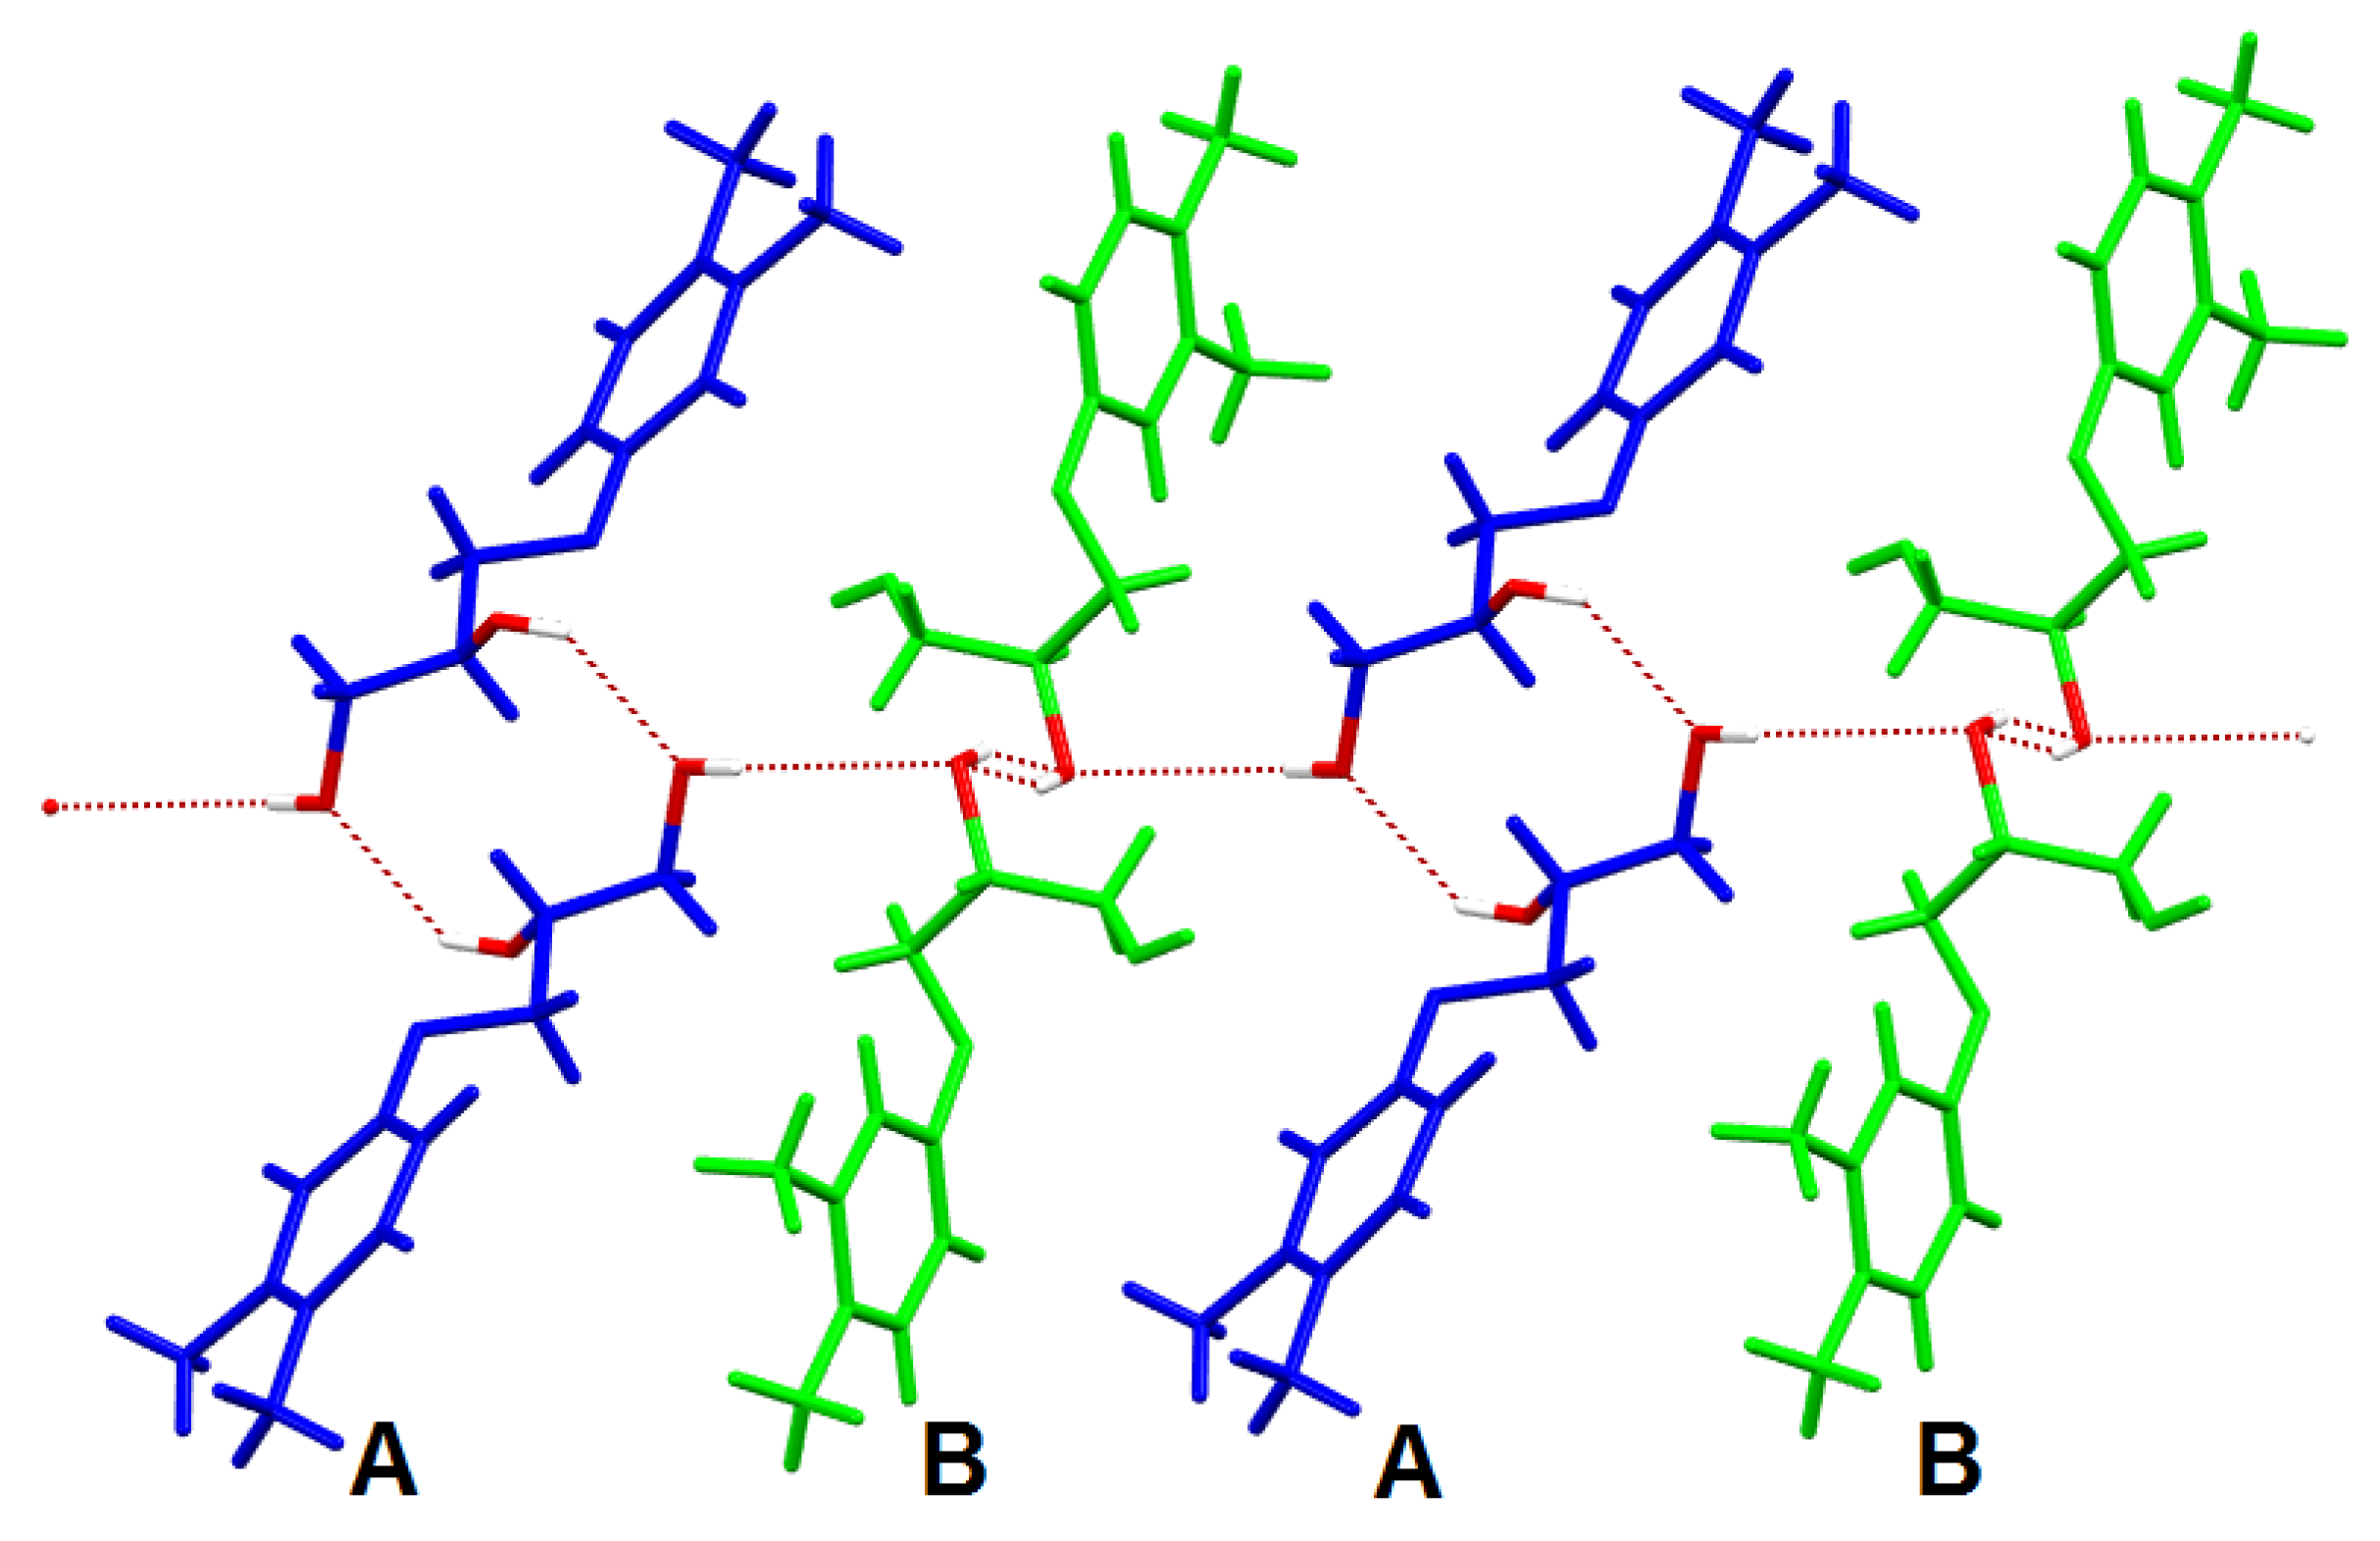
3.5. X-ray Diffraction Investigations

As shown in the previous sections, only the β-rac-1 form differs markedly in energy (Section 3.3) and in internal organization (Section 3.4) from the rest studied. This conclusion fully coincides with the data in Figure 6, where the experimental powder diffraction patterns of the crystalline forms α-rac-1, β-rac-1, (R+S)-1 and (R)-1 are compared. The only curve that differs markedly from the others is the β-rac-1 phase diffractogram.
X-ray powder diffraction also clearly reveals the metastable nature of this phase. While other diffractograms retain all the main features for a long time, the β-rac-1 phase begins to change already during the experiment. Figure 7 shows the diffraction patterns of this phase which was freshly prepared or stored for two months. While on the diffractogram of the fresh sample there are only traces of the impurity signals (for example, in the region of scattering angles 2θ 6°–7° and 11°–12°), on the diffractogram of the aged sample the peaks belonging to the α-rac-1 phase are clearly visible (if they do not prevail).
As we now know, enantiopure diol 1 exists in a single stable crystalline modification, which allows one to obtain good quality single crystals suitable for X-ray diffraction. The results of an X-ray experiment for (R)-1 crystals are shown in Table 1. Figure 8a shows the only symmetry independent molecule present in the unit cell of these crystals.
In general, the conformation of the glycerol fragment in the molecules of glycerol aromatic ethers can be characterized by torsion angles H1O1C1C2, O1C1C2C3, C1C2C3O3, C2C3O3C4, C3O3C4C5, H2O2C2C3, O2C2C3O3. In the order of listing, for (R)-1 they are 146.4°; 50.9°; 53.2°; 175.4°; −177.6°; 155.8°; and 175.9°, which corresponds respectively to ac, sc, sc, ap, ap, ac, and ap conformation. According to our previous experience, such a conformation is inherent in compounds that form a homochiral guaifenesin-like supramolecular motif in their crystals [47]. The main supramolecular synthon in such crystals is the sequence of intermolecular hydrogen bonds {O1−H1⋅⋅⋅O2′, O2′−H2′⋅⋅⋅O1′, O1′−H1′⋅⋅⋅O2′′}, that is, the C22(4) chain formed around a screw axis 21 parallel to the b axis. Donor (O2−H2 and O1′−H1′) and acceptor (O2 and O1′) fragments that are not involved in the construction of this chain form another chain C22(4) around the adjacent axis 21. Together, the guaifenesin-like motif represents a bilayer parallel to 0ba plane. It is this motif that is realized in (R)-1 crystals.
The investigated crystal of the racemic sample α-rac-1 was of lower quality and with noticeable twinning, which is not surprising for the metastable phase. The structure was solved in monoclinic syngony with cell parameters close to the parameters of the enantiopure orthorhombic crystal (Table 1), except that the angle β = 93.559° differs significantly from 90°. The structure of α-rac-1 was refined in the space group P21/n with the only symmetry independent molecule. The experimental powder diffraction patterns of the α-rac-1 form are generally consistent with the calculated one (Figure 7). Some differences in peak intensities are associated with twinning of crystals and the presence of insignificant texturing of the sample.
The geometry of the symmetrically-independent R-enantiomer molecule in α-rac-1 crystals turned out to be almost identical to that just described for the independent molecule in (R)-1 crystals. A visual evidence of such an identity is a conditional superposition of the R-enantiomers present in crystals of both forms (Figure 8b). For systems with close molecular geometry and close cell parameters, it is natural to expect a similar supramolecular organization. Indeed, the same guaifenesin-like motif is realized in α-rac-1 crystals as in (R)-1 crystals. The only, but important, difference between the internal organization of this pair is that in (R)-1 crystals all homochiral bilayers are formed by the same enantiomers, and in crystals of α-rac-1 each individual bilayer is homochiral, but adjacent bilayers are formed by opposite enantiomers (Figure 9). A similar situation was described by us in detail on the example of 3-(4-n-buthylphenoxy)propane-1,2-diol [47].
The process of the formation of crystals of homochiral and racemic samples can be represented as layer-by-layer stacking of homochiral 2D bilayer structures along the direction 0c (Figure 9). In the first case, the bilayers are connected by screw axes 21, and in the second, by inversion centers. Although the calculated packing coefficients in crystals of enantiopure and racemic forms (69.9% and 70.0%, respectively) practically coincide, the second packing method, apparently, required a certain shift of the 2D bilayers relative to each other, which has resulted in a deviation of the monoclinic angle from 90°. Perhaps the same effect also explains the fact of a noticeable twinning of the crystals of the racemic sample in comparison with the enantiopure ones.
From the entire preceding text, it is obvious that the structure of the crystalline β-rac-1 polymorph should be noticeably different from the structure of other identified modifications. Its metastable nature does not allow to obtain stable crystals of the required quality for the study of their internal structure by SC-XRD method. However, despite weak scattering (Figure 7), we tried to index diffractogram and solve the structure of β-rac-1 form from powder diffraction data. It should be added that this form is difficult to obtain as a pure one-component system and it always contains other phases in impurity quantities. Over time, the content of these phases grows, as can be seen from a comparison of the diffraction patterns of β-rac-1 samples freshly prepared and stored for some time (Figure 7). However, knowledge of the position of the peaks for known phases allows us to ignore these reflections at the stage of indexing and the structure solving.
Indexing of the powder diffraction pattern of the β-rac-1 form by several independent software packages made it possible to index it in a triclinic cell whose parameters (a = 19.27(1)Å, b = 12.38(7)Å, c = 5.54(7)Å, α = 93.22(4), β = 94.14(7), γ = 72.87(3)°, V = 1258(1) Å3) differ markedly from those for the enantiopure and α-rac-1 forms. According to preliminary results obtained using the EXPO 2014 software package [41], the β-rac-1 structure was solved in the space group P-1 with two independent molecules in an asymmetric unit. A good coincidence of the experimental powder diffraction pattern of β-rac-1 polycrystalline sample and the diffraction pattern calculated from the atom coordinates of the molecules in this cell testify to the correct choice of the cell and the determined geometry of molecular fragments (Figure 7). According to preliminary data, two independent A and B molecules of diol 1, noticeably different in their geometry, are present in β-rac-1 crystal (Figure 10).
The principal supramolecular motif in β-rac-1 crystals is illustrated in Figure 11. As can be seen from the Figure, each independent molecule due to the classical hydrogen bonds O−H⋅⋅⋅O′ is bonded with its enantiomer into a separate centrosymmetric dimer, and already A-A and B-B dimers act as subunits in the formation of the 1D construct oriented along the crystallographic direction b.
As recommended by Bernstein et al. [48], such a hydrogen bonding pattern may be called a “chain of rings”. Extending somewhat the system of symbols proposed in the review [48], such a motif with two different rings can be designated as C22(11)[R22(4)R22(10)]. Such a sophisticated packing based on a one-dimensional motif can hardly be dense. Indeed, preliminary calculations point that the Kitaygorodsky packing index is below 60% (KPI = 56.1%).

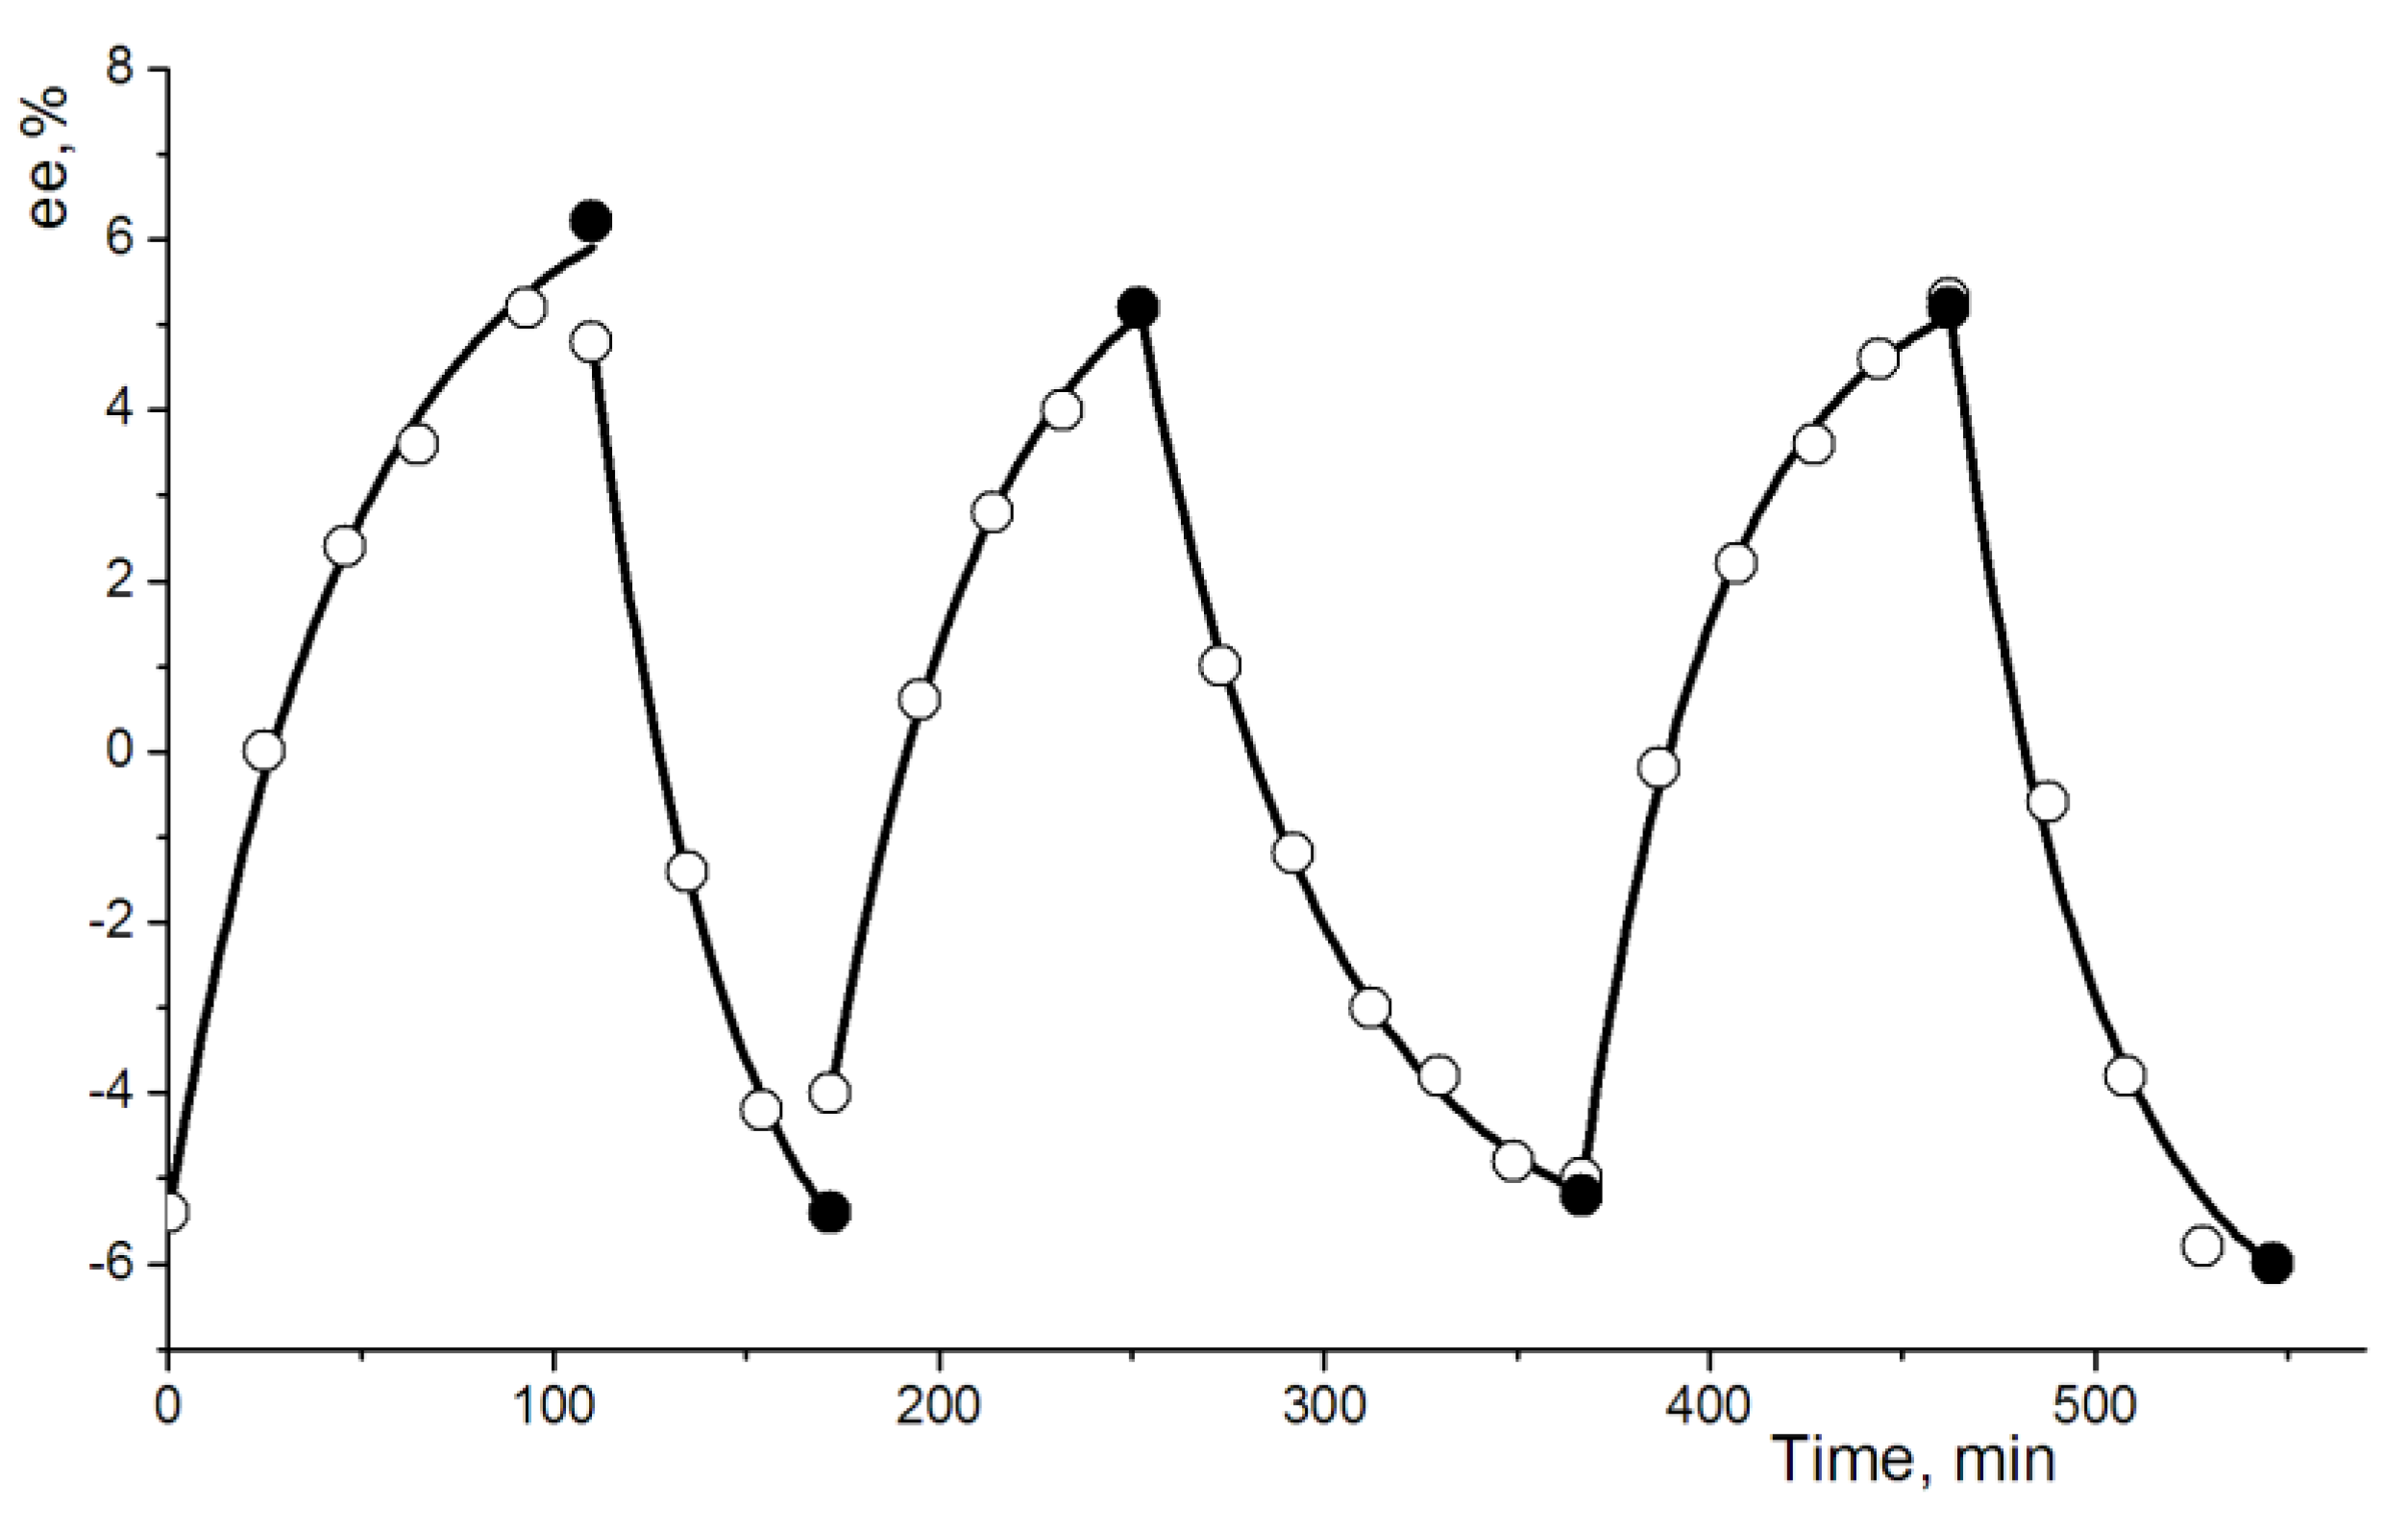
3.6. Direct Resolution of Rac-1 by Entrainment Procedure

In general, our study of the phase behavior of 3-(3,4-dimethylphenoxy)propane-1,2-diol 1 showed that the conglomerate (R+S)-1 is the most stable crystalline modification of the racemate, which does not contain signs of a solid solution and is not prone to phase transformations. Other detected racemic forms are metastable and more soluble than conglomerate. Therefore, an increase in the crystallization temperature of the solution should help to increase the efficiency of the process of direct resolution of racemic 1 by reducing the supersaturation for undesirable forms and approximating the crystallization conditions to equilibrium ones. Further, the results of a pilot experiment (Section 3.1) showed that crystallization of pure racemic 1 is accompanied by a significant and irreproducible induction period duration. We believed that some supersaturation of the initial solution with the target component should contribute to a decrease in the influence of this factor on the crystallization stage of a specific enantiomer. Finally, an increase in the relative amount of introduced crystal seeds should be an important factor that favorably affects the kinetics of the process. With all that in mind, we planned and implemented an experiment the details of which are shown in Table 4.
In Figure 12, the same process of separation of racemic rac-1 is clearly illustrated by changes in the enantiomeric excess values of its mother liquor. Solid circles indicate ee values, upon reaching which the process was interrupted and the precipitate formed was filtered off. Then, compensating amounts of rac-1 and solvent were added to the heated mother liquor, after which the process was repeated.
A comparison of the data of Table 2 and Table 4 shows that the yield of the pure enantiomer increases from 11% to 17%–18%, the process proceeds more reproducibly, in a constant temperature range and with a smaller scatter in the ee values (72%–78%) of its filtered precipitates. In principle, the proposed resolution procedure can be scaled and repeated as many times as necessary. A high degree of enantiomeric purity of collected (R)- and (S)-diols can be achieved by crop recrystallization from mixture of EtOAc:hexane (1:2).

4. Conclusions

An experimental study of the phase behavior of chiral 3-(3,4-dimethylphenoxy) propane-1,2-diol 1 showed that enantiopure samples exist in a single stable crystalline form. In contrast, racemic 1 during crystallization under different conditions can exist in at least three modifications, namely stable racemic conglomerate (R+S)-1 and two metastable racemic compounds α-rac-1 and β-rac-1. With rapid crystallization from racemic solutions, all three phases can crystallize simultaneously.
Using the DSC approach, methods have been developed to obtain individual metastable phases, and all identified homochiral and racemic crystal modifications were ranked by energy. The IR spectroscopy and PXRD methods demonstrated the identity or similarity of all forms except β-rac-1, which is significantly different from the rest. The crystal structure of the forms (R)-1 and α-rac-1 was established by the SC-XRD method. It was found that supramolecular crystal-forming motifs in both forms are fundamentally the same and only symmetries differ. Preliminary information on the structure of β-rac-1 phase was obtained by the PXRD approach.
Based on the information received, the experimental conditions for a successful direct resolution of racemic 1 into individual enantiomers by a preferential crystallization procedure were selected.

Author Contributions

Conceptualization, writing—review and editing, A.A.B.; methodology, DSC investigation, thermodynamics calculations, D.V.Z.; methodology, proofread the manuscript, resolution experiments, Z.A.B.; samples preparation and resolution, A.V.K.; XRD investigation, A.I.S.; XRD investigation, proofread the manuscript, A.T.G. All authors have read and agreed to the published version of the manuscript.

Funding

This research received no external funding.

Acknowledgments

The authors thank I.I. Vandyukova for valuable help with IR spectra analysis. The authors are grateful to the Assigned Spectral-Analytical Center of FRC Kazan Scientific Center of RAS for technical assistance in research.

Conflicts of Interest

The authors declare no conflicts of interest.

References

  1. Wagniere, G.H. On Chirality and the Universal Asymmetry: Reflections on Image and Mirror Image; Wiley-VCH: Hoboken, NJ, USA, 2007. [Google Scholar]
  2. Murakami, H. From racemates to single enantiomers—Chiral synthetic drugs over the last 20 years. Top. Curr. Chem. 2007, 269, 273–299. [Google Scholar] [CrossRef] [PubMed]
  3. Calcaterra, A.; D’Acquarica, I. The market of chiral drugs: Chiral switches versus de novo enantiomerically pure compounds. J. Pharm. Biomed. Anal. 2018, 147, 323–340. [Google Scholar] [CrossRef] [PubMed]
  4. De la Torre, B.G.; Albericio, F. The pharmaceutical industry in 2018. An analysis of FDA drug approvals from the perspective of molecules. Molecules 2019, 24, 809. [Google Scholar] [CrossRef] [PubMed] [Green Version]
  5. Wood, B.; Girard, K.P.; Polster, C.S.; Croker, D.M. Progress to date in the design and operation of continuous crystallization processes for pharmaceutical applications. Org. Process Res. Dev. 2019, 23, 122–144. [Google Scholar] [CrossRef]
  6. Gao, Z.G.; Rohani, S.; Gong, J.B.; Wang, J.K. Recent developments in the crystallization process: Toward the pharmaceutical industry. Engineering 2017, 3, 343–353. [Google Scholar] [CrossRef]
  7. Lorenz, H.; Seidel-Morgenstern, A. Processes to separate enantiomers. Angew. Chem. Int. Ed. 2014, 53, 1218–1250. [Google Scholar] [CrossRef]
  8. Coquerel, G. Chiral discrimination in the solid state: Applications to resolution and deracemization. In Advances in Organic Crystal Chemistry; Tamura, R., Miyata, M., Eds.; Springer: Berlin/Heidelberg, Germany, 2015; pp. 393–420. [Google Scholar] [CrossRef]
  9. Wang, Y.; Chen, A. Crystallization-Based Separation of Enantiomers. In Stereoselective Synthesis of Drugs and Natural Products; Andrushko, V., Andrushko, N., Eds.; John Wiley and Sons, Inc.: Hoboken, NJ, USA, 2013. [Google Scholar] [CrossRef]
  10. Faigl, F.; Fogassy, E.; Nogradi, M.; Palovics, E.; Schindler, J. Strategies in optical resolution: A practical guide. Tetrahedron Asymmetry 2008, 19, 519–536. [Google Scholar] [CrossRef]
  11. Palmans, A.R.A. Deracemisations under kinetic and thermodynamic control. Mol. Syst. Des. Eng. 2017, 2, 34–46. [Google Scholar] [CrossRef] [Green Version]
  12. Bredikhin, A.A.; Bredikhina, Z.A. Stereoselective crystallization as a basis for single-enantiomer drug production. Chem. Eng. Technol. 2017, 40, 1211–1220. [Google Scholar] [CrossRef] [Green Version]
  13. Levilain, G.; Eicke, M.J.; Seidel-Morgenstern, A. Efficient resolution of enantiomers by coupling preferential crystallization and dissolution. Part 1: Experimental proof of principle. Cryst. Growth Des. 2012, 12, 5396–5401. [Google Scholar] [CrossRef]
  14. Eicke, M.J.; Levilain, G.; Seidel-Morgenstern, A. Efficient resolution of enantiomers by coupling preferential crystallization and dissolution. Part 1: A parametric simulation study to identify suitable process conditions. Cryst. Growth Des. 2013, 13, 1638–1648. [Google Scholar] [CrossRef]
  15. Eicke, M.J.; Levilain, G.; Seidel-Morgenstern, A. Efficient resolution of enantiomers by coupling preferential crystallization and dissolution. Part 2: A parametric simulation study to identify suitable process conditions. Cryst. Growth Des. 2014, 14, 4872. [Google Scholar] [CrossRef]
  16. Cascella, F.; Seidel-Morgenstern, A.; Lorenz, H. Exploiting ternary solubility phase diagrams for resolution of enantiomers: An instructive example. Chem. Eng. Technol. 2020, 43, 329–336. [Google Scholar] [CrossRef]
  17. Oketani, R.; Marin, F.; Tinnemans, P.; Hoquante, M.; Laurent, A.; Brandel, C.; Cardinael, P.; Meekes, H.; Vlieg, E.; Geerts, Y.; et al. Deracemization in a complex quaternary system with a second-order asymmetric transformation by using phase diagram studies. Chem. Eur. J. 2019, 25, 13890–13898. [Google Scholar] [CrossRef] [Green Version]
  18. Binev, D.; Seidel-Morgenstern, A.; Lorenz, H. Continuous separation of isomers in fluidized bed crystallizers. Cryst. Growth Des. 2016, 16, 1409–1419. [Google Scholar] [CrossRef]
  19. Galan, K.; Eicke, M.J.; Elsner, M.P.; Lorenz, H.; Seidel-Morgenstern, A. Continuous preferential crystallization of chiral molecules in single and coupled mixed-suspension mixed-product-removal crystallizers. Cryst. Growth Des. 2015, 15, 1808–1818. [Google Scholar] [CrossRef]
  20. Cascella, F.; Temmel, E.; Seidel-Morgenstern, A.; Lorenz, H. Efficient resolution of racemic guaifenesin via batch-preferential crystallization processes. Org. Process Res. Dev. 2020, 24, 50–58. [Google Scholar] [CrossRef]
  21. Bredikhina, Z.A.; Novikova, V.G.; Zakharychev, D.V.; Bredikhin, A.A. Solid state properties and effective resolution procedure for guaifenesin, 3-(2-methoxyphenoxy)-1,2-propanediol. Tetrahedron Asymmetry 2006, 17, 3015–3020. [Google Scholar] [CrossRef]
  22. O’Neil, M.J. (Ed.) The Merck Index, 14th ed.; Merck and Co. Inc.: Whitehouse Station, NJ, USA, 2006. [Google Scholar]
  23. Saddique, F.A.; Zahoor, A.F.; Yousaf, M.; Irfan, M.; Ahmad, M.; Mansha, A.; Khan, Z.A.; Naqvi, S.A.R. Synthetic approaches towards the synthesis of beta-blockers (betaxolol, metoprolol, sotalol, and timolol). Turk. J. Chem. 2016, 40, 193–224. [Google Scholar] [CrossRef]
  24. Agustian, J.; Kamaruddin, A.H.; Bhatia, S. Single enantiomeric beta-blockers—The existing technologies. Process Biochem. 2010, 45, 587–1604. [Google Scholar] [CrossRef]
  25. Campo, C.; Llama, E.F.; Bermudez, J.L.; Sinisterra, J.V. Methodologies for the stereoselective synthesis of adrenergic beta-blockers: An overview. Biocatal. Biotransform. 2001, 19, 163–180. [Google Scholar] [CrossRef]
  26. Bredikhin, A.A.; Bredikhina, Z.A.; Zakharychev, D.V. Crystallization of chiral compounds: Thermodynamical, structural and practical aspects. Mendeleev Commun. 2012, 22, 171–180. [Google Scholar] [CrossRef]
  27. Bredikhina, Z.A.; Kurenkov, A.V.; Krivolapov, D.B.; Bredikhin, A.A. Stereoselective crystallization of 3-(2,6-dimethylphenoxy)propane-1,2-diol: Preparation of the single-enantiomer drug mexiletine. Tetrahedron Asymmetry 2015, 26, 577–583. [Google Scholar] [CrossRef]
  28. Bredikhin, A.A.; Bredikhina, Z.A.; Kurenkov, A.V.; Gubaidullin, A.T. Synthesis, crystal structure, and absolute configuration of the enantiomers of chiral drug xibenolol hydrochloride. Tetrahedron Asymmetry 2017, 28, 1359–1366. [Google Scholar] [CrossRef]
  29. Bredikhin, A.A.; Zakharychev, D.V.; Bredikhina, Z.A.; Kurenkov, A.V.; Krivolapov, D.B.; Gubaidullin, A.T. Spontaneous resolution of chiral 3-(2,3-dimethyl phenoxy)propane-1,2-diol under the circumstances of an unusual diversity of racemic crystalline modifications. Cryst. Growth Des. 2017, 17, 4196–4206. [Google Scholar] [CrossRef]
  30. Bredikhin, A.A.; Zakharychev, D.V.; Gubaidullin, A.T.; Bredikhina, Z.A. Solid phase behavior, polymorphism, and crystal structure features of chiral drug metaxalone. Cryst. Growth Des. 2018, 18, 6627–6639. [Google Scholar] [CrossRef]
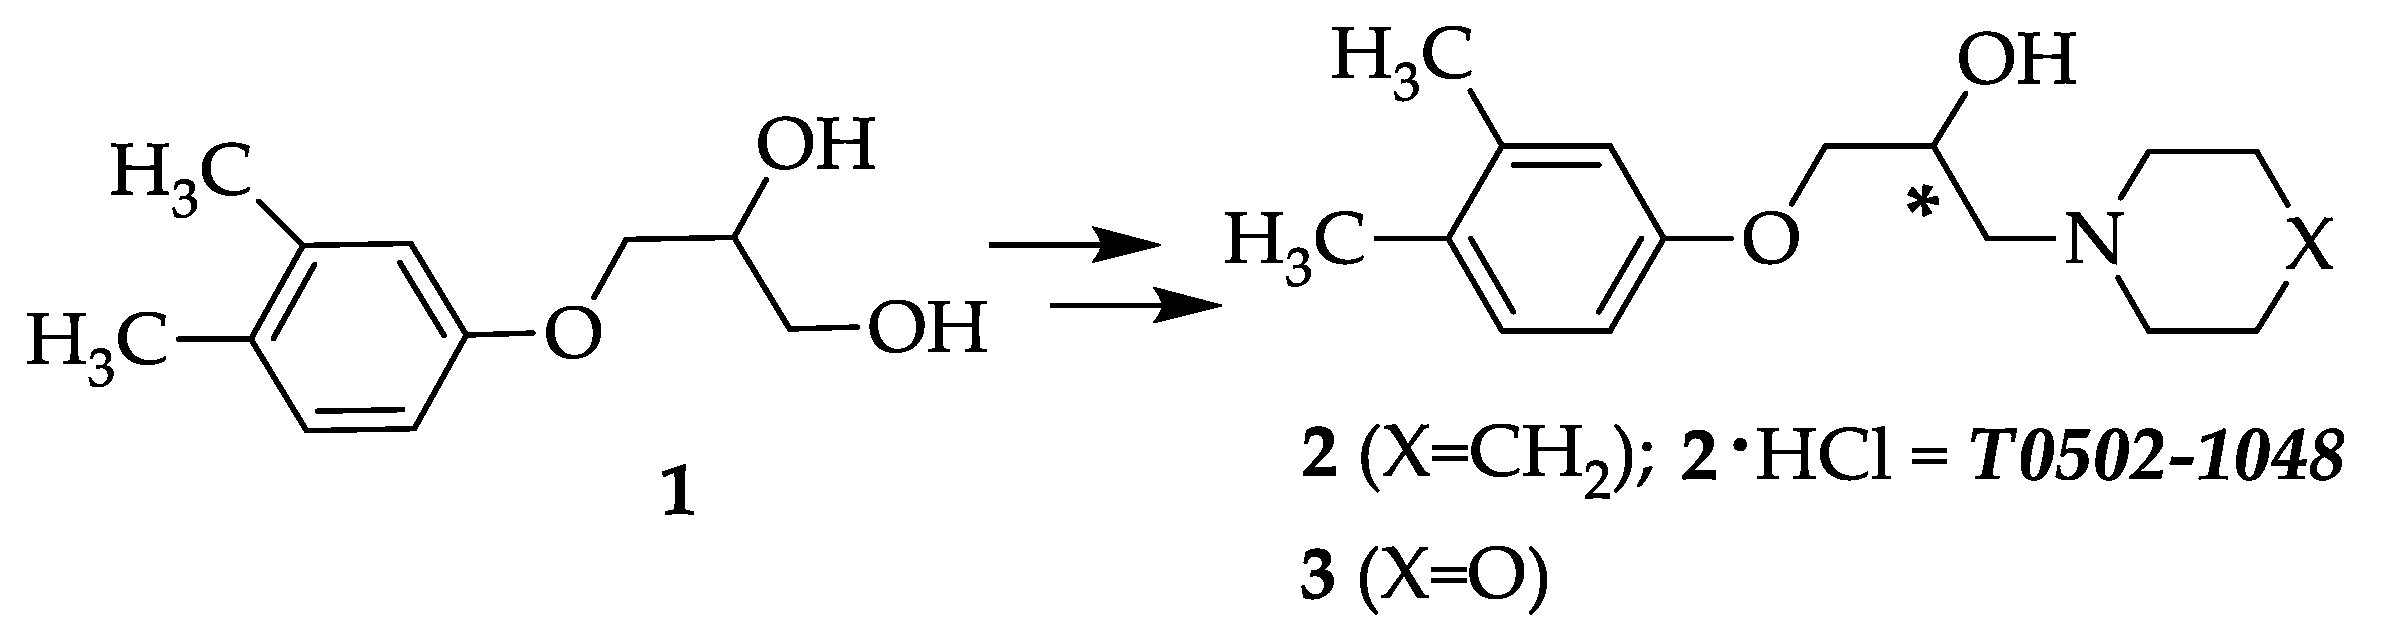
  31. Bredikhina, Z.A.; Kurenkov, A.V.; Bredikhin, A.A. Nonracemic dimethylphenyl glycerol ethers in the synthesis of physiologically active aminopropanols. Russ. J. Org. Chem. 2019, 55, 837–844. [Google Scholar] [CrossRef]
  32. Hothersall, J.D.; Black, J.; Caddick, S.; Vinter, J.G.; Tinker, A.; Baker, J.R. The design, synthesis and pharmacological characterization of novel β2-adrenoceptor antagonists. Br. J. Pharmacol. 2011, 164, 317–331. [Google Scholar] [CrossRef] [Green Version]
  33. Araujo, N.; Ferreira da Silva, A.; Qing, Y.; Lifino, M.; Russell, A.J.; Small, B.; Wade-Martins, R.; Wynne, G.M. Therapeutic Compounds. Int. Patent Appl. 2015. No. WO 2015/004485 A1. [Google Scholar]
  34. Sheldrick, G.M. SADABS, Program for Empirical X-ray Absorption Correction; Bruker-Nonius: Delft, The Netherlands, 2004. [Google Scholar]
  35. Sheldrick, G.M. A short history of SHELX. Acta Crystallogr. A 2008, 64, 112–122. [Google Scholar] [CrossRef] [Green Version]
  36. Farrugia, L.J. WinGX suite for small-molecule single-crystal crystallography. J. Appl. Crystallogr. 1999, 32, 837–838. [Google Scholar] [CrossRef]
  37. Macrae, C.F.; Edgington, P.R.; McCabe, P.; Pidcock, E.; Shields, G.P.; Taylor, R.; Towler, M.; van de Streek, J. Mercury: Visualization and analysis of crystal structures. J. Appl. Crystallogr. 2006, 39, 453–457. [Google Scholar] [CrossRef] [Green Version]
  38. Spek, A.L. Single-crystal structure validation with the program PLATON. J. Appl. Crystallogr. 2003, 36, 7–13. [Google Scholar] [CrossRef] [Green Version]
  39. Bruker AXS. DIFFRAC Plus Evaluation package EVA, Version 11. In User’s Manual; Bruker AXS: Karlsruhe, Germany, 2005; p. 258. [Google Scholar]
  40. Bruker AXS. TOPAS v3: General profile and structure analysis software for powder diffraction data. In Technical Reference; Bruker AXS: Karlsruhe, Germany, 2005; p. 117. [Google Scholar]
  41. Altomare, A.; Cuocci, C.; Giacovazzo, C.; Moliterni, A.; Rizzi, R.; Corriero, N.; Falcicchio, A. EXPO2013: A kit of tools for phasing crystal structures from powder data. J. Appl. Crystallogr. 2013, 46, 1231–1235. [Google Scholar] [CrossRef]
  42. Meyerhoffer, W. Stereochemische Notizen. Ber. Dtsch. Chem. Ges. 1904, 37, 2604–2610. [Google Scholar] [CrossRef]
  43. Jaques, J.; Collet, A.; Wilen, S.H. Enantiomers, Racemates, and Resolutions; J. Wiley and Sons, Inc.: Hoboken, NJ, USA, 1981; p. 447. [Google Scholar]
  44. Li, Z.J.; Zell, M.T.; Munson, E.J.; Grant, D.J.W. Characterization of racemic species of chiral drugs using thermal analysis, thermodynamic calculation, and structural studies. J. Pharm. Sci. 1999, 88, 337–346. [Google Scholar] [CrossRef]
  45. Bredikhin, A.A.; Bredikhina, Z.A.; Akhatova, F.S.; Zakharychev, D.V.; Polyakova, E.V. From racemic compounds through metastable to stable racemic conglomerates: Crystallization features of chiral halogen and cyano monosubstituted phenyl glycerol ethers. Tetrahedron Asymmetry 2009, 20, 2130–2136. [Google Scholar] [CrossRef]
  46. Bredikhin, A.A.; Zakharychev, D.V.; Fayzullin, R.R.; Antonovich, O.A.; Pashagin, A.V.; Bredikhina, Z.A. Chiral para-alkyl phenyl ethers of glycerol: Synthesis and testing of chirality driven crystallization, liquid crystal, and gelating properties. Tetrahedron Asymmetry 2013, 24, 807–816. [Google Scholar] [CrossRef]
  47. Bredikhin, A.A.; Zakharychev, D.V.; Gubaidullin, A.T.; Fayzullin, R.R.; Samigullina, A.I.; Bredikhina, Z.A. Crystallization of chiral para-n-alkylphenyl glycerol ethers: Phase diversity and impressive predominance of homochiral guaifenesin-like supramolecular motif. Cryst. Growth Des. 2018, 18, 3980–3987. [Google Scholar] [CrossRef]
  48. Bernstein, J.; Davis, R.E.; Shimoni, L.; Chang, N.L. Patterns in hydrogen bonding—Functionality and graph set analysis in crystals. Angew. Chem. Int. Ed. 1995, 34, 1555–1573. [Google Scholar] [CrossRef]
Scheme 1. Chiral drugs, in the synthesis of which dimethyl substituted phenyl glycerol ethers are used.
Crystals 10 00201 sch001
Scheme 2. 3,4-Dimethylphenyl ether of glycerol 1 and related bioactive aminopropanols 2 and 3.
Crystals 10 00201 sch002
Figure 1. Temperature dependence of solubility (per single enantiomer, solid lines and circles) and for onset of crystallization (dashed lines, hollow circles) of rac-1 (red) and (S)-1 (blue) in methyl tert-butyl ether.
Crystals 10 00201 g001
Figure 2. Differential scanning calorimetry (DSC)traces of an enantiopure sample (R)-1 (blue curve 1), a freshly recrystallized racemic sample rac-1 (wine curve 2), the same sample after prolonged stirring of a suspension in hexane (red curve 3), and after crystallization of the racemate from the melt (olive curve 4). Sample weight ~ 1 mg.
Crystals 10 00201 g002
Figure 3. DSC traces of an equilibrium racemic sample identified as a conglomerate (red curve), a racemic sample obtained by crystallization from melt at 72 °C (violet curve), and crystallization from melt upon rapid cooling to 20 °C (olive curve). Sample weight ~ 8 mg.
Crystals 10 00201 g003
Figure 4. The temperature dependence of the Gibbs free energy change for the enantiopure sample (R)-1 (blue line), racemic conglomerate (R+S)-1 (red line), α-rac-1 (violet line), β-rac-1 (olive line), racemic melt (green line), and single enantiomeric melt (cyan line). Dashed lines correspond to the metastable supercooled state of melts; dot lines correspond to extrapolations of the free energies of crystalline phases in the temperature range above their melting temperature.
Crystals 10 00201 g004
Figure 5. Comparison of the IR spectrum of conglomerate (R+S)-1 (red curve) with the spectra of samples (R)-1 (a), (blue curve), α-rac-1 (b), (violet curve), and β-rac-1 (c), (olive curve).
Crystals 10 00201 g005
Figure 6. Comparison of experimental powder X-ray diffraction (PXRD) patterns of (R)-1, (R+S)-1, α-rac-1, and β-rac-1 forms and simulated PXRD patterns of (R)-1 forms.
Crystals 10 00201 g006
Figure 7. Comparison of experimental and simulated PXRD patterns for α-rac-1 and β-rac-1 polymorphs.
Crystals 10 00201 g007
Figure 8. (a) Geometry of the molecules in (R)-1 crystals. (b) Conditional superposition of R-enantiomers in (R)-1 (blue) and α-rac-1 crystals (red).
Crystals 10 00201 g008
Figure 9. Stacking of H-bonded homochiral bilayers in (R)-1 (a) and α-rac-1 (b) crystals.
Crystals 10 00201 g009
Figure 10. Probable geometry of two symmetrically-independent R-molecules in β-rac-1 crystals.
Crystals 10 00201 g010
Figure 11. The principal supramolecular motif in β-rac-1 crystals.
Crystals 10 00201 g011
Figure 12. Mother liquor enantiomeric excess vs time of preferential crystallization of slightly enantiomerically enriched diol 1. Closed circles represent the values of ee, on reaching which the process was interrupted.
Crystals 10 00201 g012
Table 1. Crystallographic data for (R)-1 and α-rac-1 modifications of diol 1.
Compound(R)-1α-rac-1
FormulaC11H16O3C11H16O3
Formula weight (g/mol)196.24196.24
Temperature, K296(2)296(2)
Crystal classOrthorhombicMonoclinic
Space groupP212121P21/n
Crystal size0.32 × 0.21 × 0.14 mm30.24 × 0.13 × 0.04 mm3
Z, Z’4, 14, 1
Cell parametersa = 4.9382(4) Å,
b = 7.2807(6) Å,
c = 28.728(2) Å
a = 4.9563(10) Å,
b = 7.2972(18) Å,
c = 28.491(7) Å
β = 93.559(15)°
Volume, Å31032.88(14)1028.4(4)
F(000)424424
Calculated density, g/cm31.2621.267
μ, cm−10.910.91
Theta range for data collection,, deg3.985–31.2912.149–27.868
Reflections measured1476212777
Independent reflections/R(int)3206/0.03742290/0.1433
Number of parameters/restraints191/0139/1
Reflections [I > 2σ(I)]26691592
Final R indices, R1/wR2 [I > 2σ(I)]0.0446/0.09650.1493/0.3564
Final R indices, R1/wR2 (all reflections)0.0595/0.10260.1803/0.3791
Goodness-of-fit on F21.0421.372
Largest diff. peak and hole, ρmaxmin (eÅ−3)0.236/−0.1850.782/−0.535
Table 2. Resolution by entrainment of rac-3-(3.4-dimethylphenoxy)propane-1,2-diol, rac-1 in methyl tert-butyl ether (20 mL, 5 mg of crystal seeds on every run; crystallization temperature 23.5 ± 0.5 °C).
RunAdded Amount of rac-1, mgOperation Amount of Enantiomers, mgResolution Time, min(R)-1 and (S)-1 Obtained
(R)-1(S)-1Yield, mgee1,
%
YE2
mg%
1100050050090(R) 2372.7122.4
218495505138(S) 5069.0305.9
345513487143(R) 4682.2336.4
441488512303(S) 5179.0356.8
546516484462(R) 5585.6428.1
650487513157(S) 6976.8489.4
764517483198(R) 9469.46011.6
889481519236(S) 10164.86011.6
1 ee: enantiomeric excess (HPLC). 2 YE: Yield of enantiomer; YE(mg) = [Yield (mg) × ee (%)]/100 − 5 (seed weight); YE(%) = [YE(mg) × 100]/Operation amount of (R)- or (S)-1(mg).
Table 3. Thermochemical characteristics of the identified crystalline forms of 3-(3,4-dimethylphenoxy) propane-1,2-diol 1.
FormsFusion Temperature (Tf), °CEnthalpy of Fusion (ΔHf), J mole−1
α-rac74.433.3
β-rac66.127.8
(R)96.538.2
(R+S)76.3(76.2 1)34.9(35.2 1)
1 In parentheses are the values calculated on the basis of the DSC data for the dependence of the thermodynamic potentials of the phases on temperature (Section 3.3, Figure 3).
Table 4. Resolution by entrainment of rac-3-(3.4-dimethylphenoxy)propane-1,2-diol, rac-1 in methyl tert-butyl ether (60 mL, 75 mg of crystal seeds on every run; crystallization temperature 27 °C).
RunAdded Amount of rac-1, gOperation Amount of Enantiomers, gResolution Time, min(R)-1 and (S)-1 Obtained
(R)-1(S)-1Yield, gee, %YE2
g%
13.00 11.421.58110(S) 0.5073.80.2918.5
20.421.571.4365(R) 0.4078.00.2415.2
30.331.441.5680(S) 0.4078.00.2415.3
40.331.581.42115(R) 0.4375.00.2515.7
50.351.461.5795(S) 0.4374.80.2515.6
60.351.591.4185(R) 0.4971.60.2817.3
1 Sample slightly enriched with (S)-enantiomer (5.4% ee). 2 YE: Yield of enantiomer; YE(g) = [Yield × ee]/100 – 0.075; YE(%) = [YE(g) ×100]/Operation amount of (R)- or (S)-1.

