Research on Local Sound Field Control Technology Based on Acoustic Metamaterial Triode Structure

Shanxi Provincial Key Laboratory for Biomedical Imaging and Big Data, North University of China, No. 3 Xueyuan Road, Taiyuan 030051, China
*
Author to whom correspondence should be addressed.
Crystals 2020, 10(3), 204; https://0-doi-org.brum.beds.ac.uk/10.3390/cryst10030204
Submission received: 11 February 2020
/
Revised: 8 March 2020
/
Accepted: 12 March 2020
/
Published: 16 March 2020
(This article belongs to the Special Issue Design, Characterization, and Application of 2D Materials)
Abstract
:Cell photoacoustic detection faces the problem where the strength of the sound wave signal is so weak that it easily gets interfered by other acoustic signals. A sonic triode model based on an artificial periodic structure is designed by COMSOL Multiphysics 5.3a software (Stockholm, Sweden), and software simulations are conducted. Experiments show that when a sound wave with a specific frequency is input by the sound wave triode, it can produce an energy amplification effect on the sound wave signals of the same frequency and a blocking effect on the sound wave signals of other frequencies. This contrast effect is more obvious after increasing the sound pressure intensity of the input sound wave signal. It can effectively filter out interference sound signals. The study of the acoustic triode model provides a new approach for the acquisition and identification of acoustic signals in cell photoacoustic detection, which can significantly improve the working efficiency and accuracy of cell photoacoustic detection.
1. Collection of High-Frequency Acoustic Signals
1.1. High-Frequency Acoustic Signal in Cell Photoacoustic Detection
The collection of high-frequency acoustic signals has always been the focus of attention in modern medical activities. Especially in cell photoacoustic detection, an important factor limiting its development is the effective acquisition of high-frequency acoustic signals. Cell photoacoustic detection refers to the use of high-energy laser pulses to stimulate cells and cause them to expand thermally, thereby generating ultrasonic waves of a specific frequency.
The characteristics of cells can be analyzed by collecting ultrasound signals. They are different from the characteristics of ultrasonic waves produced by different cells, and at present, cell photoacoustic detection is widely used in tumor examination. For example, the application of photoacoustic detection technology in the detection of breast cancer cells can realize the early detection of breast cancer [1,2,3]. Lv et al. studied the application of in vivo photoacoustic imaging in the dynamic monitoring of the early stages of ischemic stroke and proposed a highly sensitive in vivo photoacoustic imaging model [4]. Qian et al. proposed a guided surgery method based on photoacoustic imaging to achieve tumor resection [5]. Lu et al. proposed a photoacoustic contrast agent based on functional peptide-modified gold nanoparticles for the problems of the photoacoustic imaging of bacterial infections [6].
1.2. The Problem of Acquisition for High-Frequency Acoustic Signal
The ultrasonic sound pressure generated by a pulsed laser is very low because the volume of the cell itself is small. Meanwhile, obvious energy loss will occur during the transmission of ultrasonic signals.
This feature determines the difficulty of the photoacoustic detection of cells. The main improvement method to observe weak acoustic signals is developing a new type of contrast agent. However, this method cannot fundamentally solve the problem of acoustic signal acquisition in the photoacoustic detection of cells [7,8,9,10].
The difficulties in achieving acoustic signal detection of cell photoacoustic detection are as follows:
First, the intensity of the ultrasonic signal produced by photoacoustic detection is low, making it difficult to detect the low-intensity acoustic signal by existing technical means. The frequency of the sound wave produced by the photoacoustic detection of cells is not fixed. Different cells produce sound waves with different frequencies under the same condition.
Then, the acquisition of ultrasonic signals is disturbed by the surrounding environment. Especially in the photoacoustic detection of a specific cell, the surrounding cell will produce disturbing acoustic signals.
Finally, the acquisition of ultrasonic signals is limited by the ‘window time’. Photoacoustic detection uses a high-energy laser pulse to act on the cell for a long time, which will cause harm to the human body or cell. Effective ultrasonic signals can only be acquired in a specific period of time.
Overall, we need to design a new model that can simultaneously achieve the directional transmission of sound waves and the enhancement of the local sound field to solve the application drawbacks of photoacoustic detection technology.
2. Concept and Assumption of Sonic Transistor
Researchers have developed acoustic diodes with similar functions based on unidirectional conductivity semiconductors [11]. Cheng et al. at Nanjing University proposed a nonlinear system with the acoustic diode phenomenon in 2009, and successfully produced related samples in 2010. However, current research on the acoustic triode is still lacking [12,13].
The triode is a semiconductor device that controls current, and the most important role of it is to amplify a weak signal into an electric signal with a larger amplitude. Amplification of acoustic energy is the focus of acoustic research. The general sound energy amplification method is continuous amplification. This method improves the detection efficiency of the acoustic signal. However, people need to capture the sound wave signal for a specific period of time in cell photoacoustic detection, which is referred to herein as ‘window time’. The energy intensity should be reduced as much as possible for sound signals outside the ‘window time’ to improve the efficiency of receiving an effective acoustic signal.
We need to design a new model with the acoustic wave amplification function to meet the needs of cell photoacoustic detection, which can amplify the sound wave signal within the ‘window time’ and minimize the interference the other sound wave signals may bring. This functional requirement is similar to that of a triode—when the model inputs a specific sound wave, the sound wave is locally enhanced. In addition, when sound waves of other frequencies are input, the attenuation effect is produced. This article calls it ‘sonic triode’. Due to the special application of an acoustic metamaterial in the regulation of acoustic waves, this article plans to design an acoustic triode based on an acoustic metamaterial that can meet the needs of photoacoustic detection.
3. Design of Sonic Triode Model
After years of development, research on acoustic metamaterials has made great breakthroughs and has been applied in some fields. Acoustic metamaterials have a very good role in sound wave regulation and also have a good local sound field enhancement effect. They are good materials for the design of a sonic triode. The theoretical research on acoustic metamaterials currently focuses on one-dimensional structures, and their application effect research mainly focuses on two-dimensional structures [14,15,16].
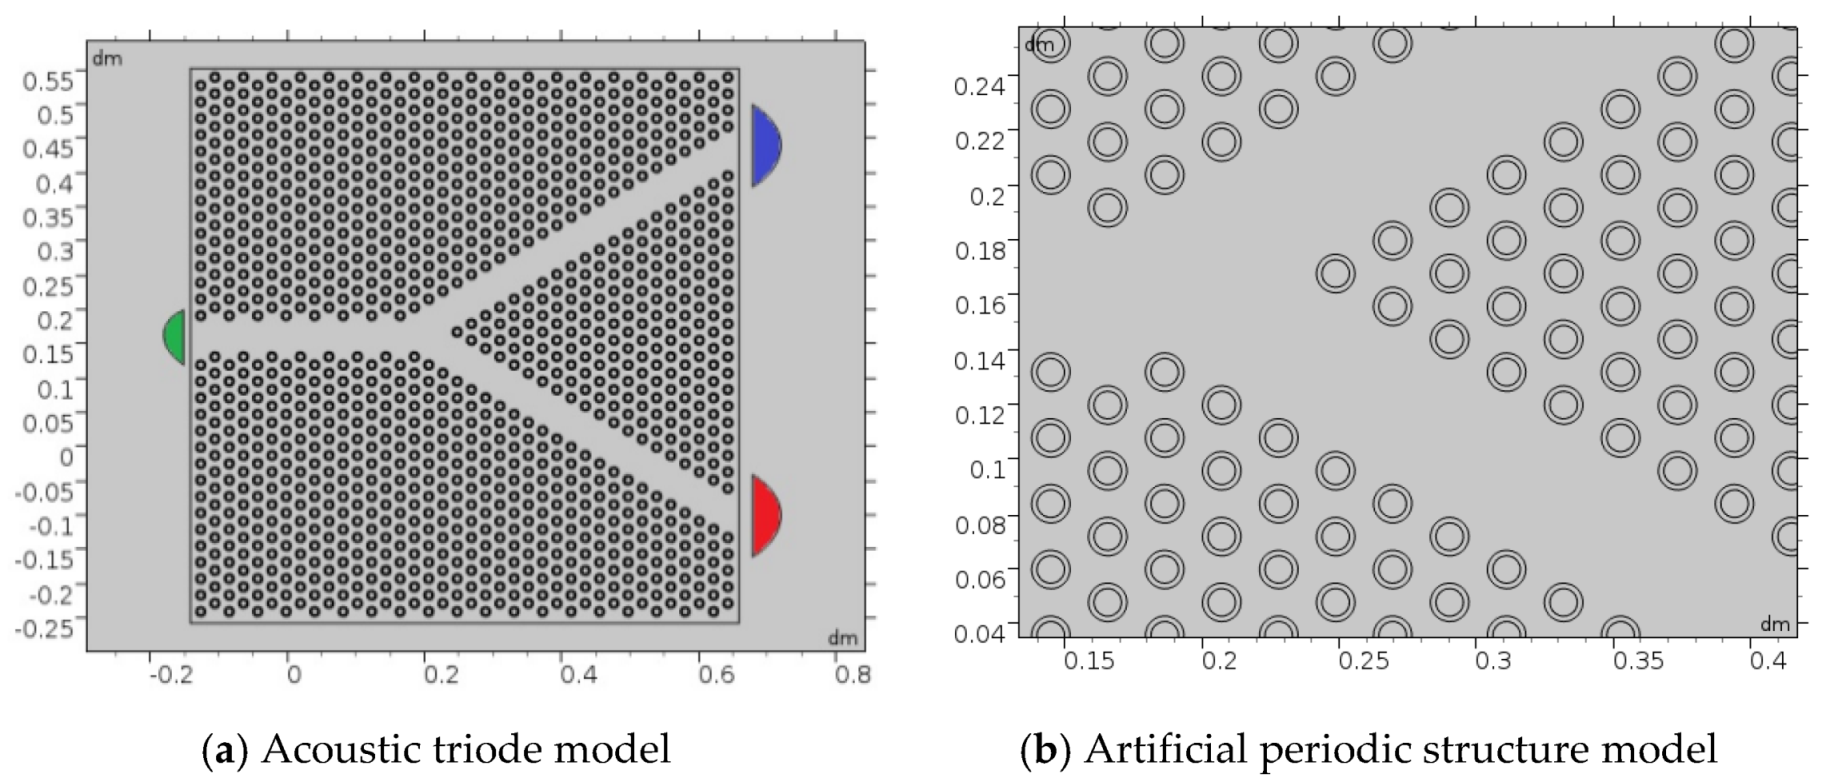
In the process of sound wave transmission, there is a serious energy loss phenomenon [17,18,19,20]. We design the sonic triode by using the artificial periodic structure to overcome this problem, as shown in Figure 1:
Figure 1b is a local enlarged view of the center position of Figure 1a for observing the details of the structure. The artificial periodic structure in Figure 1b adopts the double-layer structure. The double-layer structure is a simplified acoustic metamaterial. It can achieve efficient transmission of sound waves and has a band gap effect. It can achieve the effect of local sound field enhancement by periodically arranging the acoustic metamaterial [19]. The outer layer of the structure is rubber, with a thickness of 0.2 mm. In addition, the inner structure is steel, and the size is 0.5 mm. The sonic triode model, as shown in Figure 1a, is formed on the rubber base by arranging the double-layer structure. The overall size of the model is 8 cm × 8 cm. The green dot on the left in Figure 1a is the signal output terminal, which is used to collect acoustic signals.
The blue point on the right side is the excitation point, which is used to input the weak sound wave signal (this type of sound wave signal is referred to as the ‘main signal’); the red point is the switching point, and other signal sources such as sound wave probes are placed.
The blue point inputs a weak sound wave signal in the process of application. In addition, the red dot inputs the sound wave signal at the same time. The weak sound wave signal can be amplified or shielded by changing the frequency or phase of the red point sound wave signal.
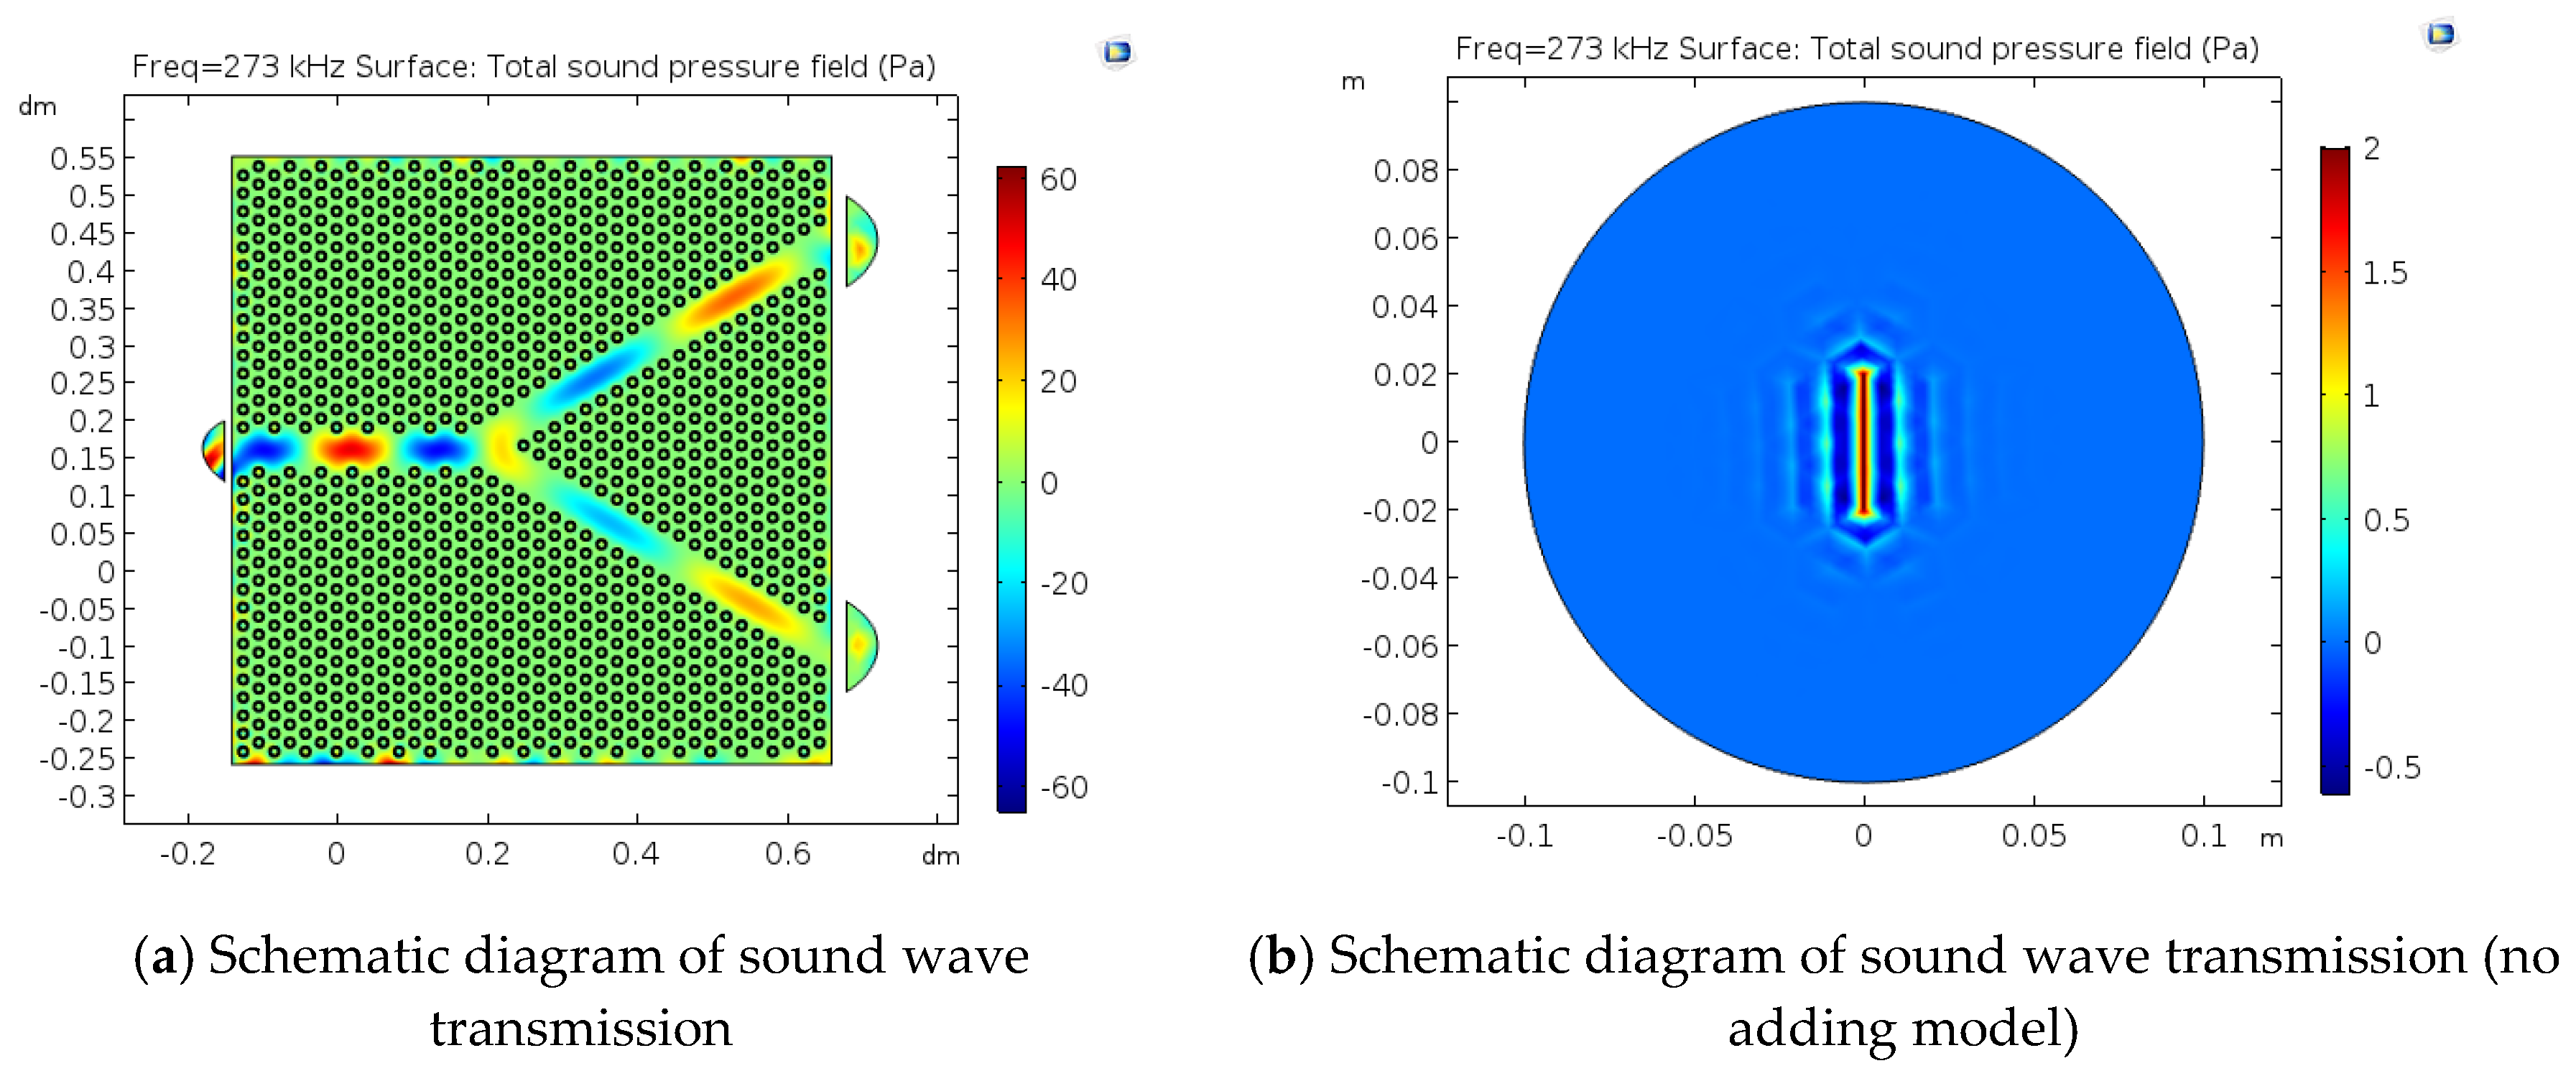
Two sound sources are placed at the red and blue points in Figure 1a. Their acoustic characteristics remain the same—the sound wave frequency is 273 kHz and the sound pressure is 2 Pa. The effect diagram shown in Figure 2 was obtained through software simulation:
Figure 2b is the transmission phenomenon of sound waves without adding a model. The red and blue colors in Figure 2a,b indicate the sound pressure in different directions. The darker the color, the higher the sound pressure. The sound pressure value inside the sound wave transmission channel can reach 20 Pa. It can be found that the sound wave energy in the sound wave channel has been greatly improved, and the defect of the sound wave transmission energy loss has been overcome well.
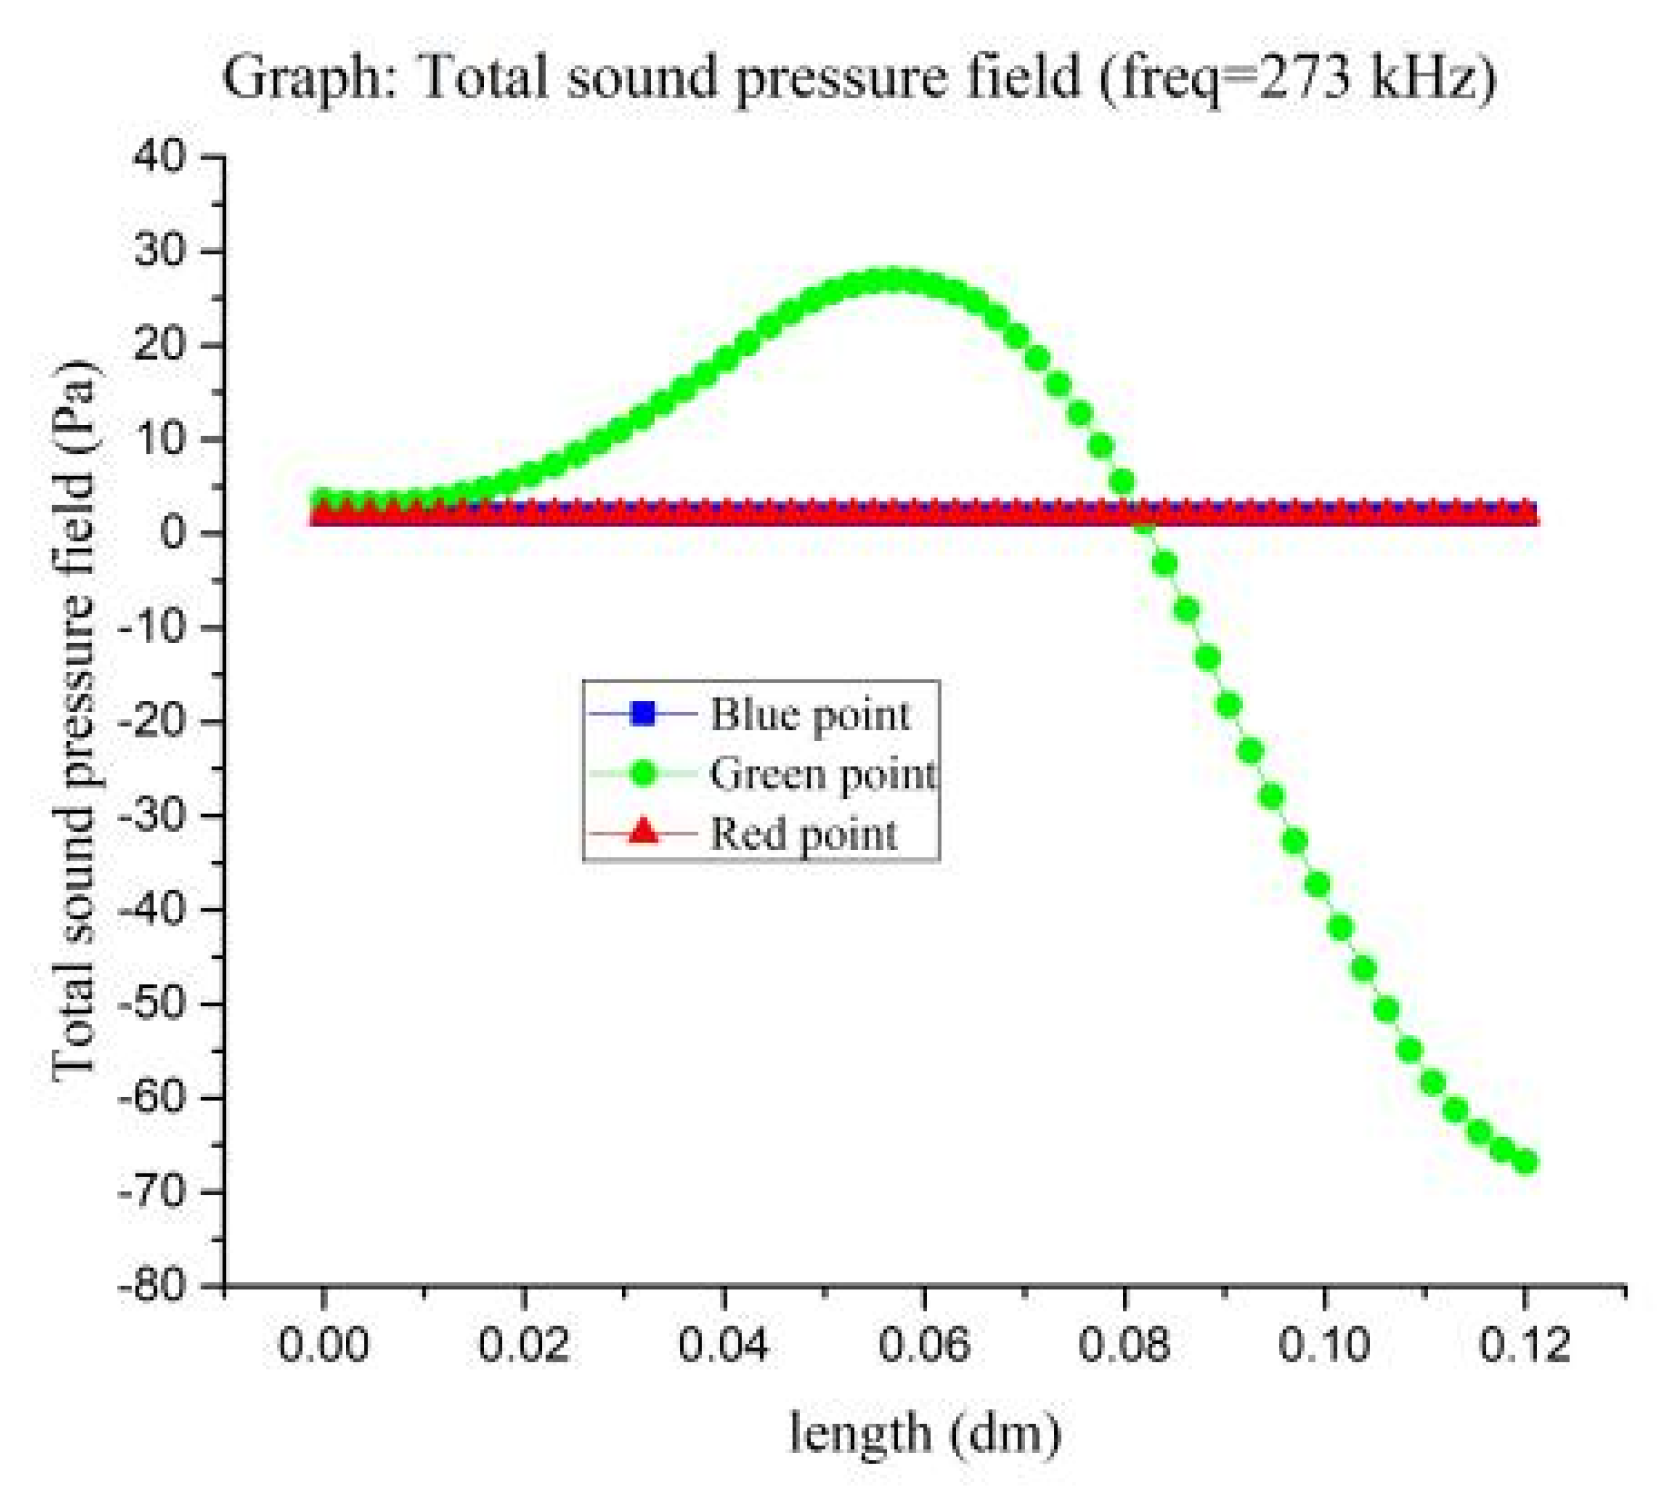
Further observation in Figure 2a shows that, for the sound pressure of the sound wave in the channel of the output, the green point in Figure 1a is higher, which can reach 60 Pa. This is because the red and blue points in Figure 1a input sound waves with exactly the same frequency and phase. When both are transmitted to the output channel, an enhanced effect occurs. This result proves that the acoustic triode has the effect of sound energy enhancement. In this paper, we record the blue, red, and green points in Figure 1a and the changes in sound pressure, and we plot the sound pressure curve in Figure 3:
The abscissa of Figure 3 represents the length of the selected point, and the ordinate of Figure 3 represents the sound pressure value of the selected point. The result in Figure 3 is consistent with the observation phenomenon in Figure 2 and also proves that the acoustic triode designed in this paper has a local energy enhancement effect of acoustic waves at a specific frequency. The local sound field enhancement effect of the model can solve the problems of low sound pressures and acoustic energy transmission loss in the photoacoustic detection process of cells.
4. Test and Analysis of Acoustic Triode Model
Figure 2 and Figure 3 prove that the sonic triode has the characteristics of sonic lossless transmission and directional transmission. Subsequent software simulation was carried out in this paper to achieve the amplification of the main signal within the ‘window time’.
4.1. Amplification Function of Sonic Triode
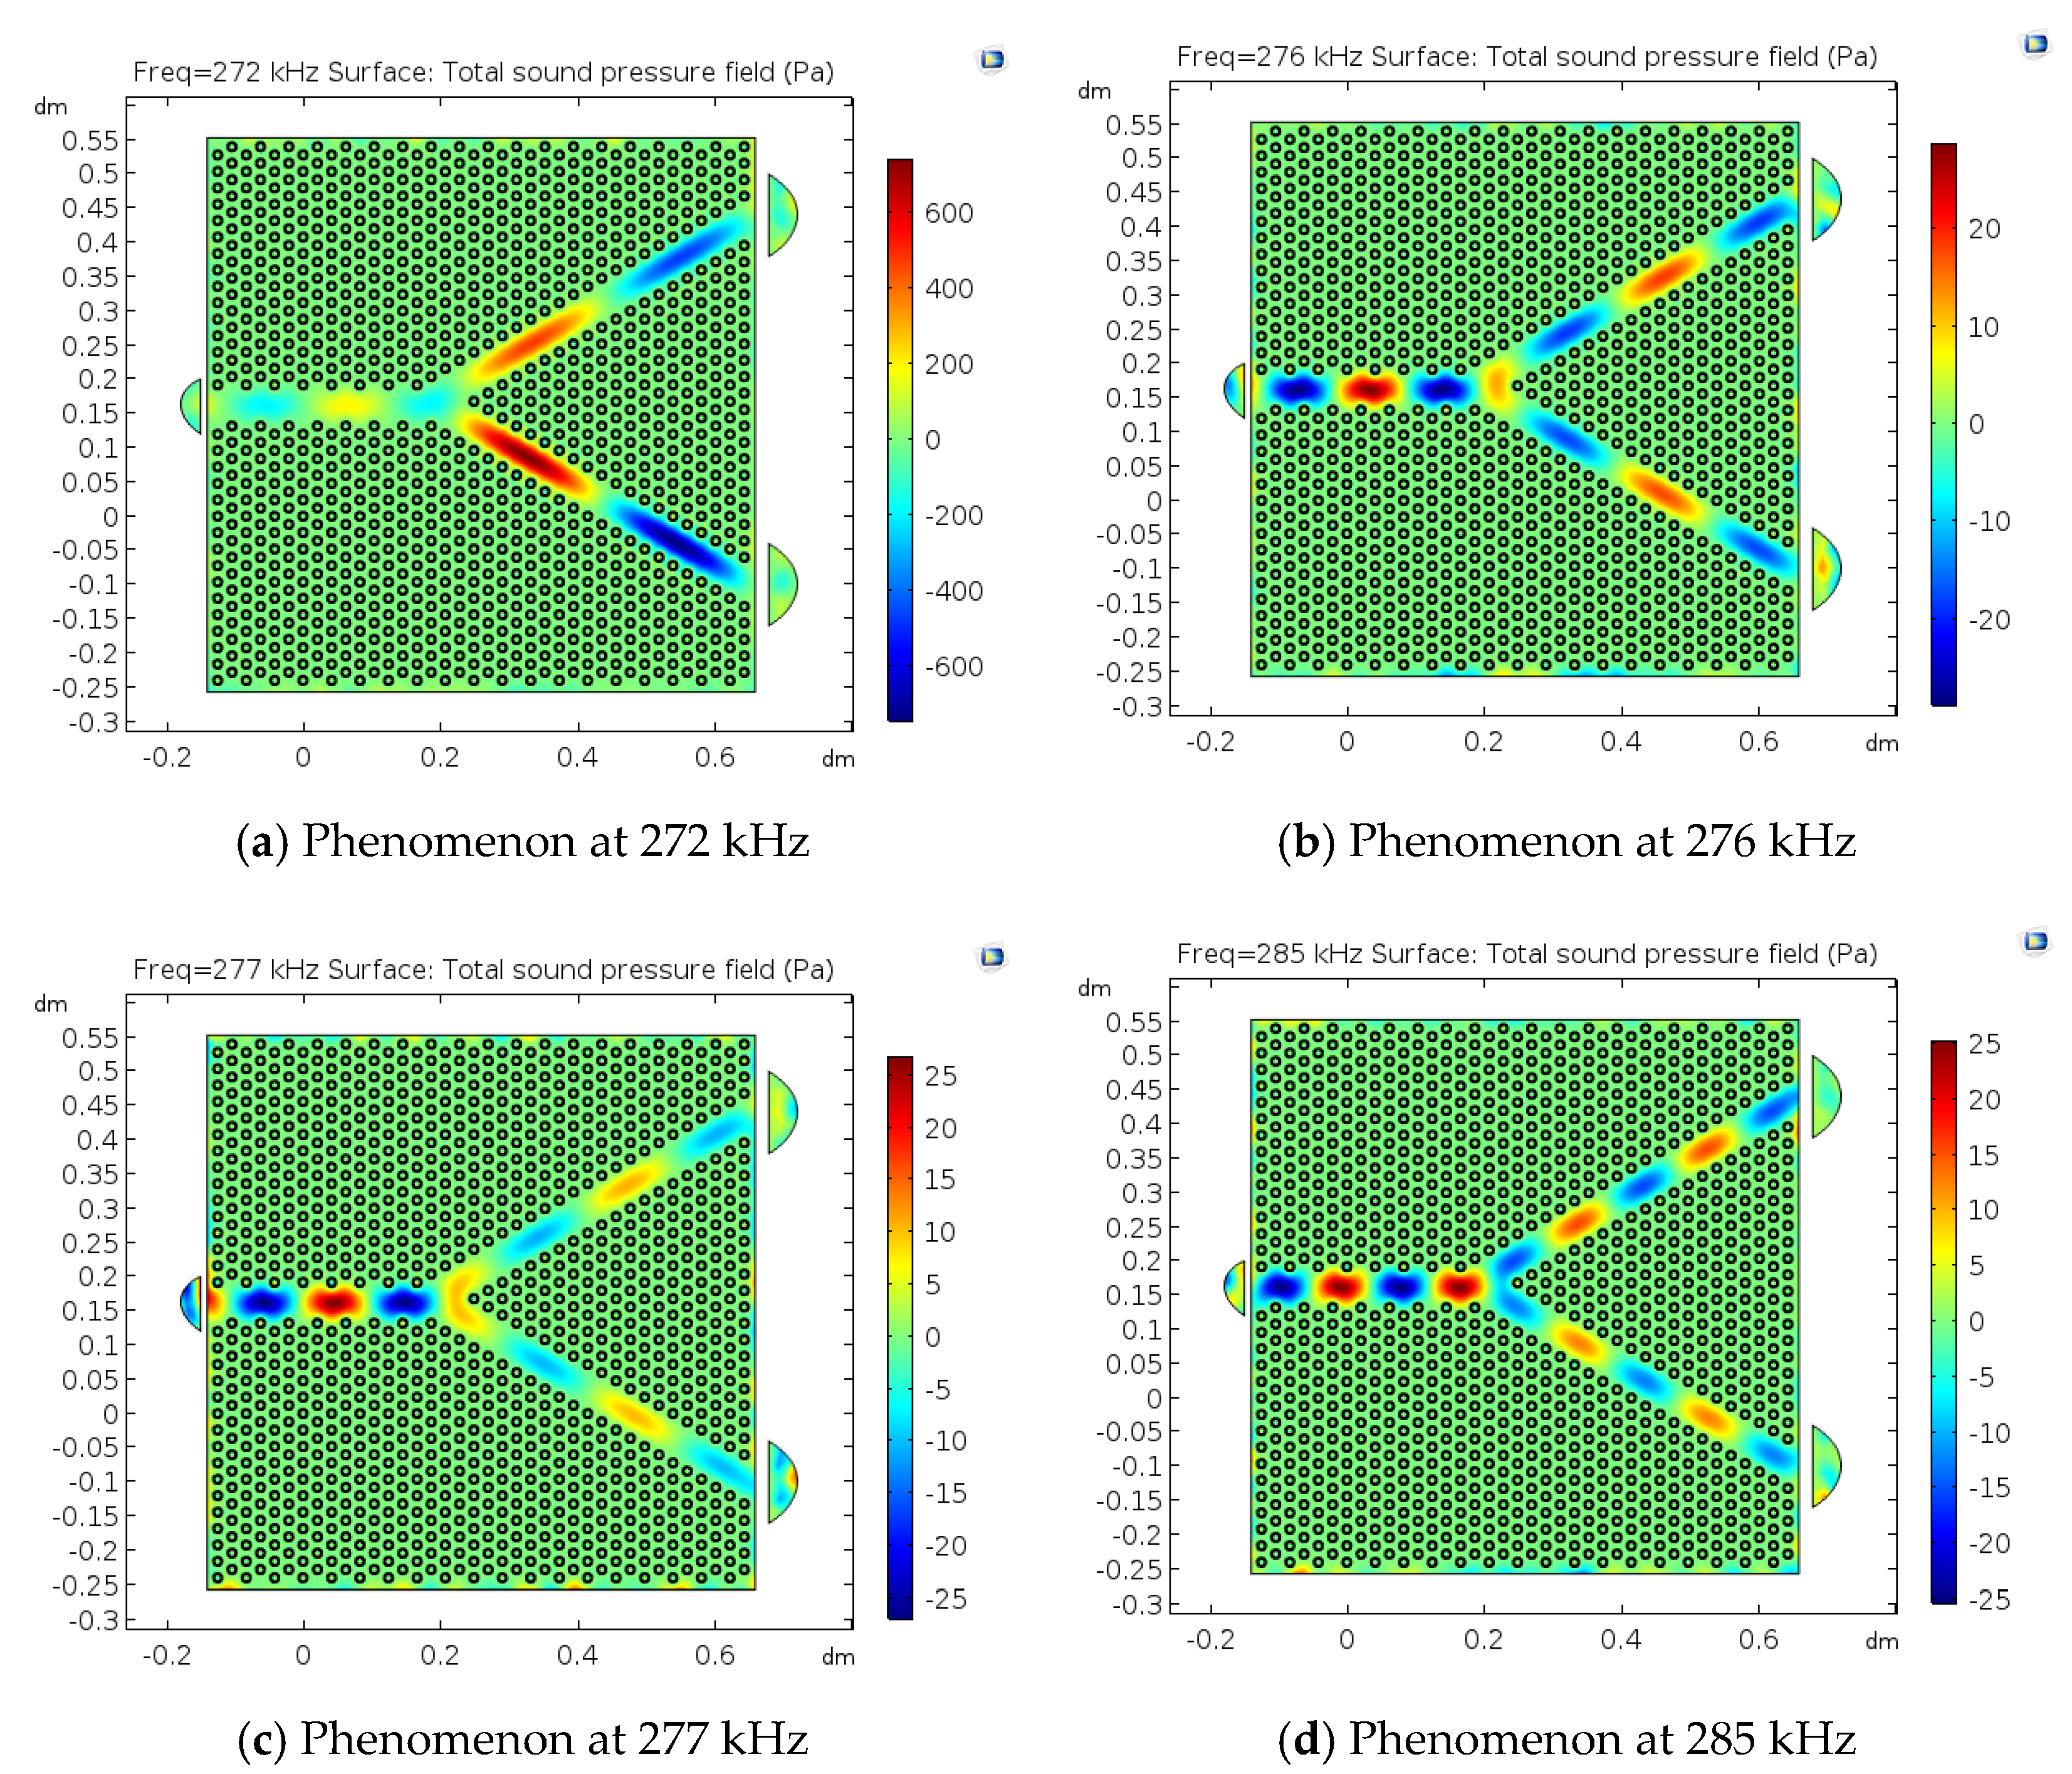
We cannot fix the frequency of the sound wave produced in the photoacoustic detection of cell. To achieve the amplification of the main signal in the ‘window time’, it is necessary to realize the lossless directional transmission of the model for the sound waves of different frequencies. A number of different frequencies are selected and the acoustic wave transmission simulation is performed in this paper. The simulation method is consistent with that in Figure 2. The sound source frequency and sound pressure of the sound source at the excitation point and the switching point are consistent, and the effect diagram shown in Figure 4 is obtained:
Figure 4a–d are phenomenon diagrams of the model when the sound wave frequencies are 272, 276, 277, and 285 kHz, respectively. These prove that the model has a similar effect on sound waves of different frequencies, and they can all produce the similar sound wave transmission phenomenon as in Figure 2a. The transmission characteristics are consistent in the two branch channels of the Y channel. When the sound waves reach the intersection of the channels, the sound pressure value of the sound waves in the ‘output channel’ rises significantly. This phenomenon is consistent with the design of the sonic triode in this paper. When two input points are used to input sound waves with the same characteristics at the same time, the energy intensity of the sound waves will be greatly increased. This processing method can achieve a local sound field enhancement of weak acoustic signals and improve the efficiency of acoustic detection.
The frequency of ultrasonic waves emitted by different cells in photoacoustic detection is different. The model can produce similar effects on sound waves of different frequencies, which can meet the needs of the photoacoustic detection of cells.
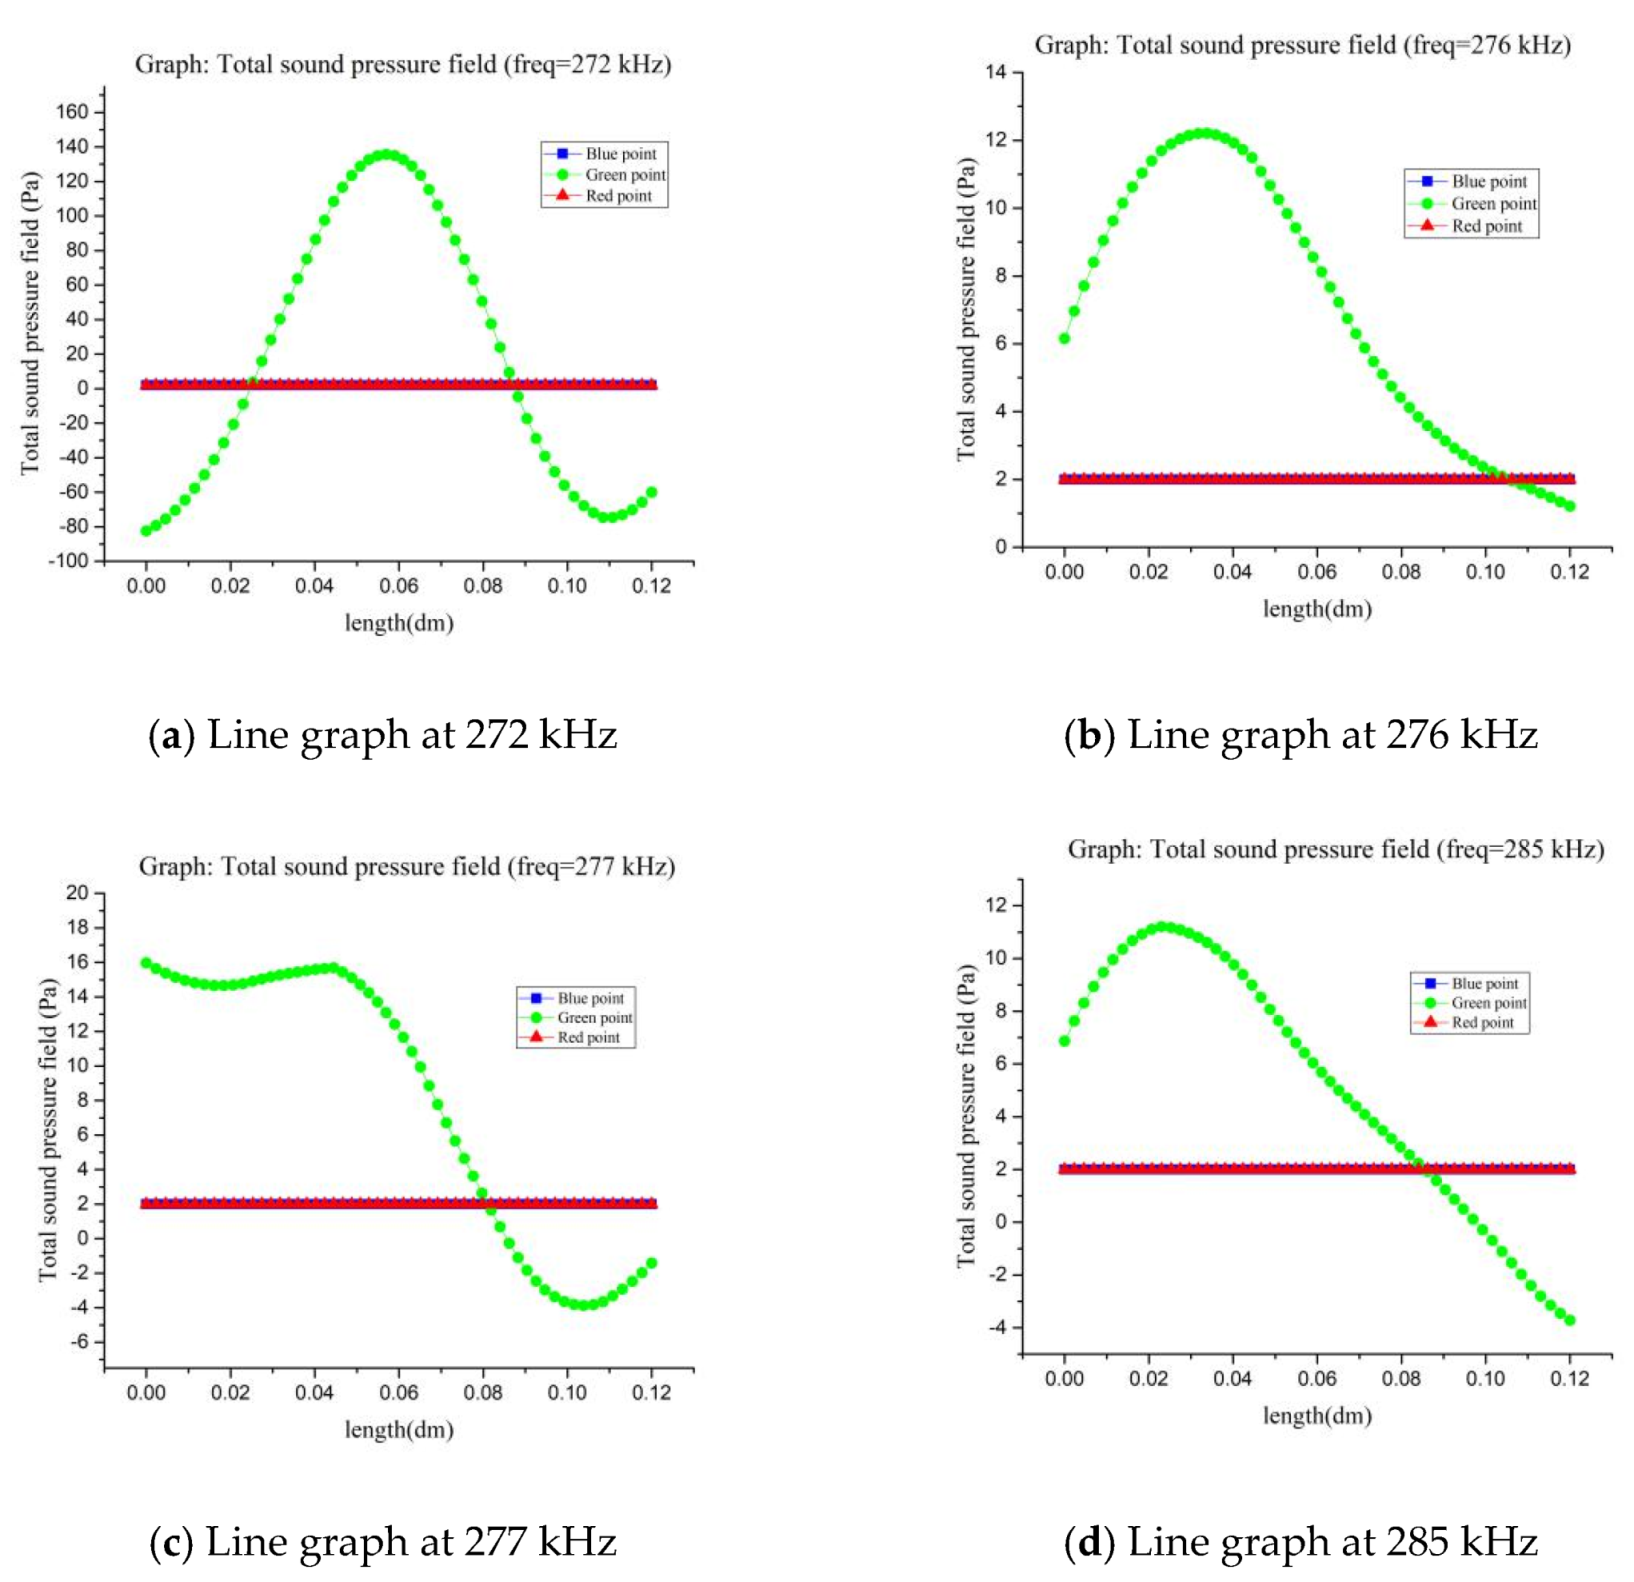
The sound pressure change diagram of the observation point of the sound wave frequency corresponding to Figure 4 is plotted to better observe the sound wave energy enhancement effect of the acoustic triode model, as shown in Figure 5:
It can be found that when the sound pressure of the sound source is maintained at 2 Pa, the sound pressure value of the collection point is increased to different degrees, but the effects are different. The sound pressure value of the sound wave increases by factors of 60, 6, 8, and 5 when the sound wave frequencies are 272, 276, 277, and 285 kHz, respectively. The increase in sound pressure of such sound waves may cause the model to be unable to enhance the local sound field of sound waves of a specific frequency. The acoustic triode needs to satisfy the local sound field enhancement of acoustic waves of different frequencies as much as possible. The resulting sound wave intensity in the photoacoustic detection of cells is low. The acquisition of acoustic signals cannot be performed well if the local sound field enhancement effect of the model is too low. Therefore, the local sound field enhancement effect of the model needs to improve until the enhancement effect can meet the requirements of the acoustic signal acquisition.
Therefore, the sound pressure of the sound source at the switching point (the red point) was changed in this paper, which was raised to 20 Pa, and the simulation was re-performed.
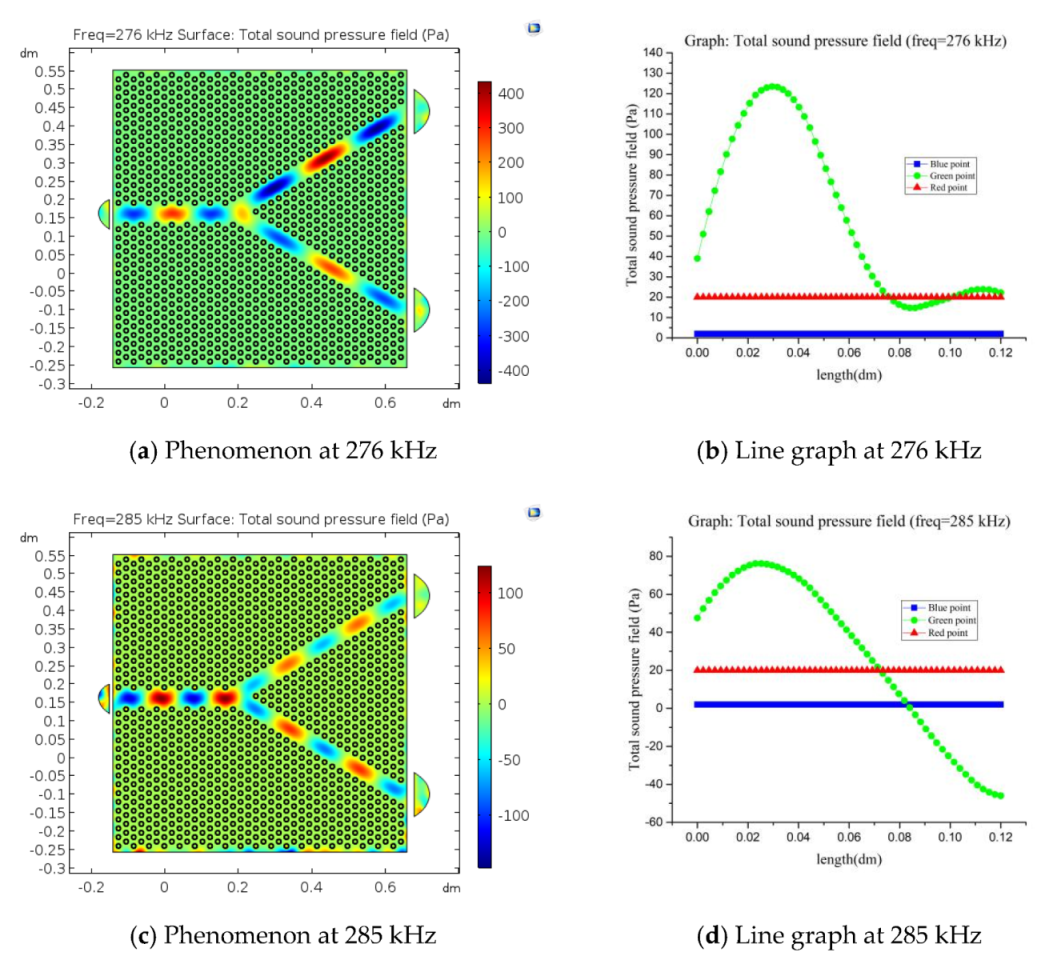
Figure 6a–d show the change in sound pressure at the acquisition point when the sound wave frequency is 276 and 285 kHz. Their sound pressures reach 120 and 70 Pa. Compared to Figure 4a,d, the sound pressure at the acquisition point has been significantly increased, reaching factors of 60 and 35, respectively. Therefore, this article considers that it is feasible to use the sonic triode to amplify the sonic energy.
However, the phenomenon of acoustic wave transmission loss will become more serious when the acoustic wave frequency increases, and the efficiency of the local sound field enhancement will also decrease. The input sound pressure at the switching point should be increased (the red point) to ensure the effective acquisition of the acoustic signal.
We can turn the acoustic wave transmitter at the switching point to achieve the amplification of acoustic energy within the ‘window time’ of acoustic signal acquisition when performing cell photoacoustic detection. In addition, the sound wave energy intensity will greatly decrease when the sound wave transmitter is turned off after the ‘window time’ is closed. The collected high-energy acoustic wave signal can be regarded as an effective photoacoustic detection signal. The distortion of the acoustic signal caused by the long acquisition time can be largely avoided by this method of detection.
4.2. Blocking Function of Sonic Triode
The purpose of designing a sonic triode in this paper is to exclude the interference of the clutter signal within the ‘window time’ in addition to the energy amplification of the main signal.
We obtain the ultrasonic wave excited by the cell. It will also carry sound waves of other frequencies due to the influence of the surrounding environment. This sound wave is considered an interference signal. If we can weaken the interference signal within the ‘window time’, it will be very helpful to improve the efficiency and reliability of photoacoustic detection.
A transient software simulation was performed based on the above models. The experimental method involves fixing the frequency of the acoustic wave at the excitation point at 270 kHz, and changing the acoustic wave characteristics of the switching point.
4.2.1. Research on the Possibility of Phase Interference Filtering Clutter
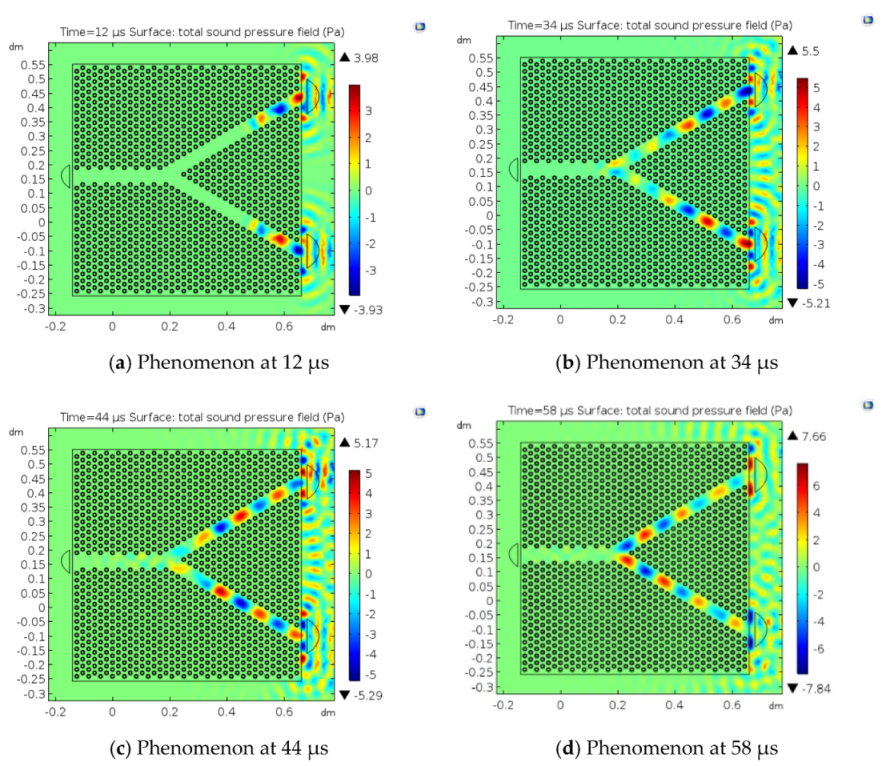
This article first changed the phase of the acoustic wave at the switching point. Its acoustic wave frequency is 270 kHz, but the phase of the acoustic wave is opposite to the excitation point. The sound pressure of both is maintained at 2 Pa. As shown in Figure 7:
Figure 7a–d show the internal sound pressure distributions of the model at 12, 34, 44, and 58 µs, respectively. It can be found that the sound waves with different phases will maintain the same transmission characteristics inside the model. However, the sound pressure distribution directions of the excitation point channel and the switching point channel at the same time are completely opposite. This phenomenon corresponds to the preset sound source settings.
Figure 7c is very similar to Figure 7d. This phenomenon illustrates the phenomenon of mutual interference between sound waves with different phases. Sound waves with the same frequency and opposite phases ‘cancel each other’ at the intersection. This phenomenon proves that the model has the basis for utilizing phase interference sound wave transmission.
4.2.2. Analysis of the Method of Phase Interference Filtering Clutter
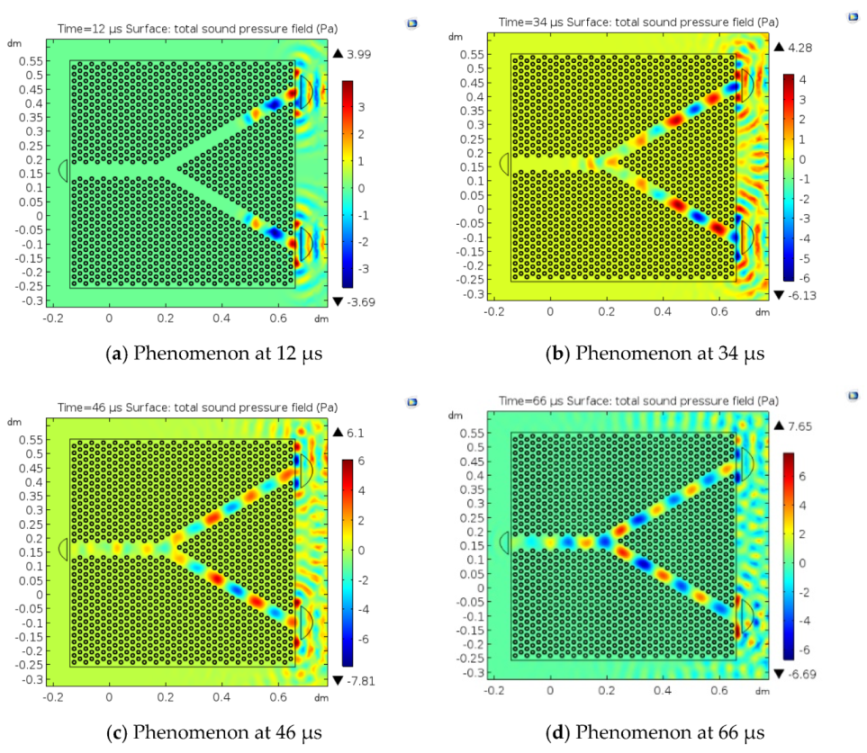
The above experiment proves the feasibility of using the opposite-phase sound wave to filter out the interference sound wave, but in actual detection, it is impossible to know the ultrasonic frequency emitted by the cell in advance. Therefore, it is necessary to study the interference effect of sound waves of a specific frequency on sound waves of other frequencies. This paper has carried out research based on the above experiments. The sound wave frequency of the switching point is fixed at 270 kHz, and the sound wave frequency of the excitation point is then changed to study the effect of the fixed frequency sound wave on the interference sound wave signal, as shown in Figure 8:
Figure 8a–d show the sound pressure distribution of the model at 12, 34, 46, and 66 µs, respectively. It can be found that due to the change in the acoustic wave frequency of the excitation point, the sound pressure phenomena inside the excitation point channel and the switching point channel are not exactly the same. When the two sound waves reach the intersection, they will still converge. However, this phenomenon is obviously weaker than the effects in Figure 4 and Figure 6.
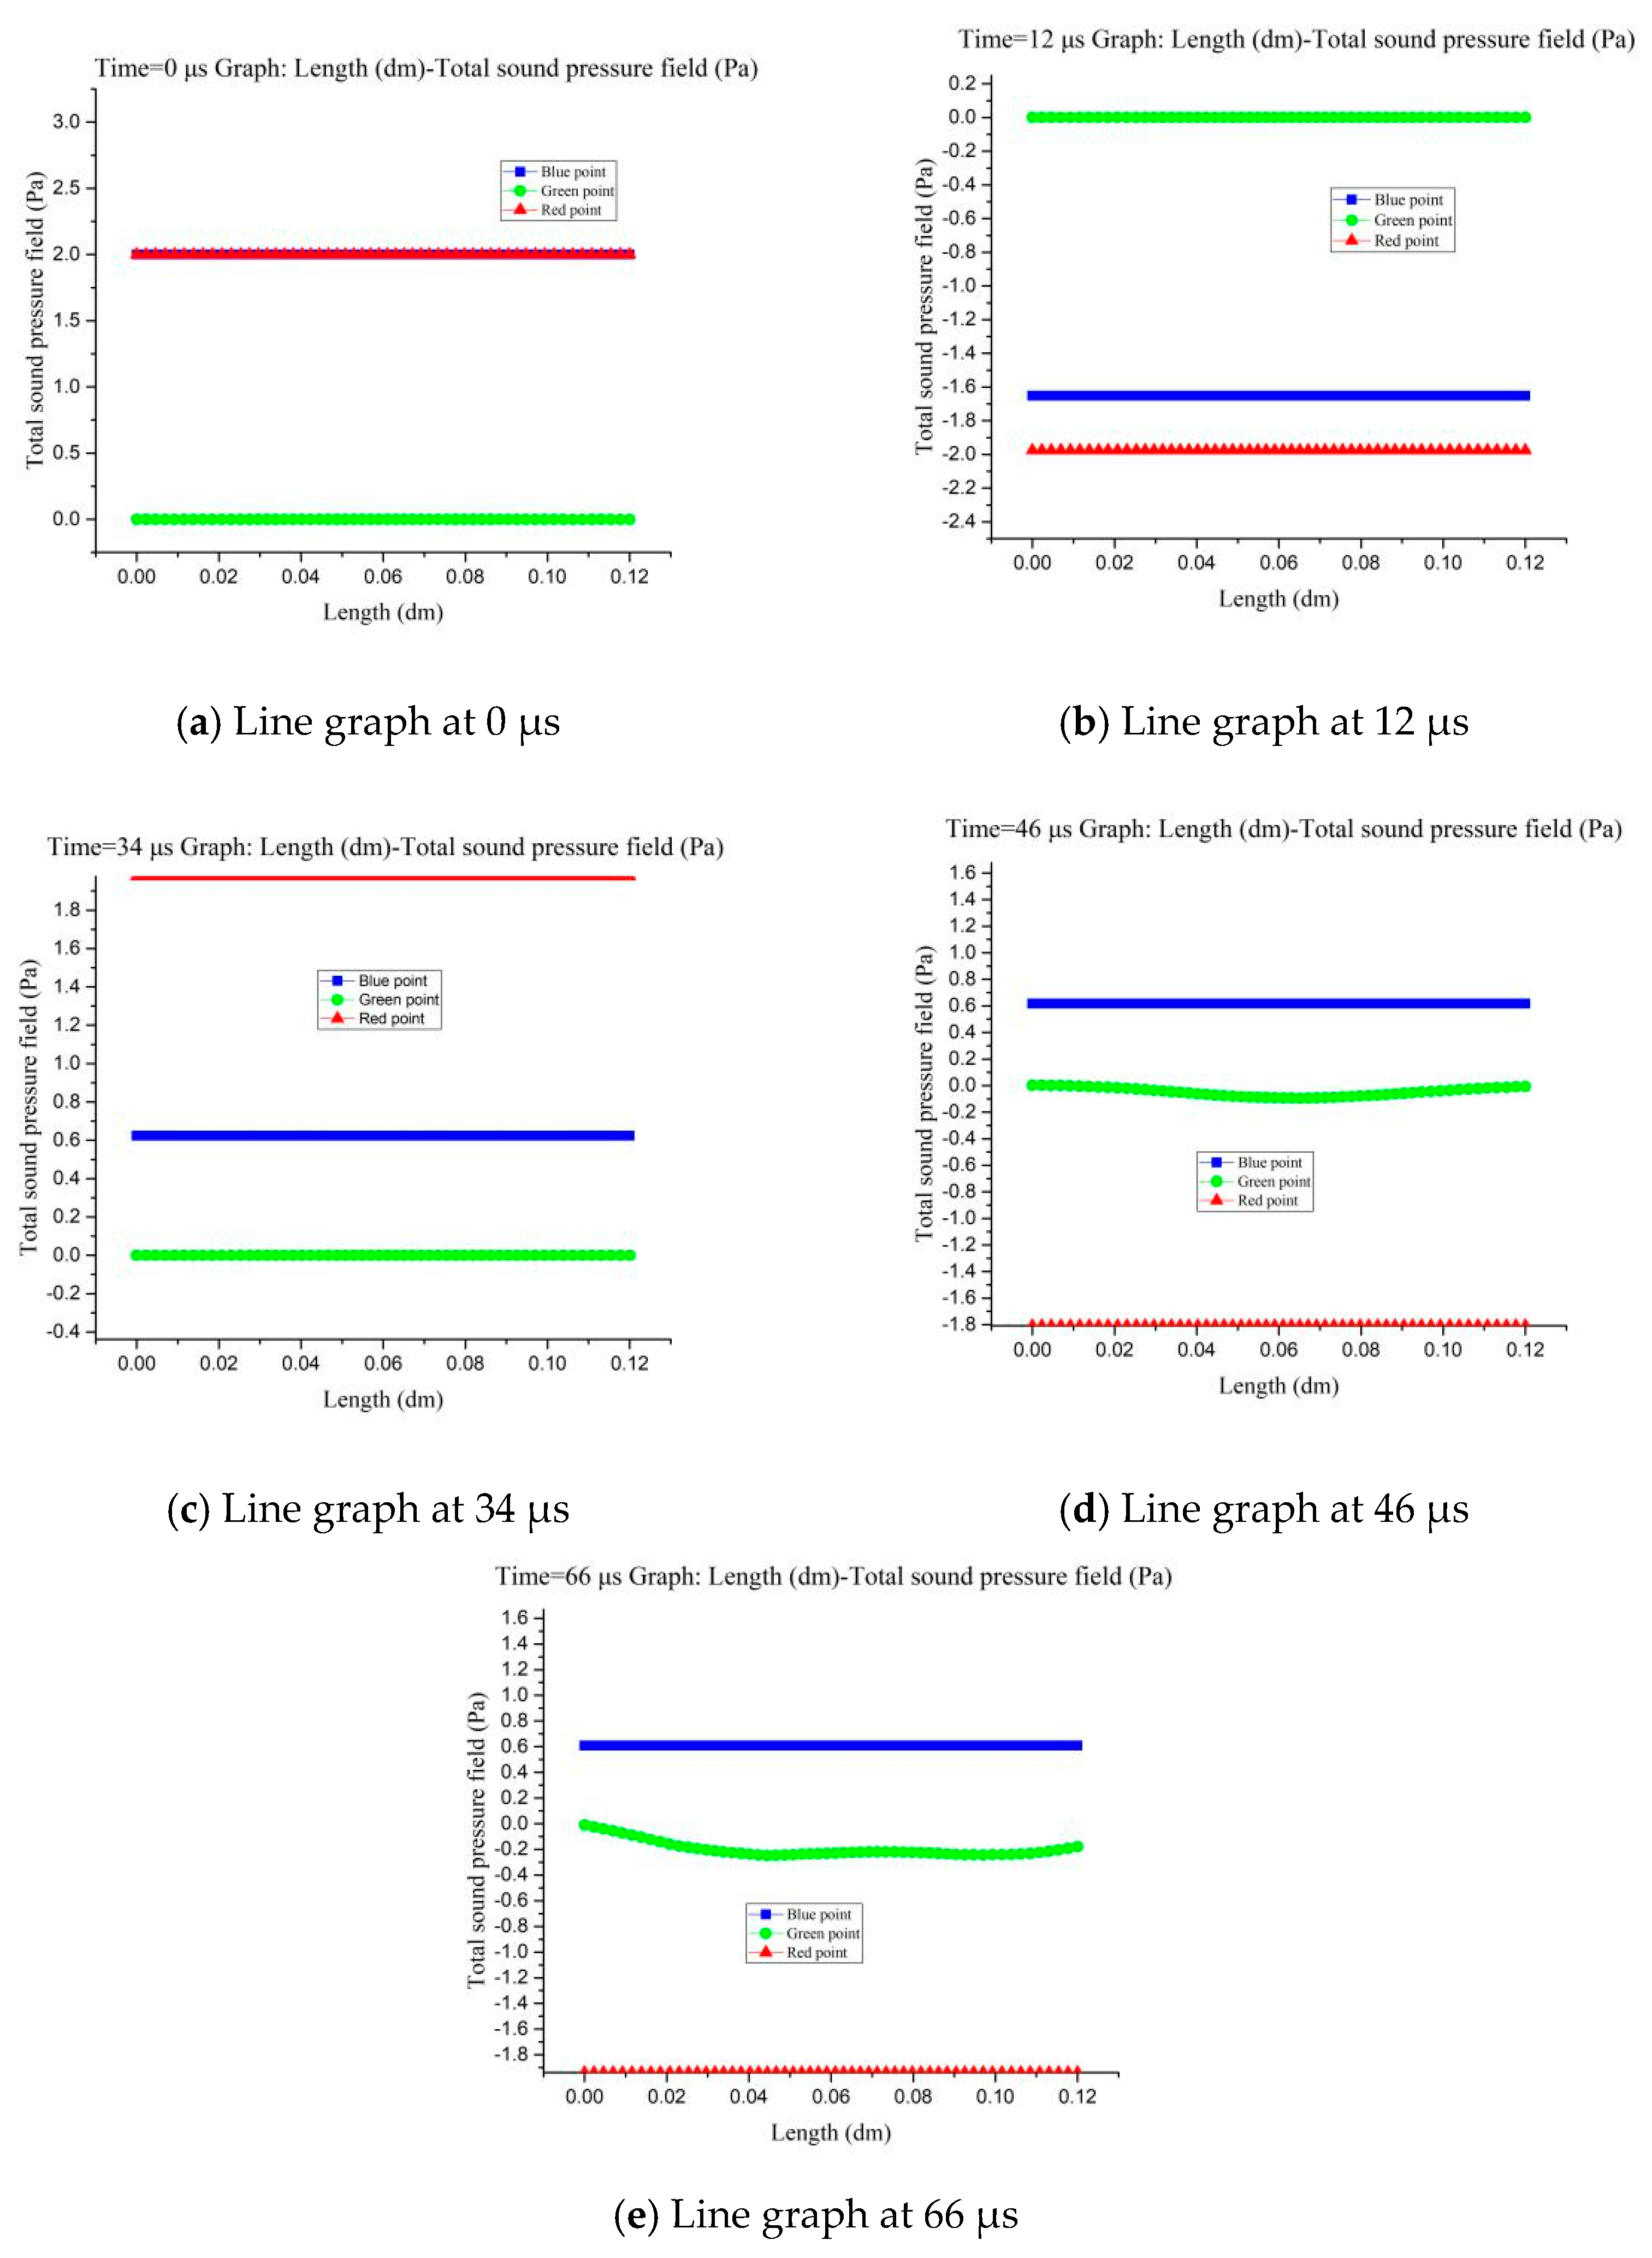
This paper draws the sound pressure change curve of the collection point at the corresponding time, and draws the sound pressure map at the initial time for comparison to further verify the effect of phase interference filtering clutter, as shown in Figure 9:
Figure 9a–e are the sound pressure change distributions at three observation points at 0, 12, 34, 46, and 66 ns, respectively. The sound pressure values at the collection point are 0, 0, 0, 0.1, and 0.2 Pa, respectively. It can be found that the initial sound pressure of the excitation point and the switching point is maintained at 2 Pa. In Figure 9d,e, the sound pressure has been detected at the acquisition point. However, the sound pressure at the collection point did not increase, unlike Figure 5 (10 Pa: 0.2 Pa), but the sound pressure at the excitation point decreased, achieving the effect of blocking sound waves.
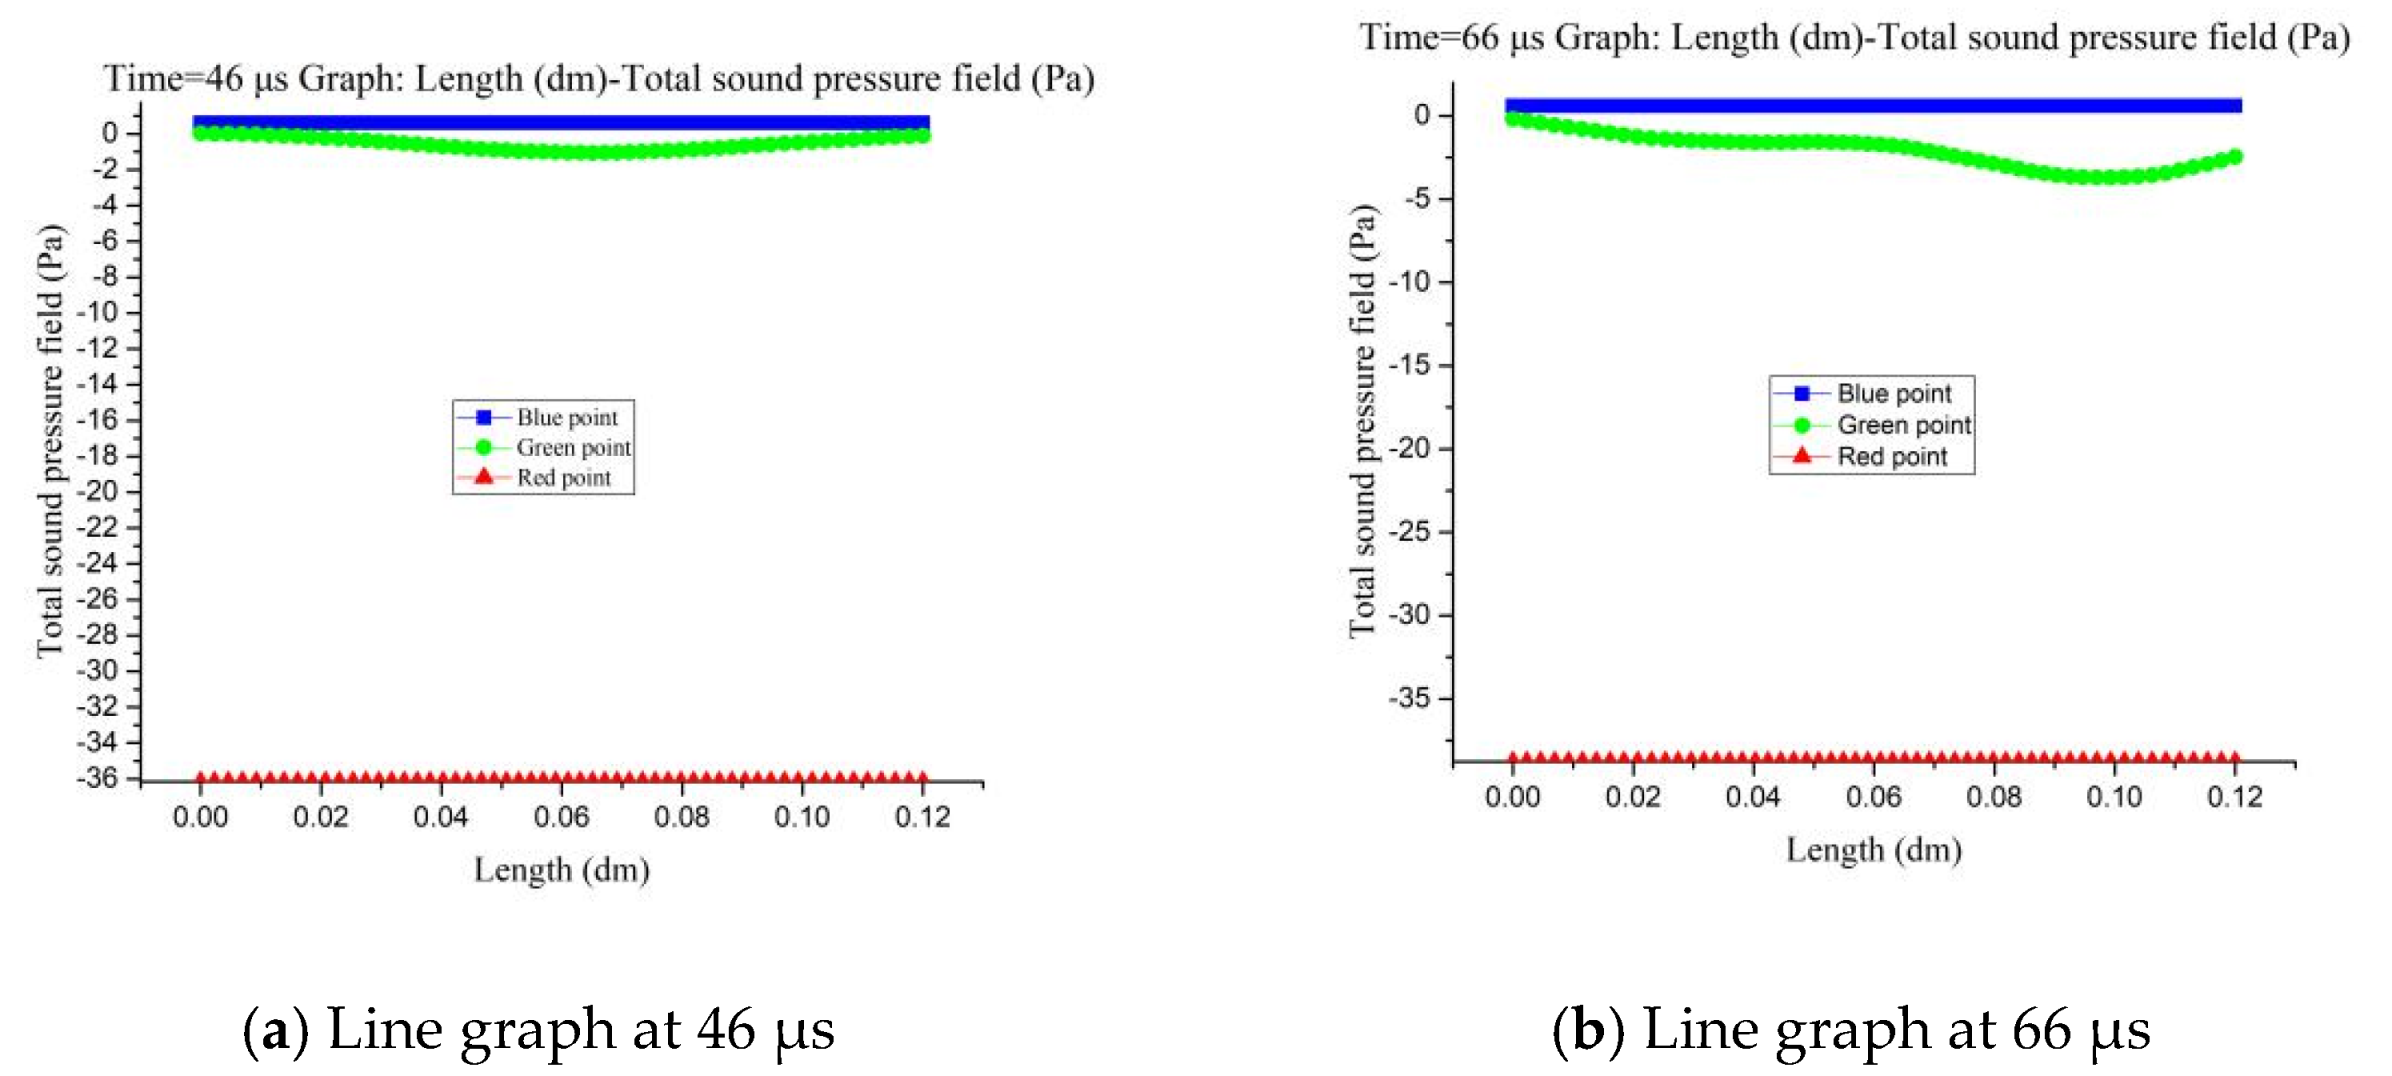
The sound pressure at the switching point was increased to 20 Pa to further observe the acoustic wave blocking effect of the model. In addition, the acoustic wave frequency remained unchanged, software simulation was performed again, and the effect diagram shown in Figure 10 was obtained:
It can be found that the sound pressure of the acoustic wave at the switching point increased (referred to herein as ‘boost signal’) by comparing Figure 6b, Figure 6d, Figure 9d, Figure 9e and Figure 10. After that, the sound pressure of the interference signal at the collection point also increased. This kind of lifting has a good effect on identifying interference signals.
The intensity difference between the main signal and the interference signal is very weak before the sound pressure is amplified. This slight difference places high demands on the sensitivity of the ultrasonic transducer. Through the role of the acoustic triode, the intensity difference between the main signal and the interference signal can reach tens of times. As shown in Figure 10b, the interference signal with a sound pressure intensity of 2 Pa can maintain the sound pressure intensity of 2 Pa under the effect of the ‘boost signal’, but the sound pressure intensity of the main signal in Figure 6b can reach tens or hundreds of Pascals. This strong signal strength difference can clearly distinguish the main signal, thereby obtaining the acoustic parameters of the main signal. Therefore, we can use ordinary ultrasonic transducers to collect and analyze the acoustic signals, which reduces the cost of photoacoustic detection. In addition, this phenomenon is also beneficial to analyze the characteristics of the interference signal and supplement the content of photoacoustic detection.
4.3. Working Method of Sonic Probe of Sonic Triode
Through software simulation, it is proved that the designed sonic triode has the effect of simultaneously realizing sonic wave amplification and sonic wave blocking. Considering the particularity of cell photoacoustic detection, the application method of the sonic triode is studied in this paper:
- (1)
- When the frequency of the ultrasonic wave emitted by the cell is unknown, the sonic probe at the switching point should use the frequency sweeping method for sonic emission. The intensity comparison will be more obvious under the ‘energy increase’ of the switching point acoustic signal due to the difference in the strength of the main signal and the interference signal. The strongest sound wave signal should be regarded as the main signal, and its frequency is the sound wave frequency of the main signal. The subsequent sound wave emission frequency of the switching point should be adjusted to be the same as the main signal frequency to achieve the effect of filtering out clutter.
- (2)
- The time for signal acquisition should be set to avoid signal distortion caused by the continuous transmission of acoustic signals, called ‘window time’. The sonic probe is started within the ‘window time’ to improve the efficiency of sonic signal acquisition. If the ‘window time’ is exceeded, the sound wave probe is turned off, subsequent weak sound wave signals are regarded as interference signals, and no acquisition is performed.
5. Conclusions
The acoustic signal acquisition of cell photoacoustic detection has problems of insufficient acoustic wave intensity and signal interference. A model of a sonic triode based on the artificial periodic structure is designed and functions of the sonic energy enhancement and sonic blocking of the model are simulated.
Experiments show that transmitting acoustic waves with characteristic frequencies at the switching point of the acoustic triode can amplify the energy of the acoustic signal in photoacoustic detection. The amplification effect is related to the input sound wave intensity at the switching point, which can reach dozens or hundreds of times.
The acoustic wave at the switching point will block the interference signals of other frequencies at the same time. It can significantly increase the intensity gap between the main signal and the interference signal, and can meet the application of ordinary ultrasonic transducers in photoacoustic detection. This characteristic improves the effectiveness of the acoustic wave signal in photoacoustic detection. It can reduce the application cost of the photoacoustic detection technology and realize acoustic signal detection of the photoacoustic detection in an ordinary environment. This article summarizes the specific application methods of sonic triodes according to the characteristics of cell photoacoustic detection. These studies are very helpful for improving the efficiency and signal reliability of photoacoustic detection in cells.
Author Contributions
Writing—original draft preparation, P.Y.; writing—review and editing, J.W., R.Z. and J.H. All authors have read and agreed to the published version of the manuscript.
Funding
This work was supported in part by the “The National Natural Science Foundation of China, grant number 61671414”, and “The Postdoctoral Science Foundation of China, grant number 2017M611198”.
Conflicts of Interest
The authors declare no conflict of interest. The funders had role in the writing of the manuscript and in the decision to publish the results.
References
- Ku, G.; Maslov, K.; Li, L.; Wang, L.V. Photoacoustic microscopy with 2-micron transverse resolution. J. Biomed. Opt. 2010, 15, 021302-1–021302-5. [Google Scholar] [CrossRef] [Green Version]
- Song, W.; Zheng, W.; Liu, R.; Lin, R.; Huang, H.; Gong, X.; Yang, S.; Zhang, R.; Song, L. Reflection-mode in vivo photoacoustic microscopy with subwavelength lateral resolution. Biomed. Opt. Express 2014, 5, 4235–4241. [Google Scholar] [CrossRef] [Green Version]
- Foster, F.S.; Pavlin, C.J.; Harasiewicz, K.A.; Christopher, D.A.; Turnbull, D.H. Advances in ultrasound biomicroscopy. Ultrasound Med. Biol. 2000, 26, 1–27. [Google Scholar] [CrossRef]
- Lv, J.; Li, S.; Zhang, J.D.; Duan, F.; Wu, Z.; Chen, R.; Chen, M.; Huang, S.; Ma, H.; Nie, L. In vivo photoacoustic imaging dynamically monitors the structural and functional changes of ischemic stroke at a very early stage. Theranostics 2020, 2, 816–828. [Google Scholar] [CrossRef]
- Qian, Y.; Shanshan, H.; Zhiyou, W.; Jiadi, Z.; Xiaoyuan, C.; Liming, N. Label-free Visualization of Early Cancer Hepatic Micrometastasis and Intraoperative Image-guided Surgery by Photoacoustic Imaging Journal of nuclear medicine: Official publication. Soc. Nucl. Med. 2018. [Google Scholar] [CrossRef]
- Lu, S.Z.; Guo, X.Y.; Zou, M.S.; Zheng, Z.; Li, Y.; Li, X.; Li, L.; Wang, H. Bacteria-Instructed In Situ Aggregation of AuNPs with Enhanced Photoacoustic Signal for Bacterial Infection Bioimaging. Adv. Healthc. Mater. 2019. [Google Scholar] [CrossRef]
- Strohm, E.M.; Berndl, E.S.L.; Kolios, M.C. Probing red blood cell morphology using high frequency photoacoustics. Biophys. J. 2013, 105, 59–67. [Google Scholar] [CrossRef] [Green Version]
- Strohm, E.M.; Gorelikov, I.; Matsuura, N.; Kolios, M.C. Modeling photoacoustic spectral features of micron-sized particles. Phys. Med. Biol. 2014, 59, 5795–5810. [Google Scholar] [CrossRef]
- Needles, A.; Heinmiller, A.; Sun, J.; Theodoropoulos, C.; Bates, D.; Desmond, H.; Yin, M.; Foster, F.S. Development and initial application of a fully integrated photoacoustic micro-ultrasound system. IEEE Trans. Ultrason. Ferroelectr. Freq. Control 2013, 60, 888–897. [Google Scholar] [CrossRef]
- Ke, H.; Erpelding, T.N.; Jankovic, L.; Liu, C.; Wang, L.V. Performance characterization of an integrated ultrasound, photoacoustic, and thermoacoustic imaging system. J. Biomed. Opt. 2012, 17, 056010-1–056010-6. [Google Scholar] [CrossRef]
- Zhang, Y.; Yin, J.; Wen, J.; Yu, D. Low frequency vibration reduction design for inertial local resonance phononic crystals based on inertial amplification. J. Vib. Shock 2016, 35, 26–32. (In Chinese) [Google Scholar]
- Liang, B.; Yuan, B.; Cheng, J.C. Acoustic diode: Rectification of acoustic energy flux in one-dimensional systems. Phys. Rev. Lett. 2009, 103, 104301. [Google Scholar] [CrossRef]
- Liang, B.; Guo, X.S.; Tu, J.; Zhang, D.; Cheng, J.C. An acoustic rectifier. Nat. Mater. 2010, 9, 989–992. [Google Scholar] [CrossRef]
- Zhong, H.; Gu, Y.; Bao, B.; Wang, Q.; Wu, J. 2D underwater acoustic metamaterials incorporating a combination of particle-filled polyurethane and spiral-based local resonance mechanisms. Compos. Struct. 2019, 220, 1–10. [Google Scholar] [CrossRef]
- Zhang, S.; Zhang, Y. Broadband unidirectional acoustic transmission based on piecewise linear acoustic metamaterials. Chin. Sci. Bull. 2014, 59, 3239–3245. [Google Scholar] [CrossRef]
- Wu, J.; Ma, F.; Zhang, S.; Shen, L. Review on the application of acoustic metamaterials in low frequency vibration and noise reduction. J. Mech. Eng. 2016, 52, 68–78. [Google Scholar] [CrossRef]
- Han, J.; Tang, S. Acoustic propagation characteristics of heteromorphic metamaterials. AIP Adv. 2018, 8, 105305. [Google Scholar]
- Han, J.; Tang, S.; Wang, R.; Wang, W. Acoustic wave transmission channel based on phononic crystal line defect state. AIP Adv. 2019, 9, 065201. [Google Scholar] [CrossRef] [Green Version]
- Han, J.; Yang, P.; Tang, S. Local acoustic field enhancement of single cell photoacoustic signal detection based on metamaterial structure. AIP Adv. 2019, 9, 095064. [Google Scholar] [CrossRef] [Green Version]
- Cheng, Y. Acoustic artificial structure-based sound field regulation and related new principles of acoustic devices. In Proceedings of the 2018 National Acoustics Conference; Chinese Academy of Acoustics: Beijing, China, 2018. [Google Scholar]
Figure 1.
Sonic triode based on artificial periodic structure: (a) Acoustic triode model; (b) artificial periodic structure model.
Figure 1.
Sonic triode based on artificial periodic structure: (a) Acoustic triode model; (b) artificial periodic structure model.

Figure 2.
Schematic diagram of sound wave transmission: (a) Schematic diagram of sound wave transmission; (b) schematic diagram of sound wave transmission (no adding model).
Figure 2.
Schematic diagram of sound wave transmission: (a) Schematic diagram of sound wave transmission; (b) schematic diagram of sound wave transmission (no adding model).

Figure 3.
Sound pressure changes at different observation points.

Figure 4.
Sound wave transmission effect at different frequencies: (a) Phenomenon at 272 kHz; (b) phenomenon at 276 kHz; (c) phenomenon at 277 kHz; (d) phenomenon at 285 kHz.
Figure 4.
Sound wave transmission effect at different frequencies: (a) Phenomenon at 272 kHz; (b) phenomenon at 276 kHz; (c) phenomenon at 277 kHz; (d) phenomenon at 285 kHz.

Figure 5.
Sound pressure changes of acoustic waves at different frequencies: (a) Line graph at 272 kHz; (b) line graph at 276 kHz; (c) line graph at 277 kHz; (d) line graph at 285 kHz.
Figure 5.
Sound pressure changes of acoustic waves at different frequencies: (a) Line graph at 272 kHz; (b) line graph at 276 kHz; (c) line graph at 277 kHz; (d) line graph at 285 kHz.

Figure 6.
The effect of the sound pressure at the switch point:(a) Phenomenon at 276 kHz; (b) line graph at 276 kHz; (c) phenomenon at 285 kHz; (d) line graph at 285 kHz.
Figure 6.
The effect of the sound pressure at the switch point:(a) Phenomenon at 276 kHz; (b) line graph at 276 kHz; (c) phenomenon at 285 kHz; (d) line graph at 285 kHz.

Figure 7.
Acoustic phase interference simulation diagram: (a) Phenomenon at 12 µs; (b) phenomenon at 34 µs; (c) phenomenon at 44 µs; (d) phenomenon at 58 µs.
Figure 7.
Acoustic phase interference simulation diagram: (a) Phenomenon at 12 µs; (b) phenomenon at 34 µs; (c) phenomenon at 44 µs; (d) phenomenon at 58 µs.

Figure 8.
Filtering effect of fixed-frequency sound wave: (a) Phenomenon at 12 µs; (b) phenomenon at 34 µs; (c) phenomenon at 46 µs; (d) phenomenon at 66 µs.
Figure 8.
Filtering effect of fixed-frequency sound wave: (a) Phenomenon at 12 µs; (b) phenomenon at 34 µs; (c) phenomenon at 46 µs; (d) phenomenon at 66 µs.

Figure 9.
Changes in sound pressure at collection points at different times: (a) Line graph at 0 µs; (b) line graph at 12 µs; (c) line graph at 34 µs; (d) line graph at 46 µs; (e) line graph at 66 us.
Figure 9.
Changes in sound pressure at collection points at different times: (a) Line graph at 0 µs; (b) line graph at 12 µs; (c) line graph at 34 µs; (d) line graph at 46 µs; (e) line graph at 66 us.

Figure 10.
Sound pressure change at the acquisition point (sound pressure rise at the switch point): (a) Line graph at 46 µs; (b) line graph at 66 µs.
Figure 10.
Sound pressure change at the acquisition point (sound pressure rise at the switch point): (a) Line graph at 46 µs; (b) line graph at 66 µs.

© 2020 by the authors. Licensee MDPI, Basel, Switzerland. This article is an open access article distributed under the terms and conditions of the Creative Commons Attribution (CC BY) license (http://creativecommons.org/licenses/by/4.0/).
Share and Cite
MDPI and ACS Style
Yang, P.; Wu, J.; Zhao, R.; Han, J. Research on Local Sound Field Control Technology Based on Acoustic Metamaterial Triode Structure. Crystals 2020, 10, 204. https://0-doi-org.brum.beds.ac.uk/10.3390/cryst10030204
AMA Style
Yang P, Wu J, Zhao R, Han J. Research on Local Sound Field Control Technology Based on Acoustic Metamaterial Triode Structure. Crystals. 2020; 10(3):204. https://0-doi-org.brum.beds.ac.uk/10.3390/cryst10030204
Chicago/Turabian StyleYang, Peng, Jingzhi Wu, Rongrong Zhao, and Jianning Han. 2020. "Research on Local Sound Field Control Technology Based on Acoustic Metamaterial Triode Structure" Crystals 10, no. 3: 204. https://0-doi-org.brum.beds.ac.uk/10.3390/cryst10030204
Note that from the first issue of 2016, this journal uses article numbers instead of page numbers. See further details here.