Study on the Softening Behavior of Cu–Cr–In Alloy during Annealing
by
Yunqing Zhu
1, 
Linsheng Tang
1,
Weibin Xie
1,2,
Huiming Chen
1,2,*,
Hang Wang
1,2 and
Bin Yang
1,2,* 1
Faculty of Materials Metallurgy and Chemistry, Jiangxi University of Science and Technology, Ganzhou 341000, Jiangxi, China
2
Institute of Engineering Research, Jiangxi University of Science and Technology, Ganzhou 341000, Jiangxi, China
*
Authors to whom correspondence should be addressed.
Crystals 2020, 10(4), 312; https://0-doi-org.brum.beds.ac.uk/10.3390/cryst10040312
Submission received: 18 February 2020
/
Revised: 9 April 2020
/
Accepted: 10 April 2020
/
Published: 17 April 2020
(This article belongs to the Special Issue Advance in Alloy Materials)
Abstract
:The softening behavior of a cold-drawn Cu–Cr–In alloy was investigated during annealing between 450 °C and 700 °C. The properties and microstructure evolution of the alloy were characterized using a microhardness tester, electron back-scatter diffraction, and transmission electron microscopy. Elemental In addition was found to hinder the dislocation movement and delay the recovery and recrystallization of the Cu–Cr–In alloy. The experimental data were analyzed using the Johnson–Mehlv–Avramiv–Kolmogorov model. The activation energy of recrystallization of the 60% cold-drawn Cu0.54Cr0.17In alloy was 188.29 ± 18.44 kJ/mol, and the recrystallization mechanism of the alloy was attributed mainly to Cu self-diffusion.
1. Introduction
Cu–Cr-based alloys are a traditional age-hardening alloy, and are used widely in the fields of contact wires, lead frames and heat exchange because of a good combination of strength properties, electrical conductivity and ductility [1,2]. Alloying element addition [3,4,5], processing, and heat treatment [6,7,8] are major routes to improve performance. Annealing at a specific temperature for precipitation nucleation is an important process to improve the performance, and it is accompanied by a growth of precipitation phases and alloy recovery and recrystallization [9]. However, precipitation and recrystallization growth will lead to a reduction of alloy strength and softening. Yuan et al. [10] found that recovery during aging caused significant softening in the cold-drawn Cu–Cr–Ag alloy. Therefore, to obtain the performance of combining a high strength with a good conductivity, a suitable processing and heat treatment is necessary.
In our previous work [11,12], a Cu–Cr–In alloy type was designed, and elemental In addition to the Cu–Cr alloy was found to yield a strong solid–solution strengthening effect. The alloy exhibits a high strength and good conductivity with facile preparation and production. Chen et al. [12] found that the dislocation density and strength increment vary with the different aging and cold-drawing processes. The recovery and recrystallization behavior of the alloy affects the alloy strength at a high service temperature, as well as the selection of processing technique and heat-treatment process. This study aimed to research the properties and microstructure evolution of the Cu–Cr–In alloy during annealing and determined the alloy recrystallization kinetics. The effects of indium addition on softening resistance have been evaluated. The goal of this study was to reveal the thermal-softening mechanisms by analyzing the microstructure and mechanical properties of cold-drawn Cu–Cr–Sn alloy during annealing, and to enhance the softening resistance of the Cu–Cr–In alloy.
2. Experimental Procedure
Cathode copper (99.95 wt.%), pure indium (99.95 wt.%) and Cu–8 wt.% Cr master-alloy were used as raw materials. The Cu–Cr–In alloy ingots were prepared by iron casting in a medium-frequency induction furnace (ZP-45, Jiangyin Ruibang, Jiangyin, China). The composition of the as-cast ingot (see Table 1) was determined via inductively coupled plasma emission spectroscopy (ICP, IRIS Intrepid II, Thermo Fisher Scientific, Waltham, MA, USA). After being cleaned, the 80-mm-diameter as-cast ingots were homogenized at 900 °C for 1 h, and then extruded into 13-mm diameter rods. The Cu–Cr–In rods were processed via the following route: extrusion rods (13-mm diameter) → first-time cold drawing (7-mm diameter) → solid–solution → second-time cold drawing (4.5-mm diameter). Cold drawing was conducted with a drawing bench (LW-10, Suzhou Weihan, Suzhou, China), and the macroscopic strains after the first and second cold drawing were 68% and 60%, respectively. Wires that had been cold-drawn for the first time were annealed at 950 °C for 1 h followed by rapid water quenching. The 60% cold-drawn Cu–Cr–In alloy was annealed between 450 °C and 700 °C for between 0 min and 600 min in a resistance furnace (SX2-18-18, Shanghai Shiyan, Shanghai, China).
The microhardness was measured using a digital microhardness tester (200HVS-5, Laizhou Huayin, Yantai, China) with a load of 500 g, and ten measurements were performed for each point. The alloy sample microstructure was observed using optical microscopy (OM, BMM90AE, Shanghai Bimu, Shanghai, China), scanning electron microscopy (SEM, MLA650F, FEI Company, Hillsboro, OR, USA), electron backscatter diffraction (EBSD, Zeiss-SIGMA, Zeiss, Jena, Germany) and transmission electron microscopy (TEM, Tecnai G2-20, FEI Company, Hillsboro, OR, USA). The alloy subgrain and grain substructure were quantified from the SEM-BSE micrographs, the images were analyzed at a magnification of 1000 and the EBSD orientation maps were obtained with a step size of 1.5 μm. The surface crystallographic orientation and structure data were analyzed using the HKL-Channel 5 software. The low- and high-angle grain boundaries were set to and , respectively, and the grain misorientation was the criterion that was used to understand the structural evolution. Information on the crystal structure was collected by X-ray diffractometry (XRD, Xpert powder, PANalytical B.V., Almelo, The Netherlands) with Cu-Kα radiation, a tube voltage of 40 kV and a current of 250 mA. The continuous scanning mode ranged from 20 to 100 at 1°/min.
3. Results
3.1. Hardness Properties
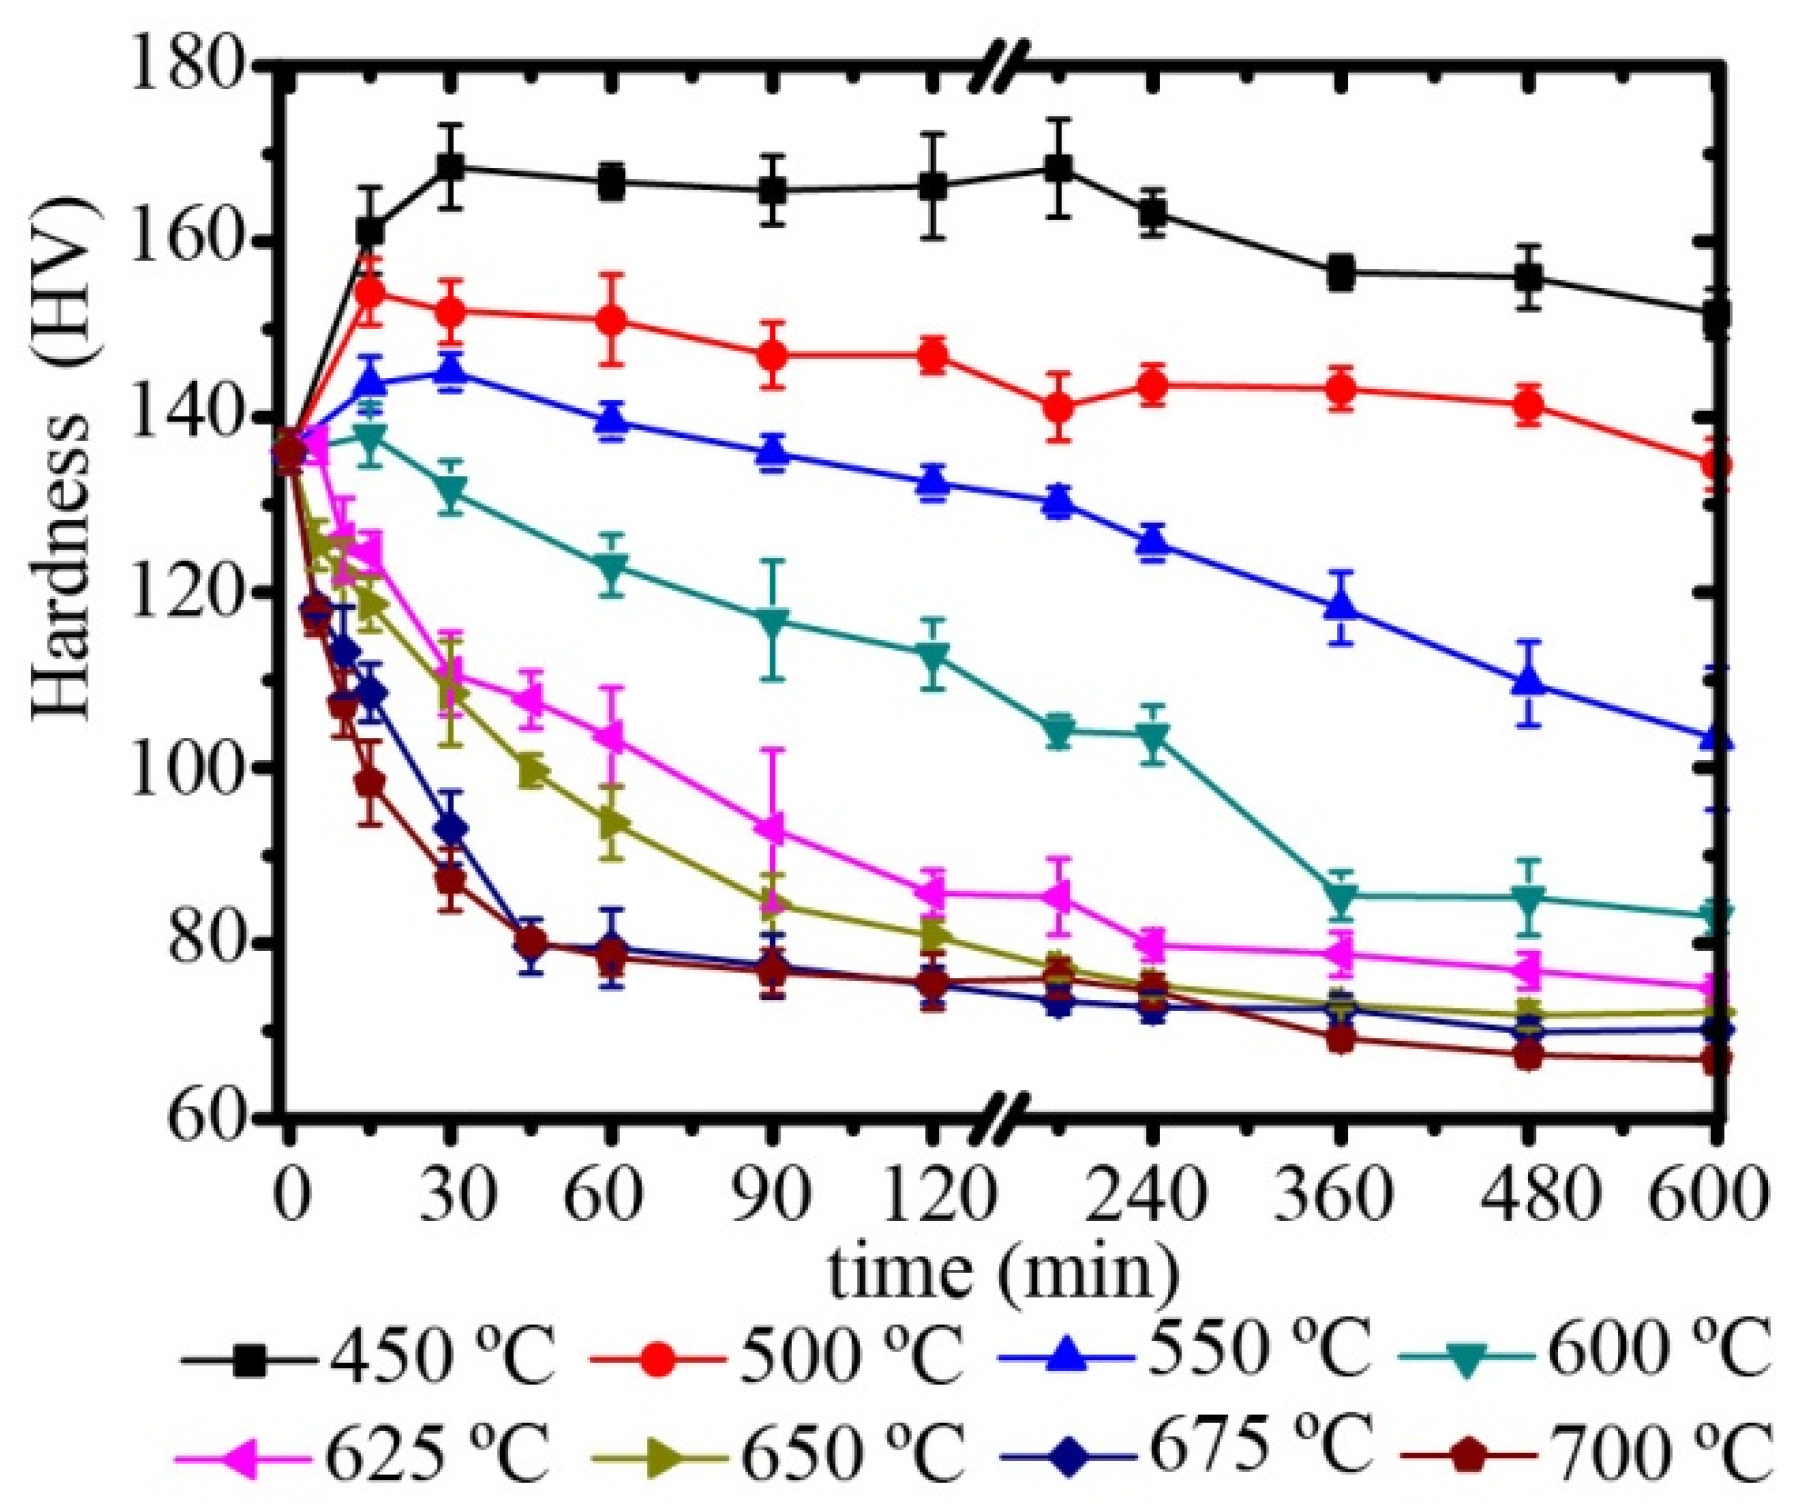
Figure 1 shows the hardness for the 60% cold-drawn Cu–Cr–In alloy annealed between 450 °C and 700 °C for different times. The hardness of the solution-treated and cold-drawn Cu–Cr–In alloy were 71 HV and 136 HV, respectively. At the initial stage of 450 °C, the hardness of the cold-drawn alloy increased rapidly and reached a peak hardness of 168 HV after annealing for 30 min. The alloy hardness decreased slightly even with a prolonged annealing time of 600 min. The peak hardness of the alloy was reached 15 min after annealing at 500 °C, 550 °C and 600 °C, and the alloy hardness decreased significantly. After being annealed at 600 °C for 600 min, the hardness decreased to 83 HV. A direct decrease of hardness with annealing time was observed at 625 °C, 650 °C, 675 °C, and 700 °C, and the hardness finally stabilized. The annealed alloy reached a stable hardness of 66 HV after annealing at 700 °C for 360 min.
3.2. Microstructure Evolution
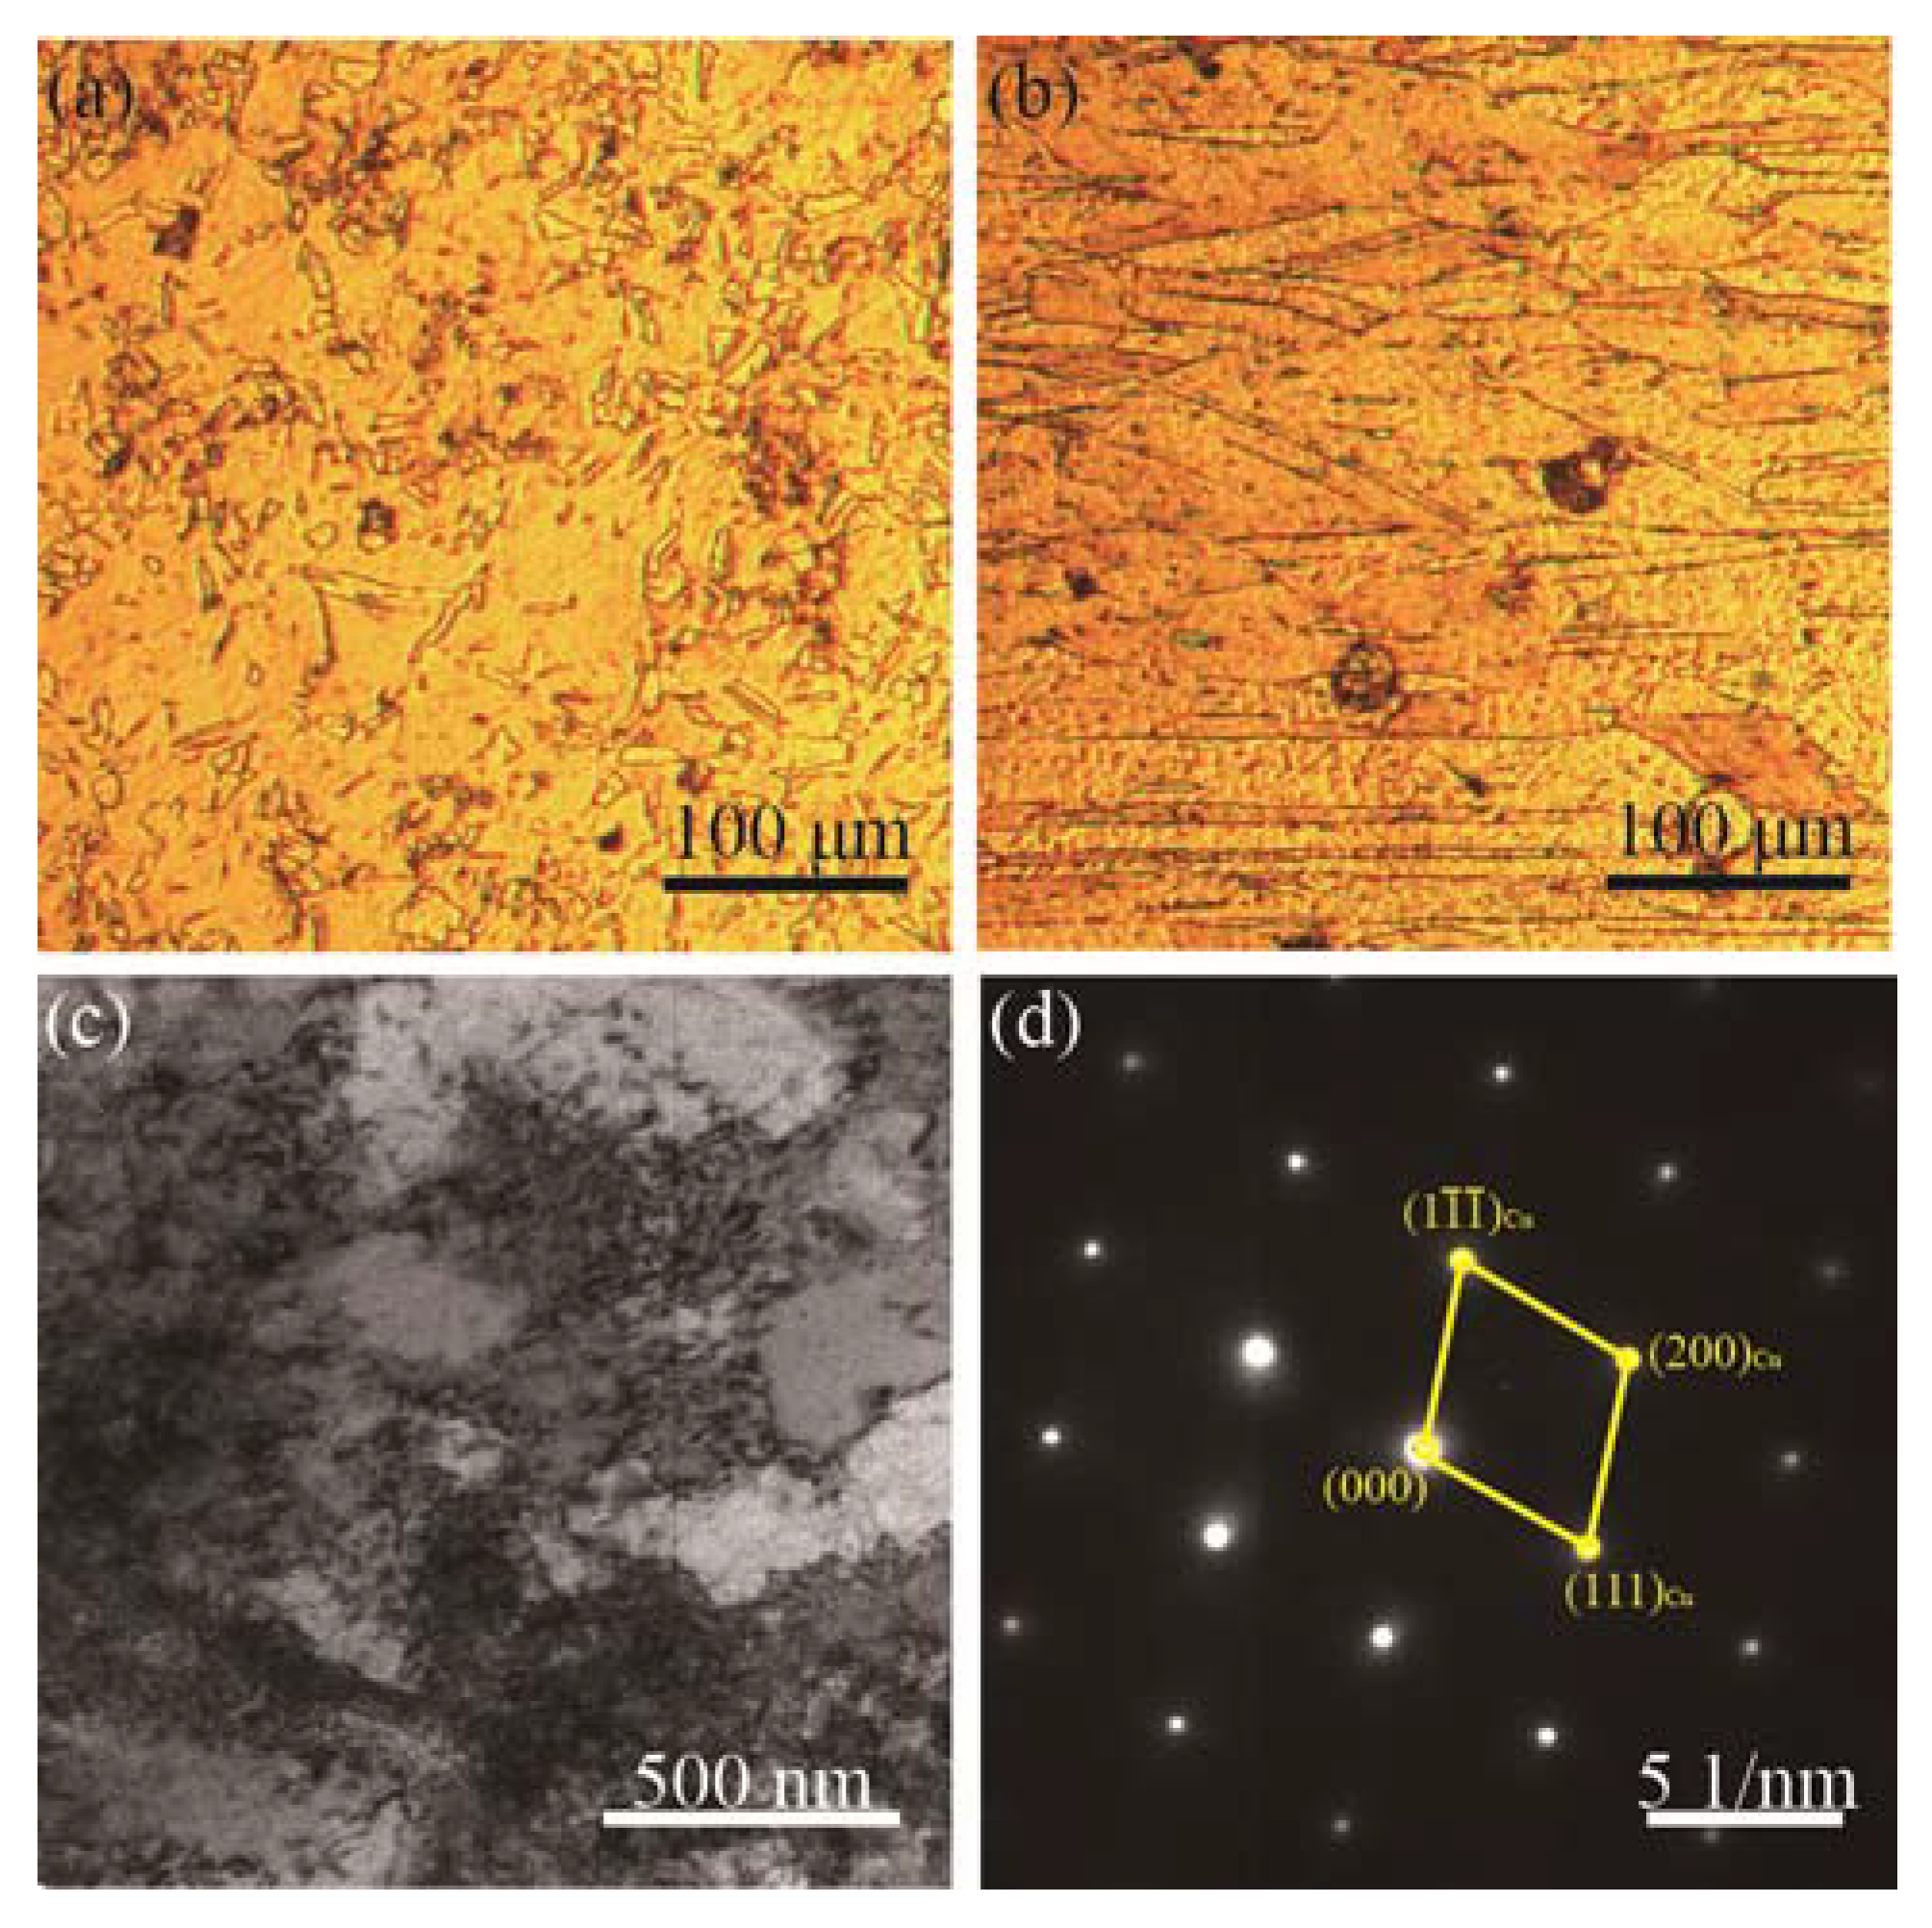
The microstructures of the cross section and vertical section of the 60% cold-drawn Cu–Cr-In alloy are shown in Figure 2a,b, respectively. Fine equiaxial grains and tiny elongated grains were observed on the cross section and along the direction of the drawing axis, respectively. The transmission electron micrograph and selected area diffraction pattern (SADP) image of the cold-drawn sample are shown in Figure 2c,d. The high-density dislocation networks and dislocation tangles are visible, and the corresponding SADP analysis revealed that only some diffraction spots originated from the Cu matrix and no nanosecondary phase existed in the matrix.
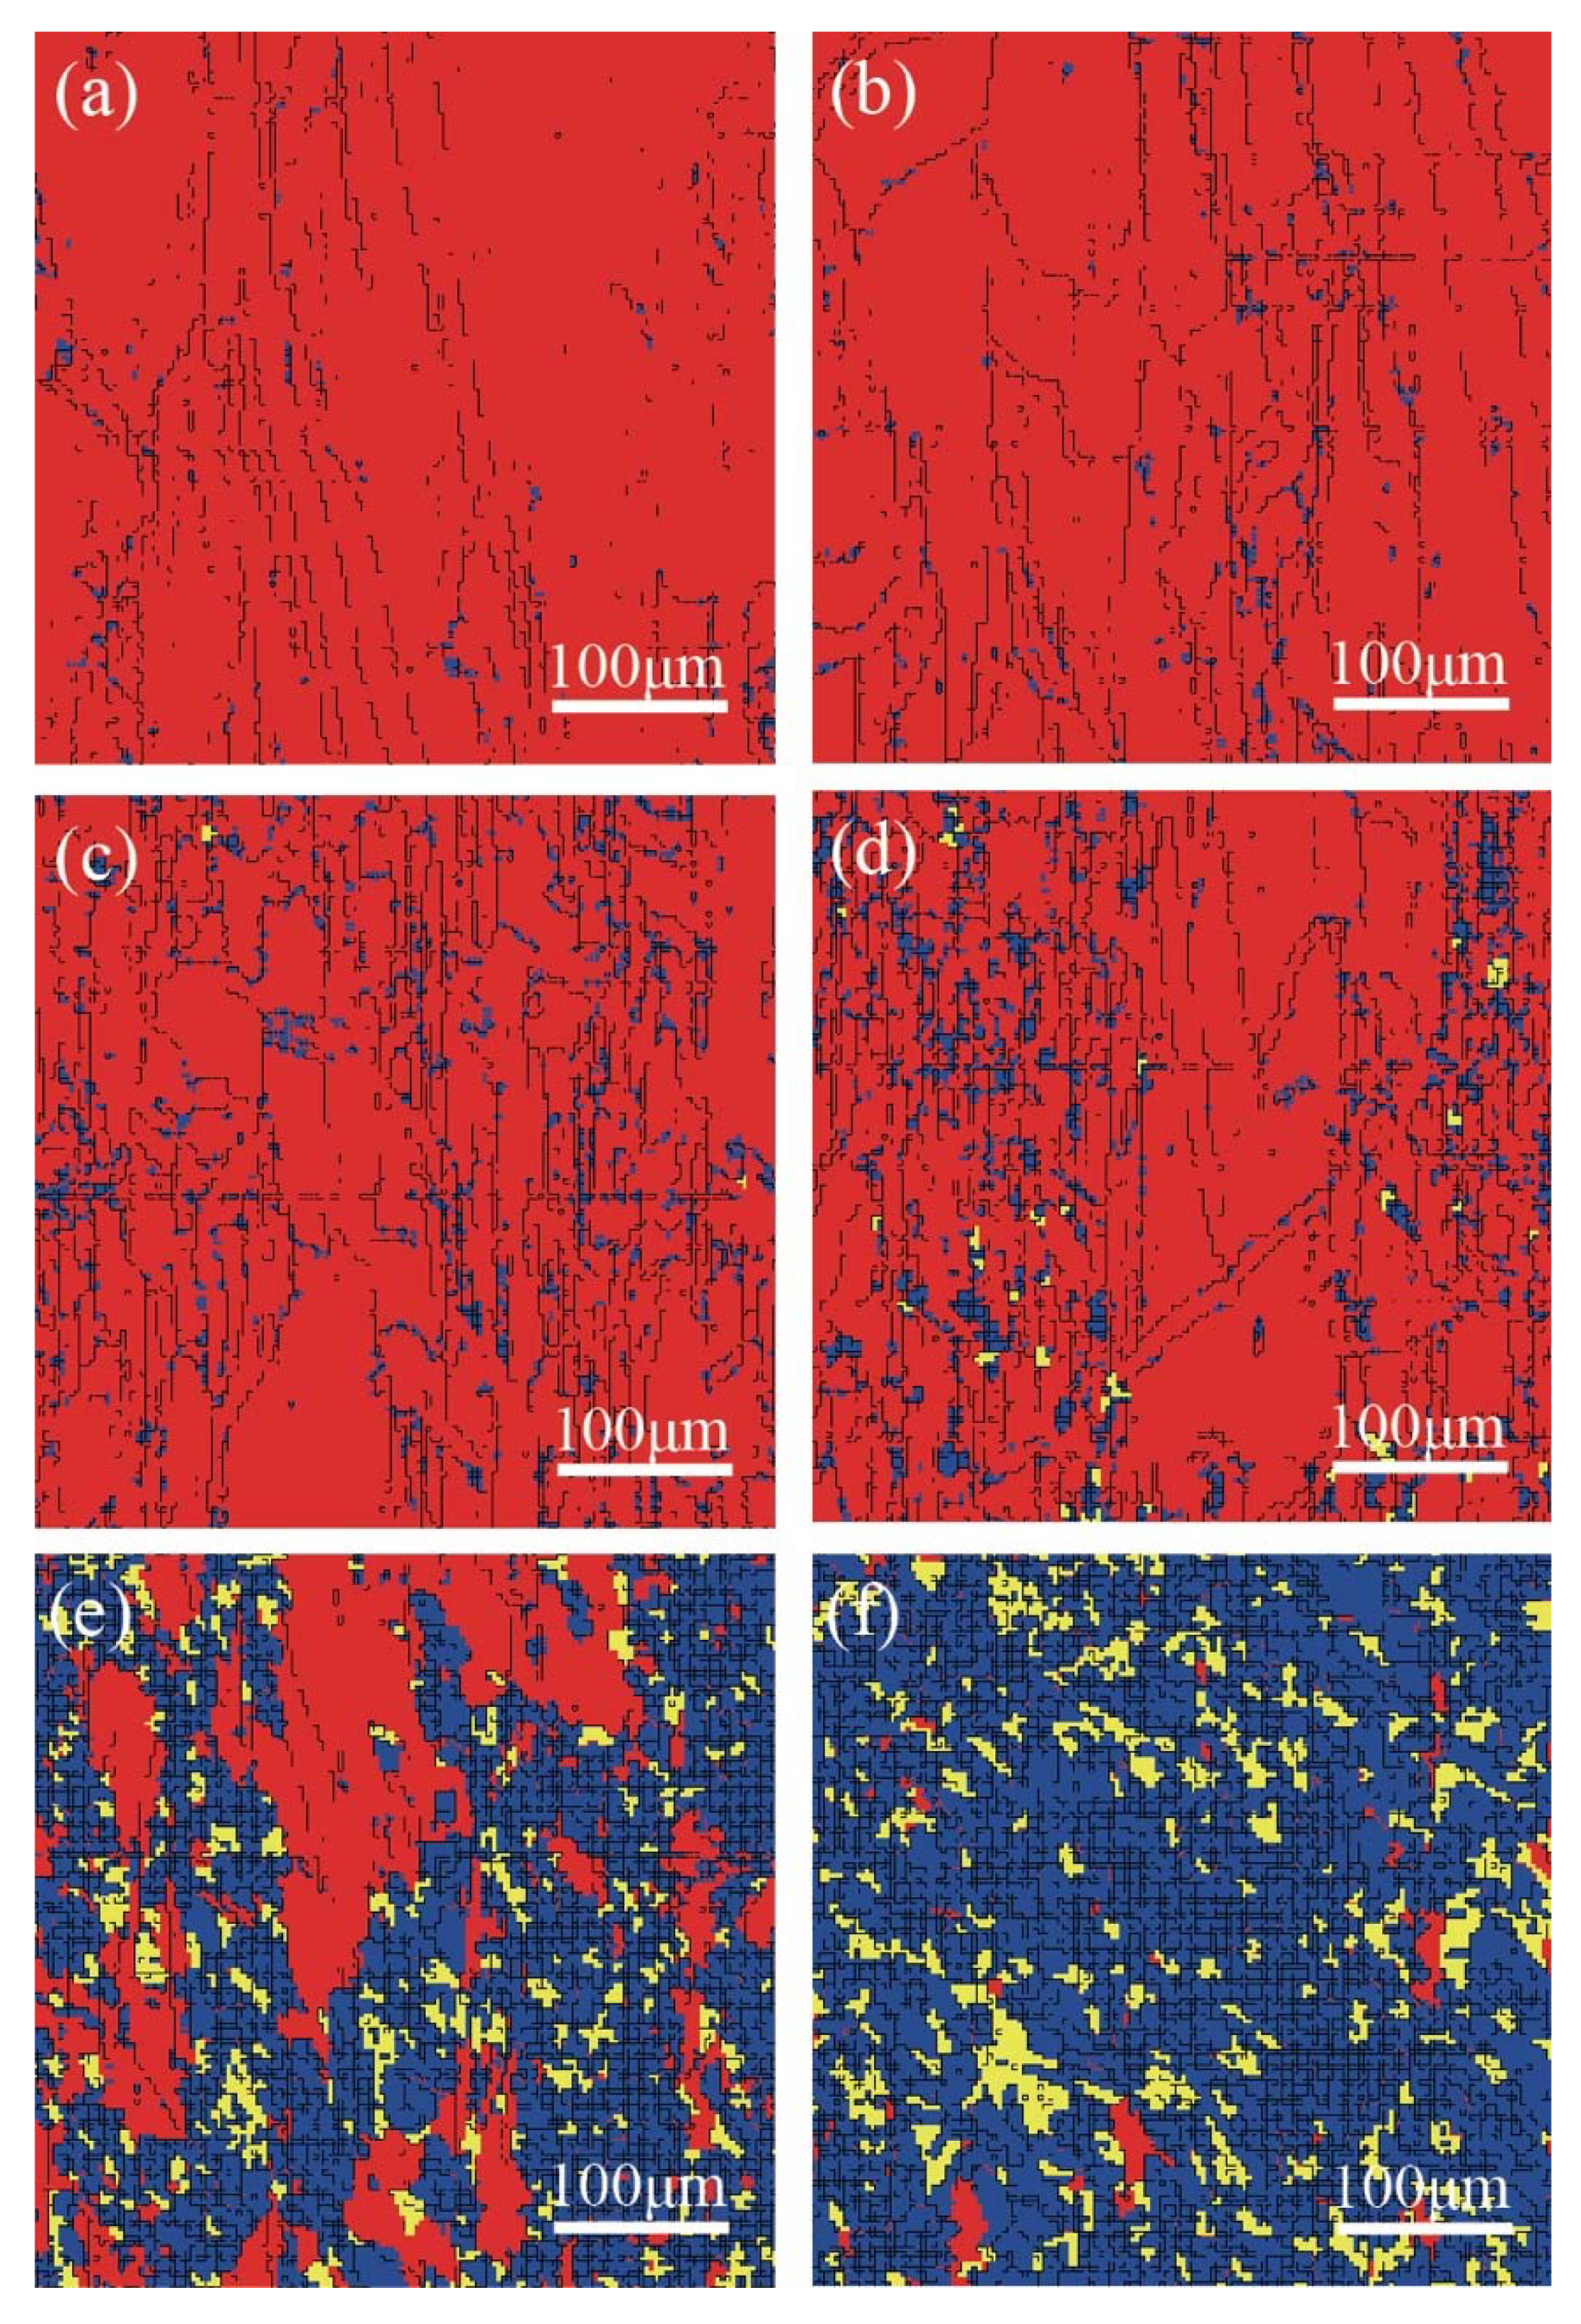
Recovery and recrystallization of the deformed alloy will occur during annealing. Low-angle grain boundaries were formed during cold deformation, and the alloy before annealing contained mainly low-angle grain boundaries. The high-angle grain boundaries were formed with annealing, which showed the microstructure evolution. The electron back-scatter diffraction maps with annealing alloy microstructures at 450 °C, 550 °C, and 650 °C for 60 min and 240 min are shown in Figure 3, and the red, yellow, and blue colors represent the deformed microstructure, subgrain, and recrystallization structures, respectively. The elongated deformed microstructure was retained, even after annealing at 450 °C for 60 min and 240 min, as shown in Figure 3a,b, respectively. A small number of fine recrystallized grains that are represented in blue exist at grain-edge boundaries (junctions of three grains) of the elongated grains. Nucleation is preferred at the triple junctions of the deformed grains boundaries because of the large strain and high deformation-energy storage [13].
Compared with Figure 3a, the number of recrystallized grains increases visibly at the grain boundary of the Cu–Cr–In alloy that was annealed at 550 °C for 60 min, as shown in Figure 3c. Subgrains exists, which are a transition structure that is converted to a recrystallized grain. As the annealing temperature was increased, the atomic momentum increased, which increased the diffusion rate of the Cu atoms and promoted recrystallization nucleation of the deformed structure. The deformed structure recovered and recrystallized rapidly, and only a small amount of deformed red structure remained after annealing at 650 °C for 240 min, as shown in Figure 3e,f.
The recrystallization ratio of the deformed Cu–Cr–In alloy was calculated, as shown in Table 2. The recrystallization proportion of the deformed alloy was small at 450 °C, and was only 2.49% after annealing for 240 min. With an increase in annealing temperature and time, the substructure and recrystallization ratios increased visibly. Most of the deformed structure transformed at 650 °C for 240 min was almost completely recrystallized and only 3.23% of the deformed structure remained.
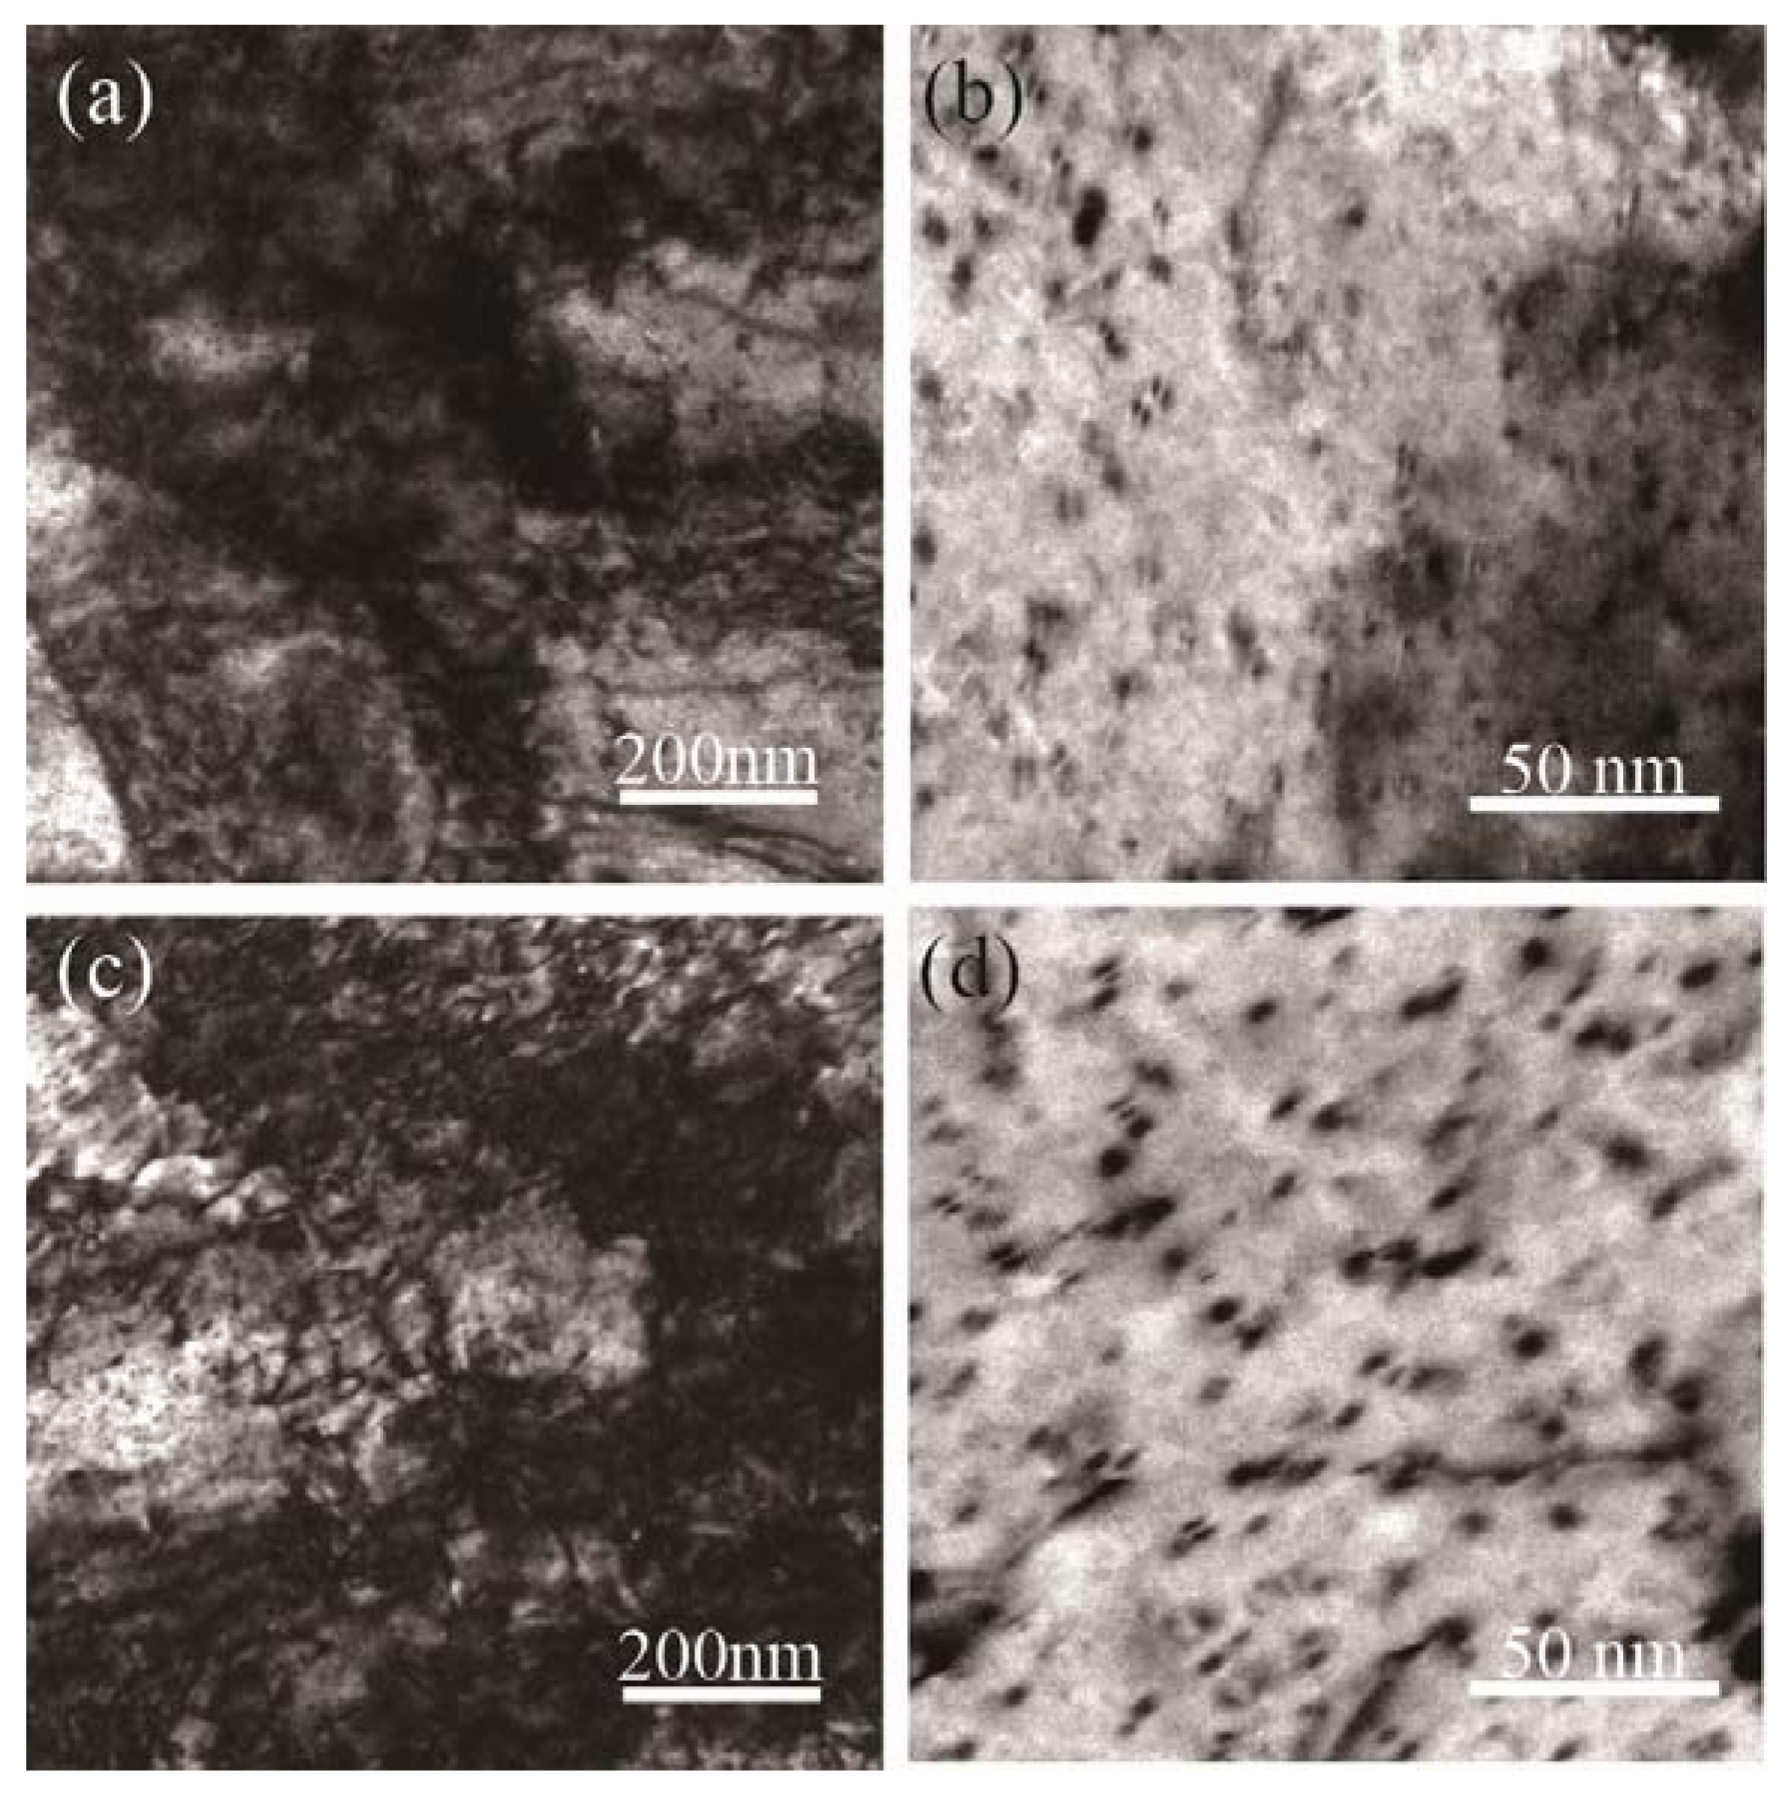
The nano-rich Cr precipitates during annealing, which improves the alloy strength. Figure 4 shows the TEM images of the Cu–Cr–In alloy that was annealed at 450 °C for 60 min and 240 min. Many dislocations evolved during cold deformation, which is a mutual entanglement, and formed dislocation clusters, as shown in Figure 4a,c. The dislocation entanglement tended to decrease slightly with aging. Figure 4b,d suggests that the nanoscaled Cr-rich precipitate phase [11,12] distributes homogeneously in the matrix and the distribution density is basically the same. The fine particles with coffee-bean contrasts [14,15] are ~5 nm after annealing for 60 min. However, Figure 4d shows that the nanoscaled Cr-rich precipitates with an average size of 7 nm present coffee-bean and sphere-like morphologies [14,15] after annealing for 240 min.
Figure 5 shows TEM images of the annealed Cu–Cr–In alloy structure and Cr-rich precipitates at 550 °C for 60 min and 240 min. Figure 5a,c shows that many dislocation entanglements exist, and some dislocation cells and subgrains formed after annealing. Owing to the subgrain coalescence by annihilation and dislocation rearrangement, the dislocation density is reduced after annealing for 240 min at 550 °C. The precipitate size was slightly larger with the extension of annealing time, and the sizes were ~8 nm and 10 nm, which corresponds to Figure 5b,d, respectively.
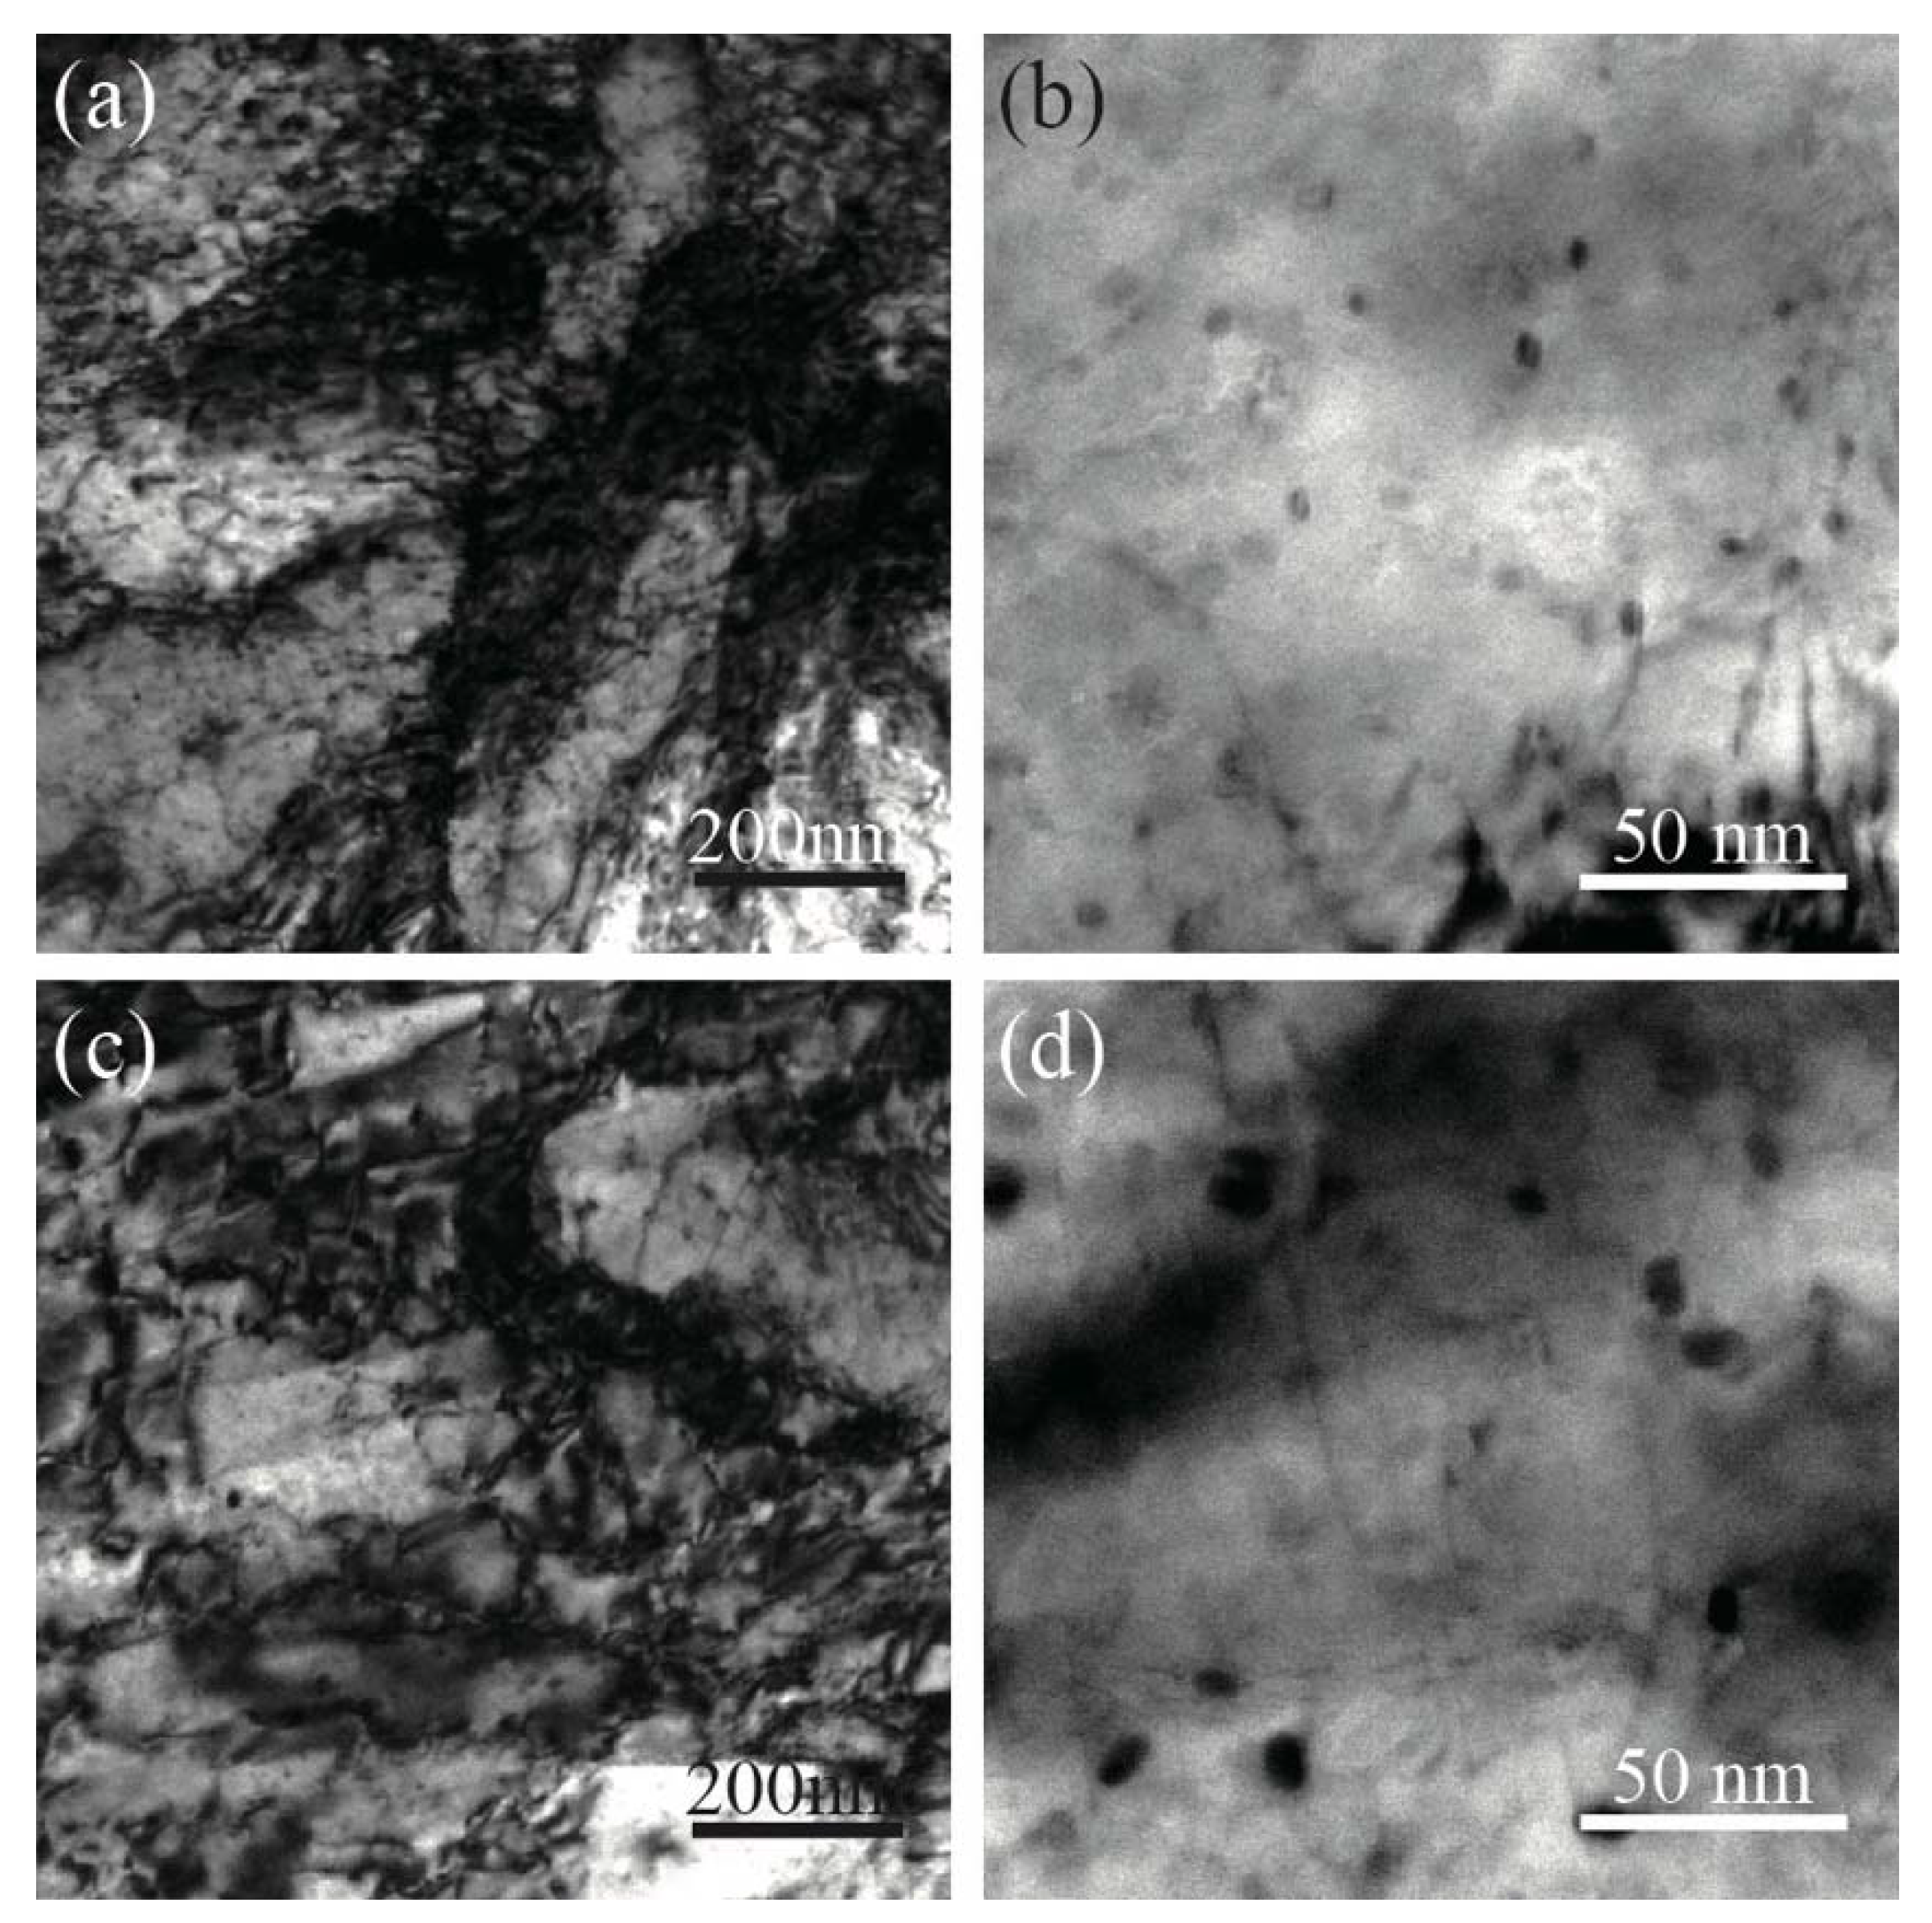
Figure 6 shows the TEM images of the annealed Cu–Cr–In alloy structure and Cr-rich precipitates at 650 °C for 60 min and 240 min. Figure 6a shows that the dislocation density in the matrix decreases significantly after annealing at 650 °C for 60 min, and only a few dislocation cells and dislocation bands exist. Fewer Cr-rich precipitates with moiré fringe and sphere-like morphologies exist than in Figure 4 and Figure 5, and the precipitate size is ~10 nm, as shown in Figure 6b. Figure 6c shows that the dislocation density in the Cu–Cr–In matrix decreases further, and the deformation twins in the matrix indicate that a complete recrystallization of the deformed Cu–Cr–In alloy has occurred after annealing at 650 °C for 240 min. Some Cr-rich particles exist in the matrix with a size range from 30 nm to 50 nm, and are surrounded by a large number of dislocation rings, as shown in Figure 6d. Therefore, the dislocation moves during annealing at 650 °C and interacts with the large precipitate particles. The dislocation loops are formed by dislocation by passing the precipitate particles.
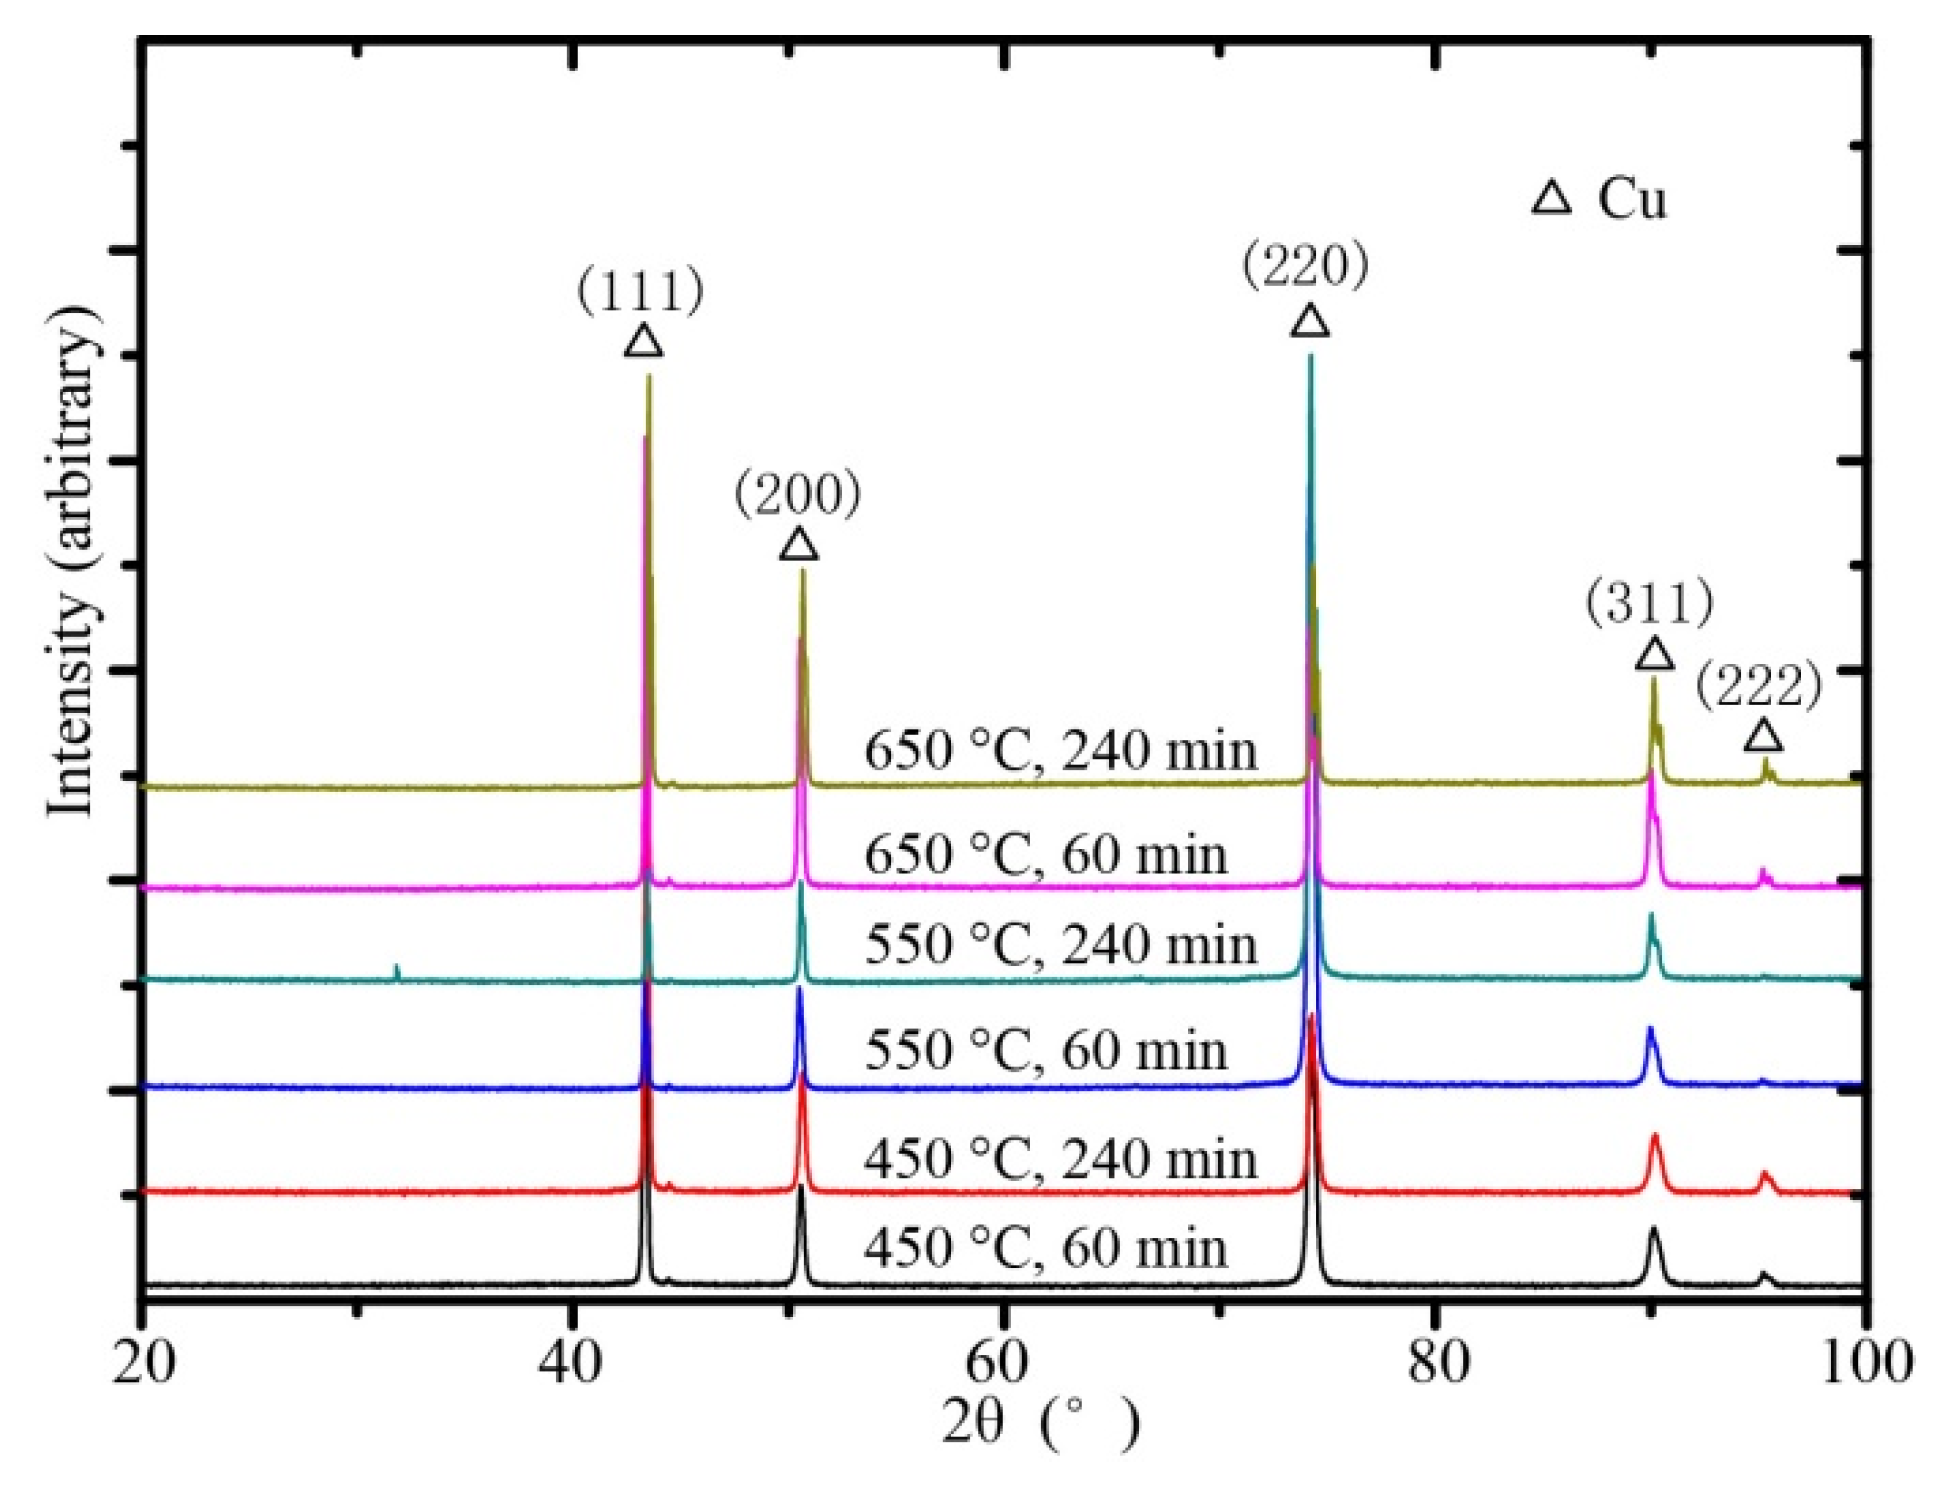
Figure 4, Figure 5 and Figure 6 show that the dislocation density of the deformed Cu–Cr–In alloy decreases with an increase in annealing temperature and an extension of annealing time. To quantify the dislocation density of the corresponding annealed Cu–Cr–In alloys, the Williamson–Hall model and the following equation were used [16]:
where ΔK is the peak width, αs is the shape factor (0.9) [17,18], D is the lattice size, N is a constant (0.263) [17], b is the Burgers vector, ρ is the dislocation density, and K is obtained from , in which θ and λ are the Bragg angle of the particular peak and the wavelength of Cu-Kα radiation (0.15405 nm). As shown in Equation (1), is the slope of the linear fit of the – plot.
4. Discussion
4.1. Softening Mechanism
Figure 1 shows that the change of annealed Cu–Cr–In alloy hardness differs with the extension of annealing time at each temperature. The peak hardness was 168 HV at 450 °C for 60 min, and the hardness decreased with the annealing time. The Cr-rich precipitates were ~5 nm and 7 nm after annealing for 60 min and 240 min respectively, as shown in Figure 4. Table 2 suggests that recrystallization of the cold-drawn Cu–Cr–In alloy is not visible. Therefore, the increase in alloy hardness occurs because of the strengthening effect of the nano-rich Cr precipitates. The Cr-rich precipitates grew slightly with an annealing time of 240 min, which resulted in a slight decrease in alloy hardness.
The Cr-rich precipitates were ~8 nm in size, and their number and density decreased after annealing at 550 °C. The dislocations moved and were destroyed during annealing at 550 °C, which decreased the dislocation density. Based on the above, the peak hardness of the Cu–Cr–In alloy decreased with an increase in annealing temperature. With the extension of annealing time, the Cu–Cr–In alloy hardness decreased sequentially. The Cr-rich precipitates grew to 10 nm and the recrystallization and substructure formed in a 12.39% proportion after annealing at 550 °C for 240 min. The dislocation structure consisted mainly of dislocation cells with a distinct cell wall and interior as shown in Figure 5c. The main reason for the decrease in hardness was the recovery and recrystallization of the deformed alloy and the increase in precipitation size, which caused recrystallization softening and decreased the precipitate strength [19].
The hardness of the deformed Cu–Cr–In alloy decreased with no increase after annealing at 625–700 °C, which indicates that a softening of recovery and recrystallization had occurred. Figure 6a,b shows that the dislocation structure consists mainly of a dislocation wall with the release of dislocations during annealing at 650 °C, and the precipitation strengthening of a small amount of Cr-rich precipitates of ~10 nm was relatively small. The alloy hardness was stable after annealing at 625 °C, 650 °C, and 700 °C for 360 min, 180 min, and 120 min, respectively, which shows that the deformed alloys had recrystallized. The ratio of recrystallization and substructure was 96.77% after annealing at 650 °C for 240 min and a complete recovery and recrystallization occurred as shown in Figure 3f and Figure 6c. Because the solubility of Cr in the Cu matrix increased at 650 °C, the density of the Cr-rich precipitations decreased. The Cr-rich precipitates grew in bulk from ~30 nm to 50 nm with an increase in Cr atom diffusion rate.
The fully recrystallized Cu–Cr–In alloy was annealed at 950 °C for 1 h followed by rapid water quenching, and the hardness was ~67 HV. Annealing of the samples at 650 °C with a different time resulted in an alloy peak hardness of ~70 HV, which indicates that the precipitation strength was not obvious because of the bulky Cr-rich precipitates. Therefore, softening of the recovery and recrystallization are the main features of the deformed Cu–Cr–In alloy at an annealing temperature between 625 °C and 700 °C.
4.2. Static Recrystallization Kinetics
Degradation of the mechanical properties produced by recovery is smaller than that caused by recrystallization. The effect of alloy softening that is caused by recovery above 625 °C can be negligible. Therefore, the volume fraction of recrystallization with different annealing times can be expressed using Equation (2) [20]:
where XV is the recrystallized volume fraction, HVD is the initial hardness of the deformed alloy, HVt is the hardness after a given annealing time t and HVRex is the hardness of the fully recrystallized material.
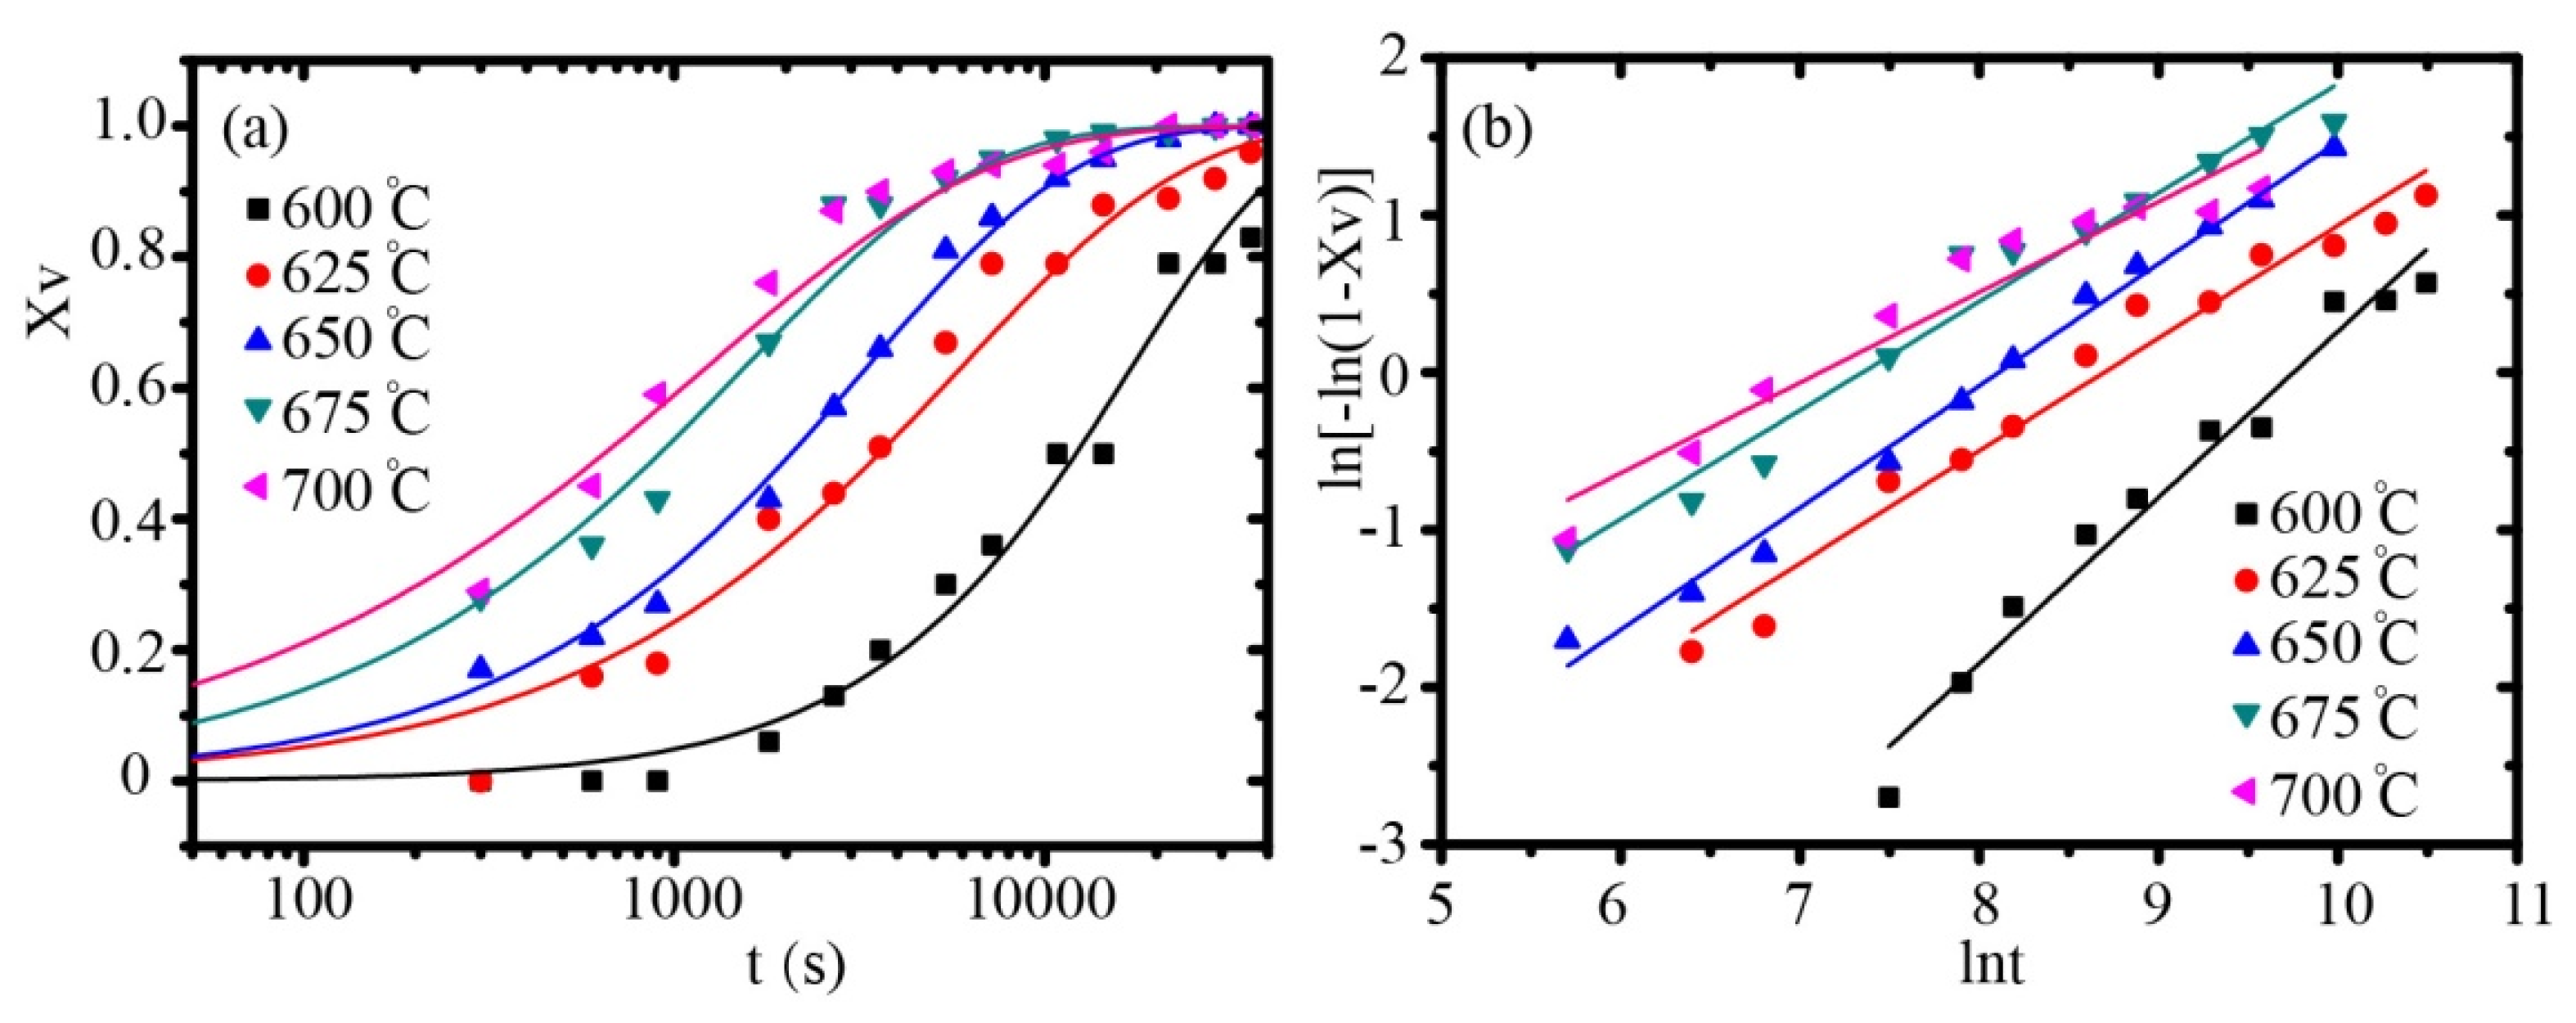
The hardness of the fully recrystallized material is ~73 HV, which is deduced from Figure 1 and Table 2. The recrystallized volume fractions of the Cu–Cr–In alloy with the extension of annealing time are shown in Figure 8a.
According to the Johnson–Mehl–Avrami–Kolmogorov (JMAK) model [21,22], the functional relationship between the recrystallized volume fraction and the annealing time can be expressed by Equation (3):
where k is a constant and n is the Avrami exponent of the nucleation and growth characteristics.
The data for XV can be presented in the form of ln[−ln(1 − XV)] vs. lnt, which is linear. As shown in Figure 8b, a high linear fitting degree exists between ln[−ln(1 − XV)] and lnt, and the slope of each line is the value of n at each temperature. The Avrami indices n of the Cu–Cr–In alloy with 60% cold deformation and annealed at 600 °C, 625 °C, 650 °C, 675 °C, and 700 °C are 1.06, 0.72, 0.78, 0.69, and 0.58, respectively. The JMAK function at each temperature can be obtained and curves of the JMAK functions with a high fitting degree are shown as solid lines in Figure 8b.
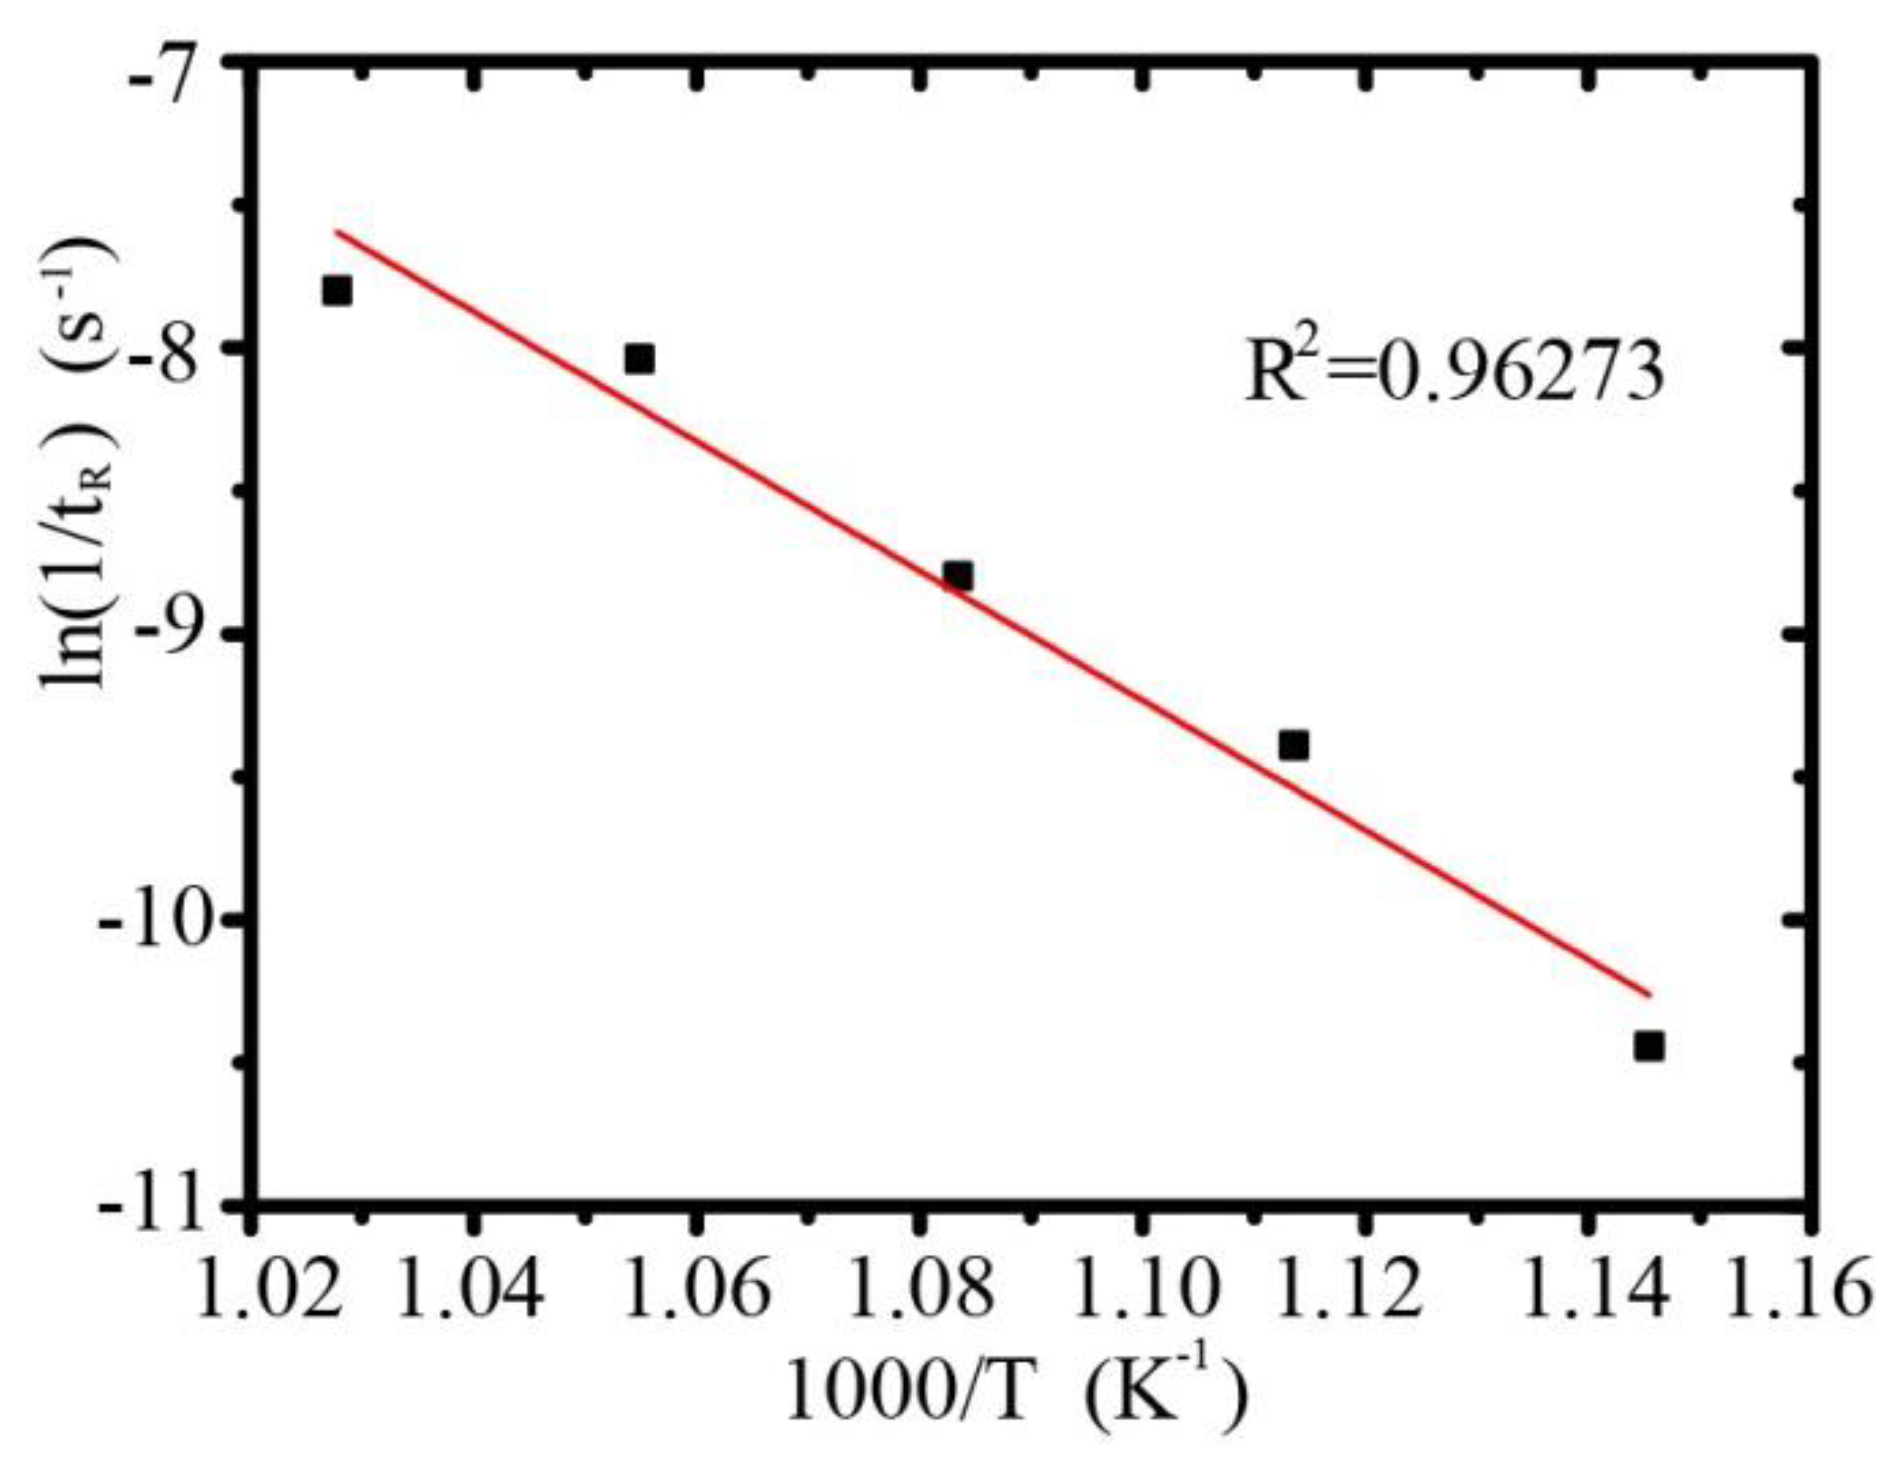
In this work, the classic Arrhenius equation [23] was used to reflect the rate of recrystallization, which can be formulated from Equation (4):
where tR is the annealing time at a given recrystallized volume fraction, A is a constant, R is the universal gas constant, QR is the activation energy of recrystallization, and T is the absolute temperature.
The tR can be evaluated when 50% recrystallization occurred at the relevant temperature. The plot of ln(1/tR) versus 1000/T is linear, and the linear fitting correlation is R2 = 0.96273, as shown in Figure 9. QR can be calculated from the slope. The activation energy of recrystallization of the 60% cold-drawn Cu0.54Cr0.17In alloy is QR = 188.29 ± 18.44 kJ/mol, which is similar to the activation energy of the self-diffusion activation energy of Cu with 197 kJ/mol [24], and indicates that the recrystallization mechanism of the alloy is attributed mainly to Cu self-diffusion. The activation energy of the recrystallization of the Cu–Cr–In alloy is significantly higher than that of 70% cold-rolled pure Cu with 58 kJ/mol [25] and 60% cold-drawn Cu–Cr–Sn alloy with 117.958 kJ/mol [26], which indicates that elemental In addition can improve the activation energy of recrystallization of Cu–Cr alloys, and has a more obvious effect on delaying recrystallization than Sn addition. Mainly because of the big atomic radius of indium atoms, the atoms that are solutioned into the Cu lattice cause serious lattice distortion, which hinders dislocation movement and delays the recovery and recrystallization of the Cu–Cr–In alloy.
5. Conclusions
The properties and microstructure evolution of 60% cold-drawn Cu0.54Cr0.17In alloy that was annealed from 450 °C to 700 °C was studied, and the dynamic softening mechanism of recrystallization was determined. The following conclusions could be drawn:
(1) The precipitation, recovery and recrystallization of the cold-drawn Cu–Cr–In alloy will occur simultaneously during annealing above 450 °C. The peak aging hardness of the alloy decreased with an increase in annealing temperature. The alloy hardness decreased significantly with an extension of annealing time above the peak hardness, which results from the effect of a decrease in precipitation strength and work hardening with the higher temperature.
(2) The activation energy of recrystallization of the 60% cold-drawn Cu0.54Cr0.17In alloy is 188.29 ± 18.44 kJ/mol, and the recrystallization mechanism of the alloy is mainly Cu self-diffusion.
(3) Elemental In addition can improve the activation energy of recrystallization of the Cu–Cr alloy and promote high-temperature properties.
Author Contributions
Conceptualization, B.Y.; methodology, H.C.; validation, L.T., H.C., and H.W.; formal analysis, Y.Z. and W.X.; investigation, Y.Z. and H.C.; resources, W.X.; data curation, L.T.; writing—original draft preparation, Y.Z. and H.C.; writing—review and editing, H.W.; visualization, H.C.; supervision, H.W.; project administration, B.Y.; funding acquisition, B.Y. All authors have read and agreed to the published version of the manuscript.
Funding
This work is financially supported by the National Key Research and Development Program of China (Grant No. 2016YFB0301400) and Scientific Start-up Research for High-level Talents of Jiangxi University of Science and Technology.
Acknowledgments
Thanks are also given to Wenjing Wang for their help.
Conflicts of Interest
The authors declare no conflict of interest.
References
- Liu, Q.; Zhang, X.; Ge, Y.; Wang, J.; Cui, J.Z. Effect of processing and heat treatment on behavior of Cu-Cr-Zr alloys to railway contact wire. Metall. Mater. Trans. A 2006, 37A, 3233–3238. [Google Scholar] [CrossRef]
- Hatakeyama, M.; Toyama, T.; Yang, J.; Nagai, Y.; Hasegawa, M.; Ohkubo, T.; Eldrup, M.; Singh, B.N. 3D-AP and positron annihilation study of precipitation behavior in Cu–Cr–Zr alloy. J. Nucl. Mater. 2009, 386–388, 852–855. [Google Scholar] [CrossRef]
- Chen, J.S.; Wang, J.F.; Xiao, X.P.; Wang, H.; Chen, H.M.; Yang, B. Contribution of Zr to strength and grain refinement in CuCrZr alloy. Mater. Sci. Eng. A 2019, 756, 464–473. [Google Scholar] [CrossRef]
- Pang, Y.; Xia, C.D.; Wang, M.P.; Li, Z.; Xiao, Z.; Wei, H.G.; Sheng, X.F.; Jia, Y.L.; Chen, C. Effects of Zr and (Ni, Si) additions on properties and microstructure of Cu–Cr alloy. J. Alloys Comp. 2014, 582, 786–792. [Google Scholar] [CrossRef]
- Watanabe, C.; Monzen, R.; Tazaki, K. Mechanical properties of Cu–Cr system alloys with and without Zr and Ag. J. Mater. Sci. 2008, 43, 813–819. [Google Scholar] [CrossRef] [Green Version]
- Fu, H.D.; Xu, S.; Li, W.; Xie, J.X.; Zhao, H.B.; Pan, Z.J. Effect of rolling and aging processes on microstructure and properties of Cu-Cr-Zr alloy. Mater. Sci. Eng. A 2017, 700, 107–115. [Google Scholar] [CrossRef]
- Meng, A.; Nie, J.F.; Wei, K.; Kang, H.J.; Liu, Z.J.; Zhao, Y.H. Optimization of strength, ductility and electrical conductivity of a Cu–Cr–Zr alloy by cold rolling and aging treatment. Vacuum 2019, 167, 329–335. [Google Scholar] [CrossRef]
- Purcek, G.; Yanar, H.; Demirtas, M.; Alemdag, Y.; Shangina, D.V.; Dobatkin, S.V. Optimization of strength, ductility and electrical conductivity of Cu–Cr–Zr alloy by combining multi-route ECAP and aging. Mater. Sci. Eng. A 2016, 649, 114–122. [Google Scholar] [CrossRef]
- Chenna Krishna, S.; Karthick, N.K.; Sudarshan Rao, G.; Jha, A.K.; Pant, B.; Cherian, R.M. High Strength, Utilizable Ductility and Electrical Conductivity in Cold Rolled Sheets of Cu-Cr-Zr-Ti Alloy. J. Mater. Eng. Perform. 2018, 27, 787–793. [Google Scholar] [CrossRef]
- Yuan, D.W.; Wang, J.F.; Chen, H.M.; Xie, W.B.; Wang, H.; Yang, B. Mechanical properties and microstructural evolution of a Cu-Cr-Ag alloy during thermomechanical treatment. Mater. Sci. Tech-Lond. 2018, 34, 1433–1440. [Google Scholar] [CrossRef]
- Chen, H.M.; Gao, P.Z.; Peng, H.C.; Wei, H.G.; Xie, W.B.; Wang, H.; Yang, B. Study on the Hot Deformation Behavior and Microstructure Evolution of Cu-Cr-In Alloy. J. Mater. Eng. Perform. 2019, 28, 2128–2136. [Google Scholar] [CrossRef]
- Chen, H.; Yuan, D.; Xie, W.; Zhang, J.; Wang, H.; Yang, B. A novel route for strengthening copper rods: Non-solution heat treatment combined with pre-aging. J. Mater. Process. Tech. 2019, 274, 116290. [Google Scholar] [CrossRef]
- Yuan, J.H.; Gong, L.K.; Zhang, W.Q.; Zhang, B.; Wei, H.G.; Xiao, X.P.; Wang, H.; Yang, B. Work softening behavior of Cu-Cr-Ti-Si alloy during cold deformation. J. Mater. Res. Technol. 2019, 8, 1964–1970. [Google Scholar] [CrossRef]
- Wang, H.; Gong, L.K.; Liao, J.F.; Chen, H.M.; Xie, W.B.; Yang, B. Retaining meta-stable fcc-Cr phase by restraining nucleation of equilibrium bcc-Cr phase in CuCrZrTi alloys during ageing. J. Alloys Comp. 2018, 749, 140–145. [Google Scholar] [CrossRef]
- Peng, L.J.; Xie, H.F.; Huang, G.J.; Xu, G.L.; Yin, X.Q.; Feng, X.; Mi, X.J.; Yang, Z. The phase transformation and strengthening of a Cu-0.71 wt% Cr alloy. J. Alloys Comp. 2017, 708, 1096–1102. [Google Scholar] [CrossRef]
- Williamson, G.K.; Hall, W.H. X-ray line broadening from filed aluminium and wolfram. Acta Metall. 1953, 1, 22–31. [Google Scholar] [CrossRef]
- HajyAkbary, F.; Sietsma, J.; Böttger, A.J.; Santofimia, M.J. An improved X-ray diffraction analysis method to characterize dislocation density in lath martensitic structures. Mater. Sci. Eng. A 2015, 639, 208–218. [Google Scholar] [CrossRef]
- Langford, J.I.; Wilson, A.J.C. Scherrer after sixty years: A survey and some new results in the determination of crystallite size. J. Appl. Crystallogr. 1978, 11, 102–113. [Google Scholar] [CrossRef]
- Liu, Y.; Li, Z.; Jiang, Y.X.; Zhang, Y.; Zhou, Z.Y.; Lei, Q. The microstructure evolution and properties of a Cu-Cr-Ag alloy during thermal-mechanical treatment. J. Mater. Res. 2017, 32, 1324–1332. [Google Scholar] [CrossRef]
- Sitarama Raju, K.; Subramanya Sarma, V.; Kauffmann, A.; Hegedűs, Z.; Gubicza, J.; Peterlechner, M.; Freudenberger, J.; Wilde, G. High strength and ductile ultrafine-grained Cu–Ag alloy through bimodal grain size, dislocation density and solute distribution. Acta Mater. 2013, 61, 228–238. [Google Scholar] [CrossRef]
- Tang, J.; Zhang, H.; Teng, J.; Fu, D.F.; Jiang, F.L. Effect of Zn content on the static softening behavior and kinetics of Al–Zn–Mg–Cu alloys during double-stage hot deformation. J. Alloys Comp. 2019, 806, 1081–1096. [Google Scholar] [CrossRef]
- Nazari, A.; Sanjayan, J.G. Johnson–Mehl–Avrami–Kolmogorov equation for prediction of compressive strength evolution of geopolymer. Ceram. Int. 2015, 41, 3301–3304. [Google Scholar] [CrossRef]
- Chao, H.Y.; Sun, H.F.; Chen, W.Z.; Wang, E.D. Static recrystallization kinetics of a heavily cold drawn AZ31 magnesium alloy under annealing treatment. Mater. Charact. 2011, 62, 312–320. [Google Scholar] [CrossRef]
- Gale, W.F.; Totemeir, T.C. Smithells Metals Reference Book; Butterworth-Heinemann: Oxford, UK, 2004. [Google Scholar]
- Benchabane, G.; Boumerzoug, Z.; Thibon, I.; Gloriant, T. Recrystallization of pure copper investigated by calorimetry and microhardness. Mater. Charact. 2008, 59, 1425–1428. [Google Scholar] [CrossRef]
- Luo, Z.Y.; Luo, F.X.; Xie, W.B.; Chen, H.M.; Wang, H.; Yang, B. A study on annealing-induced softening in cold drawn Cu−Cr−Sn alloy. Materialwiss. Werkst. 2018, 49, 1325–1334. [Google Scholar] [CrossRef]
Figure 1.
Vickers hardness of 60% cold-drawn Cu–Cr–In alloy annealed at different temperatures and for different times.
Figure 1.
Vickers hardness of 60% cold-drawn Cu–Cr–In alloy annealed at different temperatures and for different times.

Figure 2.
Microstructure of cold-drawn Cu–Cr–In alloy. (a) Cross-sectional morphology, (b) vertical section morphology and (c) TEM micrographs, (d) SADP of (c) with [011]Cu zone axis.
Figure 2.
Microstructure of cold-drawn Cu–Cr–In alloy. (a) Cross-sectional morphology, (b) vertical section morphology and (c) TEM micrographs, (d) SADP of (c) with [011]Cu zone axis.

Figure 3.
Structure evolution of cold-drawn Cu–Cr–In alloy after annealing. (a) 450 °C, 60 min; (b) 450 °C, 240 min; (c) 550 °C, 60 min; (d) 550 °C, 240 min; (e) 650 °C, 60 min; (f) 650 °C, 240 min.
Figure 3.
Structure evolution of cold-drawn Cu–Cr–In alloy after annealing. (a) 450 °C, 60 min; (b) 450 °C, 240 min; (c) 550 °C, 60 min; (d) 550 °C, 240 min; (e) 650 °C, 60 min; (f) 650 °C, 240 min.

Figure 4.
TEM images of the Cu–Cr–In alloy annealed at 450 °C for various times. (a,b) 60 min; (c,d) 240 min.
Figure 4.
TEM images of the Cu–Cr–In alloy annealed at 450 °C for various times. (a,b) 60 min; (c,d) 240 min.

Figure 5.
TEM images of the Cu–Cr–In alloy annealed at 550 °C for various times. (a,b) 60 min; (c,d) 240 min.
Figure 5.
TEM images of the Cu–Cr–In alloy annealed at 550 °C for various times. (a,b) 60 min; (c,d) 240 min.

Figure 6.
TEM images of the Cu–Cr–In alloy annealed at 650 °C for various times. (a,b) 60 min; (c,d) 240 min.
Figure 6.
TEM images of the Cu–Cr–In alloy annealed at 650 °C for various times. (a,b) 60 min; (c,d) 240 min.

Figure 7.
XRD patterns of annealed Cu–Cr–In samples.

Figure 8.
Recrystallization kinetics of 60% cold drawn Cu–Cr–In alloy by Johnson–Mehl–Avrami–Kolmogorov plot for different annealing conditions. (a) t − XV, (b) lnt − ln[−ln(1 − XV)].
Figure 8.
Recrystallization kinetics of 60% cold drawn Cu–Cr–In alloy by Johnson–Mehl–Avrami–Kolmogorov plot for different annealing conditions. (a) t − XV, (b) lnt − ln[−ln(1 − XV)].

Figure 9.
Relationship between ln(1/tR) - 1000/T of 60% cold drawn Cu–Cr–In alloy.


Table 1.
Measured composition of as-cast Cu–Cr–In alloys (wt.%).
| Elements | Cr | In | Cu |
|---|---|---|---|
| Measured composition | 0.54 | 0.17 | Surplus |
Table 2.
Percentage of each grain type in Cu–Cr–In alloy for different annealing conditions (%).
| Grain | 450 °C | 550 °C | 650 °C | |||
|---|---|---|---|---|---|---|
| 60 min | 240 min | 60 min | 240 min | 60 min | 240 min | |
| Recrystallization | 1.63 | 2.49 | 8.07 | 11.48 | 59.53 | 80.97 |
| Substructure | 0.00 | 0.01 | 0.04 | 0.91 | 10.84 | 15.80 |
| Deformed Structure | 98.37 | 97.50 | 91.90 | 87.61 | 29.63 | 3.23 |
Table 3.
Dislocation density of annealed Cu–Cr–In alloy (m−2).
| Time | 450 °C | 550 °C | 650 °C |
|---|---|---|---|
| 60 min | 1.77 × 10¹⁴ | 1.29 × 10¹⁴ | 7.71 × 10¹³ |
| 240 min | 1.30 × 10¹⁴ | 1.21 × 10¹⁴ | 3.08 × 10¹³ |
© 2020 by the authors. Licensee MDPI, Basel, Switzerland. This article is an open access article distributed under the terms and conditions of the Creative Commons Attribution (CC BY) license (http://creativecommons.org/licenses/by/4.0/).
Share and Cite
MDPI and ACS Style
Zhu, Y.; Tang, L.; Xie, W.; Chen, H.; Wang, H.; Yang, B. Study on the Softening Behavior of Cu–Cr–In Alloy during Annealing. Crystals 2020, 10, 312. https://0-doi-org.brum.beds.ac.uk/10.3390/cryst10040312
AMA Style
Zhu Y, Tang L, Xie W, Chen H, Wang H, Yang B. Study on the Softening Behavior of Cu–Cr–In Alloy during Annealing. Crystals. 2020; 10(4):312. https://0-doi-org.brum.beds.ac.uk/10.3390/cryst10040312
Chicago/Turabian StyleZhu, Yunqing, Linsheng Tang, Weibin Xie, Huiming Chen, Hang Wang, and Bin Yang. 2020. "Study on the Softening Behavior of Cu–Cr–In Alloy during Annealing" Crystals 10, no. 4: 312. https://0-doi-org.brum.beds.ac.uk/10.3390/cryst10040312
Note that from the first issue of 2016, this journal uses article numbers instead of page numbers. See further details here.