Photo-Aligned Ferroelectric Liquid Crystal Devices with Novel Electro-Optic Characteristics


1
School of Physics and Optoelectronic Engineering, Foshan University, Foshan 528325, China
2
Department of Theoretical Physics, Moscow Region State University, 141014 Mytishi, Russia
3
School of Instrumentation and Optoelectronic Engineering, Beihang University, Beijing 100191, China
4
Department of Medical Physics and Informatics, Bashkir State Medical University, 450008 Ufa, Russia
*
Author to whom correspondence should be addressed.
Crystals 2020, 10(7), 563; https://0-doi-org.brum.beds.ac.uk/10.3390/cryst10070563
Submission received: 18 May 2020
/
Revised: 4 June 2020
/
Accepted: 19 June 2020
/
Published: 1 July 2020
(This article belongs to the Special Issue A 10 Years Journey: Chemical, Physical, and Biological Properties and Applications of Crystals)
Abstract
:This paper examines different applications of ferroelectric liquid crystal devices based on photo-alignment. Successful application of the photo-alignment technique is considered to be a critical breakthrough. A variety of display and photonic devices with azo dye aligned ferroelectric liquid crystals is presented: smart glasses, liquid crystal Pancharatnam–Berry phase optical elements, 2D/3D switchable lenses, and laser therapy devices. Comparison of electro-optical behavior of ferroelectric liquid crystals is described considering the performance of devices. This paper facilitates the optimization of device design, and broadens the possible applications in the display and photonic area.
1. Introduction
The appearance of portable and wearable devices has led to an ever-increasing demand for next-generation displays with ultra-high resolution, light weight, low power consumption, and high efficiency [1,2]. However, the response time of nematic liquid crystals (LCs) is too slow for fast-switching devices. Fast response time of LCs is required to reduce motion blur, to enable field sequential color system (FSC) [3], and to improve low-temperature performance. Versatile photonic devices, e.g., LC lenses, tunable focusers, and wave front correctors, must have 2π modulation. Therefore, much effort has been made to improve the response time of various electro-optic modes in liquid crystals [4].
One of the most interesting functional materials for future display devices is chiral smectic liquid crystals. Reduced symmetry of such liquid crystals can exhibit ferroelectric properties, thereby giving them high operational speed and resolution far superior to the usual nematic technology.
Ferroelectricity in LCs does exist in smectic phase C* (SmC*). Interaction of anisometric molecules gives rise to a long-range order of long molecular axes. This leads to the anisotropy of various physical parameters. Centers of mass of the SmC* molecules are located in parallel plane layers. The SmC* molecules are confined to rotate within the smectic planes, while the director field n (i.e., the most probable orientation of long molecular axes and the optical axis) is constrained to tilt away from the layer normal by some angle θ, which depends on the FLC chemical structure and temperature.
In order to gain some insight into the properties of SmC* phase, it is important to understand the concept of symmetry as it is applied to materials. Smectic layers of SmC* phase have a point symmetry group C2. The secondary axis belongs to the smectic plane and is perpendicular to the director tilt plane. Absence of the symmetry planes is associated with the chirality of SmC* molecules. This means that if molecules have a dipole moment, the spontaneous polarization Ps will be directed along the C2 polar axis. The tilt angle θ value does not depend on the layer position, while the azimuthal angle φ (which specifies the director orientation) does change. As a result, the director field and the spontaneous polarization exhibit a helical structure. Such FLCs are known as helical liquid crystals.
Although 35–45 years have passed since pioneering studies were undertaken [5] (in comparison, the fundamental discoveries in nematic LCs for display technology were made in the late 1960s), the temperature dependent behavior of ferroelectric liquid crystals (FLCs) and surface alignment problems have not been solved. Understanding the physics of FLCs for display systems and photonic devices has become crucial for modern devices.
In this review we describe recent achievements in the application of FLCs for prototype devices and strategies to overcome the remaining obstacles for large-scale commercial application of smectic liquid crystals. The discussed applications also address the fundamental questions about the electrical and optical properties of soft condensed matter, unusual types of self-organization at the nanometer scale.
Section 2 describes the photo-alignment technique, which is the fundamental basis for the fabrication of the prototype devices. Synthesized sulfonic azo dye SD-1 is deemed preferable to obtain high alignment quality of FLCs, especially for large and curved surface areas. Section 3 addresses the polymer stabilization of FLCs for electrically suppressed helix ferroelectric liquid crystal (ESHFLC) mode. This section is relevant to the inherent temperature dependent behavior of FLCs. The reported results indicate that the optical contrast ratio in polymer-stabilized FLCs is higher than 4,000:1 and the smectic cone angle θ remains fairly constant within the temperature range from −10 °C to 40 °C. Section 4 is a series of subsections dealing with the application of FLCs for smart glasses, Pancharatnam-Berry phase lens, 2D/3D switchable displays, high resolution displays, and photobiomodulation. Applications considered in Section 4 mainly use the photo-alignment technique.
2. Photo-Induced Surface Alignment of FLCs
The rubbing technique or mechanical buffing of polyimide layers remains the current method of choice for the large-scale production of liquid crystal (LC) displays. Meanwhile, there is a widespread interest in photo-alignment because rubbing produces many impurities, electrostatic charges on polyimide aligning films, and mechanical damage. These undesired effects can be completely avoided if the photo-alignment technique is used [6]. In particular, the photo-alignment technique is highly promising for FLCs because of its inherent sensitivity to non-uniformities and damage of aligning layers. A homogeneous, reproducible, and steady FLC alignment is essential for bistable switching. The bistability phenomenon and multiplex mode degradation of passively addressed FLC display cells, which were aligned by the ordinary rubbing technique, has been reported [7]. In order to improve the FLC alignment quality, various aligning surfaces have been studied. A hybrid between linearly photopolymerized polymers and liquid crystal polymer layers provides good alignment quality of deformed helix ferroelectric liquid crystal (DHFLC), but it requires complex technological methods. Photoanisotropic azo dye films combined with polyvinylalcohol can also be used for photo-alignment of FLCs, but this approach does not prevent the bistability degradation [8]. Defect-free FLC displays were also fabricated using UV-irradiated polyimide films by a two-step exposure method. A high contrast ratio and perfectly bistable switching were demonstrated. Murakami et al. fabricated a half-V-shaped photo-aligned FLC display with the electro-optic performance, which overcomes the FLC display, fabricated by rubbing with a high switching angle under low voltage [9]. Thus, the photo-alignment technique has demonstrated its success for fabrication of polymer-stabilized V-shape and half-V-shaped FLC displays. Sufficiently long UV-illumination of polyimide films shows that it promotes defect-free alignment of surface-stabilized FLC layers. Synthesized sulfonic azo dye SD-1 was successfully tested for the alignment of FLCs and nematic LCs. Pure reorientation of molecular absorption oscillators perpendicular to the polarization plane of the UV light without any photochemical transformations and a minimum of undesired charges make this azo dye suitable for experimental studies. Therefore, high photo-alignment quality of FLCs on azo dye SD-1 layers can be achieved.
Below, in this section a method for FLC photo-alignment using SD-1 aligning layers with various thicknesses is described. The FLC alignment quality and the steadiness of bistable switching during multiplex operation of passively addressed FLC display cells are also considered. We also compare the surface free energy for different FLC aligning layers (i.e., rubbed polyimides and photo-aligned azo dyes). The approach proves to be appropriate for the comparative characterization of different FLC aligning surfaces [10].
2.1. Experimental
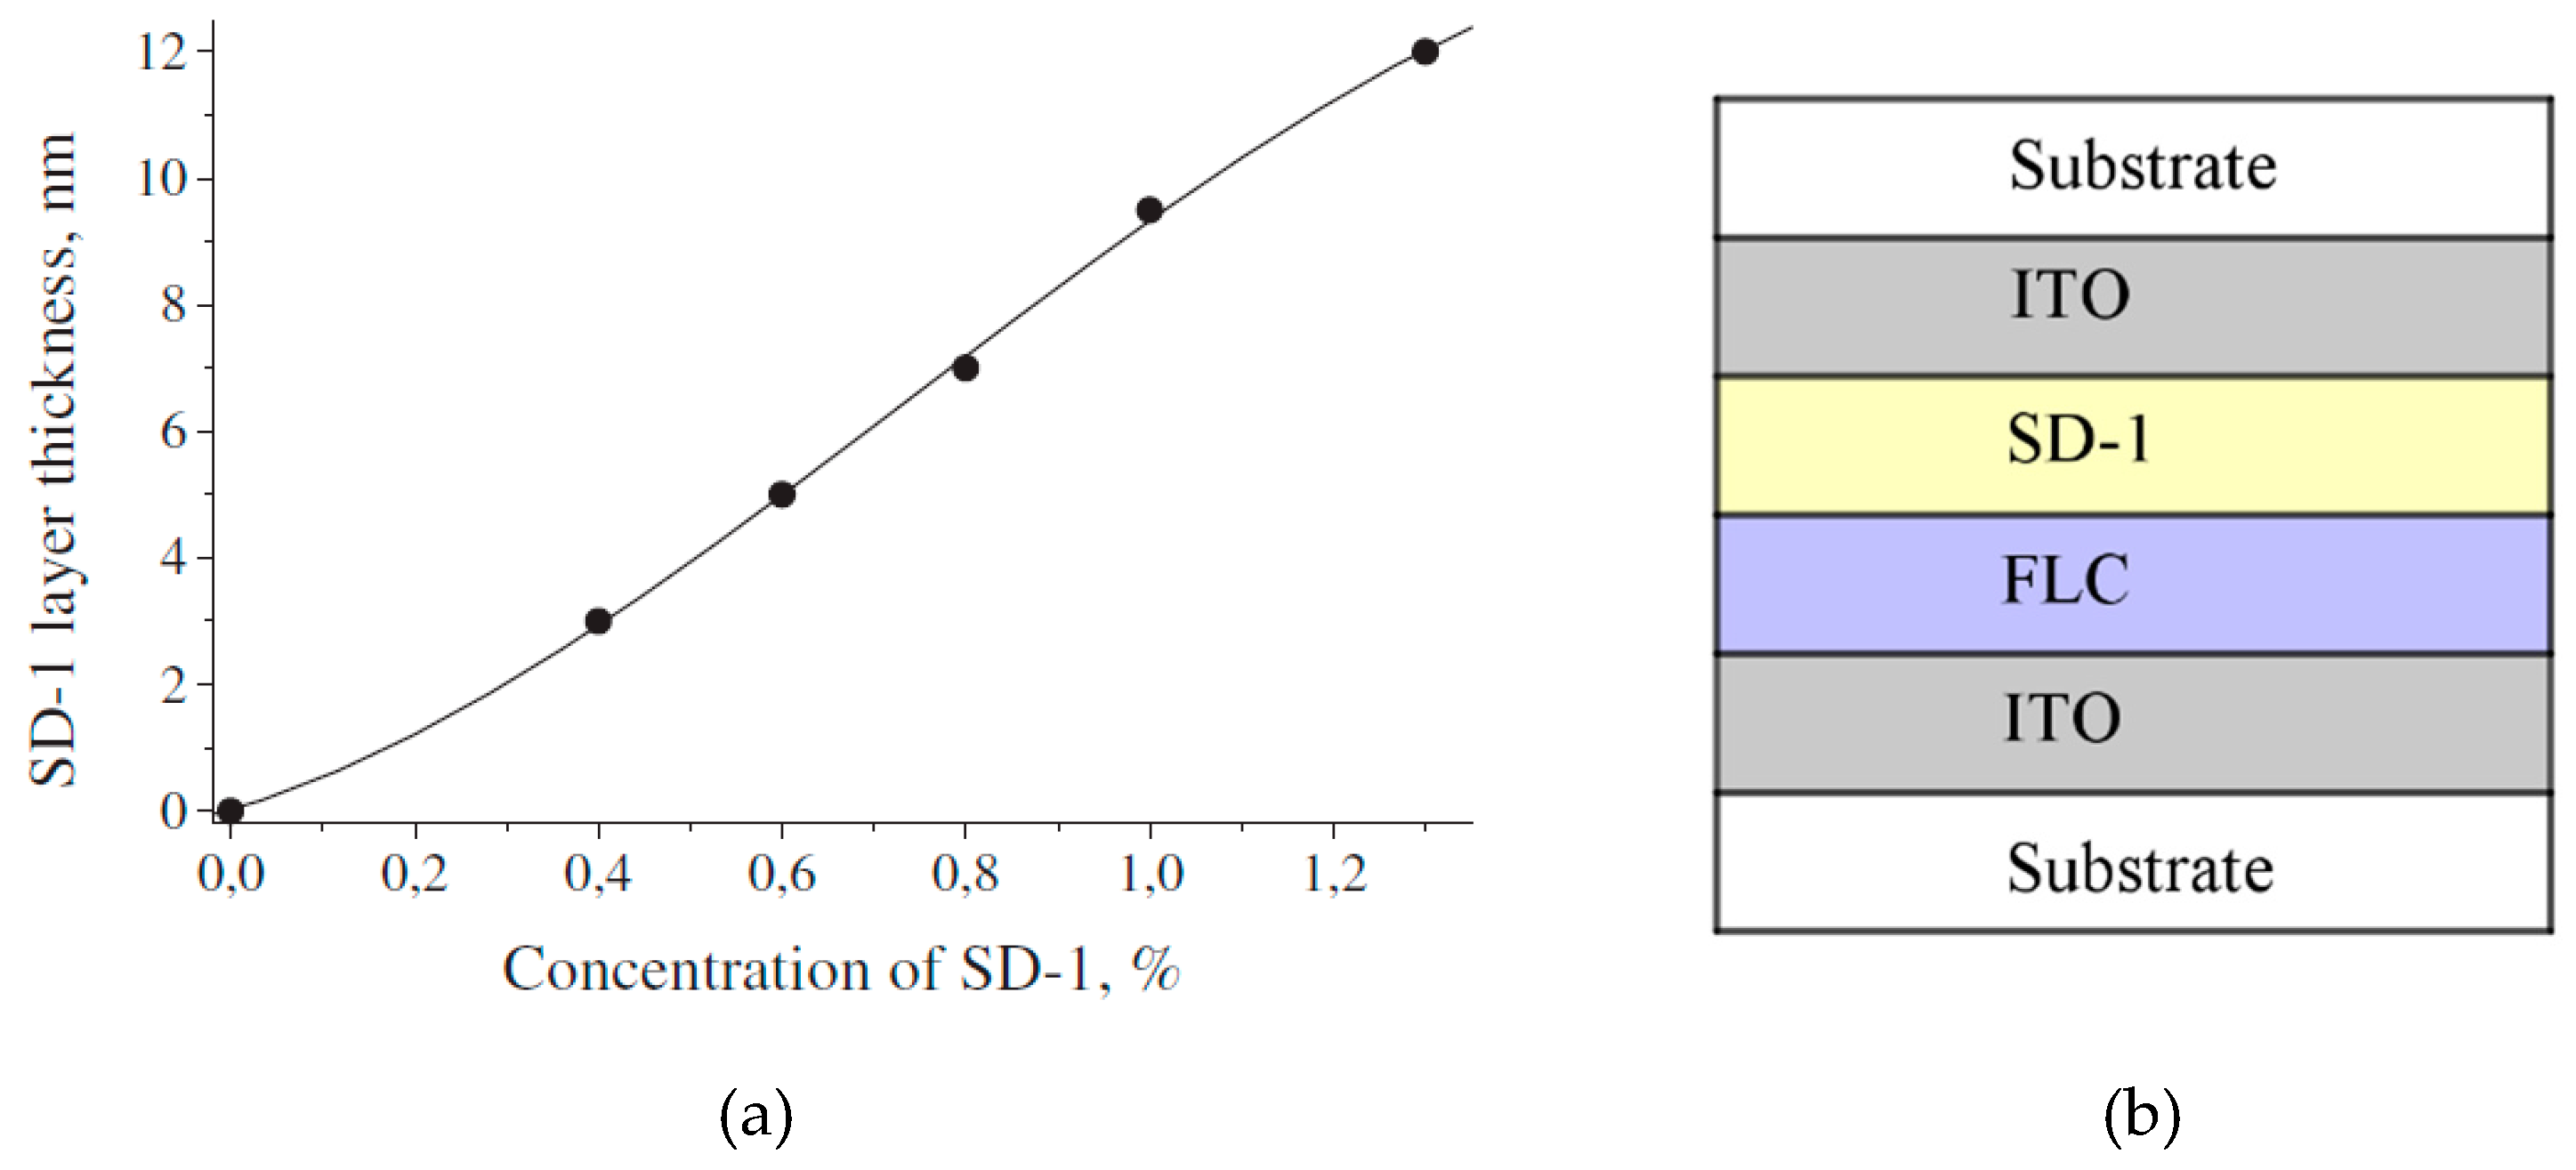
In an effort to study azo dye SD-1 layers, various films of different azo dye layer thicknesses on ITO surfaces were prepared using N,N-dimethylformamide (DMF) solutions with azo dye concentrations ranging from 0.2% to 1.3%. The azo dye solutions were spin-coated on ITO electrodes at 3500 rpm and the surfaces were dried at 100 °C. UV light was used to irradiate the surface of the SD-1 layer. An interference filter at 365 nm and a polarizing filter were also used. The intensity of polarized light was 6 mW/cm2. The thickness of the azo dye layer was measured by an atomic force microscope (AFM). The SD-1 layer thickness was varied within 0 and 12 nm as shown in Figure 1a.
The best alignment quality was achieved under asymmetric boundary conditions, i.e., only one ITO surface was treated by the SD-1 layer, while another ITO surface was simply washed in the DMF. This is essential to avoid the competition between the alignment effects produced by the substrates. The distances between the surfaces were 1.5 μm and 4.85 μm. Thus, after assembling the FLC cells, asymmetric boundary conditions of the FLC layer were arranged (Figure 1b).
Traditional polyimide PMDA-ODA, a polymeric dianhidride and 4,4’-oxydianiline layer with uniform FLC alignment on its rubbed surface, was used. Next, the quality of the cells, which were prepared by using the rubbed polyimide layer and the photo-aligned azo dye layer SD-1 was compared. Isotropic phase of the FLC mixtures (FLC-408A, FLC-451A and FLC-445, which were synthesized by the P. N. Lebedev Physical Institute of Russian Academy of Sciences) was injected into the cell by capillary action. Electro optical measurements were carried out for the wavelength λ = 632.8 nm.
2.2. Fundamental Results
Sufficiently large exposure time texp (exposure energy) and decrease of dislocation density improve the contrast ratio (Figure 2a). This is confirmed by FLC textures images, which are depicted in Figure 2b,c. Bright stripes in Figure 2b show the dislocation lines in the dark state. The dislocations vanish when the exposure time is sufficiently long (see Figure 2c).
Asymmetric boundary conditions play a crucial role even if the rubbed polyimide layer is used instead of the azo dye layer (Figure 1b and Figure 2d,e). In this case, the defects can be suppressed (Figure 2e). Asymmetric fabrication of the substrates was essential to avoid the competition in the alignment, which is governed by the surfaces. The ITO electrode itself favors focal-conic or planar degenerated alignments, i.e., all directions on the substrate plane are energetically identical. In contrast to this, the rubbed polyimide layer (or the photo-aligned SD-1 layer) gives the preferred direction of the molecular alignment, which dominates within the entire FLC cell (Figure 2b–e). Here, the SD-1 layer thickness was determined by the rotation speed and concentration of SD-1 solution during the spin-coating fabrication process.
Helix-free FLCs are very sensitive to the alignment quality of the dye layer. Therefore, in Figure 2f,g we observe more uniform alignment than the deformed helix FLC mixtures. The contrast ratio of the cell filled with the helix-free FLC-445 was superior at 1500:1 for texp = 60 min and 400:1 for texp = 10 min. This fact allows us to conclude that the helix-free structure of FLCs is preferable for photo-alignment.
2.3. Prototype
Uniform and continuous 3–5 nm thick photo-aligning layers provide high spatial optical uniformity within a large surface area (Figure 3a). Therefore, we believe that photo-aligned FLC displays must have remarkable properties, which can be considered for technological background for passively addressed display devices.
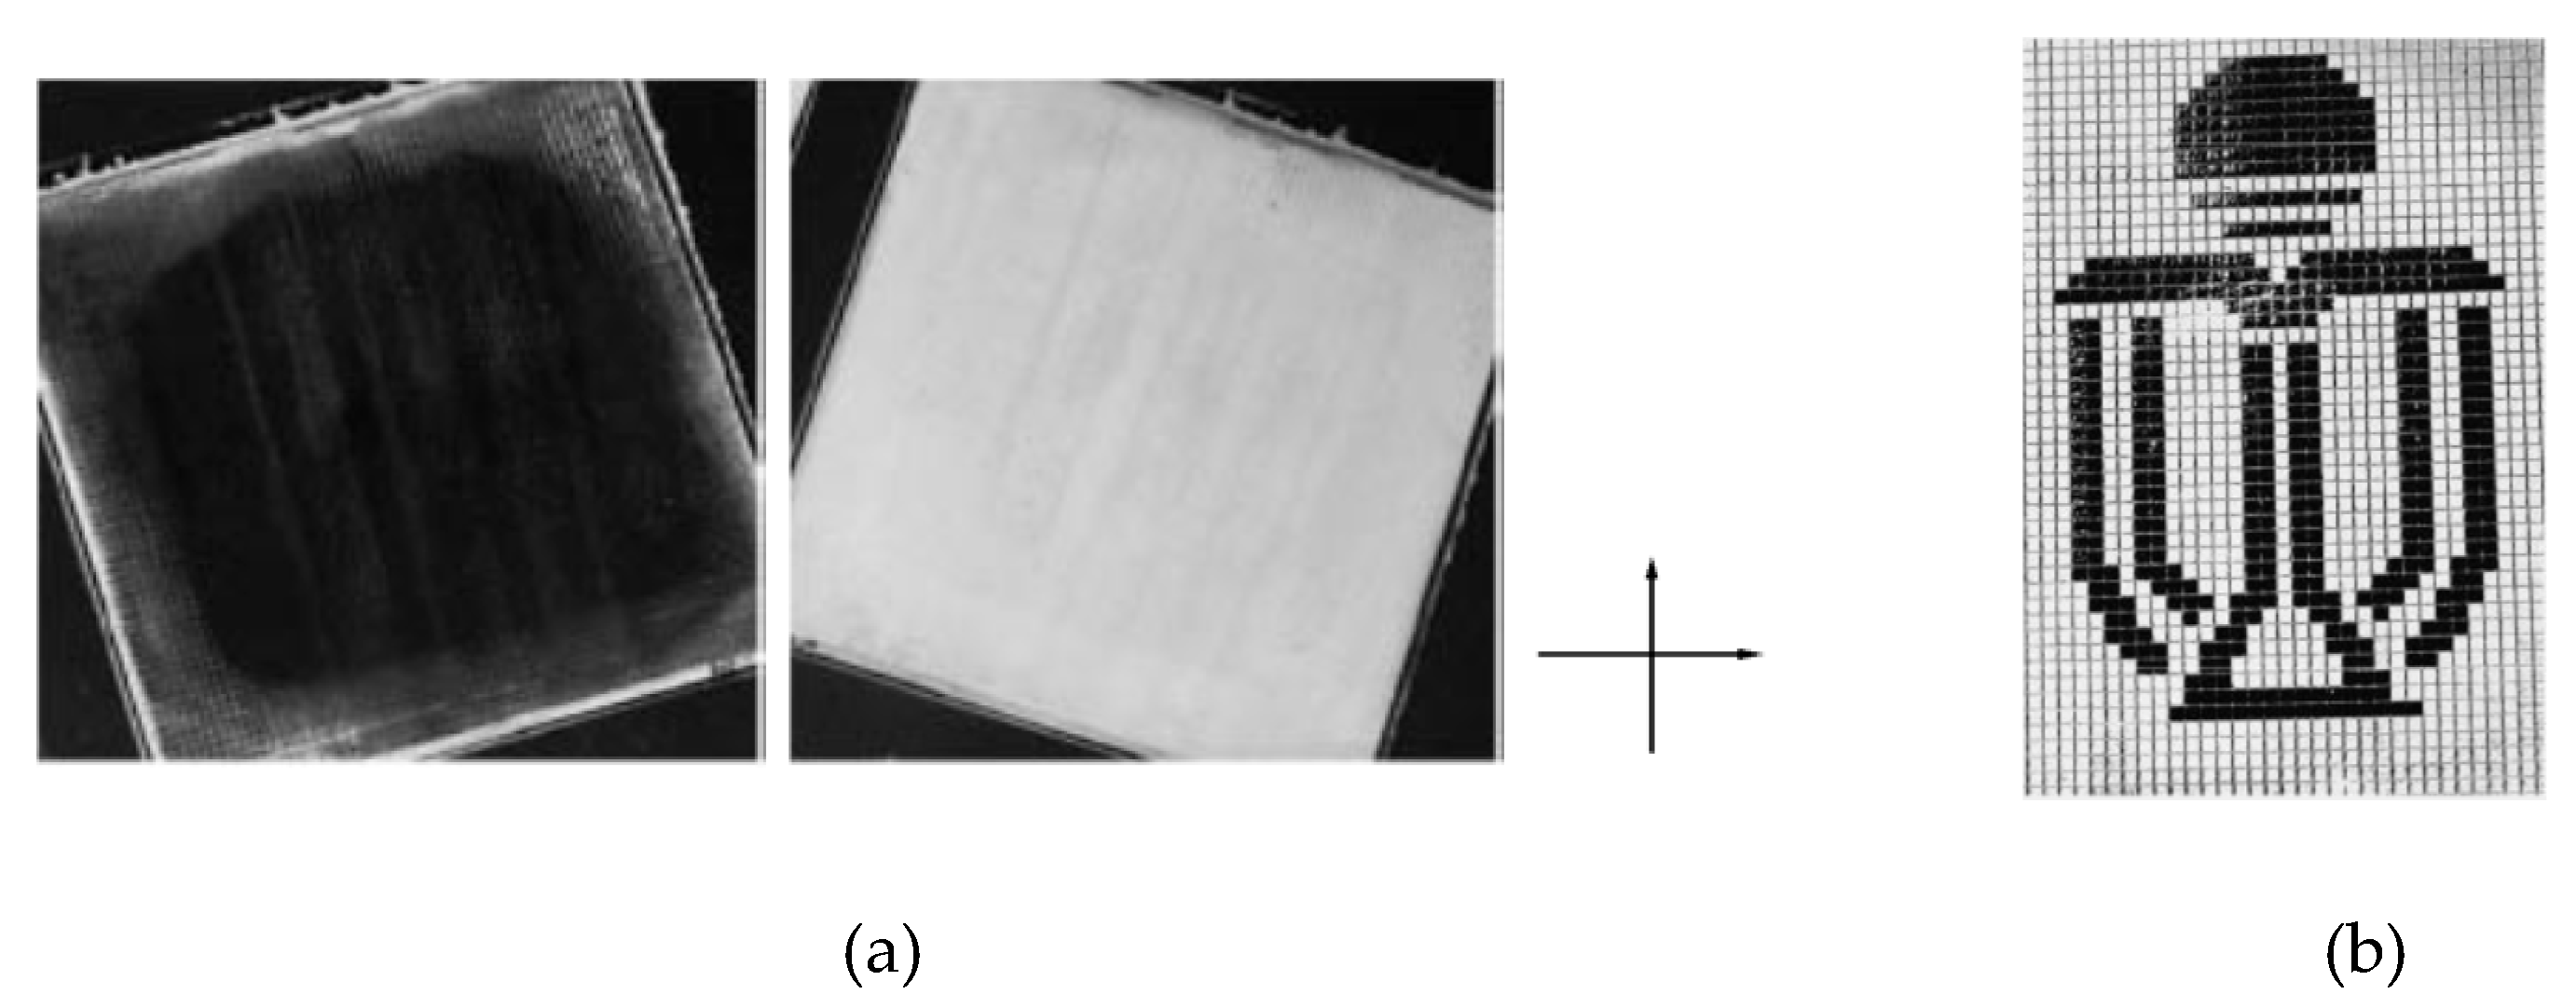
Consider a prototype of a passively addressed 64 × 64 pixel display, which was fabricated using the photo-alignment technique under asymmetric boundary conditions. The display matrix has the dimensions of 33 × 33 mm and the FLC layer thickness is 5 μm thick. The fabricated display was capable of memorizing the generated images for a period of several days after the driving voltage was switched off (Figure 3b). The chosen 5 μm cell gap has better bistablity and multiplex operation steadiness, and is easier to assemble than traditional 1.5 μm cells.
2.4. Summary
The difference between the surface energy of the aligning substrates and the FLC surface energy mainly characterizes the overall alignment quality of FLC cells. However, both structure and thickness of FLC layers are important. Perfect alignment quality can be achieved only by means of asymmetric boundary conditions. The exposure energy of the SD-1 layer should be sufficiently high. Another essential condition for uniform FLC alignment is high anisotropy of the azo dye surface structure: parallel and perpendicular to the polarization plane of the UV light. The optimal azo dye layer thickness (3–5 nm) provides the highest multiplex operation steadiness and the high contrast ratio. The optimal photo-aligning layer thickness is the compromise between the two types of FLC layer alignment instabilities: focal-conic domains and ferroelectric domains.
3. Polymer Stabilization of FLCs
Electrically suppressed helix ferroelectric liquid crystal is the diffraction-free electro-optical mode, where high contrast ratio and fast response time are achieved with low driving voltage [11]. Two main constraints are imposed on this electro-optical mode: alignment layer and the cell gap. In addition to this, temperature dependence of cone angle adds new constraints to real applications of ESHFLC. If the key problems are solved, then the ESHFLC mode can be promising for field sequential color display, high-resolution displays (e.g., pico-projectors, 3D displays, micro-displays), and fast response photonics devices (e.g., modulators, filters, and attenuators). The detailed characteristics of the ESHFLC mode are given in ref. [12]. In this section, we outline the experimental issues of polymer stabilization, which does not change key parameters outside of the range of constraints for ESHFLCs.
The main problem hindering commercial exploitation of ESHFLC mode is the temperature dependence of the cone angle and the response time. It is known that the smectic C* cone angle strongly decreases when temperature increases, in particular, near the ferroelectric to paraelectric phase transition temperature. Consequently, the optical contrast decreases. On the other hand, high viscosity at lower temperatures is the reason for increased response time. Other FLC modes, e.g., DHFLC and anti-FLCs, demonstrate better temperature dependence, however, the optical quality of these modes needs further research.
Strong chemical bonds of polymers can affect the alignment of LC molecules to a great extent [13]. Two types of polymer confinements in LCs are popular: 1) polymer-dispersed LCs, (the polymer concentration overcomes LC concentration), and 2) polymer-stabilized LCs (LC concentration is much higher than polymer concentration). When a polymer network is added into the FLC structure, the interaction between the polymer molecule and FLC molecule appears. Of course, this interaction imposes new constraints on the dynamics of the FLC molecules. Next, we consider some experimental details with polymer-stabilized FLCs.
3.1. Experimental
The main effects of the addition of polymer in the FLC structure are the change of the phase transition temperature and the appearance of light scattering. The latter is due to the different refractive indexes of polymer and FLC.
For the experiment we used monomer RMM257 (Merck) as the guest and pure FLC FD4004N (Dianippon Ink and Chemical Ltd.) as the host components, respectively. The chosen FLC exhibits the phase sequence: Cr→ Smectic C* (SmC*)→Smectic A (SmA)→N→I at temperatures −20, 72, 95, and 105 °C, respectively [14].
The FLC monomer composite was prepared by mixing the monomer in pure FLC. The monomer concentrations ranged from 2 to 15% wt/wt. The photoinitiator concentration ranged from 2 to 10% wt/wt of the monomer concentration. Higher values of the photoinitiator concentrations could accelerate the polymerization rate. After several optimization experiments, we found that 8% wt/wt of the monomer gives sufficiently fast polymerization rate without undesired effects. By heating the mixture to the isotropic transition temperature (~120 °C) and agitating the vial containing the guest–host mixture, uniform distribution of the monomer within the FLC structure was achieved.
To fabricate the cell, we used ITO-coated substrates as the electrodes, which were coated with the azo dye SD-1. Then, the substrates were irradiated by UV light to enable us to achieve planar alignment. The thickness of the cells was maintained at 1.5 μm. The mixture at the temperature slightly lower than the N-I transition temperature was filled into the cells by capillary action. If, after the polymerization process, the composites show optical parameters (at 30 °C) that satisfy the ESHFLC constraints, then the cell can be considered successful. The polymerization at lower temperatures immediately after the cell filling is important to avoid the near surface localization of the polymer network. An illustration of the ESHFLC cell is shown in Figure 4a.
The measurement results in Figure 4b show temperature dependencies of the tilt angle for restricted polymer-stabilized electrically suppressed helix ferroelectric liquid crystals (RPSESHFLCs) with different monomer concentrations. This experimental study brought up two important conclusions. First, as expected, the effective tilt angle decreases as the guest polymer concentration increases. Consequently, the light transmittance decreases. However, the total transmittance loss does not exceed 4%, which is not significant. Recent theoretical investigations of the director profile also show its insignificant dependence versus the polymer density [15]. Second, in comparison with pure FLC compounds, the observed stability of the tilt angle is relatively better. Therefore, for a certain temperature range, the cone angle can be considered constant.
The transmittance for composites is plotted versus the voltage in the inset of Figure 4b. The measurements at room temperature show ~100% light transmittance through the ESHFLC cell with pure FLC. When the light travels through 3.5% wt/wt polymer concentration in the FLC, the ESHFLC cell has 96% light transmittance.
The experiments performed enable us to conclude that low polymer concentration does not significantly affect the transmittance. The polymer concentration of 3.5% wt/wt is the most suitable for different applications. However, it is important to check whether the material parameter for the RPSESHFLCs is still within the constraint limit of the ESHFLC electro-optical mode and does not adversely affect electro-optical properties.
3.2. Prototype
The obtained RPSESHFLC materials were applied to the field sequential color display, which is based on passive matrix addressing. Several generated 3-bit greyscale images are shown in Figure 5. The overall performance of the display was good, and reflected similar parameters, which were obtained during the fundamental experiments.
The resultant RPSESHFLC material has optimized and stable electro-optical parameters within a certain temperature range. The polymer network does not affect key parameters, which characterize ESHFLC mode. The tilt angle of the RPSESHFLC samples is stable within the temperature range from −10 to 40 °C. Consequently, the optical contrast ratio of the proposed display is also constant, i.e., higher than 4,000:1. The contrast ratio of the RPSESHFLC at 50 °C is about 600:1. These results motivate further improvement of FLC materials.
3.3. Summary
Thus, RPSESHFLC materials can find applications in many modern devices, e.g., field sequential color displays, photonic devices (modulators, filters, attenuators), and high-resolution displays.
4. Novel Applications
4.1. Smart Glasses
A device capable of operating the modulated optical state of incident light by changing the voltage, current, light, or heat is known as switchable glass or smart window. The market for smart windows includes architectural and automotive windows, and covers information displays for augmented reality (AR). Thus, smart glasses can be classified as passive (e.g., thermochromic materials) or active glazing (e.g., electrochromics, gasochromic windows, suspended particle devices, and LC-based smart windows). Such devices are often targeted to control sunlight. As a result, heat transfer is reduced and cooling loads decrease.
Polymer dispersed liquid crystal (PDLC) films have potential for application in devices requiring shuttered or modulated light. Since the original discovery of PDLCs [16], considerable efforts have been made in the enhancement of PDLC performance. For instance, the transparent state (voltage OFF) is achieved by using dual-frequency LCs with the proper concentration of polymer [16], and a self-powered switchable solar window is assembled by combining a-Si absorbing layer with a PDLC transmission modulator [17]. Meanwhile, there exist some critical problems, such as relatively high operating voltage (i.e., several tens of volts) and limited light transmission control range, which hinder the application of PDLC devices.
In this section we detail a study performed to investigate the sustainability of a smart glass prototype. The developed prototype is based on micro-patterned liquid crystal Fresnel lenses and three proof-of-concept prototypes were used to demonstrate the characteristics of our device. In spite of high voltage switching between clear and scattering (diffusive) states in the work of other researchers, image distortion state (blurry state) of the proposed smart glass can be switched to a clear state by applying only two volts. This arrangement also demonstrates a clear state (voltage OFF) and fast switching time.
The proposed smart glass prototype was fabricated using micro-patterned liquid crystal Fresnel lenses with randomly chosen focal lengths (see Figure 6a) [18]. A liquid crystal layer was sandwiched between two patterned aligning layers (SD-1 by DIC, Japan) and ITO-coated substrates. Commercially available LC compound E7 (Merck) with the birefringence Δn = 0.2161 at the wavelength of 656 nm was used to fabricate the cell, which approximately satisfies the half-wave condition for λ = 632.8 nm. Such a design endows LC Fresnel lenses with diffraction efficiency (i.e., the fraction of the incident light diffracted out of the zero order) near 40.5% for non-polarized light.
In order to fabricate the prototype device, a sulfonic azo dye SD-1 (0.5 wt.% in DMF) was spin-coated on ITO-substrates. Upon soft baking at 120 °C for 5 min, the substrates were spaced 1.5 μm apart, and the cell was fabricated. The empty cell was exposed by highly collimated and linearly polarized ultraviolet light (λ = 365 nm, 0.01 W/cm2) until the irradiation dose achieved 5 J/cm2. Then, the cell was rotated 90° within the substrate plane and exposed once again through a photomask, which is the amplitude mask with Fresnel zone patterns and contacts with the empty cell. Each Fresnel zone pattern can be considered a single diffractive lens with many concentric rings with the radius , where k=1,2,3…; λ is the wavelength of the incident light (632.8 nm); and f is the designed focal length. Non-overlapping Fresnel zone patterns with different focal lengths are located at different positions of the photomask. In order to create the alignment directions, a sufficient irradiation dose ( > 5 J/cm2) of UV light must be applied to the cell. In this case, the easy axis of SD-1 molecules in the exposed window areas is rotated to the perpendicular direction of the polarization plane. Upon these manipulations, the LC compound E7 can be injected into the cell by capillary action. The substrates, which are coated by SD-1, must also be post-treated by the photostabilization technique to prevent the photo-alignment layer from being irradiated by the UV light component in daylight. When the liquid crystal is injected between the substrates, the fabrication of smart glass prototype (P-1) is complete.
In order to compare the performance of a circular Fresnel zone pattern array with unitary focal length and randomly located Fresnel zone patterns with different focal lengths, we prepared two other photomasks.
In order to locally control the smart glass, we can use a patterned ITO or thin-film-transistor (TFT). Schematic representation of P-1 is depicted in Figure 6b. When a chromatic light source irradiates the smart glass, the Fresnel lenses under the zero voltage produce the focusing effect. As a result, the blurry state (lenses ON) is observed (see Figure 6c). On the other hand, when the saturated voltage (2 V) is applied to the lenses (dashed ring patterns in Figure 6b), LC molecules are vertically oriented. This means that the light beam travels through the substrates without any change in propagation direction, and a clear state (lenses OFF) is observed (see Figure 6c). It should be noted that the LC Fresnel lens is the wavelength-dependent diffractive optical element. Such elements have a series of prerequisites: (1) the designed focal length is inversely proportional to the wavelength (f~λ−1 for the given pattern); (2) the half-wave condition; and (3) the material dispersion of LC.
The smart glass works as follows. Chromatic light beams are focused to different points with various diffraction efficiencies. Note that the diffraction efficiency for the designed wavelength (632.8 nm) has the highest magnitude among all wavelengths.
Figure 7a shows a photograph of the prototype device with the set of focal lengths under crossed polarizers. A snapshot of LC Fresnel lenses was taken using a polarizing optical microscope (POM), and is shown in Figure 7b. We note that the directors of LCs are orthogonal for odd and even zones. The boundaries between the adjoining zones are denoted by white lines. Consequently, the incident light beam (λ = 632.8 nm) in any polarization state provides π optical phase shift when it travels through the LC Fresnel lens. This gives rise to the polarization-independent property of diffractive optical elements.
In order to determine focal lengths of the Fresnel lenses, a He–Ne laser (λ = 632.8 nm) was used. The spot size was focused to a diameter of 3 cm. The diffraction patterns can be seen on the screen, which is placed behind the cell. The distance between the LC cell and the screen is L. The corresponding setup is depicted in Figure 7c.
Figure 7d depicts several diffraction patterns for L = 5, 10, 20, and 25 cm. The focal points of the corresponding LC Fresnel lenses appear for certain values of L. The behavior of the light propagation can be roughly speculated and visually imagined according to the presented light distributions as shown Figure 7d. In other words, we observe that the light beam converges to its focal point. The spot size of the focused beam expands after it travels a certain distance from the focal point, and it further spreads out as the propagation distance increases (see Figure 6b).
The experiment for characterizing the image distortion performance of the LC smart glass was carried out through the image capture for a printed paper, which was placed 20 cm away and behind the smart glass (the printed paper was placed parallel to the smart glass for the normal observation, see Figure 8a).
When the alternating current (AC) signal (2V) was applied to the smart glass, a clear (voltage ON) state with the transmittance >90% was immediately obtained (see school logo and several Chinese characters in Figure 8b) from the printed paper. In the absence of the external voltage, the natural light diffusively reflects from the printed paper. Consequently, the image is distorted, giving rise to the blurred image, which is shown in Figure 8c. Note that a part of the smart glass without LC Fresnel lens remains transparent. Indeed, the low driving voltage as a significant merit of the fabricated prototype, making our proposed LC smart glass highly appropriate for versatile applications in portable and wearable technologies.
Experimental studies for oblique observation through the LC smart glass were carried out by horizontal rotation of the device by angle θ (Figure 8d). The captured distorted images for different angles (i.e., 30°, 45°, and 70°) are depicted in Figure 8e–g, respectively. The proposed LC smart glass shows outstanding performance under normal and oblique observations. By elaborating the design of LC lenses with small focal lengths, e.g., less than 1 cm, the smart glass performance can be noticeably enhanced for privacy protection.
Electrically switchable smart glass based on micro-patterned LC Fresnel lenses with randomly set focal lengths was proposed. A proof-of-concept prototype was implemented and compared with other two fabricated prototypes. The proposed prototype shows excellent performance for both clear (transmittance > 90%) and blurry (image distortion) states under normal and oblique directions of observations. We believe that easy fabrication process, flexible designs for blurry and clear states, and low driving voltage will stimulate research for both privacy protection and versatile portable applications.
4.2. Pancharatnam–Berry Phase Optical Elements
Inherent optical birefringence of LCs enables the modulation of the phase shift of the propagating wave in micrometer-scale films. The Pancharatnam–Berry phase is associated with the optical phase shift, which an electromagnetic wave obtains when it undergoes a continuous sequence of polarization state transformations. Unlike the conventional optical phase elements or amplitude gratings, Pancharatnam devices operate by locally modifying the polarization state of light waves passing through them. Their unique optical properties have been recently utilized in various applications: non-mechanical electro-optic beam steerers, imaging spectro-polarimeters, and polarization-independent LC displays [19,20].
The liquid crystal Pancharatnam-Berry lens (PBL) has promising properties of high optical throughput and large uniaxial optical birefringence. Such optical elements can be used in circular polarization dependent devices, for example, communication systems, and virtual and near-eye displays. However, liquid crystalline PBLs have high power consumption and millisecond response times. Several attempts have been made to reduce the response time [21,22].
Pancharatnam lenses are fabricated using photo-alignment technology, which is currently promising. According to the discussion provided in Section 2, this technology involves a photo-alignment azo dye layer, which defines the orientation of the local optic axis of the subsequently assembled half-wave retarder. However, present achievements usually focus on optical elements with a two-domain structure because it is difficult to achieve multi-domain alignment of LCs [23,24]. In addition, many FLC modes are unswitchable for the PB phase due to the optical axes sweep in the plane of the cell substrates. Consequently, application of the proper FLC mode for fast-switchable PBLs and the study of continuous domain structure of FLC optical elements is the key step to develop the PB phase optical elements.
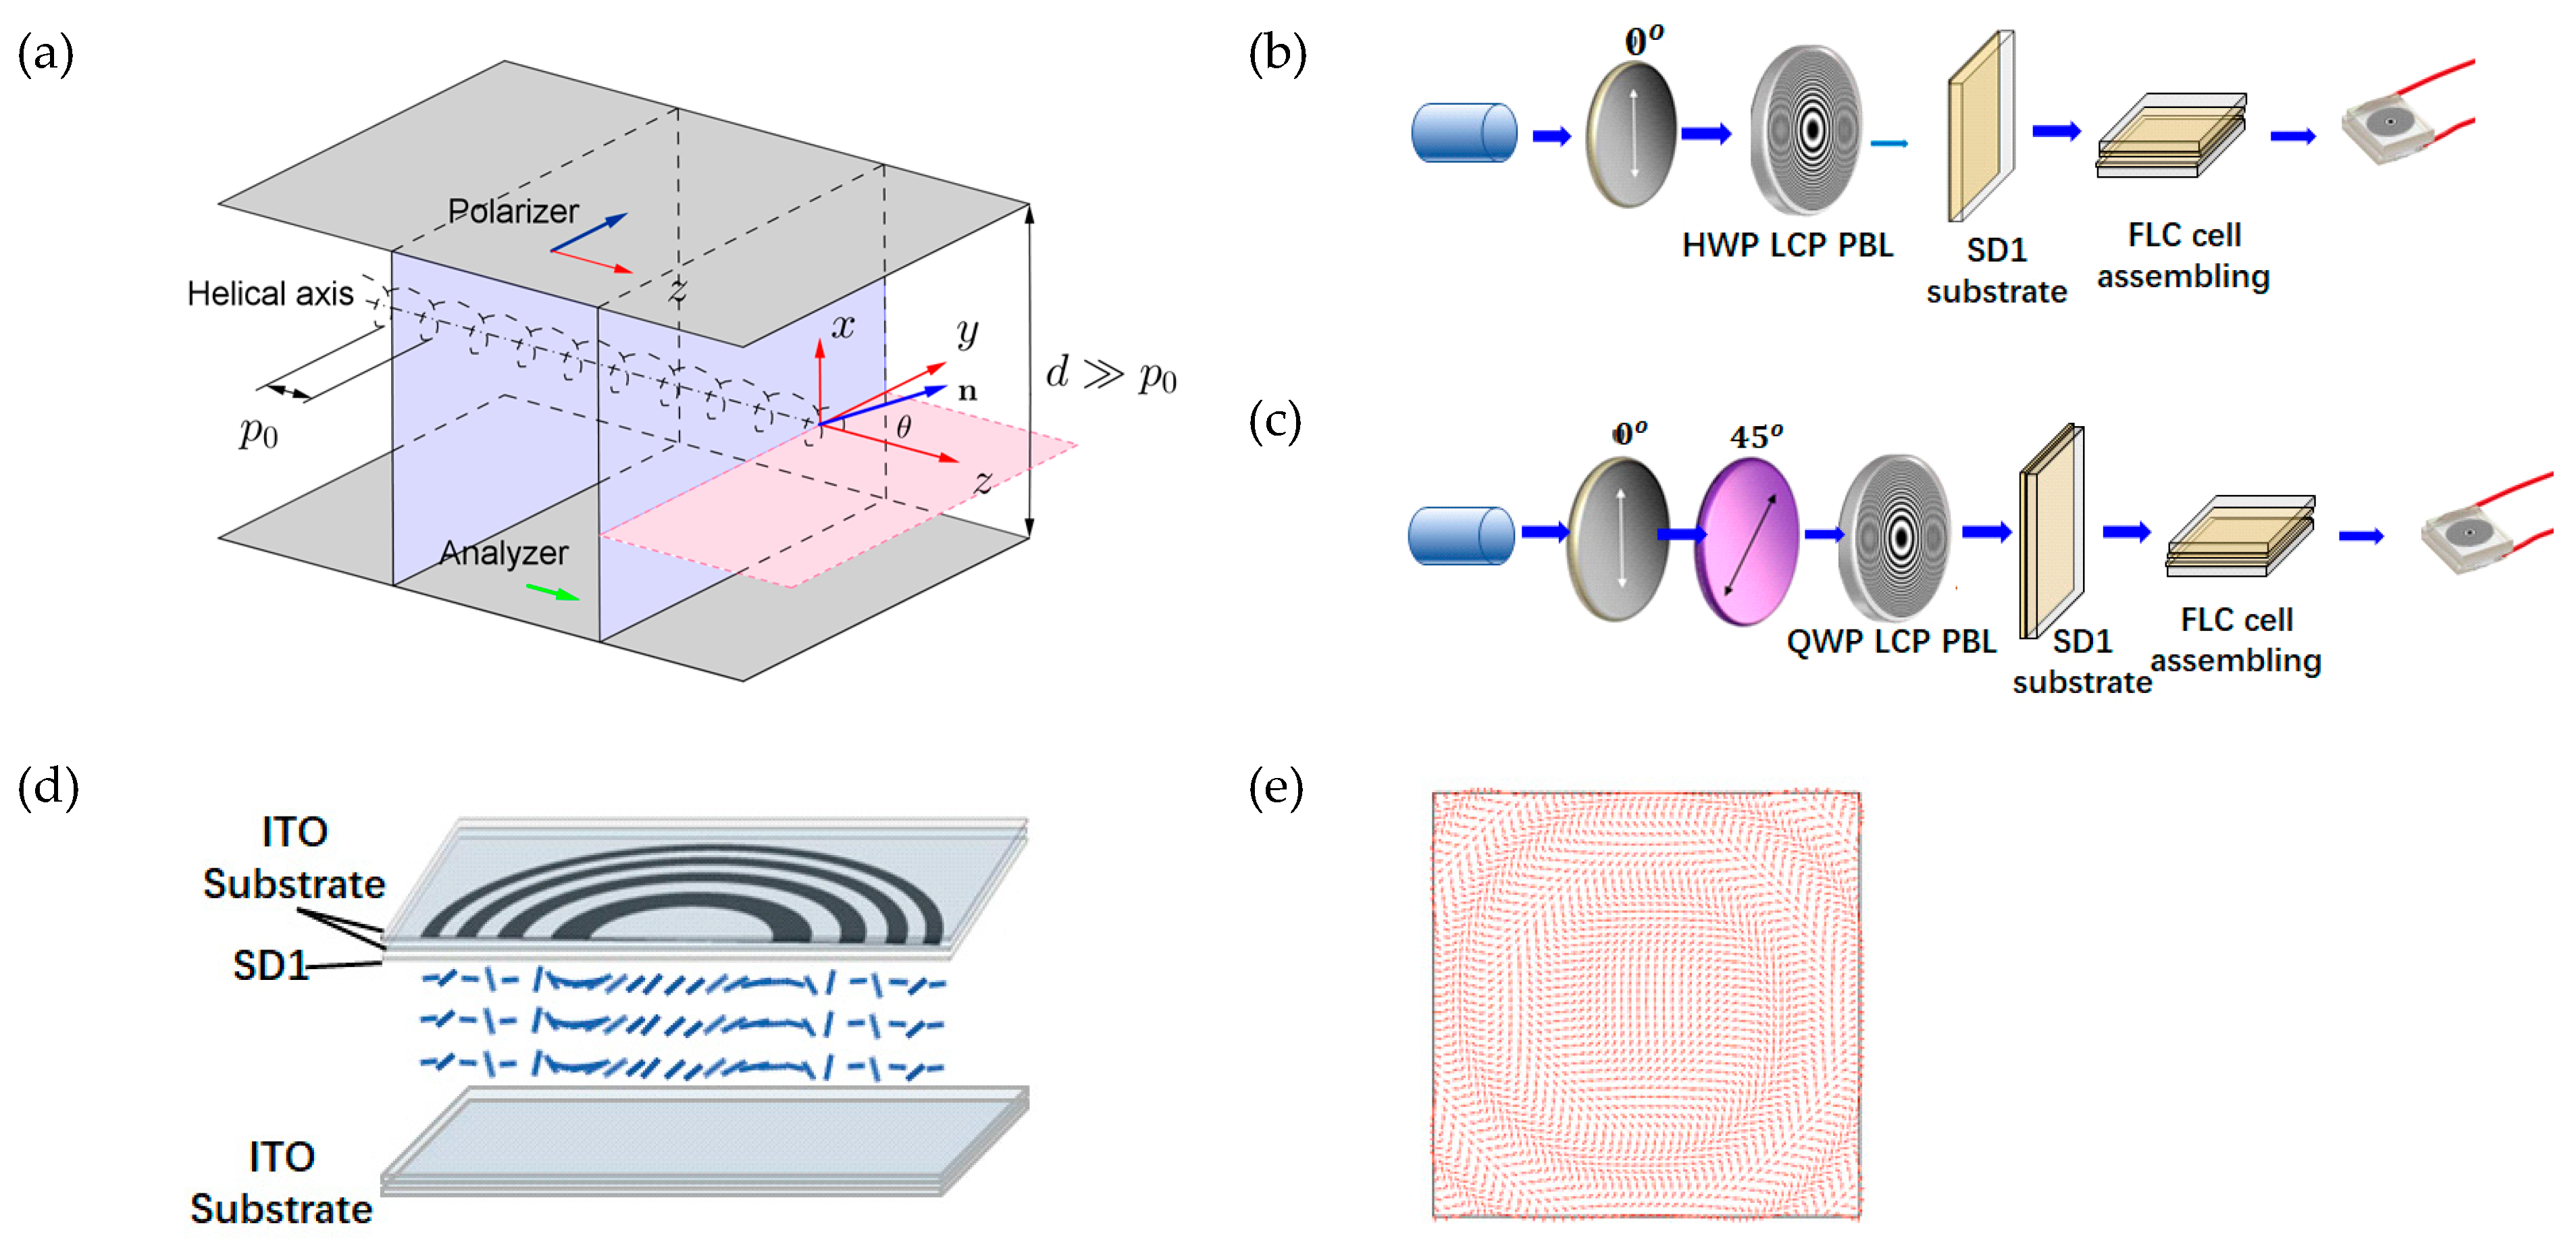
Surface-stabilized ferroelectric liquid crystals (SSFLC) and electrically suppressed helix ferroelectric liquid crystals (ESHFLC) can be used to realize switchable two-domain structures, e.g., gratings or Fresnel lens. However, the optical phase shift always exists when we deal with the PBL because the optical axis just sweeps in the plane of the cell substrates. In this section, we review the DHFLC mode for the PBL. A schematic representation of the DHFLC cell is shown in Figure 9a.
4.2.1. Lens Fabrication
To assemble the lens, a compound with high light transmission in the visible spectrum is essential. An example of such a material is FLC 587 (P. N. Lebedev Physical Institute of Russian Academy of Sciences) [25]. According to the issues outlined in Section 2.2, when boundary conditions are asymmetric, the competition between the aligning interactions existing between the cell surfaces and the FLC helix can be avoided. High anchoring energy and stability to mechanical damage of sulphonic azo dye (SD-1) enables the use of this polarization photosensitive alignment layer. While there are various techniques of azodye photo-alignment, photo-reorientation occurs when dye molecules orient themselves perpendicular to the incident light polarization plane.
Figure 9b,c shows a schematic representation of the experimental setup. A thin quarter-wave plate (QWP)/half-wave plate (HWP) LC polymer thin-film PBL was designed when the diffraction efficiency has the maximum value for the wavelength of 450 nm. This can be achieved when the quarter-wave or half-wave conditions are satisfied.
The setup in Figure 9b includes a linear polarizer, and a HWP followed by the LC polymer thin-film HWP PBL and ITO glass substrate, which is coated by azo dye SD-1 [26]. Here, the LC polymer HWP Pancharatnam–Berry phase optical element was used as a photo-patterned mask. The recorded pattern of alignment of the optical axis distribution in the PBL resembles an HWP with half of the spatial period in the single-step exposure. This issue provides an opportunity to increase the diffraction angle. The setup depicted in Figure 9c contains a linear polarizer. The optical axis of the QWP is oriented at 45° with respect to the transmission axis of the linear polarizer, which is followed by the LC polymer thin-film (QWP PBL) and ITO-coated glass substrate with SD-1. Having a 45° offset, the recorded alignment profile is the replica of the inhomogeneous QWP. Thus, we can “copy” the LC polymer thin-film PBL pattern using a QWP in a simple and time-efficient way. Then, the SD-1 substrate was exposed by the laser beam (0.3 W/cm2, λ = 450 nm) for 90 s to imprint the PBL pattern. After all manipulations, the cell can be assembled with a certain distance between the substrates. Recall that another ITO substrate remains untreated by the alignment layer. This distance must satisfy the half-wave condition for the FLC PBL to achieve the performance of a convex/concave lens. Due to the magnitude of the birefringence of FLC 587, the cell gap can be maintained at its first half-wave condition, i.e., 1.5 μm, and the subsequent half-wave condition ~5 μm. Figure 9e illustrates that optical axes of FLC molecules will have continuous orientation.
4.2.2. Focal Length
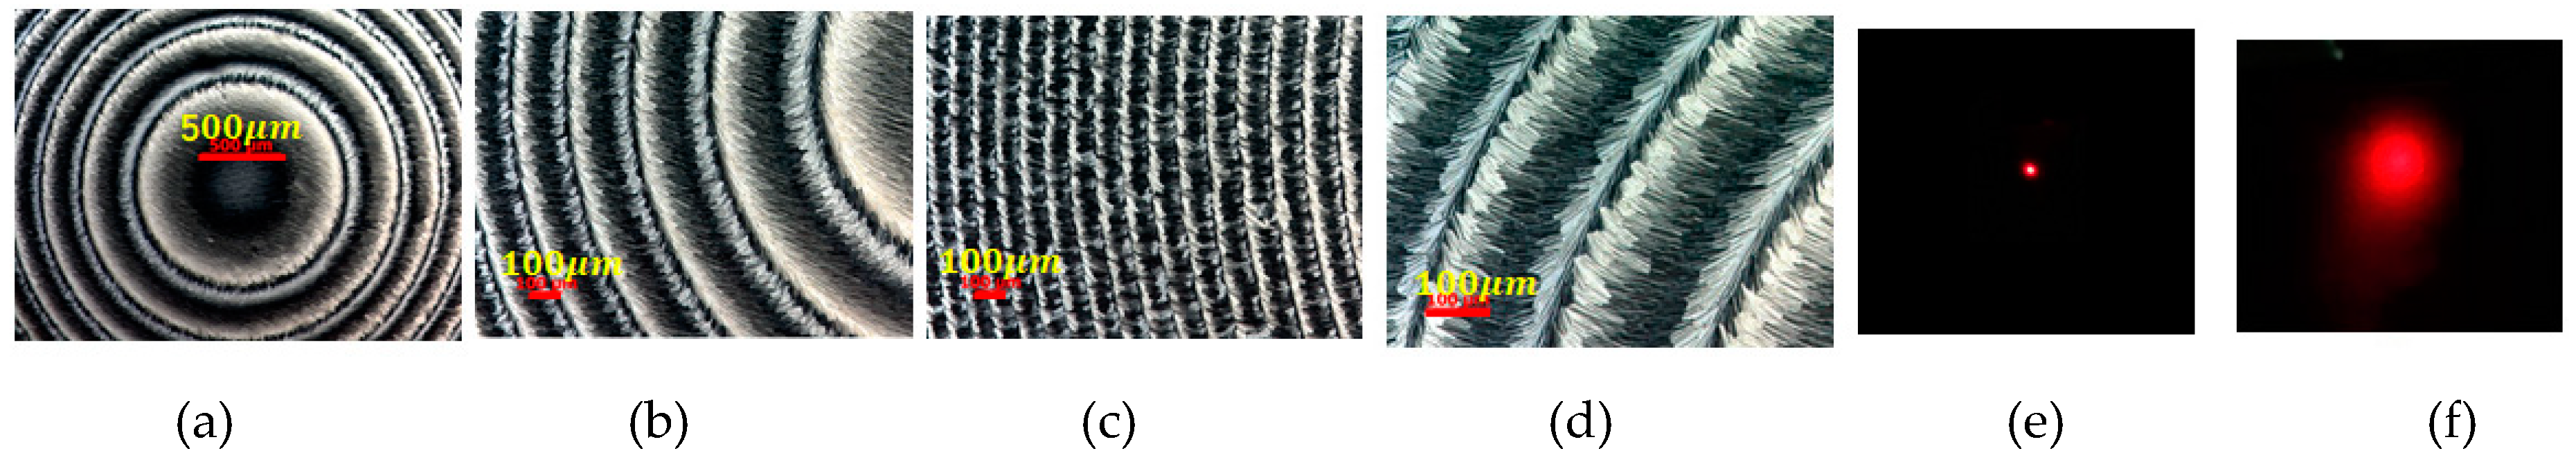
Polarized optical microscopy can be used to verify the alignment quality of the assembled PB lens, operating under the DHFLC mode (see Figure 10a–d). The images demonstrate high alignment quality and agreement with the theoretically obtained profile of the gradual decrease in grating pitch away from the center with smooth variations of the transmittance level and minimum of defects. The molecules continuously align in the ordered structure.
Optical phase profile of the lens can be obtained from the intensity profile T(r) = sin2 [2α(r)], where α(r) = kr2 = πr2/fλ and k = 12.34 × 10⁶ m−2. The theoretical value of the focal distance can be calculated from the phase profile α(r) for the wavelength 630 nm. The corresponding value is 40 cm. The polarization dependence of the PBL was examined by illuminating with a 633 nm laser beam on the circular polarizer. When the laser beam passes through the right-hand circular polarizer, the spot size from the laser beam is reduced as the result of the focusing effect from the lens. The experimental value of the focal distance can be measured by adjusting the spot size to the smallest diameter D. The measured focal length was 42 cm when D = 1.3 cm, which is in a good agreement with the theoretical value. Consequently, the F-number can be calculated as F = f/D, with a value of 30.1. The ability to reduce the F-number can be attractive for many imaging and display applications. The schematic representation for lowering the F-number is depicted in Figure 9b. When the decreased F-number is obtained, the fabricated sample can be used as the phase mask for further reduction of the focal length. The “copied” pattern quality and the diffraction efficiency can be dropped after several “copying” processes.
The performance of the PBL illuminated by the right-hand circularly polarized light is shown in Figure 10e. On the other side, when the right-hand circular polarizer is in front of the lens, the PBL behaves as a concave lens. Therefore, we observe a gradual decrease in the spot intensity between the center and the edges (Figure 10f). The spots in Figure 10e,f were observed when the voltage of 10 V was applied to the 1.5-μm-thick DHFLC cell.
4.2.3. Diffraction Efficiency
The diffraction efficiency is a measure of how much optical power is diffracted into a designated direction compared to the power incident onto the diffractive element. The diffraction efficiency can be measured by putting a photo-diode detector into the focal plane.
4.2.4. Prospective Research
In order to achieve a small focal distance of the lens, more research in the improvement of alignment quality needs to be conducted. The resolution depends on the compound SD-1 and the cell gap. Comparing these two constrained parameters, the resolution with SD-1 can achieve a sub-micron scale, while the resolution of a cell with a 1.5 μm gap will be ~1.5 μm. For the DHFLC mode, this cell gap determines the resolution that can possibly be realized because the helix pitch must be much smaller than the gap between the substrates. Thus, the finest focal distance will be determined by the thinnest size of the outside fringe of the PBL, which must be larger than the cell gap.
A fast response time (~300 μs under the voltage of 4 V/μm) of the discussed DHFLC PB lenses provides the opportunity to use such devices for applications in light beam manipulations, and imaging and display technologies.
4.2.5. 2D/3D Switchable Display
Most studies of three-dimensional (3D) displays have been primarily reported for stereoscopic and autostereoscopic techniques, as well as incorporating a set of discrete multiviews of 3D scenes [28,29]. Recently, stereoscopic displays based on shutter glasses, polarization rotation systems, etc. were commercialized [30]. However, such systems are bulky and limited to the individual audience. As the result, the demand for the development of autostereoscopic 3D displays has increased [31]. In this situation it is natural to develop a lens that can be quickly switched between 3D to 2D visualizations. Such a lens will provided the opportunity to display 2D and 3D contents simultaneously for the observer.
Two approaches have been previously proposed [32,33,34]. One is the parallax barrier, which is commercially available; however, it has disadvantages related to half-light transmittance and resolution loss. Another approach involves an array of LC microlenses, and demonstrates relatively high light transmittance. When the electric field is applied to the LC lens, the focusing effect can be observed. Otherwise, the array of LC microlenses behaves as an isotropic optical plate.
Submillisecond response times and low driving voltage distinguish FLCs as the potential candidate for imaging and photonic devices. However, FLCs are limited by intrinsic defects such as mechanical instability, chevrons, and, most importantly, intrinsic diffraction. It was previously found that the optical characteristics of FLCs can be improved if their elastic interactions are balanced by the anchoring interactions of the alignment layer [10]. The photo-alignment discussed in Section 2 offers precise control of the anchoring energy by controlling the irradiation energy doses. As a consequence, it provides a desirable balance between the competing anchoring and elastic interactions of the helical FLC. This balance occurs when d ≫ p0, and it offers high optical quality with a contrast ratio of ∼10k:1 between the crossed polarizers. This electro-optical mode is known as the ESHFLC. This mode was earlier studied for display applications, viz., field sequential color display, pico-projector microdisplays, 3D displays, etc. [11,35]. In addition, ESFLC mode does not result in any intrinsic diffraction effects. This fact can be used in the development of FLC gratings, shutters, Fresnel lenses, etc.
The proposed 2D/3D switchable lens device is based on the polarization-dependent passive polymeric lens array and switchable half-wave plate. The latter is based on the ESHFLC mode, which plays the role of the polarization selector unit, i.e., quickly switches the polarization state of the impinging light under the driving voltage ∼2 V. This enables us to claim that the proposed 2D/3D lens unit can be suitable for portable devices. A schematic illustration showing an FLC-based 2D/3D switchable lens is presented in Figure 12. The prototype consists of the LCD screen, ESHFLC polarization selector unit, and polarization-dependent gradient index (GRIN) lens array.
Each microlens, which is shown in Figure 12a, includes two sub-pixels for the left and right images. The outer polarizer axis is aligned parallel to the easy alignment axis of the lens array, whereas the ESHFLC polarization selector unit is placed at the angle θ (∼22.35°) (see Figure 12b). Thus, one polarity of the electric field E can orient FLC molecules parallel to the optical axis of the polarizer and does not affect the impinging light. As the result, the light travels through the lens array, and does not show either a focusing effect or a 2D effect (see Figure 12c). However, for the reverse polarity of the electric field, the FLC molecules switch to another allowed configuration around the cone, i.e., 2θ from the polarizer azimuth of the light from the LCD. In this case, the ESHFLC cell (Δnd = λ/2) rotates the polarization state of the impinging light by 90° and shows the focusing effect, i.e., 3D mode (see Figure 12d).
This suggests that the viewing mode of the lens can be switched by reversing the electric field direction. The performance of the lens for 2D/3D modes is shown in Figure 13.
The image with 2D and 3D data was recorded 25 cm away from the lens array. Figure 13a,b shows a two-dimensional image that was observed for two states of the ESHFLC cell. The area where the flower is depicted is covered by ESHFLC electrodes, while the area with the characters “SKL” is not covered by the ESHFLC electrodes. Identical 3D image for the two states is depicted in Figure 13c,d. In these images, the 3D image of the flower is given for the defocused and focused states, respectively. It is clear that both ESHFLC mode and the polarization-dependent GRIN lens have good performance.
The ESHFLC polarization rotation unit represents a half-wave plate for the green light (543 nm). Then, it is natural to expect crosstalk for red and blue colors. Recall that red and blue lights are elliptically polarized after the ESHFLC cell. This fact is the main reason for the crosstalk. Under the assumption that the lens system is perfect, our measurements show that the crosstalk is ∼5% (see Figure 13) for blue and red lights. This drawback can be resolved by adding two polarization selector units that are orthogonally aligned to each other.
In the proposed lens, the high extinction ratio of the ESHFLC with small response time and high optical quality requires a small driving voltage to switch between 2D/3D modes. The illustrated driving scheme provides a proper DC balance to FLC materials without compromising optical quality in the image mode. Thus, the proposed switchable lens unit with low power consumption, acceptable crosstalk, fast response time, and simple fabrication technique can be applied in portable devices.
4.3. High Resolution Displays
The electrically suppressed helix FLC mode for display applications can be achieved with two constraints. The first is that the pitch length must be several times smaller than the cell gap. The second constraint refers to the anchoring energy, which must play the dominant role, and will always affect the optical quality and electrical modulation. In order to control the anchoring energy, azo dye compound SD-1 was used in the experiment [36].
4.3.1. Electrically Suppressed Helix Ferroelectric Liquid Crystal Mode
Photo-alignment, depending on irradiation energy, offers good control of the anchoring energy and therefore provides a desirable balance between elastic interactions within the helix and the anchoring interactions [10]. This balance with the proper selection of FLC material parameters provides helix unwinding only in the presence of the electric field with a contrast ratio of 10,000:1 and higher. This electro-optical FLC mode was termed an electrically suppressed helix ferroelectric liquid crystal.
It was found that the ESHFLC mode has two domain structures with two optical axes, which are tilted by an angle 2θ (FLC cone angle) from each other in the absence of the electric field. The area taken by one domain will gradually increase until it dominates the whole panel when the electric field increases. When a small electric field (1.66 V/μm) is applied, the FLC helix stops the unwinding process, and all molecules will be reoriented to a position perpendicular to the electric field. Figure 14 shows that the molecules can switch between two states with either one or another polarity of the electric field. The inset in Figure 14a shows that a fast response time enables the transmittance of the ESHFLC mode to saturate due to the electric field of 3 kHz.
The operation mechanism results in a response time of the ESHFLC mode that is fast enough for the field sequential color techniques. Meanwhile, the response time of this mode is frequency dependent because the helix unwinds as in the DHFLC mode. After the helix unwinding process, the mode becomes an electrically suppressed helix frequency independent response time. The EHSFLC mode was achieved when the applied voltage was 3.33 V/μm and the response time was ~20 μs.
Color filter-free display techniques yield three improvements over the traditional color filter technology, in terms of resolution, light efficiency, and lower manufacturing cost for pattern color filters. In spite of the listed advantages, there is still a need for further improvement of the active matrix. One problem is that the binary switching mechanism (see Figure 15a) is not compatible with the current nematic LCD TFT array to generate gray levels. To propose the solution for the incompatibility problem, a pulse width modulation (PWM) method was developed. However, the mobility of CMOS is much higher than that of amorphous or poly silicon. Consequently, TFT on glass cannot give sufficient high frame rate. Direct pulse width modulation cannot be used with the ESHFLC mode. One possible solution for these problems would be a pixel circuit scheme with three TFTs and one capacitor (3T1C) (Figure 15a) for the ESHFLC mode.
The proposed 3T1C pixel circuit was used together with the ramp signal. After all pixels are updated with the data, the ramping signal is generated. In association with the pixel circuit, both work as pure voltage-to-pulse width modulation convectors. The pulse width modulation output is coupled with the electrode, hence, the grayscale is determined by the duration of the on–off state. Such a configuration of the driving scheme only scans the panel once, despite the repeated scanning in the bit-plane PWM method. This operation relaxes the speed requirement and makes it suitable for thin-film transistor technology in direct-view displays.
A feature of the circuit is that the capacitor C1 does not respond to the AC signal (i.e., the ramping voltage, VRAMP); the amount of charge that C1 holds during the frame is fixed and depends on Dm, which is initially fetched during pixel addressing. As the same time, CFLC is pre-charged to the initial voltage T3. Then, VRAMP increases, and the gate of T2 follows the change. For different pixels, the initial voltage at the gate of T shifts up or down depending on its pixel data. Thus, the gate of T2 is controlled by a data-dependent ramping signal.
Since the performance of ESHFLC mode is electric field polarity-dependent, we sacrifice the half duration of the frame time for DC compensation. Figure 15b shows the driving scheme for the field sequential color ESHFLC mode. The frame rate is fixed at 60 Hz, while the panel is addressed at 360 Hz for the field sequential and the DC compensation. During the compensation time, the LED backlight synchronously turns off to avoid disturbing the gray level. The panel one frame time (2.78 ms) is also divided into two parts, the data loading time and the display time.
4.3.2. Prototype
Field sequential color for ESHFLC mode has the advantages of low operation voltage, fast response time, high contrast ratio, and wide viewing angle. This mode can be applied in active matrix TFT array flat panel displays with high resolution, which can be portable. The latter characteristic can be used in a variety of applications, e.g., virtual reality. The proposed 3T1C pixel circuit enables the generation of 8-bit gray scale images on low temperature polysilicon TFT glass.
4.4. Low-Level Laser Therapy Devices
Photobiomodulation is also termed low-level laser therapy (LLLT) and its effectiveness has been demonstrated in the stimulation of hair growth in mice [38]. Clinical studies show that laser light (λ = 600 ÷ 1100 nm, 3–90 mW/cm2) or light-emitting diodes promote hair growth and assist in treatments for wound healing, pain reduction, tissue repair, anti-inflammatory therapy, traumatic brain injury, spinal cord injury, depression, Parkinson’s disease, and circadian rhythm sleep disorder (e.g., [39,40,41]). Other studies show that the use of blue and green lights can be applied in the investigation of stem cells in regenerative medicine [42,43]. In particular, the motility of spermatozoa can be facilitated by red light [44]. Stimulation by visible light, accomplished with virtual images, provides novel therapies in neuroscience [45]. However, photobiomodulation remains controversial due to insufficient understanding of the underlying biochemical mechanisms, as well as the tuning of appropriate parameters, such as wavelength, fluence (or energy density in units of joules/cm2), power density, and pulse duration for the applied light). For example, incorrect tuning of the energy density results in no observable effect or inhibition of cellular function. The irradiance threshold is also the basic factor for extensive applications in photobiomodulation. An optimal dose of light is essential to reduce negative therapeutic results. Identifying a mechanism to adjust the light beam parameters is a challenge for medical physics.
This motivates the development of electrically tunable light modulators for light sources, which can enable researchers and physicians to easily configure light parameters. Liquid crystals are capable of controlling all of the mentioned parameters and be used in attenuators, lenses, waveplates (wave retarders), gratings, polarization rotators, and color filters [46,47]. The FLC photonic devices discussed earlier have been demonstrated to be portable and can have a quick response time to any change of electric field.
A literature review shows that there are no studies supporting tunable optical systems or LC photonic devices for photobiomodulation. This section demonstrates the feasibility of fabrication of a tunable optical system for photobiomodulation to aid physicians in overcoming the constraints of light use due to the biphasic dose response [48]. The output light of the proposed optical system can be electrically adjusted for energy density, wavelength, and beam size.
4.4.1. Methodology
In order to control the fluence (in the unit of J/cm2) and select the wavelength of light, a tunable optical system for photobiomodulation should contain four elements: a light source, electrically tunable color filter, bandwidth suppressor, and electrically tunable lens, as shown in Figure 17.
The role of the electrically tunable color filter is to select the required wavelength for the LLLT applications. The bandwidth suppressor shrinks the bandwidth of light transmitted by the electrically tunable color filter. In addition to the wavelength control, the beam size must also be configured. The function of the electrically tunable lens is to adjust the beam size, which results in the adjustment of the light intensity (in units of W/cm2). By controlling the period of the switching time for the light source, the exposure time can be manipulated. Therefore, the fluence can also be adjusted. The block diagram of the tunable optical system is depicted in Figure 18.
As the white light source, an LED (TouchBright TB-X3-RCPI) was used. A pinhole and two lenses (L1 and L2) of 20 and 50 diopters (or m−1), respectively, were used to obtain collimated light. The electrically tunable color filter consists of two polarizers and two electrically tunable LC optical phase retarders (i.e., phase retarder 1 and phase retarder 2). The transmissive axes of the two polarizers are parallel to the y-direction, and the initial alignment of the two phase retarders is either 135° or 90° with respect to the x-axis.
The effective slow axis of the optical phase retarders can be switched along θ = 135° at +10 V or θ = 90° at −10 V (i.e., θ1 and θ2 in Figure 18 are 135° or 90° depending on the applied voltage) due to the bistability of FLC. The bandwidth suppressor consists of another LC phase retarder (phase retarder 3) and a polarizer. The electrically tunable lens is denoted by L3 with the lens power of 12 D.
4.4.2. Sample Preparation
A ferroelectric liquid crystal (Felix-017/000) with Δn = 0.17 was used as the functional material in phase retarders 1 and 2. The FLC material was placed between ITO-coated glass substrates, which were covered with thin polyimide layers (Mesostate LCD Industries, Taiwan) and mechanically rubbed in anti-parallel directions. The cell gaps for the two FLC cells were 2.8 μm (phase retarder 1) and 3.8 μm (phase retarder 2). Nematic LC (E7, Δn = 0.21, λ = 650 nm) was used in phase retarder 3, which was also sandwiched between two ITO glass substrates coated with the same polyimide layers and mechanically rubbed in anti-parallel directions. The cell gap was 25.6 μm. The geometry of phase retarders 1, 2, and 3 is shown in Figure 19a–c. The initial alignments of the FLC phase retarders (rubbing directions) were either 90° or 135° with respect to the x-axis. When −10 V was applied to the FLC phase retarder, the directors were switched to 90° with respect to the x-axis, as shown in Figure 19a. When +10 V was applied to the FLC phase retarder, the director field was switched to 135° with respect to the x-axis (Figure 19b). The dependence of the phase retardation versus the applied voltage for the nematic phase retarder is plotted in Figure 19d. To meet the desired optical path difference (~3.23 μm), the LC cell for the bandwidth suppressor was operated at the voltage of 1.75 Vrms (f = 1 kHz).
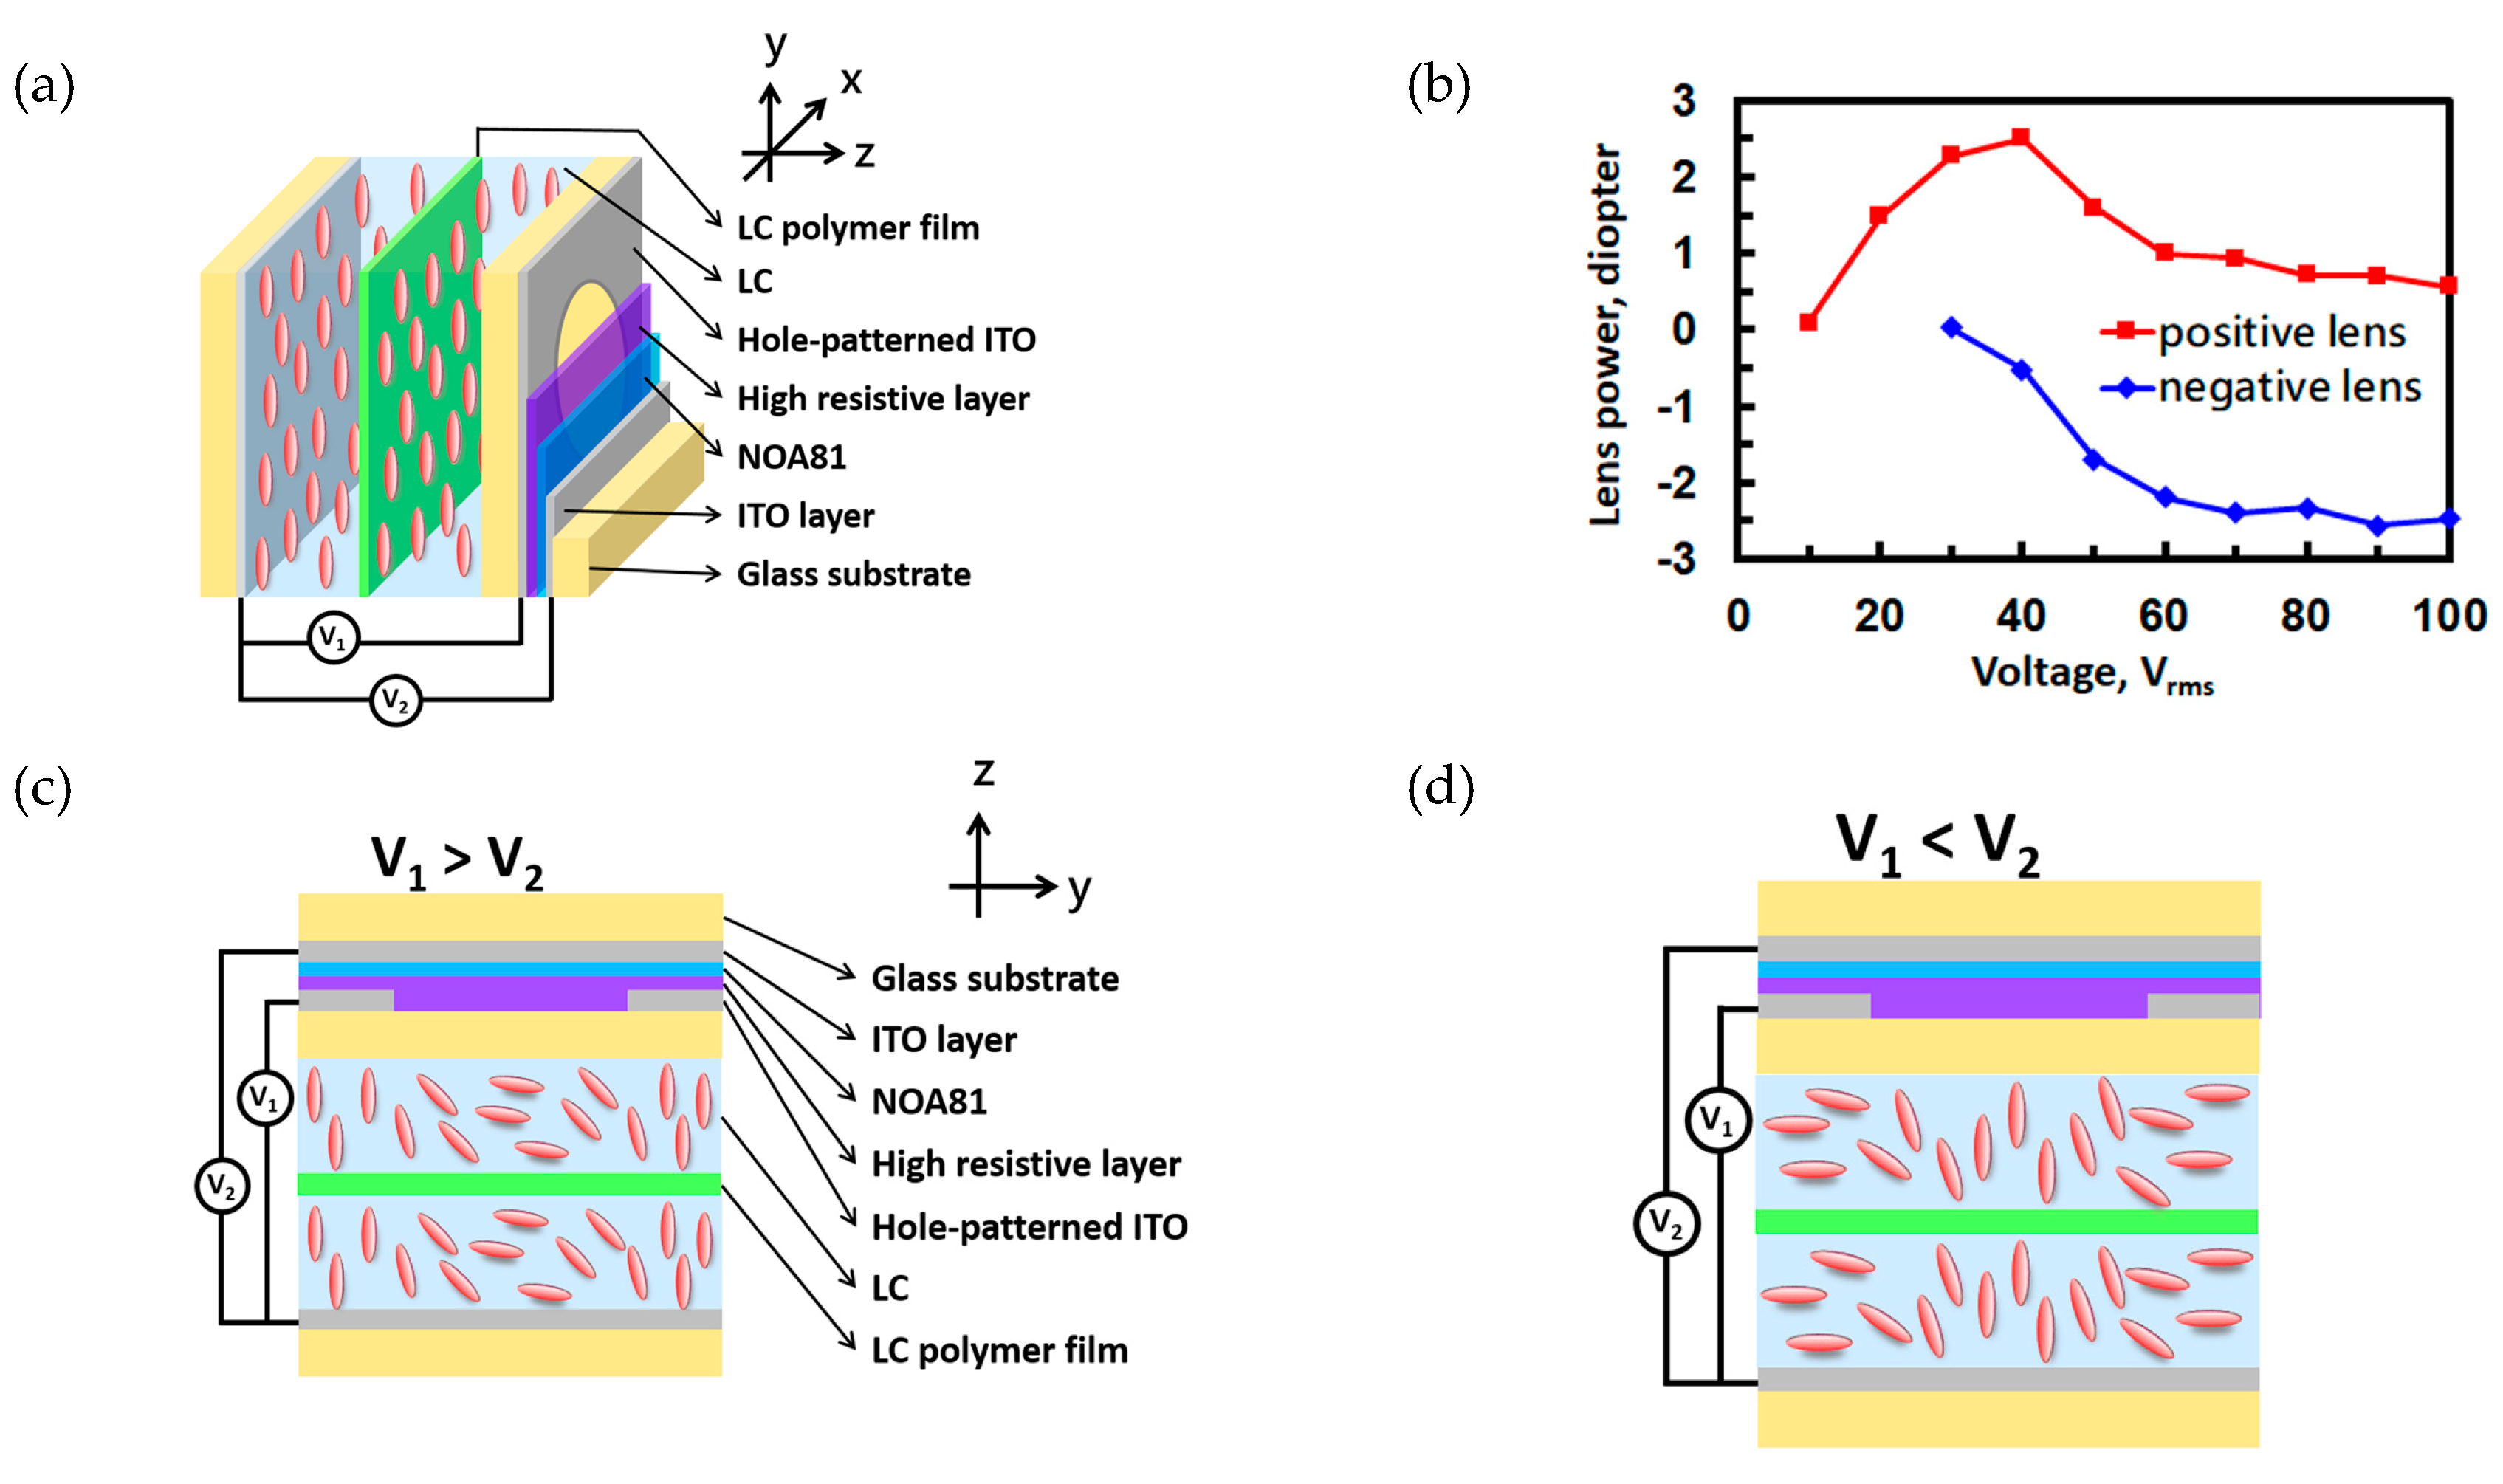
As the LC lens, we used a double-layered structure with a hole-patterned electrode and two flat electrodes [49]. The thickness of the glass substrates was maintained at 0.4 mm. A highly resistive layer was spin coated on the hole-patterned electrode. NOA81 was used as the insulating layer with 25 μm thickness. Rather than being aligned orthogonally, the two LC layers (nematic LC, LCMatter, LCM-1790) were parallel-aligned. Thus, a polarization-dependent optical phase was obtained. The detailed structure for the LC lens is shown in Figure 20a. The cross-sections of the LC lens at voltage-on are illustrated in Figure 20c, d. A hole-patterned electrode and two flat electrodes (gray-colored) control the inhomogeneous electric fields distributed across the LC layers. Lens powers are controlled by the two electric fields V1 and V2. At the applied voltages V1 > V2, LC molecules in the center of the LC lens are more parallel than the molecules near the edge of the aperture. As a result, light travels faster near the edge of the aperture than in the center. The incident plane wave is converted to the converged paraboloidal wave. The lens power of the LC lens is positive. In contrast, the LC lens is a negative lens for V2 > V1. The thickness of the two LC layers and the LC polymer film was 50 μm. The aperture size was 10 mm. The voltage-dependent lens power was measured based by the Shack–Hartmann wavefront sensor (Thorlab, WFS-150-7AR). Figure 20b shows the measured lens power as a function of V1 and V2. The measured lens power for the LC lens ranges from +2 diopters to −2.5 diopters (i.e., the focal length ranges from −40 cm to +50 cm).
4.4.3. Tunable Irradiance
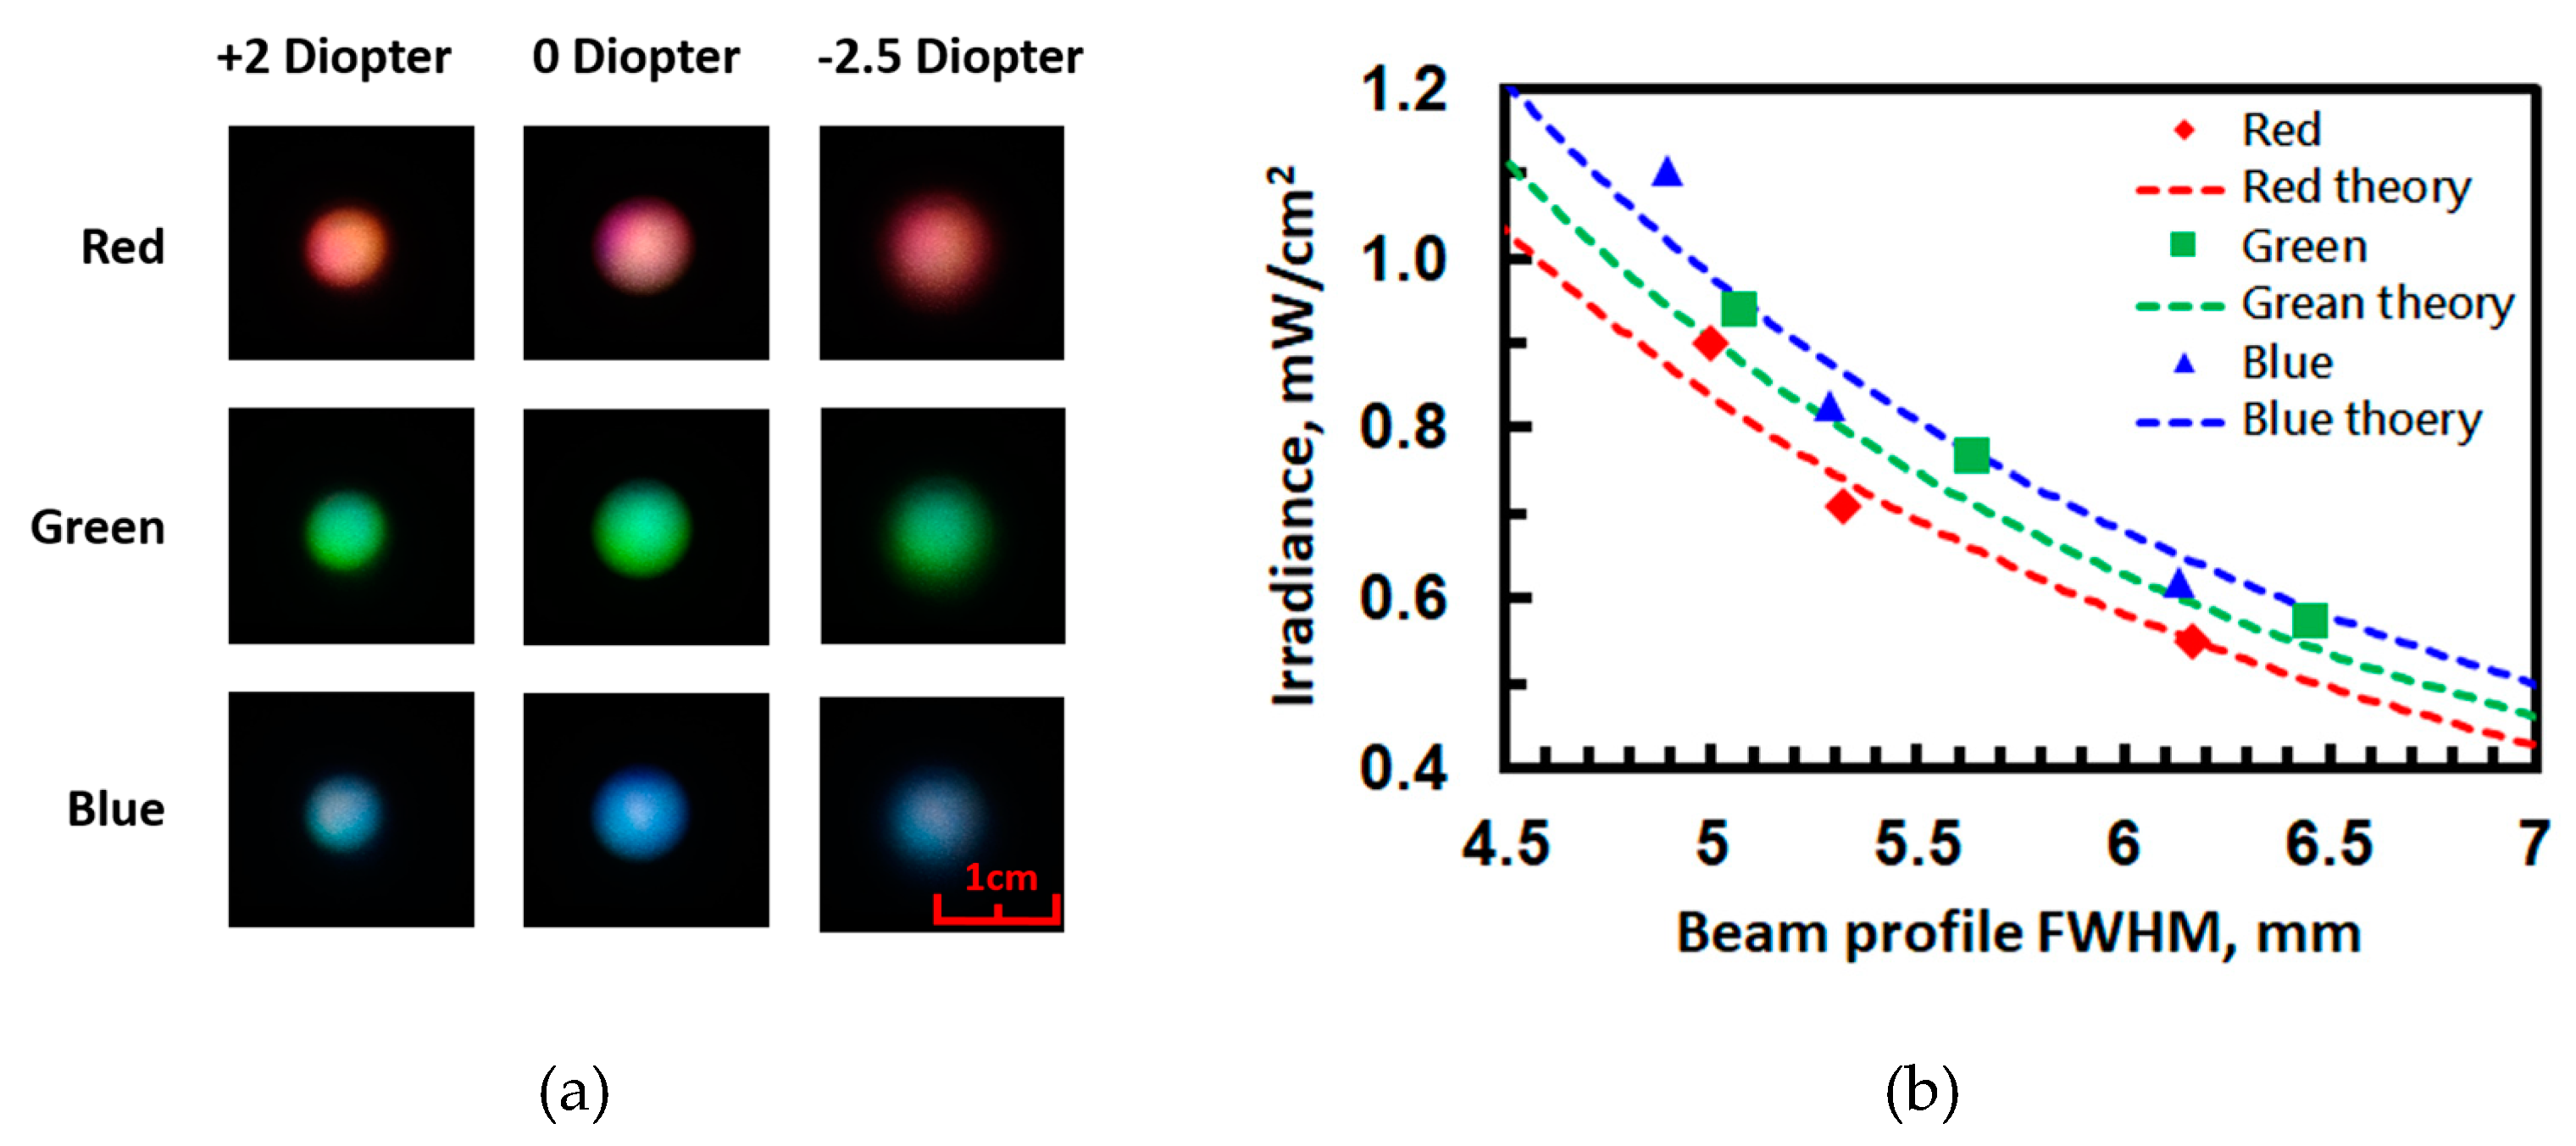
In addition to the tunable color filter (Figure 18a) and the bandwidth compressor, the LC lens provides tunable irradiance. By changing the beam size on the exposure area with the tunable lens power, the irradiance (watts/m2) can be adjusted. To measure this change, a diffusor was placed 7 cm from the LC lens. The images were recorded by a camera (Sony RX100M3) when the LC lens had three different lens powers. The recorded images are depicted in Figure 21a. Here, the images of the first row show the difference in beam size for different lens powers when the color filter transmits red light. Rows 2 and 3 show the images for green and blue lights. Further analysis of the spot profiles was carried out using an image processing program (ImageJ). Before fitting the brightness distribution along the x-cross-section of each spot by Gaussian function, the full width at half maximum was calculated. The full width at half maximum of each spot is slightly enlarged in diameter from 5 to 6.5 mm when the lens power changes from +2 diopters to −2.5 diopters.
Then, we studied the irradiance versus the beam size (Figure 21b). The approximate tunable range of the irradiance for all three wavelengths is from 0.6 to 1 mW/cm2. The irradiance decreases when the beam size increases.
The proposed optical system (Figure 18a) performs wavelength selection and provides the ability to adjust the irradiance. By multiplying the irradiance by time, one can tune the energy density (or fluence). For practical applications, the energy density can reach 2.16–3.60 J/cm2 for the treatment time of 60 min. The achieved treatment time is too long for portable light therapy devices. This problem can be solved by decreasing the power loss of the optical system in terms of removal of multiple reflections. If the irradiance of the output light can reach a range of 2.4–4 mW/cm2, the treatment time can be reduced to approximately 15 min.
In summary, the designed optical system transmits an electrically tunable wavelength and controls energy density from the white light source (LED). Two FLC optical phase retarders were used as tunable color filters for three wavelengths (red, blue, and green). The role of the bandwidth suppressor is played by nematic LC optical phase retarder. The beam size can be adjusted by a liquid crystal lens. The bandwidth of the peak wavelength is suppressed to less than 0.1 μm. The energy density can be adjusted in the range from 0.6 to 1 mW/cm2 by tuning the exposure area using an LC lens.
5. Conclusions
Having thus considered several aspects of photo-alignment, the prototypes’ characteristics look highly promising for different FLC electro-optic modes. Photo-alignment of FLCs is attractive because it is a non-contact technology for perspective materials. In addition, it provides the ability to pattern multi-domain surfaces. All of the considered devices are intended to be direct applications of photo-alignment.
Recent comprehensive studies demonstrate that photo-alignment is a potential method for many photonic applications. It can be successfully applied in the production of anisotropic optical FLC films and various photonic devices.
Author Contributions
Writing—review and editing, V.C., Q.G., and A.K. All authors have read and agreed to the published version of the manuscript.
Funding
This research was funded by the Russian Science Foundation, grant number 20-19-00201 and the APC was funded by 20-19-00201.
Conflicts of Interest
The authors declare no conflict of interest.
References
- Tan, G.; Lee, Y.-H.; Zhan, T.; Yang, J.; Liu, S.; Zhao, D.; Wu, S.-T. Foveated imaging for near-eye displays. Opt. Express 2018, 26, 25076–25085. [Google Scholar] [CrossRef] [PubMed]
- Song, D.H.; Kim, J.-W.; Kim, K.-H.; Rho, S.J.; Lee, H.; Kim, H.; Yoon, T.-H. Ultrafast switching of randomly-aligned nematic liquid crystals. Opt. Express 2012, 20, 11659–11664. [Google Scholar] [CrossRef] [PubMed]
- Takahashi, T.; Furue, H.; Shikada, M.; Matsuda, N.; Miyama, T.; Kobayashi, S. Preliminary study of field sequential fullcolor liquid crystal display using polymer stabilized ferroelectric liquid crystal display. Jpn. J. Appl. Phys. 1999, 38, L534–L536. [Google Scholar] [CrossRef]
- Chigrinov, V.G. Liquid Crystal Photonics; Nova Publishers: New York, NY, USA, 2014. [Google Scholar]
- Meyer, R.B. Ferroelectric liquid crystals; a review. Mol. Cryst. Liq. Cryst. 1977, 40, 33–48. [Google Scholar] [CrossRef]
- Schadt, M.; Schmitt, K.; Kozinkov, V.; Chigrinov, V. Surface-Induced parallel alignment of liquid-crystals by linearly polymerized photopolymers. Jpn. J. Appl. Phys. 1 1992, 31, 2155–2164. [Google Scholar] [CrossRef]
- Inaba, Y.; Katagiri, K.; Inoue, H.; Kanbe, J.; Yoshihara, S.; Iijima, S. Essential factors in high-duty FLC Matrix display. Ferroelectrics 1988, 85, 255–264. [Google Scholar] [CrossRef]
- Vorflusev, V.; Kozenkov, V.; Chigrinov, V. Bistable switching in FLC cells aligned by photoanisotropic films. Mol. Cryst. Liq. Crys. A 1995, 263, 577–583. [Google Scholar] [CrossRef]
- Murakami, Y.; Xu, J.; Kobayashi, S.; Endo, H.; Fukuro, H. P-76: Photoalignment of polymer-stabilized V-FLCD and intrinsic HV-FLCD and the effect on their EO characteristics. In SID Symposium Digest of Technical Papers; Blackwell Publishing Ltd.: Oxford, UK, 2002; Volume 33, pp. 496–497. [Google Scholar]
- Pozhidaev, E.; Chigrinov, V.; Huang, D.; Zhukov, A.; Ho, J.; Kwok, H.S. Photoalignment of ferroelectric liquid crystals by azodye layers. Jpn. J. Appl. Phys. 2004, 43, 5440–5446. [Google Scholar] [CrossRef] [Green Version]
- Srivastava, A.K.; Chigrinov, V.G.; Kwok, H.S. Electrically suppressed helix ferroelectric liquid crystals for modern displays. J. Soc. Inf. Disp. 2015, 23, 176–181. [Google Scholar] [CrossRef]
- Pozhidaev, E.; Minchenko, M.; Molkin, V.; Torgova, S.; Srivastava, A.; Chigrinov, V.; Kwok, H.; Vashenko, V.; Krivoshey, A. High frequency low voltage shock-free ferroelectric liquid crystal: A new electro-optical mode with electrically suppressed helix. In Proceedings of the 31-th International Display Research Conference EuroDisplay, Bordeaux, France, 19–22 September 2011; pp. 19–22. [Google Scholar]
- Manohar, R.; Misra, A.K.; Srivastava, A.K. Polymer-Induced improvements in ferroelectric liquid crystal. Polym. Compos. 2010, 31, 1776–1781. [Google Scholar] [CrossRef]
- Ma, Y.; Shi, L.Y.; Srivastava, A.K.; Chigrinov, V.G.; Kwok, H.S. Restricted polymer-stabilised electrically suppressed helix ferroelectric liquid crystals. Liq. Cryst. 2016, 43, 1092–1099. [Google Scholar] [CrossRef]
- Song, W.; Kudreyko, A.A.; Migranov, N.G. Surface effects in the model of polymer-stabilized ferroelectric liquid crystal cells. Indian J. Phys. 2019, 1–7, in press. [Google Scholar] [CrossRef]
- Doane, J.W.; Vaz, N.A.; Wu, B.G.; Zumer, S. Field controlled light-scattering from nematic microdroplets. Appl. Phys. Lett. 1986, 48, 269–271. [Google Scholar] [CrossRef]
- Murray, J.; Ma, D.; Munday, J.N. Electrically controllable light trapping for self-powered switchable solar windows. ACS Photonics 2017, 4, 1–7. [Google Scholar] [CrossRef]
- Wang, X.Q.; Tam, A.M.W.; Jia, S.Z.; Zhang, Q.; Chen, X.Y.; Xiong, Y.F.; Zhang, Q.; Liu, Z.; Chigrinov, V.G.; Kwok, H.S.; et al. Low-voltage-driven smart glass based on micro-patterned liquid crystal Fresnel lenses. Appl. Opt. 2019, 58, 1146–1151. [Google Scholar] [CrossRef]
- Cheng, H.H.; Bhowmik, A.; Bos, P.J. 51.2: Large Angle Image Steering Using a Liquid Crystal Device. In SID Symposium Digest of Technical Papers; Wiley Online Library: San Diego, CA, USA, 2014; pp. 739–742. [Google Scholar]
- Escuti, M.J.; Oh, C.; Sánchez, C.; Bastiaansen, C.; Broer, D.J. Simplified spectropolarimetry using reactive mesogen polarization gratings. In Imaging Spectrometry XI; International Society for Optics and Photonics: San Diego, CA, USA, 2006; p. 630207. [Google Scholar]
- Yan, J.; Li, Y.; Wu, S.-T. High-efficiency and fast-response tunable phase grating using a blue phase liquid crystal. Opt. Lett. 2011, 36, 1404–1406. [Google Scholar] [CrossRef]
- Ge, S.-J.; Chen, P.; Ma, L.-L.; Liu, Z.; Zheng, Z.-G.; Shen, D.; Hu, W.; Lu, Y.-Q. Optical array generator based on blue phase liquid crystal Dammann grating. Opt. Mater. Express 2016, 6, 1087–1092. [Google Scholar] [CrossRef]
- Srivastava, A.K.; Hu, W.; Chigrinov, V.G.; Kiselev, A.D.; Lu, Y.Q. Fast switchable grating based on orthogonal photo alignments of ferroelectric liquid crystals. Appl. Phys. Lett. 2012, 101, 031112. [Google Scholar] [CrossRef]
- Srivastava, A.K.; Wang, X.; Gong, S.; Shen, D.; Lu, Y.Q.; Chigrinov, V.G.; Kwok, H.S. Micro-patterned photo-aligned ferroelectric liquid crystal Fresnel zone lens. Opt. Lett. 2015, 40, 1643–1646. [Google Scholar] [CrossRef] [Green Version]
- Pozhidaev, E.; Chigrinov, V.; Murauski, A.; Molkin, V.; Tao, D.; Kwok, H.S. V-shaped electro-optical mode based on deformed-helix ferroelectric liquid crystal with subwavelength pitch. J. Soc. Inf. Disp. 2012, 20, 273–278. [Google Scholar] [CrossRef] [Green Version]
- Fan, F.; Du, T.; Srivastava, A.K.; Lu, W.; Chigrinov, V.; Kwok, H.S. Axially symmetric polarization converter made of patterned liquid crystal quarter wave plate. Opt. Express 2012, 20, 23036–23043. [Google Scholar] [CrossRef] [PubMed]
- Kudreyko, A.A.; Migranov, N.G.; Bachurina, O.V.; Song, W. Frequency voltage controlled light transmittance in ferroelectric liquid crystal cells. Eur. Phys. J. E 2017, 40, 58. [Google Scholar] [CrossRef]
- Son, J.-Y.; Javidi, B. Three-dimensional imaging methods based on multiview images. J. Disp. Technol. 2005, 1, 125. [Google Scholar] [CrossRef]
- Sun, M.-J.; Edgar, M.P.; Gibson, G.M.; Sun, B.; Radwell, N.; Lamb, R.; Padgett, M.J. Single-pixel three-dimensional imaging with time-based depth resolution. Nat. Commun. 2016, 7, 1–6. [Google Scholar] [CrossRef]
- Sun, J.; Srivastava, A.K.; Zhang, W.; Wang, L.; Chigrinov, V.G.; Kwok, H.S. Optically rewritable 3D liquid crystal displays. Opt. Lett. 2014, 39, 6209–6212. [Google Scholar] [CrossRef] [PubMed]
- Wang, X.Q.; Wang, L.; Sun, J.T.; Srivastava, A.K.; Chigrinov, V.G.; Kwok, H.S. Autostereoscopic 3D pictures on optically rewritable electronic paper. J. Soc. Inf. Disp. 2013, 21, 103–107. [Google Scholar] [CrossRef]
- Choi, H.; Park, J.-H.; Kim, J.; Cho, S.-W.; Lee, B. Wide-viewing-angle 3D/2D convertible display system using two display devices and a lens array. Opt. Express 2005, 13, 8424–8432. [Google Scholar] [CrossRef] [PubMed]
- Xu, M.; Ren, H.; Nah, C.; Hee Lee, S.; Liu, Y. Liquid crystal micro-lenticular array assembled by a fringing field. J. Appl. Phys. 2012, 111, 063104. [Google Scholar] [CrossRef] [Green Version]
- Krijn, M.P.; de Zwart, S.T.; de Boer, D.K.; Willemsen, O.H.; Sluijter, M. 2-D/3-D displays based on switchable lenticulars. J. Soc. Inf. Disp. 2008, 16, 847–855. [Google Scholar] [CrossRef]
- Srivastava, A.K.; de la Tocnaye, J.D.B.; Dupont, L. Liquid crystal active glasses for 3D cinema. J. Disp. Technol. 2010, 6, 522–530. [Google Scholar] [CrossRef]
- Guo, Q.; Srivastava, A.K.; Pozhidaev, E.P.; Chigrinov, V.G.; Kwok, H.-S. Optimization of alignment quality of ferroelectric liquid crystals by controlling anchoring energy. Appl. Phys. Express 2014, 7, 021701. [Google Scholar] [CrossRef]
- Shi, L.; Srivastava, A.K.; Cheung, A.; Hsieh, C.T.; Hung, C.L.; Lin, C.H.; Lin, C.H.; Sugiura, N.; Kuo, C.W.; Chigrinov, V.G. Active matrix field sequential color electrically suppressed helix ferroelectric liquid crystal for high resolution displays. J. Soc. Inf. Display. 2018, 26, 325–332. [Google Scholar] [CrossRef]
- Mester, E.; Ludany, G.; Sellyei, M.; Szende, B.; Gyenes, G.; Tota, G. Studies on the inhibiting and activating effects of laser beams. Langenbecks Arch. Fur Chir. 1968, 322, 1022. [Google Scholar] [CrossRef] [PubMed]
- Posten, W.; Wrone, D.A.; Dover, J.S.; Arndt, K.A.; Silapunt, S.; Alam, M. Low-level laser therapy for wound healing: Mechanism and efficacy. Dermatol. Surg. 2005, 31, 334–340. [Google Scholar] [CrossRef] [PubMed]
- Mao, Z.; Wu, J.H.; Dong, T.; Wu, M.X. Additive enhancement of wound healing in diabetic mice by low level light and topical CoQ10. Sci. Rep. 2016, 6, 1–8. [Google Scholar] [CrossRef] [Green Version]
- Willis, G.L.; Moore, C.; Armstrong, S.M. Parkinson’s disease, lights and melanocytes: Looking beyond the retina. Sci. Rep. 2014, 4, 3921. [Google Scholar] [CrossRef] [Green Version]
- Yang, D.; Yi, W.; Wang, E.; Wang, M. Effects of light-emitting diode irradiation on the osteogenesis of human umbilical cord mesenchymal stem cells in vitro. Sci. Rep. 2016, 6, 1–7. [Google Scholar] [CrossRef] [Green Version]
- Wang, Y.; Huang, Y.-Y.; Wang, Y.; Lyu, P.; Hamblin, M.R. Photobiomodulation (blue and green light) encourages osteoblastic-differentiation of human adipose-derived stem cells: Role of intracellular calcium and light-gated ion channels. Sci. Rep. 2016, 6, 33719. [Google Scholar] [CrossRef] [Green Version]
- Preece, D.; Chow, K.W.; Gomez-Godinez, V.; Gustafson, K.; Esener, S.; Ravida, N.; Durrant, B.; Berns, M.W. Red light improves spermatozoa motility and does not induce oxidative DNA damage. Sci. Rep. 2017, 7, 46480. [Google Scholar] [CrossRef]
- Deisseroth, K. Controlling the brain with light. Sci. Am. 2010, 303, 48–55. [Google Scholar] [CrossRef]
- Masterson, H.J.; Sharp, G.; Johnson, K.M. Ferroelectric liquid-crystal tunable filter. Opt. Lett. 1989, 14, 1249–1251. [Google Scholar] [CrossRef] [PubMed]
- Zheng, Z.G.; Yuan, C.L.; Hu, W.; Bisoyi, H.K.; Tang, M.J.; Liu, Z.; Sun, P.Z.; Yang, W.Q.; Wang, X.Q.; Shen, D. Light-patterned crystallographic direction of a self-organized 3d soft photonic crystal. Adv. Mater. 2017, 29, 1703165. [Google Scholar] [CrossRef] [PubMed]
- Chang, C.-M.; Lin, Y.-H.; Srivastava, A.K.; Chigrinov, V.G. An optical system via liquid crystal photonic devices for photobiomodulation. Sci. Rep. 2018, 8, 1–10. [Google Scholar] [CrossRef] [Green Version]
- Lin, Y.-H.; Chen, H.-S. Electrically tunable-focusing and polarizer-free liquid crystal lenses for ophthalmic applications. Opt. Express 2013, 21, 9428–9436. [Google Scholar] [CrossRef] [PubMed]
Figure 1.
(a) Dependence of SD-1 layer thickness versus the SD-1 solution concentration in N,N-dimethylformamide (DMF) spin-coated on the ITO surface at 3500 rpm; (b) schematic representation of the ferroelectric liquid crystal (FLC) cell with asymmetric boundaries.
Figure 1.
(a) Dependence of SD-1 layer thickness versus the SD-1 solution concentration in N,N-dimethylformamide (DMF) spin-coated on the ITO surface at 3500 rpm; (b) schematic representation of the ferroelectric liquid crystal (FLC) cell with asymmetric boundaries.

Figure 2.
(a) Contrast ratio dependence on the exposure time for FLC cells, which were filled with the compound FLC-451A. The SD-1 layer was illuminated by linearly polarized UV light (λ = 365 nm) at the normal incidence with the power density of 6 mW/cm2. The FLC layer thickness is 4.85 μm. Polarized optical microscopy images: dark state of two photo-aligned cells filled with the FLC-451A, the cell gap is 1.5 μm; the irradiation time of the SD-1 surface is (b) 10 min and (c) 60 min. Here, the SD-1 layer thickness is 13 nm. (d) Polarized optical microscopy images of the dark state of two cells filled with the FLC-445 with different boundary conditions: symmetric (both ITO layers are covered with 20 nm rubbed PMDA-ODA layers) and (e) asymmetric, i.e., one ITO layer is covered with the 20 nm rubbed PMDA-ODA layer. The FLC layer thickness is 1.5 μm for both cells (d,e). (f) Polarized optical microscopy images of the dark state of two photo-aligned cells, which were filled with the helix-free FLC-445: the irradiation time of the SD-1 surface is 10 min; (g) the irradiation time of the SD-1 surface is 60 min. The SD-1 layer thickness is 13 nm, and the FLC layer thickness is 1.5 μm. The insets in (e–g) show the scale of images. The striped structure of the insets has 8 μm periodicity.

Figure 3.
(a) FLC-408A-based 1.5 μm cell between two crossed polarizers, shown by arrows. The light aperture of the cell is 33 × 33 μm. The dark and bright states are memorized after the driving voltage is switched off. (b) The generated image by passively addressed photo-aligned 64 × 64 display, which was memorized after the driving voltage was turned off. The FLC-408A layer thickness is 5 μm.

Figure 4.
(a) Schematic representation of the ESHFLC cell, where p is the helix pitch of the FLC and d is the cell gap. (b) Temperature dependence of the tilt angle θ for pure FLC and polymer-stabilized FLC mixtures. The inset shows the plot of the transmittance in the bright and dark states versus the driving voltage for FLC polymer mixture of the 3.5% wt/wt monomer.

Figure 5.
Prototypes of the field sequential color display (12 × 12 pixels), based on the RSPESHFLCs.
Figure 5.
Prototypes of the field sequential color display (12 × 12 pixels), based on the RSPESHFLCs.

Figure 6.
The operating principle of smart glass. (a) Smart glass configuration with the LC Fresnel lenses with different focal lengths. (b) Schematic representation of LC smart glass operating principle with several LC Fresnel lenses in ON- and OFF-states. (c) Paper printed school logo image. Blurry region corresponds to the ON-state of the smart glass; when the lenses are in the OFF-state, a clear image is observed.

Figure 7.
Photograph, micrograph, and characterization of the focal distances of the proposed LC smart glass prototype based on LC Fresnel lenses with randomly assigned focal lengths (f = 2, 5, 10, 15, 20, 25, and 30 cm). (a) Photograph of the prototype captured under the crossed polarizer (P) and analyzer (A). The red scale bar corresponds to 1 cm. (b) Area of the smart glass, captured by the polarizing optical microscope (POM). Red arrows indicate that the orientations of LCs in odd and even zones are orthogonal to each other. Yellow scale bar corresponds to 100 μm. (c) Schematic of the experimental setup for characterizing the focal distances of the prototype, and L is the distance between the screen and the LC cell. (d) Selected diffraction patterns of the proposed LC smart glass prototype captured at L = 5, 10, 20, and 25 cm. The white arrows point to the corresponding focal points.

Figure 8.
Characterization of the image distortion of the LC smart glass prototype. (a) Schematic representation of the experimental setup. The captured images for (b) clear (voltage ON) and (c) blurry (voltage OFF) states under normal observation. (d) Schematic top view of horizontally rotating the LC smart glass for oblique observation. The captured images for incidence angles of (e) 30°, (f) 45°, and (g) 70°.

Figure 9.
(a) Geometry of the DHFLC cell [27]. Experimental setups for obtaining (b) small F-number switchable FLC PBL cells, (c) the same F-number switchable FLC PBL cells. (d) Configuration of the FLC PBL in the absence of the electric field. (e) Illustration of the optical axis distribution.
Figure 9.
(a) Geometry of the DHFLC cell [27]. Experimental setups for obtaining (b) small F-number switchable FLC PBL cells, (c) the same F-number switchable FLC PBL cells. (d) Configuration of the FLC PBL in the absence of the electric field. (e) Illustration of the optical axis distribution.

Figure 10.
Microphotographs of the PBL structure (a–d) and switchable DHFLC-PBL, which behaves as (e) the convex lens and (f) the concave lens when the beam light travels through the left (right) hand circular LHC (RHC) polarizer, respectively. The applied voltage is 10 V.
Figure 10.
Microphotographs of the PBL structure (a–d) and switchable DHFLC-PBL, which behaves as (e) the convex lens and (f) the concave lens when the beam light travels through the left (right) hand circular LHC (RHC) polarizer, respectively. The applied voltage is 10 V.

Figure 11.
Imaging performance of ferroelectric liquid crystal Pancharatnam-Berry lens for (a) RHC and (b) LHC polarized incident light.
Figure 11.
Imaging performance of ferroelectric liquid crystal Pancharatnam-Berry lens for (a) RHC and (b) LHC polarized incident light.

Figure 12.
The operating principle of 2D/3D switchable display. (a) The autostereoscopy system consists of the LC display, ESHFLC polarization selector unit, and polymeric lenticular lens array; (b) lens array: schematic representation of the spatial orientation. Principles of operation of (c) 2D and (d) 3D modes.

Figure 13.
Wavelength dependence of light transmittance and crosstalk (a problem of coupling signals intended for a picture element on a column into other picture elements on that column and adjacent columns). Inset figures show: (a) 2D content with non-focusing modulation (2D mode); (b) 2D content with focusing modulation; (c) 3D content with non-focusing modulation; (d) 3D content with focusing modulation.

Figure 14.
(a) Transmittance vs. voltage for bright and dark states of the ESHFLC mode. (b) Electro-optic performance of ESHFLC mode in comparison with the applied voltage (3 kHz, 5 V).
Figure 14.
(a) Transmittance vs. voltage for bright and dark states of the ESHFLC mode. (b) Electro-optic performance of ESHFLC mode in comparison with the applied voltage (3 kHz, 5 V).

Figure 15.
(a) The proposed pixel circuit structure for an active matrix ESHFLC to generate gray levels. (b) Driving scheme for an active matrix of FSC ESHFLC.
Figure 15.
(a) The proposed pixel circuit structure for an active matrix ESHFLC to generate gray levels. (b) Driving scheme for an active matrix of FSC ESHFLC.

Figure 16.
Prototype of the field-sequential color video display, based on the ESHFLC mode. R, G, B, respectively, sub-frame images: (a), (b), (c). Full-color image (d).
Figure 16.
Prototype of the field-sequential color video display, based on the ESHFLC mode. R, G, B, respectively, sub-frame images: (a), (b), (c). Full-color image (d).

Figure 17.
Schematic representation of the optical system for low-level laser therapy (LLLT).

Figure 18.
(a) Schematic illustration of the assembled optical system for portable LLLT. (b) Optical path of the beam as it propagates through lens L3 and LC lens.
Figure 18.
(a) Schematic illustration of the assembled optical system for portable LLLT. (b) Optical path of the beam as it propagates through lens L3 and LC lens.


Figure 19.
(a), (b) Geometry of FLC phase retarders 1 and 2. (a) The applied voltage is −10 V and (b) +10 V. (c) Geometry of nematic LC phase retarder 3 in the absence of an electric field. (d) Plot of phase retardation versus the applied voltage for phase retarder 3.
Figure 19.
(a), (b) Geometry of FLC phase retarders 1 and 2. (a) The applied voltage is −10 V and (b) +10 V. (c) Geometry of nematic LC phase retarder 3 in the absence of an electric field. (d) Plot of phase retardation versus the applied voltage for phase retarder 3.


Figure 20.
(a) Structure of LC lens. (b) Voltage-dependent lens power. Red squares denote the lens power at different V1 for V2 = 10 Vrms and f = 4.2 kHz. Blue diamonds represent the lens power vs. different V2 when V1 = 30 Vrms and f = 800 Hz. The LC lens is (c) positive when V1 > V2 and (d) negative when V2 > V1.

Figure 21.
(a) Beam spots at different lens powers for different transmissive color modes. (b) Irradiance as a function of beam diameter at different modes.
Figure 21.
(a) Beam spots at different lens powers for different transmissive color modes. (b) Irradiance as a function of beam diameter at different modes.

© 2020 by the authors. Licensee MDPI, Basel, Switzerland. This article is an open access article distributed under the terms and conditions of the Creative Commons Attribution (CC BY) license (http://creativecommons.org/licenses/by/4.0/).
Share and Cite
MDPI and ACS Style
Chigrinov, V.; Guo, Q.; Kudreyko, A. Photo-Aligned Ferroelectric Liquid Crystal Devices with Novel Electro-Optic Characteristics. Crystals 2020, 10, 563. https://0-doi-org.brum.beds.ac.uk/10.3390/cryst10070563
AMA Style
Chigrinov V, Guo Q, Kudreyko A. Photo-Aligned Ferroelectric Liquid Crystal Devices with Novel Electro-Optic Characteristics. Crystals. 2020; 10(7):563. https://0-doi-org.brum.beds.ac.uk/10.3390/cryst10070563
Chicago/Turabian StyleChigrinov, Vladimir, Qi Guo, and Aleksey Kudreyko. 2020. "Photo-Aligned Ferroelectric Liquid Crystal Devices with Novel Electro-Optic Characteristics" Crystals 10, no. 7: 563. https://0-doi-org.brum.beds.ac.uk/10.3390/cryst10070563
Note that from the first issue of 2016, this journal uses article numbers instead of page numbers. See further details here.