Article

Effect of Annealing Process on Microstructure, Texture, and Mechanical Properties of a Fe-Si-Cr-Mo-C Deep Drawing Dual-Phase Steel

1
Key Laboratory of Metallurgical Emission Reduction & Resources Recycling of Ministry of Education, Anhui University of Technology, Ma’anshan 243002, China
2
The Department of Chemical and Materials Engineering, University of Alberta, Edmonton, AB T6G1H9, Canada
3
School of Metallurgical Engineering, Anhui university of Technology, Ma’anshan 243032, China
4
Technical center, Ma’anshan Iron and Steel Co., Ltd., Ma’anshan 243000, China
5
Key Laboratory of the Ministry of Education for Modern Metallurgy Technology, North China University of Science and Technology, Tangshan 063210, China
6
Faculty of Materials Metallurgy and Chemistry, Jiangxi University of Science and Technology, Ganzhou 341001, China
*
Authors to whom correspondence should be addressed.
Submission received: 13 August 2020 / Revised: 30 August 2020 / Accepted: 31 August 2020 / Published: 2 September 2020

Abstract

:
Dual phase steel generally has poor deep drawing property with a low r value less than 1.0, making it difficult to be used for deep drawing automotive parts. In order to improve the mechanical properties of the steel through heat treatment, effect of heat treatments with different conditions on a Fe-Si-Cr-Mo-C deep drawing dual-phase steel was investigated with the aim of identifying effective heat treatment parameters for effective modification towards optimal properties. Relevant thermal dilation and heat treatment experiments were performed. Corresponding characters were investigated. The results show that island martensite can be obtained at low cooling rate. With the increase of cooling rate, the formation of pearlite and bainite is favored. During annealing at low temperatures, recrystallization of the steel is incomplete with the presence of the shear bands. With the increase of annealing temperature, the recrystallization process is gradually complete, and the number of high angle grain boundaries increases significantly. The ratio of gamma orientation components to alpha orientation components decreases first and then increases with the increase of annealing temperature. The strain hardening exponent and r value show an upward trend with respect to annealing temperature, and the r value is as high as 1.15.

1. Introduction

Low carbon gas emission, information, and intelligence are the main components for the future trend of automotive technological advance [1,2,3,4]. The automotive industry is one of strategically important industrial sectors, which affects the technological progress and social modernization, and plays a key role in economic growth [5,6]. The development of automotive industry is largely related to steel technology. The automobile manufacturing industry is the largest user of steel sheet. In recent years, with the increasingly rigorous implementation of safety and fuel economy regulations, advanced steels with higher strength and toughness are demanded by the automotive industry [7]. Vehicle weight and engine power are two of the most important parameters that influence a vehicle’s fuel consumption and carbon dioxide (CO2) emissions, among which the most effective method is to reduce the vehicle weight [8,9]. The use of lightweight components is a fundamental requirement in material engineering. Owing to the economic and ecological considerations, the weight of automotive structure should be reduced. In order to reduce the structure’s weight while retaining required strength, materials for the structure must be stronger and tougher [10,11,12]. Profound progress in automobile steel manufacturing has been achieved through the development of advanced high-strength steels (AHSS), fueled by the conflicting demands on the automotive industry to simultaneously improve crash safety and fuel economy [13,14,15].
Dual-phase (DP) steel is the flagship of advanced high-strength steels, which was the first among various candidate alloy systems to find application in light-weight automotive components [16]. With relatively simple thermomechanical treatment and lean alloying, a hard martensitic or bainitic phase is dispersed in a ductile ferritic matrix [17,18,19], providing a series of excellent and industrially accessible mechanical properties [16,18]. The dual-phase steel exhibits an excellent combination of strength and ductility, which has higher ultimate tensile strength, lower initial yielding stress, higher initial stage strain hardening, high ductility, and high bake hardening [17,20,21,22]. These high-level mechanical properties obtained in the DP steels lend good energy-absorption capacity, making it suitable for use in structural parts and reinforcements [19,22]. The high strain hardening combined with a pronounced bake hardening effect gives the DP steel great potential for reducing the weight of structural parts and even skin parts [23,24].
Dual-phase steel is a low carbon or low carbon micro-alloying steel, which can be produced by hot rolling or cold rolling [25,26,27]. The rolling temperature and cooling process influence the microstructure of the steel, e.g., transformation of a ferrite-martensite structure from austenite during hot rolling [28,29]. For cold rolling, properties of the steel can also be modified on the continuous annealing lines where there is even greater control over thermal treatment [30,31,32]. However, due to the complex microstructure of the steel, from a scientific perspective, a full understanding and well guided control of microstructure evolution in DP steel for optimized properties have not been achieved yet [16]. Currently, traditional DP steel is not a good candidate for applications that require high drawability. The DP steel usually exhibits rather poor plastic strain ratio value (r value), rendering it difficult to be used as the skin parts by stamping as well as the structure parts with high deep drawing performance [33,34,35,36,37,38]. This drawback, however, could be eliminated by adding carbide forming elements that may induce precipitation at low temperatures or act as solute for solution hardening at high temperatures [34,36,37]. Alternatively, the volume fraction of martensite can be reduced, leading to decrease the texture density and fraction of α fiber [35,37]. However, there are still open questions, mainly related to the through-process microstructure and texture development as well as the structure–property relationships [16]. It is not easy to answer the questions, ascribed to the complexity involved in the effect of processing conditions on the mechanical behavior of DP steels because of the mutual influences among the processing- and composition-dependent microstructural parameters [16]. In this study, with the specific consideration for deep drawing capability and theoretical understanding of dual-phase steel, a low carbon 1.0Si-0.15Cr-0.5Mo deep drawing dual phase steel was designed and investigated. The main objective of study is to determine the process–structure–property relationships with the eventual goal to effectively control microstructure during continuous annealing and cooling processes for maximizing deep drawing capability (plastic strain ratio) alone with other optimized mechanical properties.

2. Experimental Material and Procedure

2.1. Material Design

The material under study is selected mainly based on its deep drawing property and proper hardenability to form a certain amount of martensite, which could be adjusted by alloying with selected elements. Carbon can act as an austenite stabilizer and affect the formation of martensite at practical cooling rates. However, higher carbon contents would inhibit the formation of γ fiber texture, and then deteriorates the deep drawing property of the steel [39]. As discussed later, texture can induce plastic anisotropy and influence the formability of a metallic material. Mn can improve not only the stability of austenite but also strengthen ferrite by solution-hardening as well as retard ferrite formation [40,41]. Mo and Cr could be used to partially replace C and Mn for sufficient hardening ability, since they help retard the formation of pearlite or bainite and thus keep a sufficient amount of martensite as well as help enhance the solute-hardening effect. Mo addition is more effective than Cr and Mn to obtain the required volume fraction of martensite and higher mechanical strength [36,42,43]. Silicon promotes ferrite transformation and has a negligible solubility in cementite, thus suppressing the precipitation of cementite [44,45,46]. Furthermore, instead of cementite precipitation, carbon partitions from ferrite into untransformed austenite. The carbon enrichment increases the stability of the austenite and thus allows most of the austenite to transform into martensite in the temperature range of about 300 °C even under the slow cooling condition, due to the increased hardenability attained by the enriched carbon and the presence of molybdenum, chromium, manganese, etc., in solution. Nb can react with C in steel to form niobium carbide, which can dissolve and stabilize austenite at high temperature [47]. Based on the above consideration, a novel steel is designed which is denoted as Fe-0.025C-1.0Si-1.0Mn-0.15Cr-0.50Mo (wt %). Details of chemical composition of the steel are given in Table 1. The Ae1 and Ae3 temperatures calculated by Thermo-calc software are 740 and 943 °C, respectively.

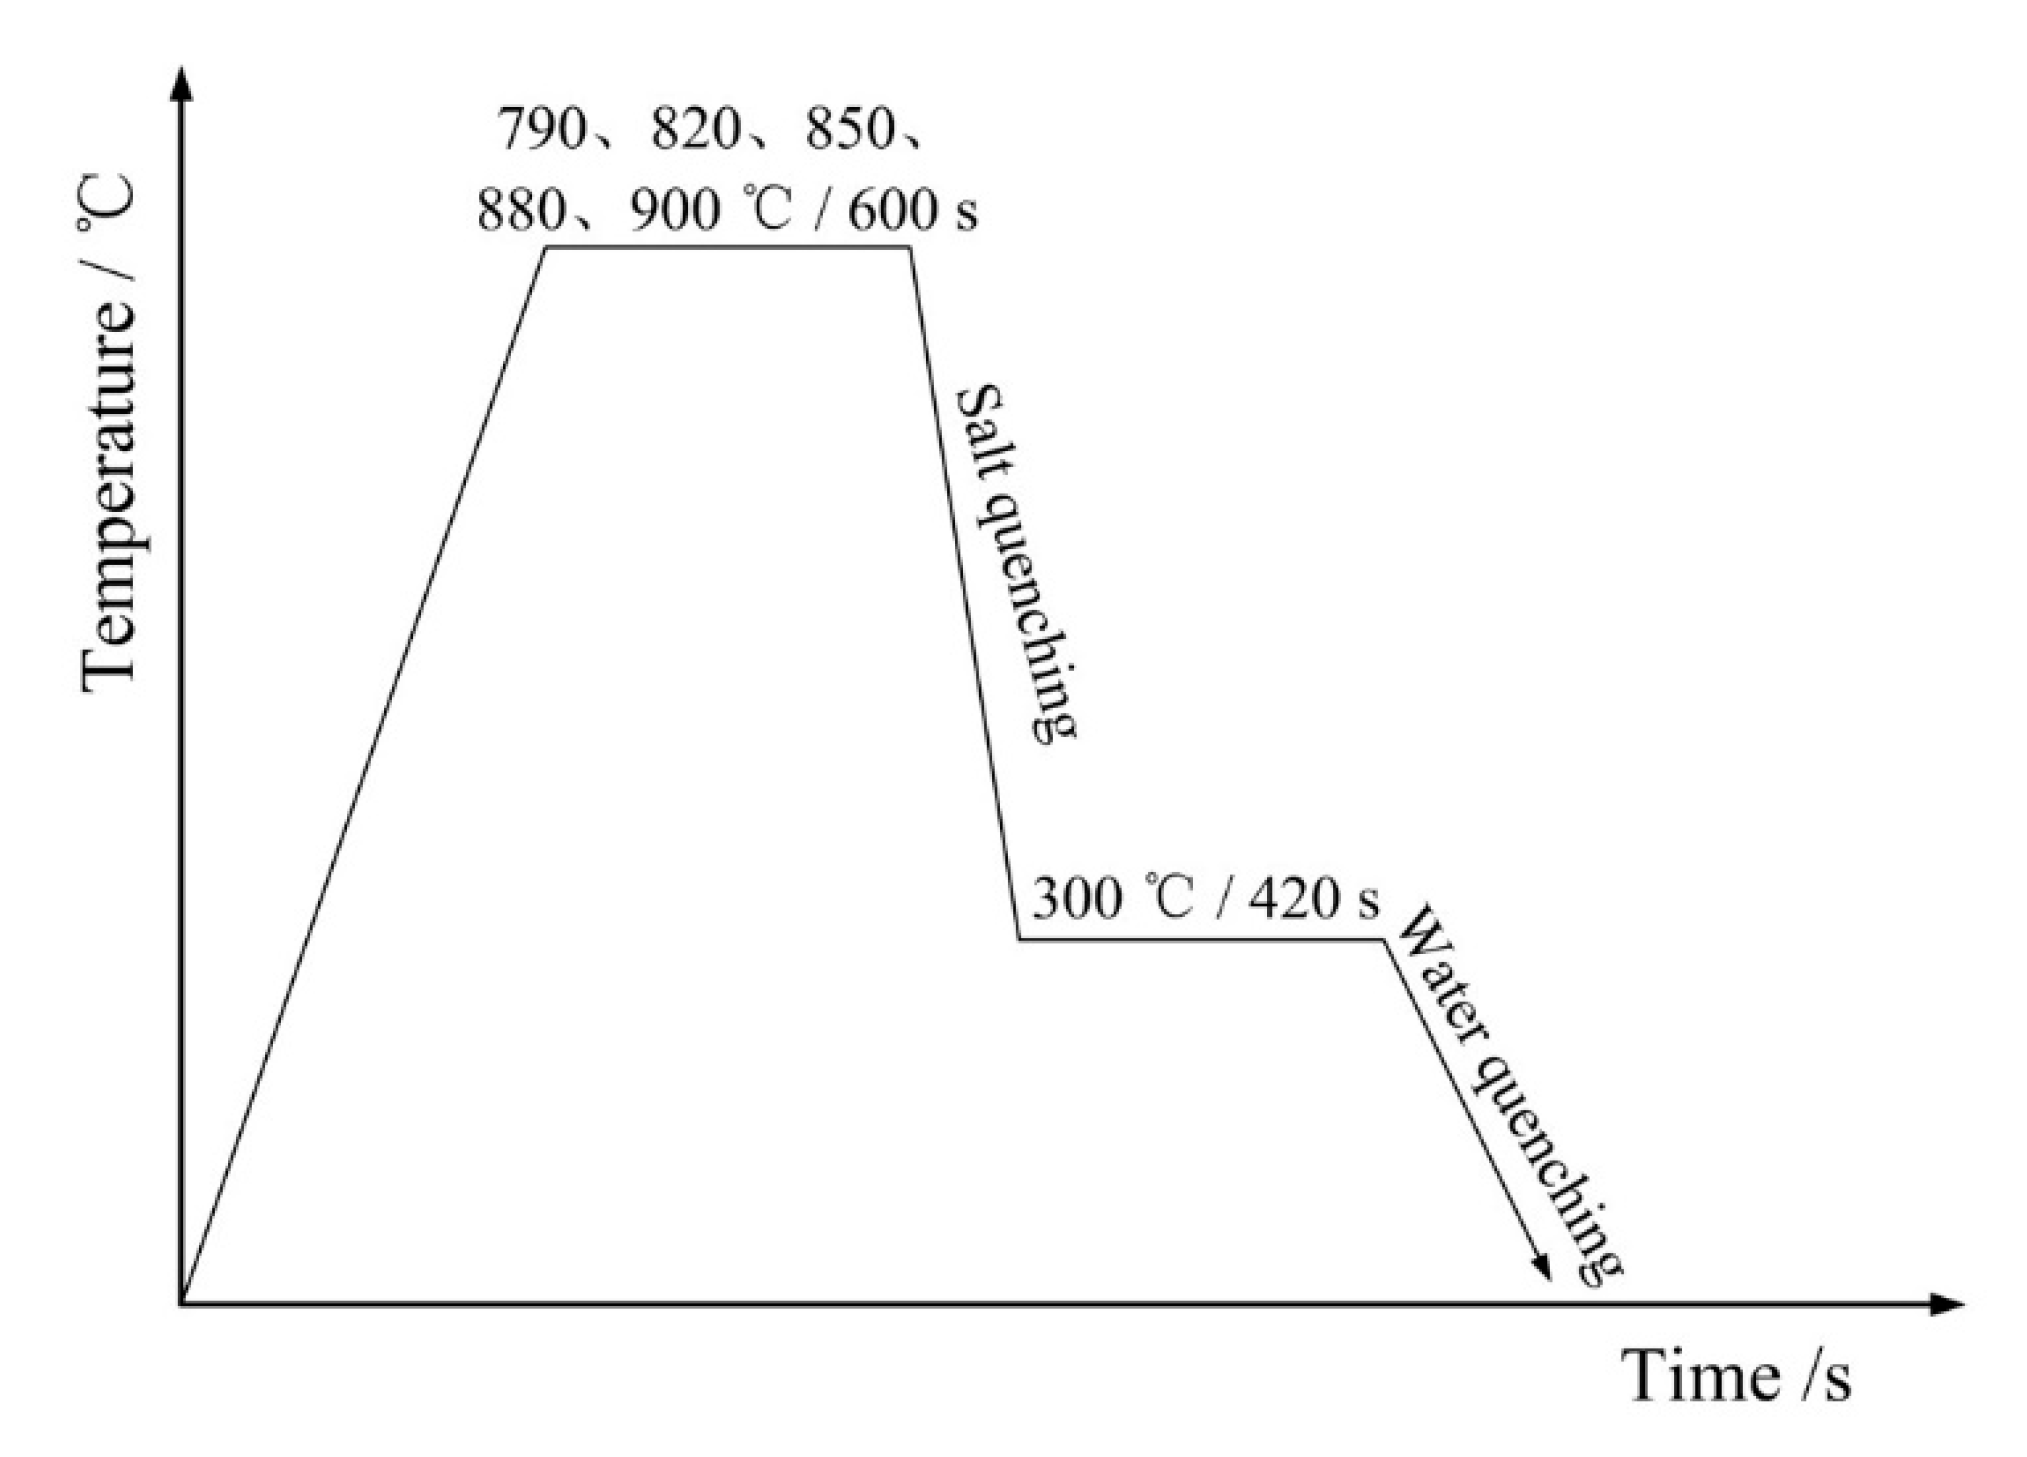
2.2. Experimental Procedure

The designed steel was fabricated by vacuum induction melting. The ingot of 100 kg was forged to make slabs of 30 mm in thickness, which were reheated to 1200 °C and held for 2 h, followed by hot-rolling at a temperature between 850 and 1100 °C to reduce their thickness to 3 mm. After water cooling to 600 °C, the plates were placed in a box resistance furnace for 2 h, and then cooled in the furnace to simulate coiling. The microstructure of the as-rolled plates was a mixture of ferrite and pearlite. The plates were pickled in a 10% hydrochloric acid solution and further cold-rolled to reduce their thickness to 1.0 mm using a four high reversing mill.
φ 4 × 10 mm small cylinders were made from the forged slabs by wire cutting and machining. The critical temperatures were measured, and the continuous cooling experiments were performed on a Bähr DIL805 A quenching dilatometer (Baehr-Thermo, New Castle, Germany). The continuous cooling experiments were arranged as follows. For austenitization and homogenization, the samples were first heated to 1000 °C at a heating rate of 10 °C/s and held for 3 min, followed by cooling to the room temperature at cooling rates of 0.5, 1, 3, 5, 10, 15, 20, and 30 °C/s, respectively.
Samples were annealed in a salt bath at 790, 820, 850, 880, and 900 °C inter-critical temperature, respectively, for 600 s, then transferred within 3 s to a salt bath at 300 °C and held there for 420 s, and then water-cooled to room temperature. The entire process is illustrated in Figure 1.
Samples were sequentially ground with 100, 200, 400, 600, and 800 grit SiC papers, polished with particle diameter of 5 and 1.5 μm diamond grinding paste and then etched in a 4% nital solution. Microstructure characterization was carried out using an Olympus BX51 optical microscope (Olympus, Taoyuan, Japan) and FEI Nova NanoSEM 430 field emission scanning electron microscopy (FEI, Eindhoven, Netherlands). Electron backscatter diffraction (EBSD) analysis was conducted using a Zeiss-SIGMA field-emission scanning electron microscope (Carl Zeiss AG, Cambridge, UK) with a step size of 0.6 μm. Prior to the EBSD analysis, the samples were sequentially ground with 400, 800, 1000, and 2000 grit SiC papers and electropolished at room temperature in a solution of 8% perchloric acid alcohol solution at an operating voltage of 32 V. For tensile tests, specimens with 50 mm gauge length and 12.5 mm gauge width were machined from the sheet with the gauge length parallel to the rolling direction. The tensile tests with a tensile speed of 2 mm/min were performed using a Zwick/Roell Z150 universal electronic tensile testing machine (ZwickRoell, Ulm, Germany) at the room temperature. Vickers hardness of samples was measured using a HVT-1000 A digital microhardness tester (Huayin, Laizhou, China). Five different positions were measured for each sample, and the reported value is an average of the results from the five measurements.

3. Results and Discussion

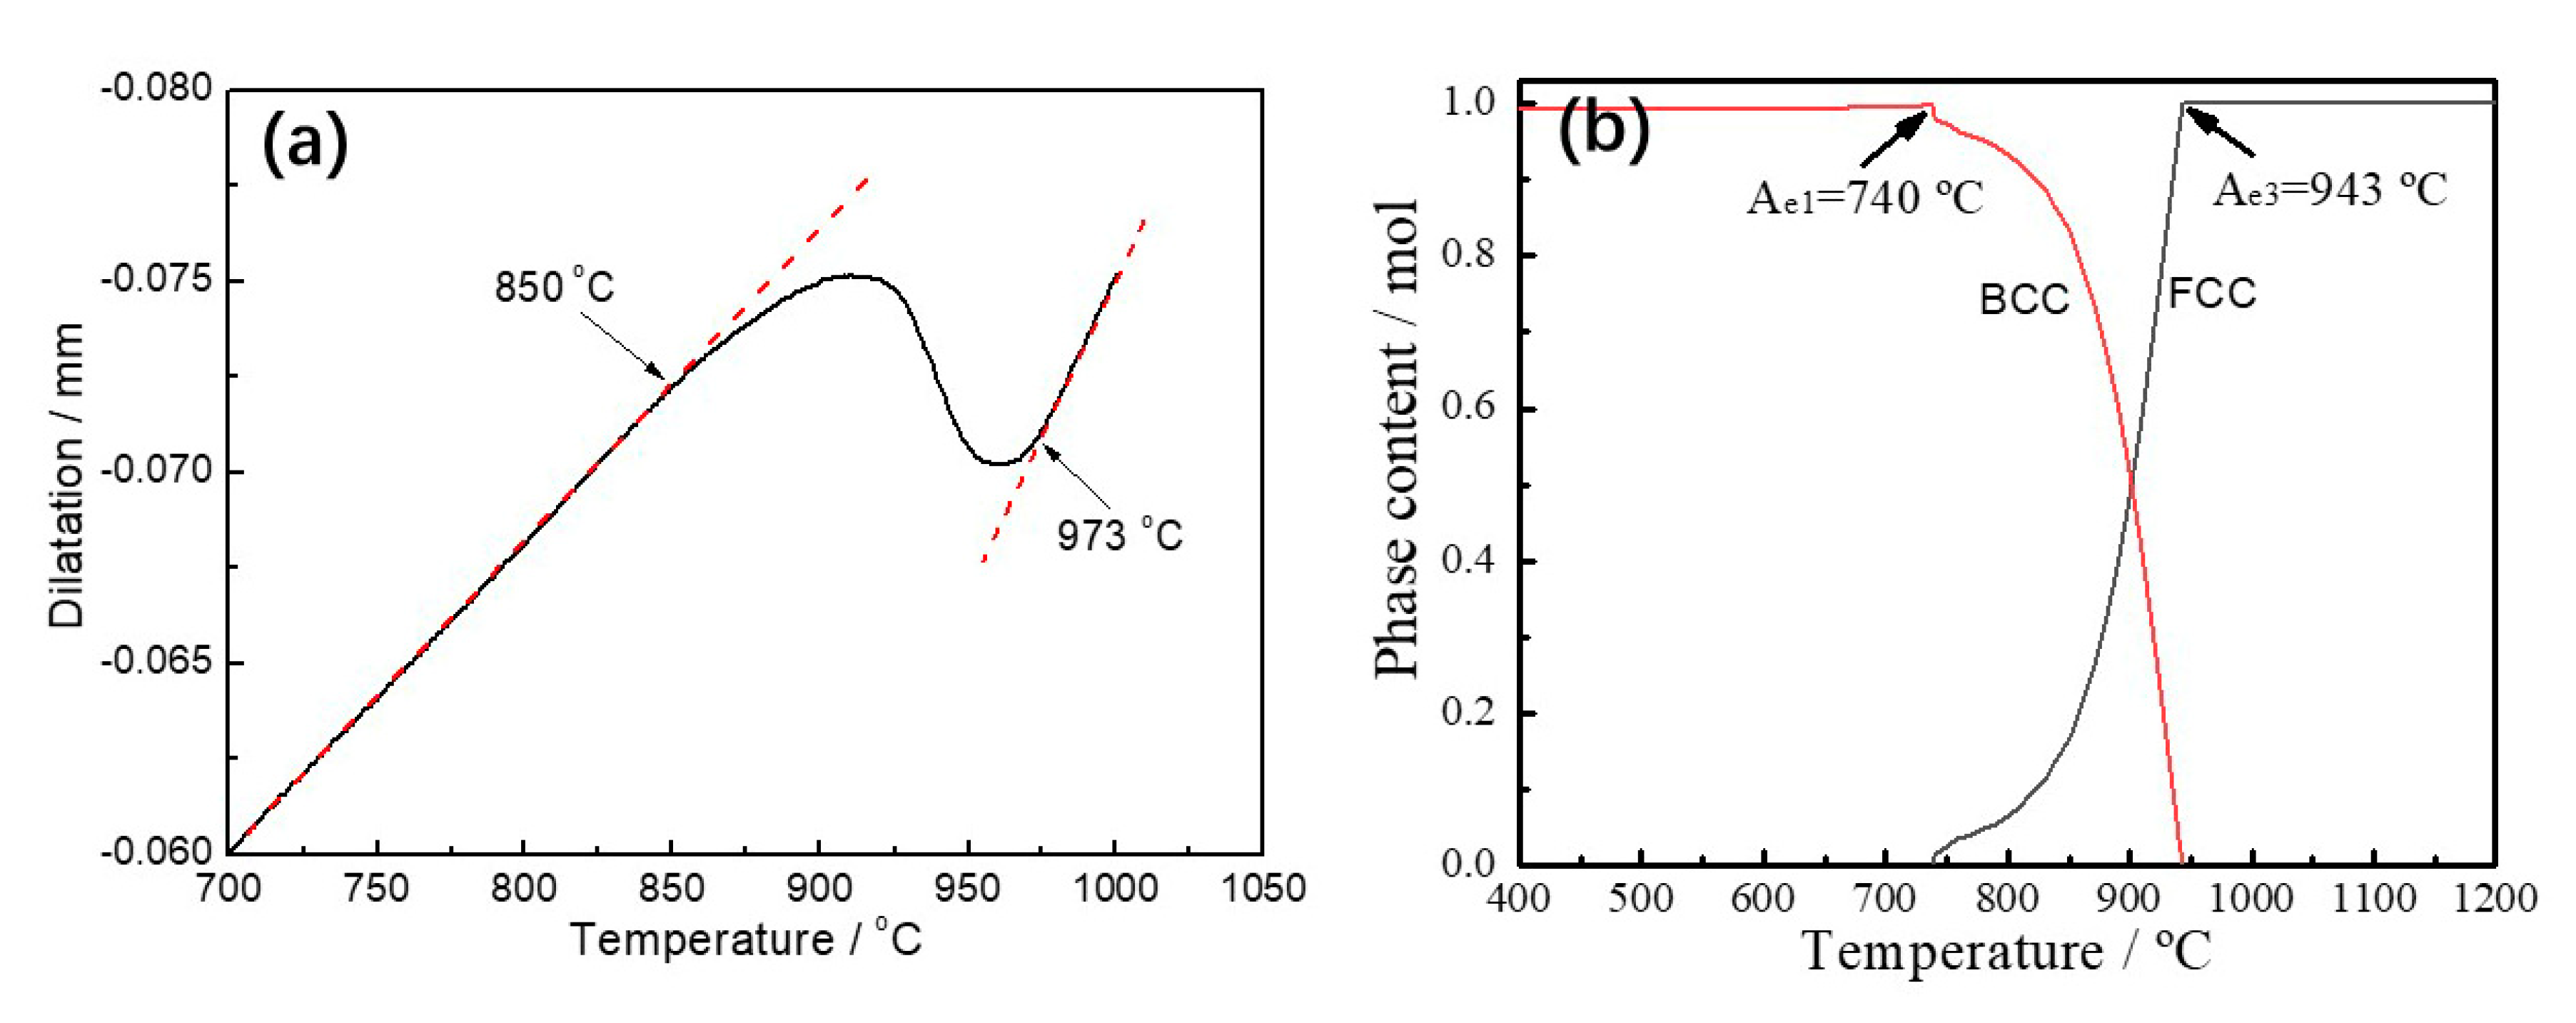
3.1. The Phase Transformation Behavior

The dilatometer can be used to accurately measure dilatation of a sample with temperature, and the phase transformation temperatures can be determined from the dilatation-temperature curves. The dilatation curve of the sample heated at 10 °C/s is illustrated in Figure 2a. From the dilation curve, one may determine the transformation temperatures, Ac1 and Ac3, which are 850 and 973 °C, respectively. A partial equilibrium phase diagram calculated by Thermo-calc software (Thermo-Calc Software AB, Solna, Sweden) is shown in Figure 2b, from which it is concluded that the critical temperatures of Ae1 and Ae3 are 740 and 943 °C, respectively. The results show that the heating rate has a large influence on the transformation temperature of pearlite but little influence on the transformation temperature of ferrite. This is mainly ascribed to the fact that the diffusion of alloying elements is slow at low temperatures, thus requiring a long time for the phase transformation to complete. For martensitic transformation, its starting temperature Ms can be estimated using an empirical model, which is influenced by the concentrations of alloying elements in wt % [48]:
Ms[°C] = 561 − 423·C − 30.4·Mn − 17.7·Ni − 12.1·Cr − 11·Si − 7·Mo
For the designed steel (see Table 1), its martensite starting temperature is calculated to be 500.8 °C.

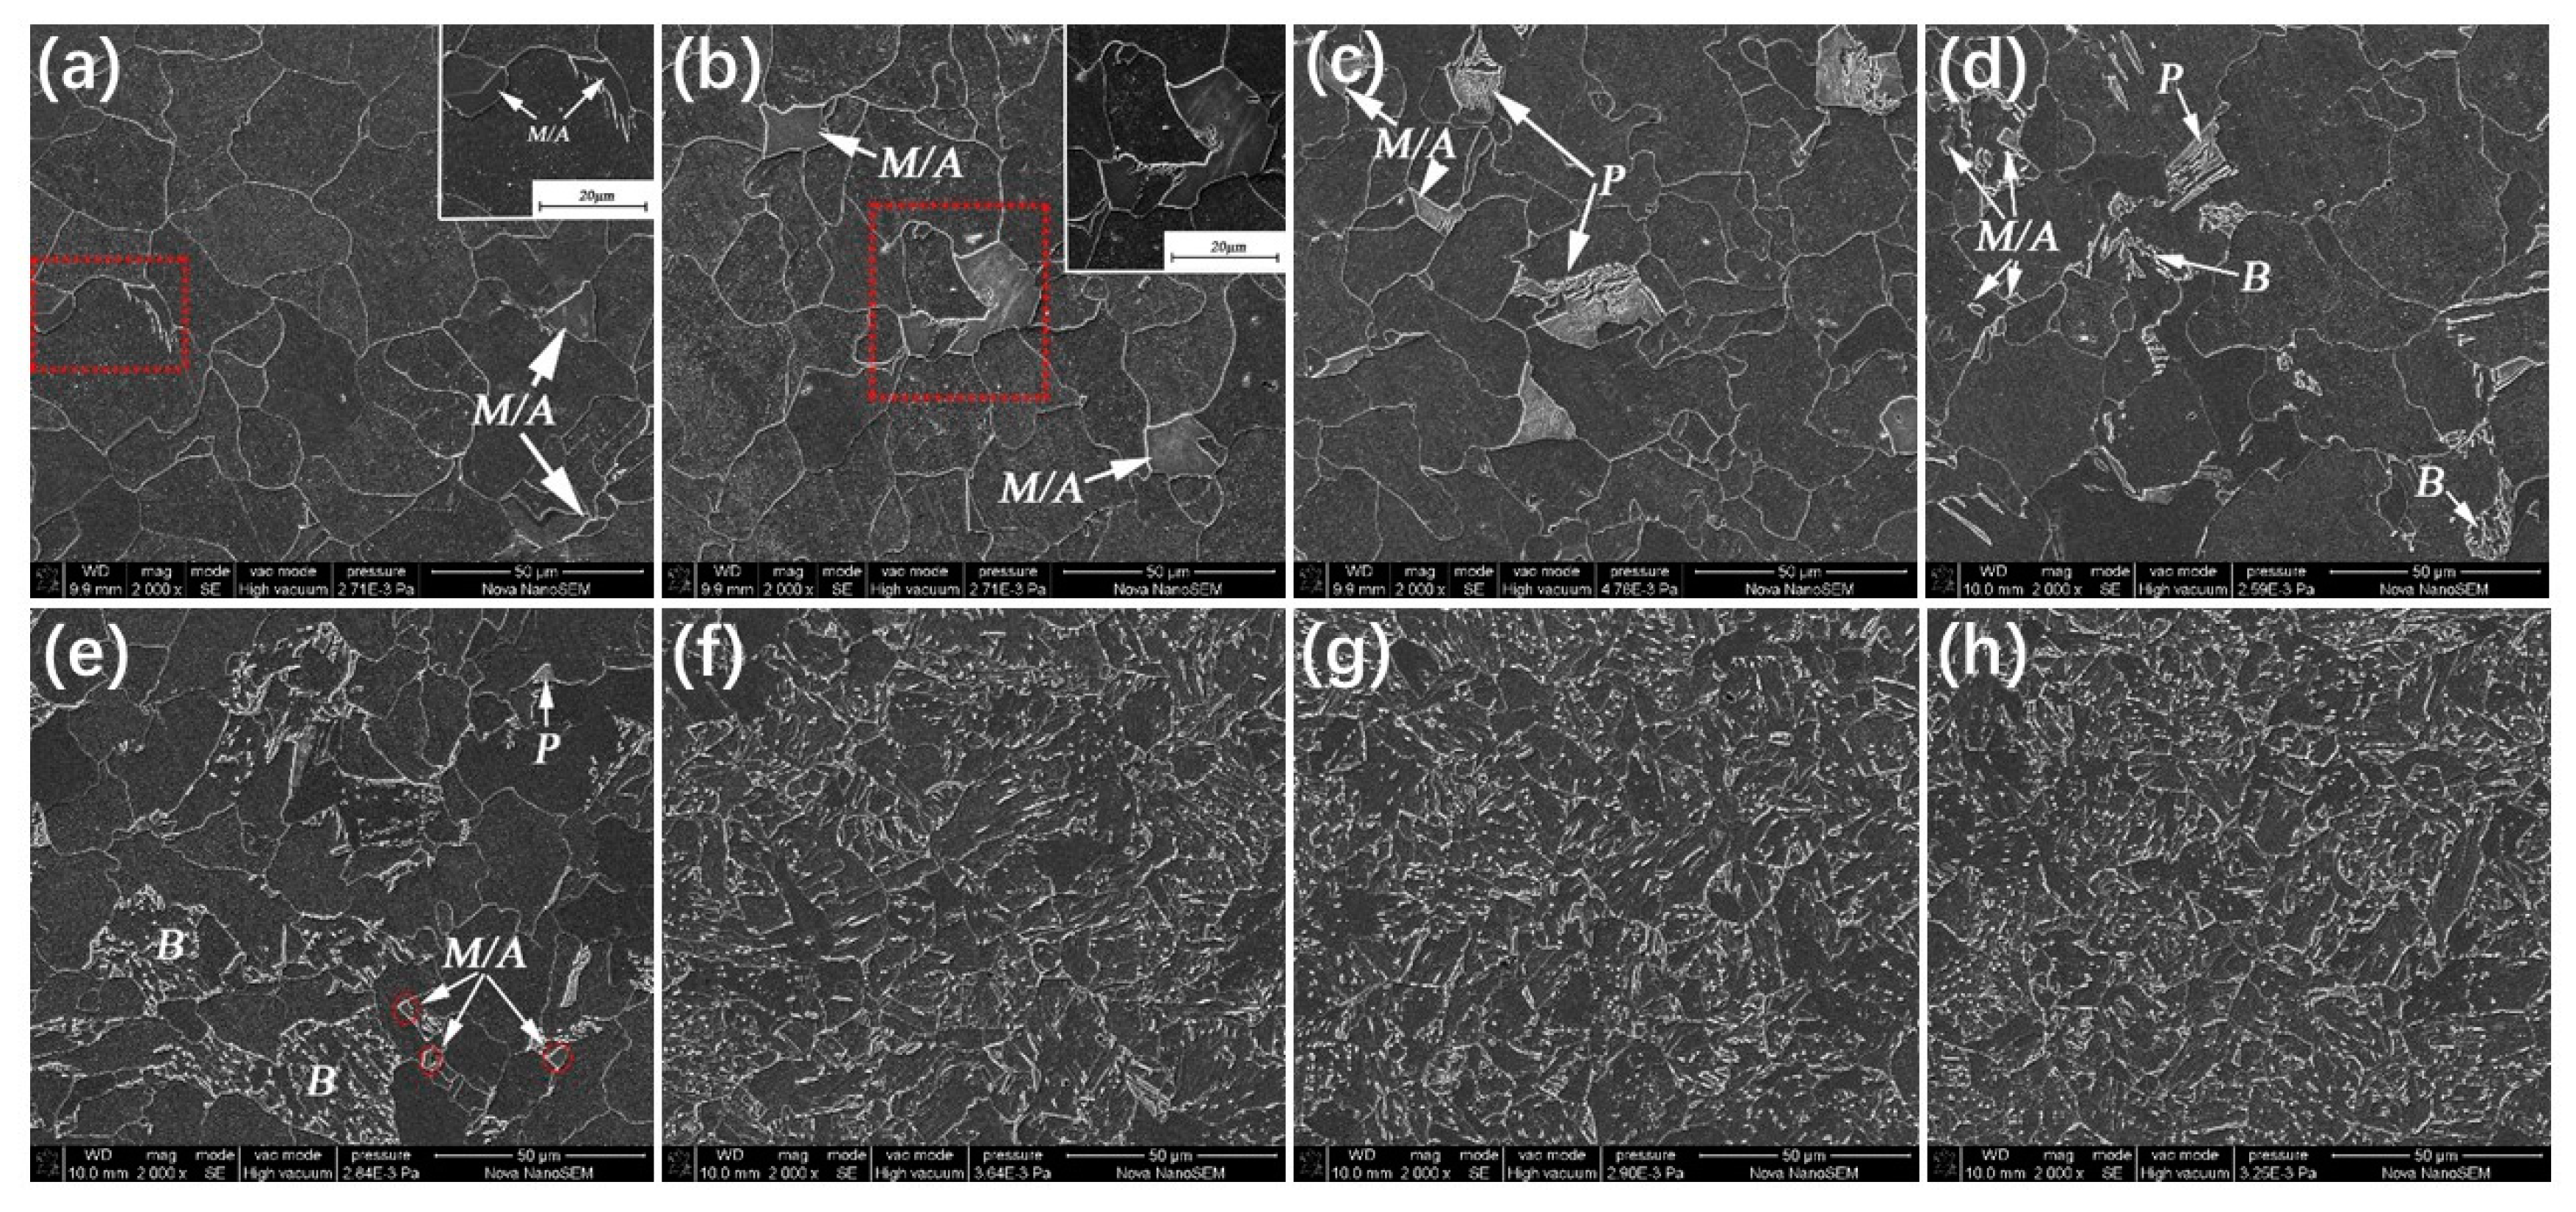
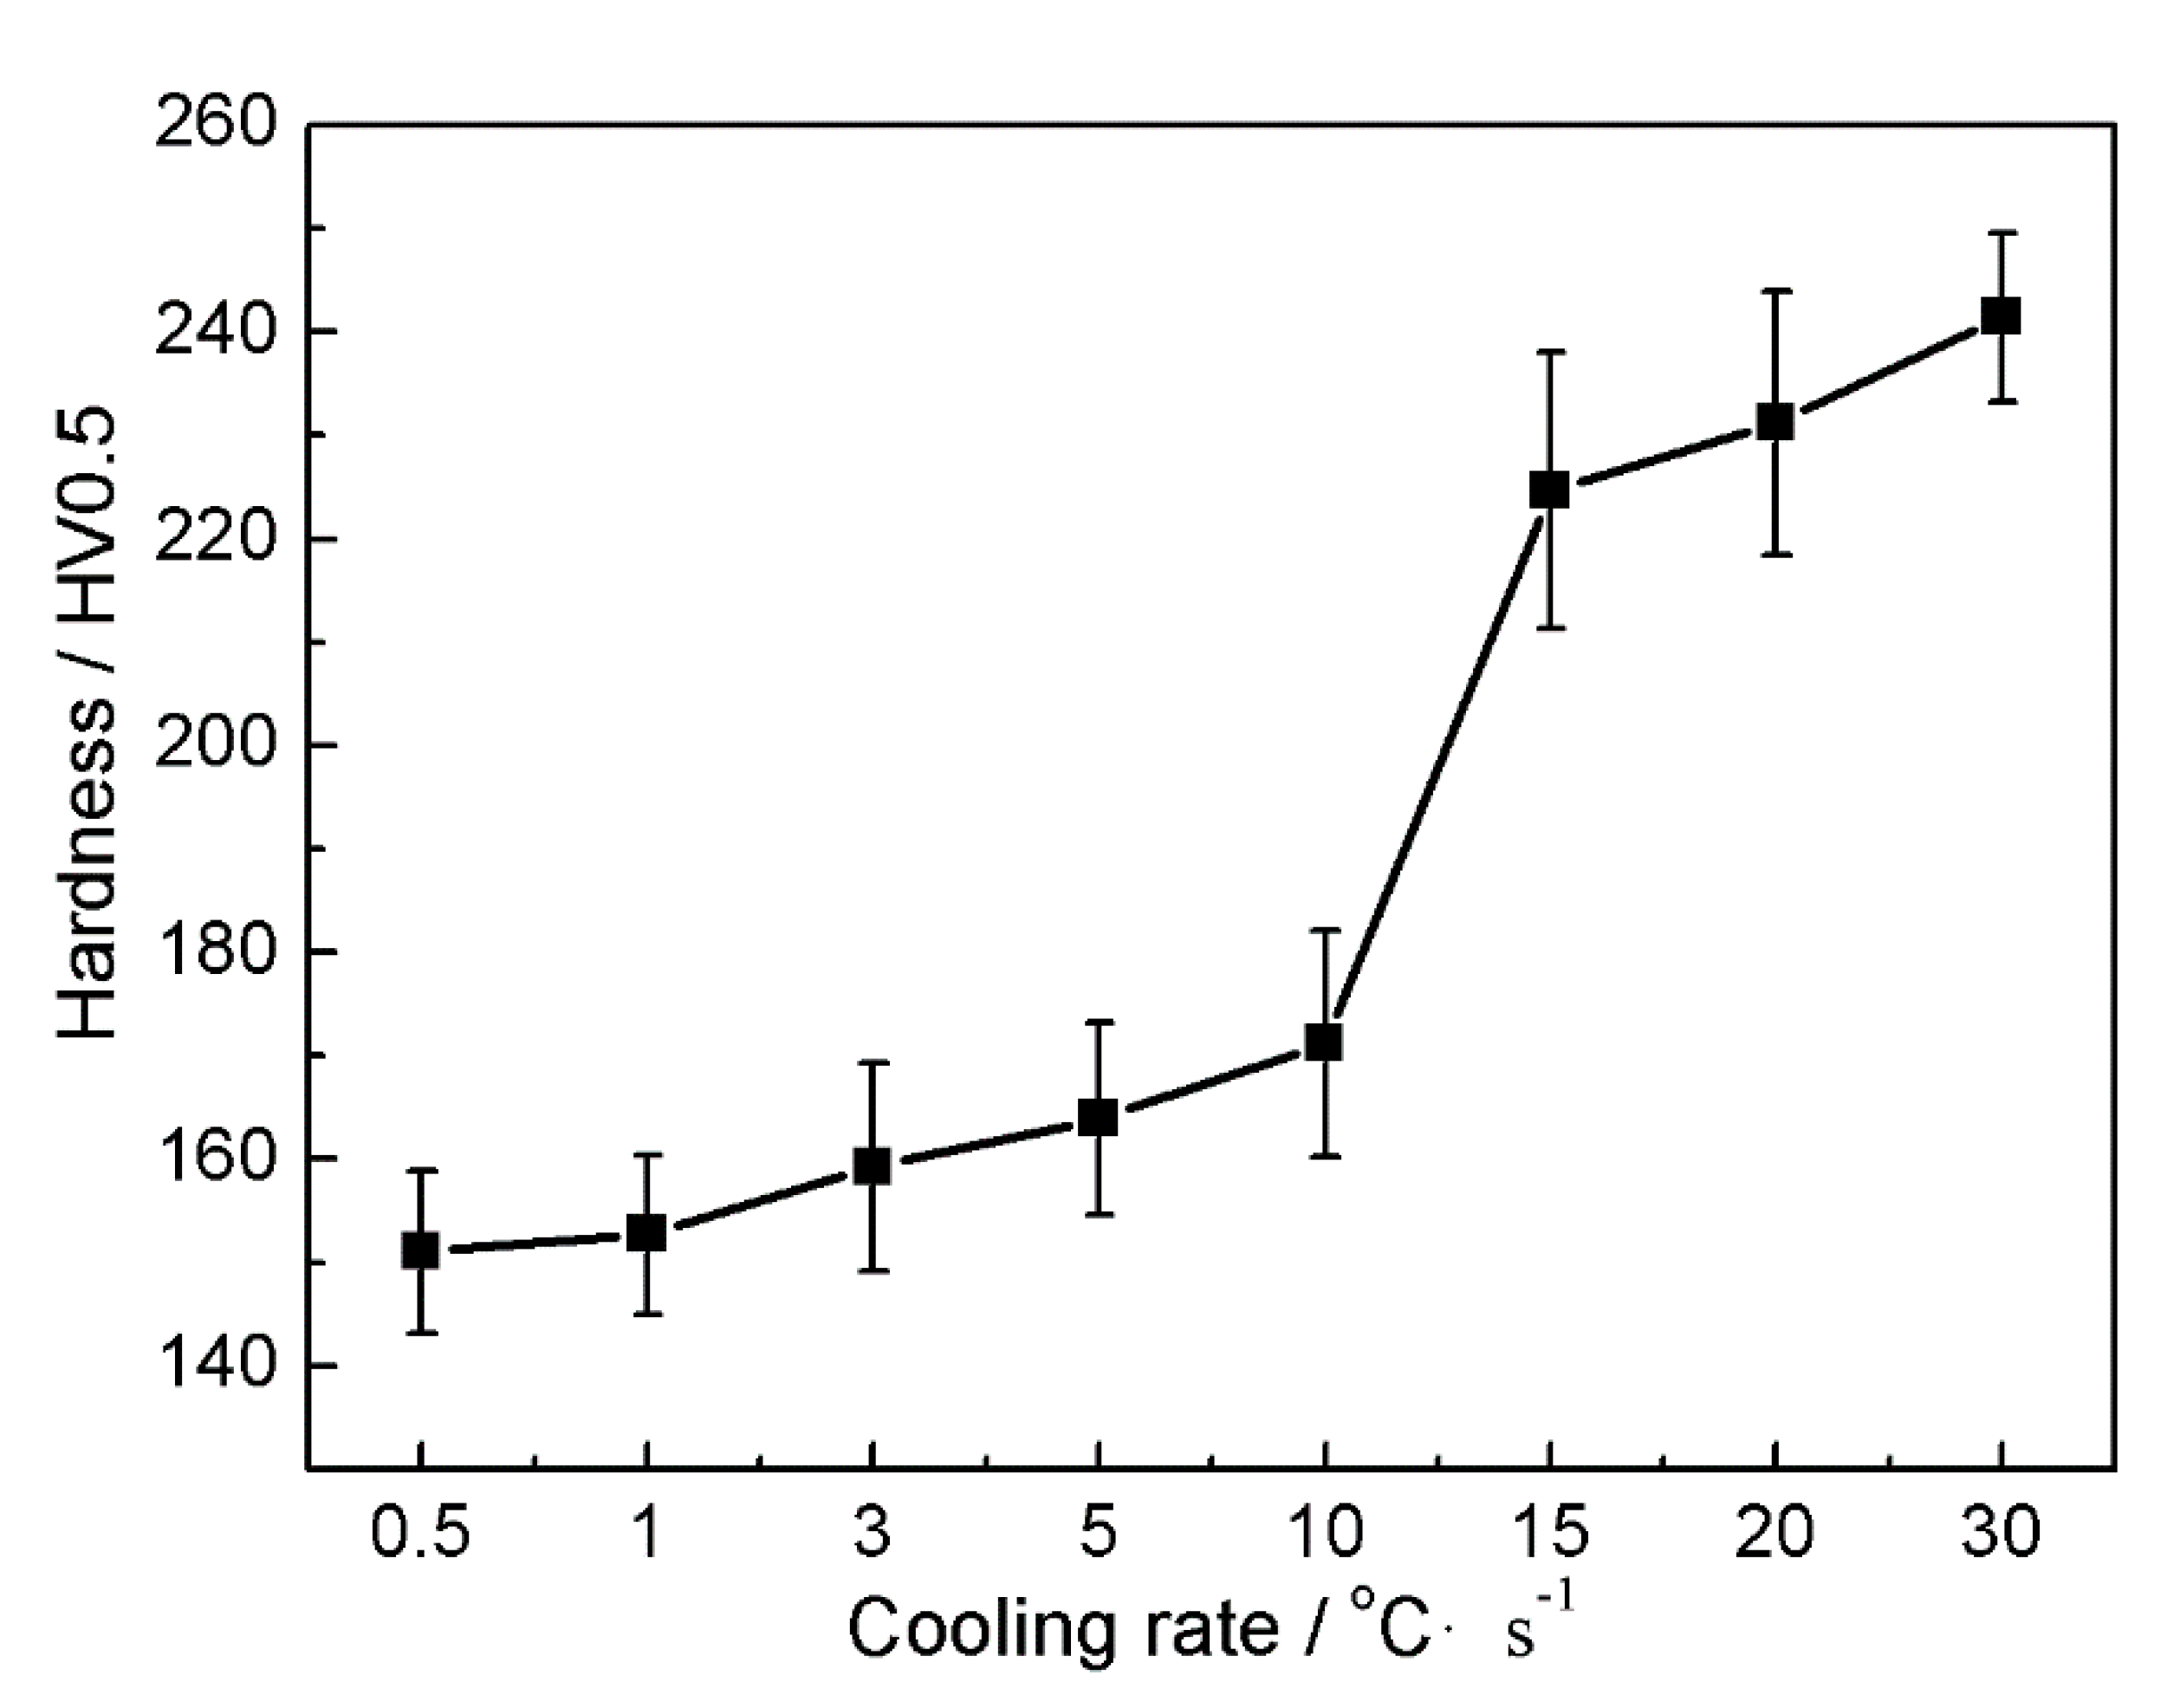
3.2. Effect of Cooling Rate on Microstructure Evolution and Hardness

Microstructures of samples cooled at different cooling rates are depicted in Figure 3. At low cooling rates of 0.5 and 1 °C/s, microstructures of the samples are composed of ferrite and M/A islands as Figure 3a,b illustrate. Pearlite and bainite are not observed in the samples. In order to reveal the M/A islands more clearly, the areas marked by the red dotted boxes in Figure 3a,b are enlarged and shown in the upper right corner of the figures, where the M/A islands are convex and clearly visible. When the cooling rate increases to 3 °C/s, pearlite appears in the microstructure, which is composed of ferrite, pearlite, and M/A islands as Figure 3c shows. At cooling rates of 5 and 10 °C/s, bainite begins to appear in the microstructures, which consist of ferrite, pearlite, bainite, and M/A islands. However, the size and content of pearlite and M/A decrease at the higher cooling rates as shown in Figure 3d,e. As the cooling rate is equal to or higher than 15 °C/s, the M/A islands and pearlite in the microstructure disappear. In this case, the microstructures are composed of a small amount of fine ferrite and a large amount of bainite. With increasing the cooling rate, the content of bainite continuously increases and the microstructure becomes finer as Figure 3f–h illustrate.
Hardness values of the samples cooled at different cooling rates were measured and are shown in Figure 4. As illustrated, the hardness does not change much when the samples are cooled at cooling rates of 0.5 and 1 °C/s, which show similar microstructures consisting of coarse ferrite and a small amount of martensitic islands. With increasing the cooling rate, hardness of the steel increases due to the microstructure refinement and the generation of a certain amount of bainite. The hardness increases slowly within the cooling rate range of 3–10 °C/s, shown by the small slope of the hardness-cooling rate curve, because the samples have similar microstructures with only slight changes in grain size and bainite content. After the cooling rate is further increased to and above 10 °C/s, the slope of the curve increases significantly, accompanied with obvious changes in microstructure as Figure 3 illustrates. The microstructures corresponding to the high cooling rates are composed mainly of bainite with a small amount of fine ferrite. Further increasing the cooling rate does not change the slope of the curve much and corresponding microstructures are rather similar.

3.3. Effect of Annealing Temperature on Microstructure, Texture, and Corresponding Mechanical Properties

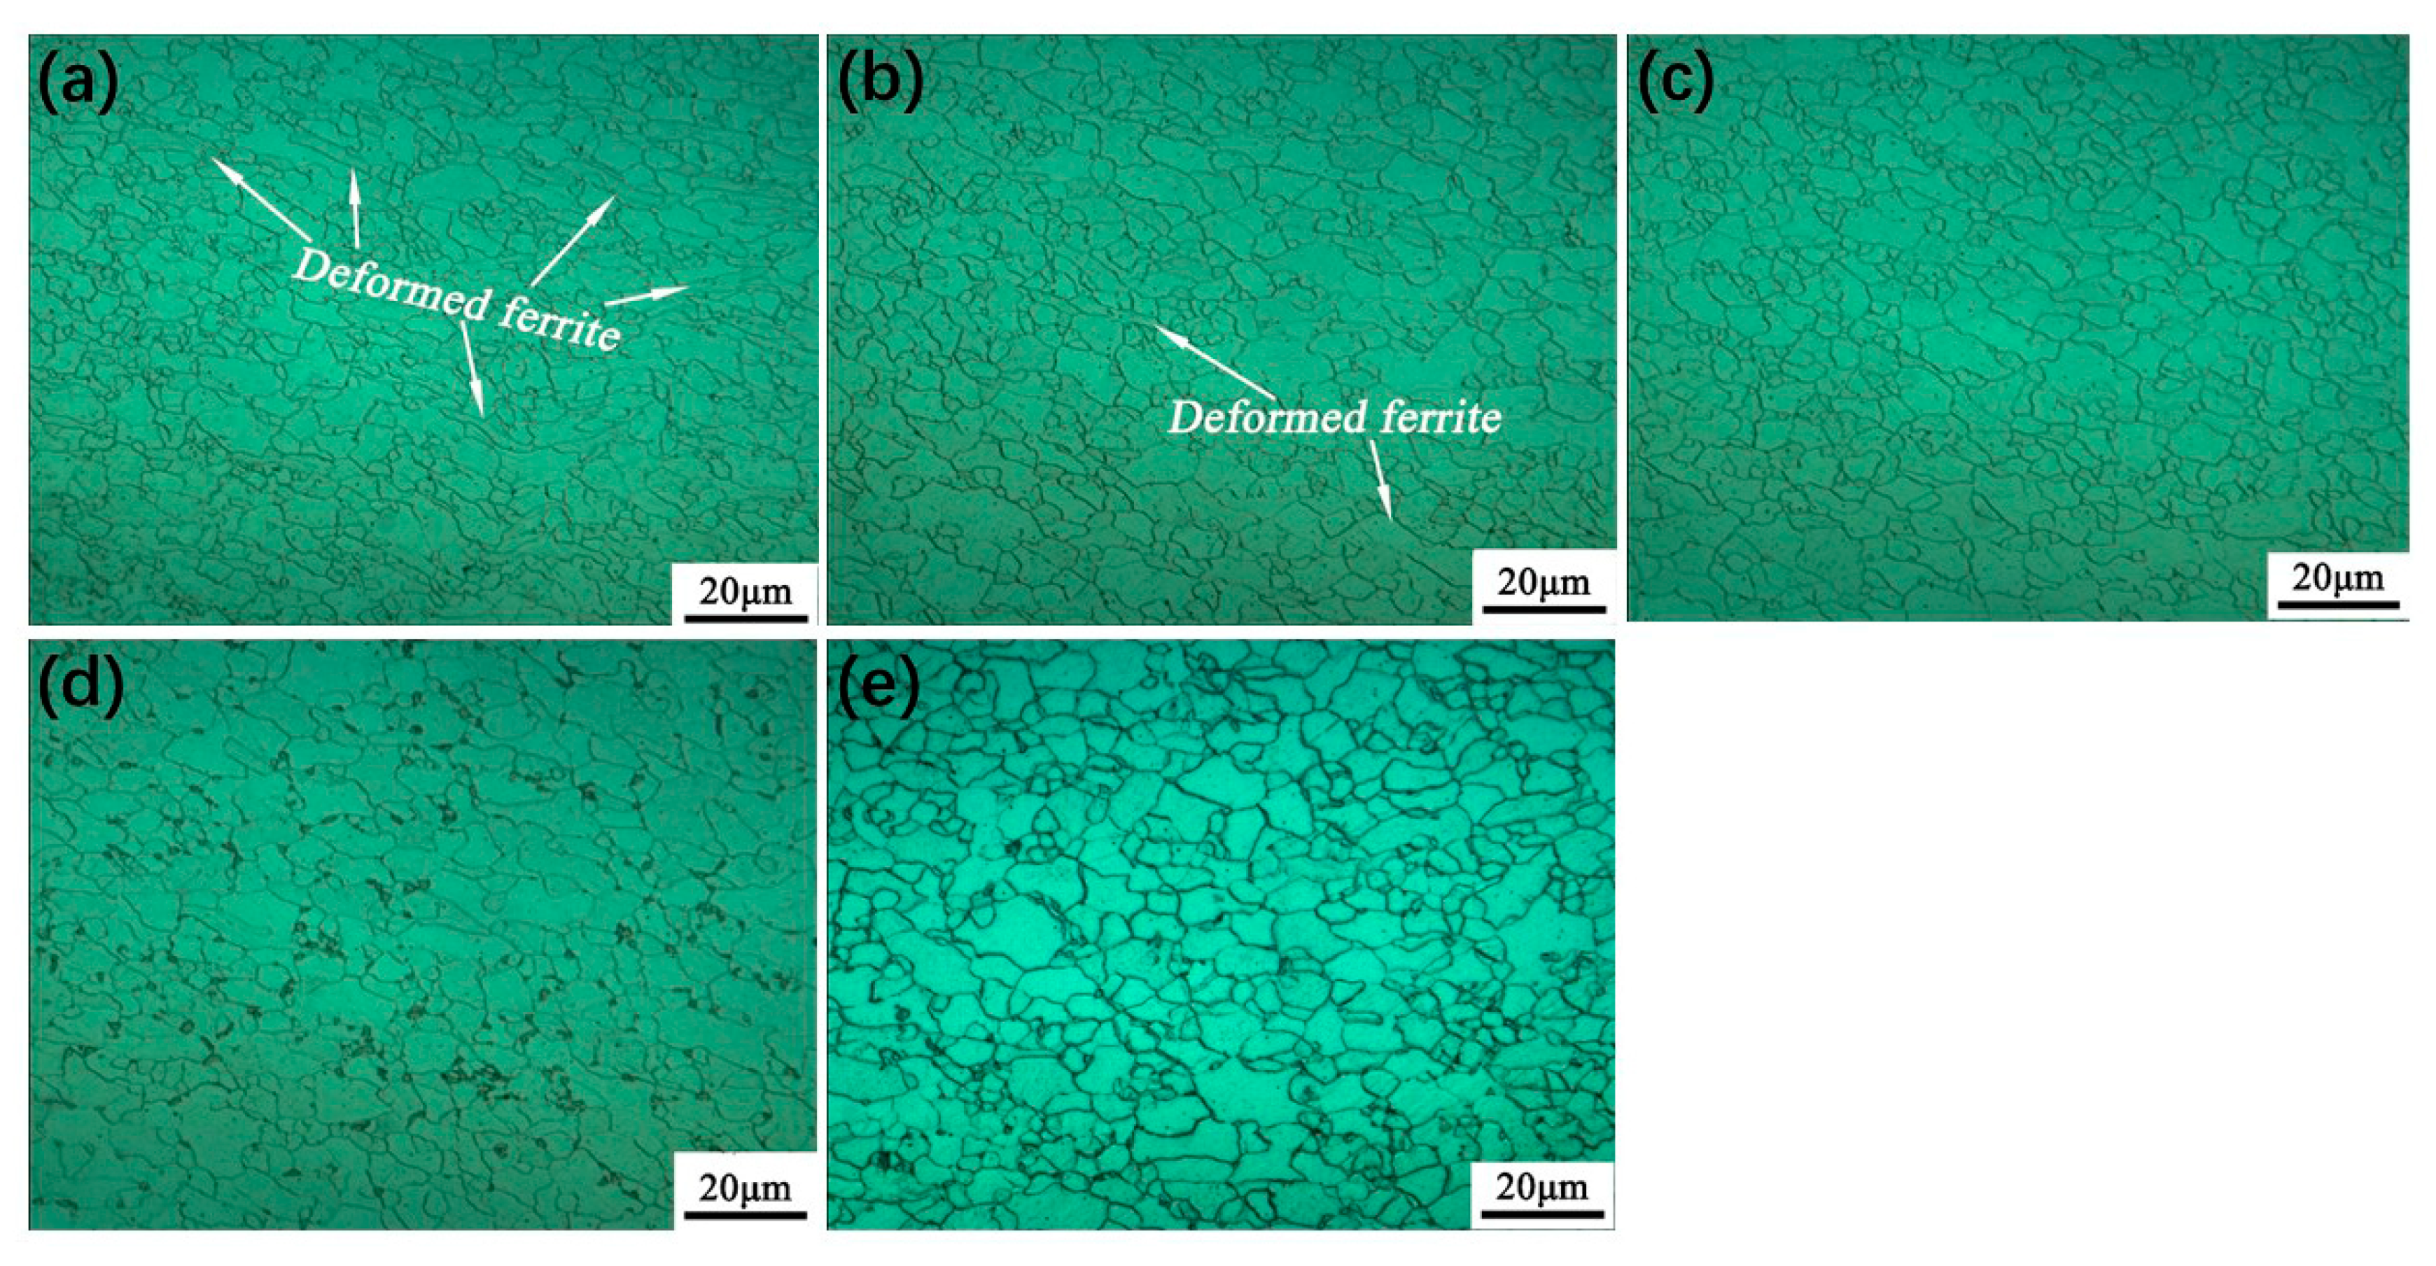
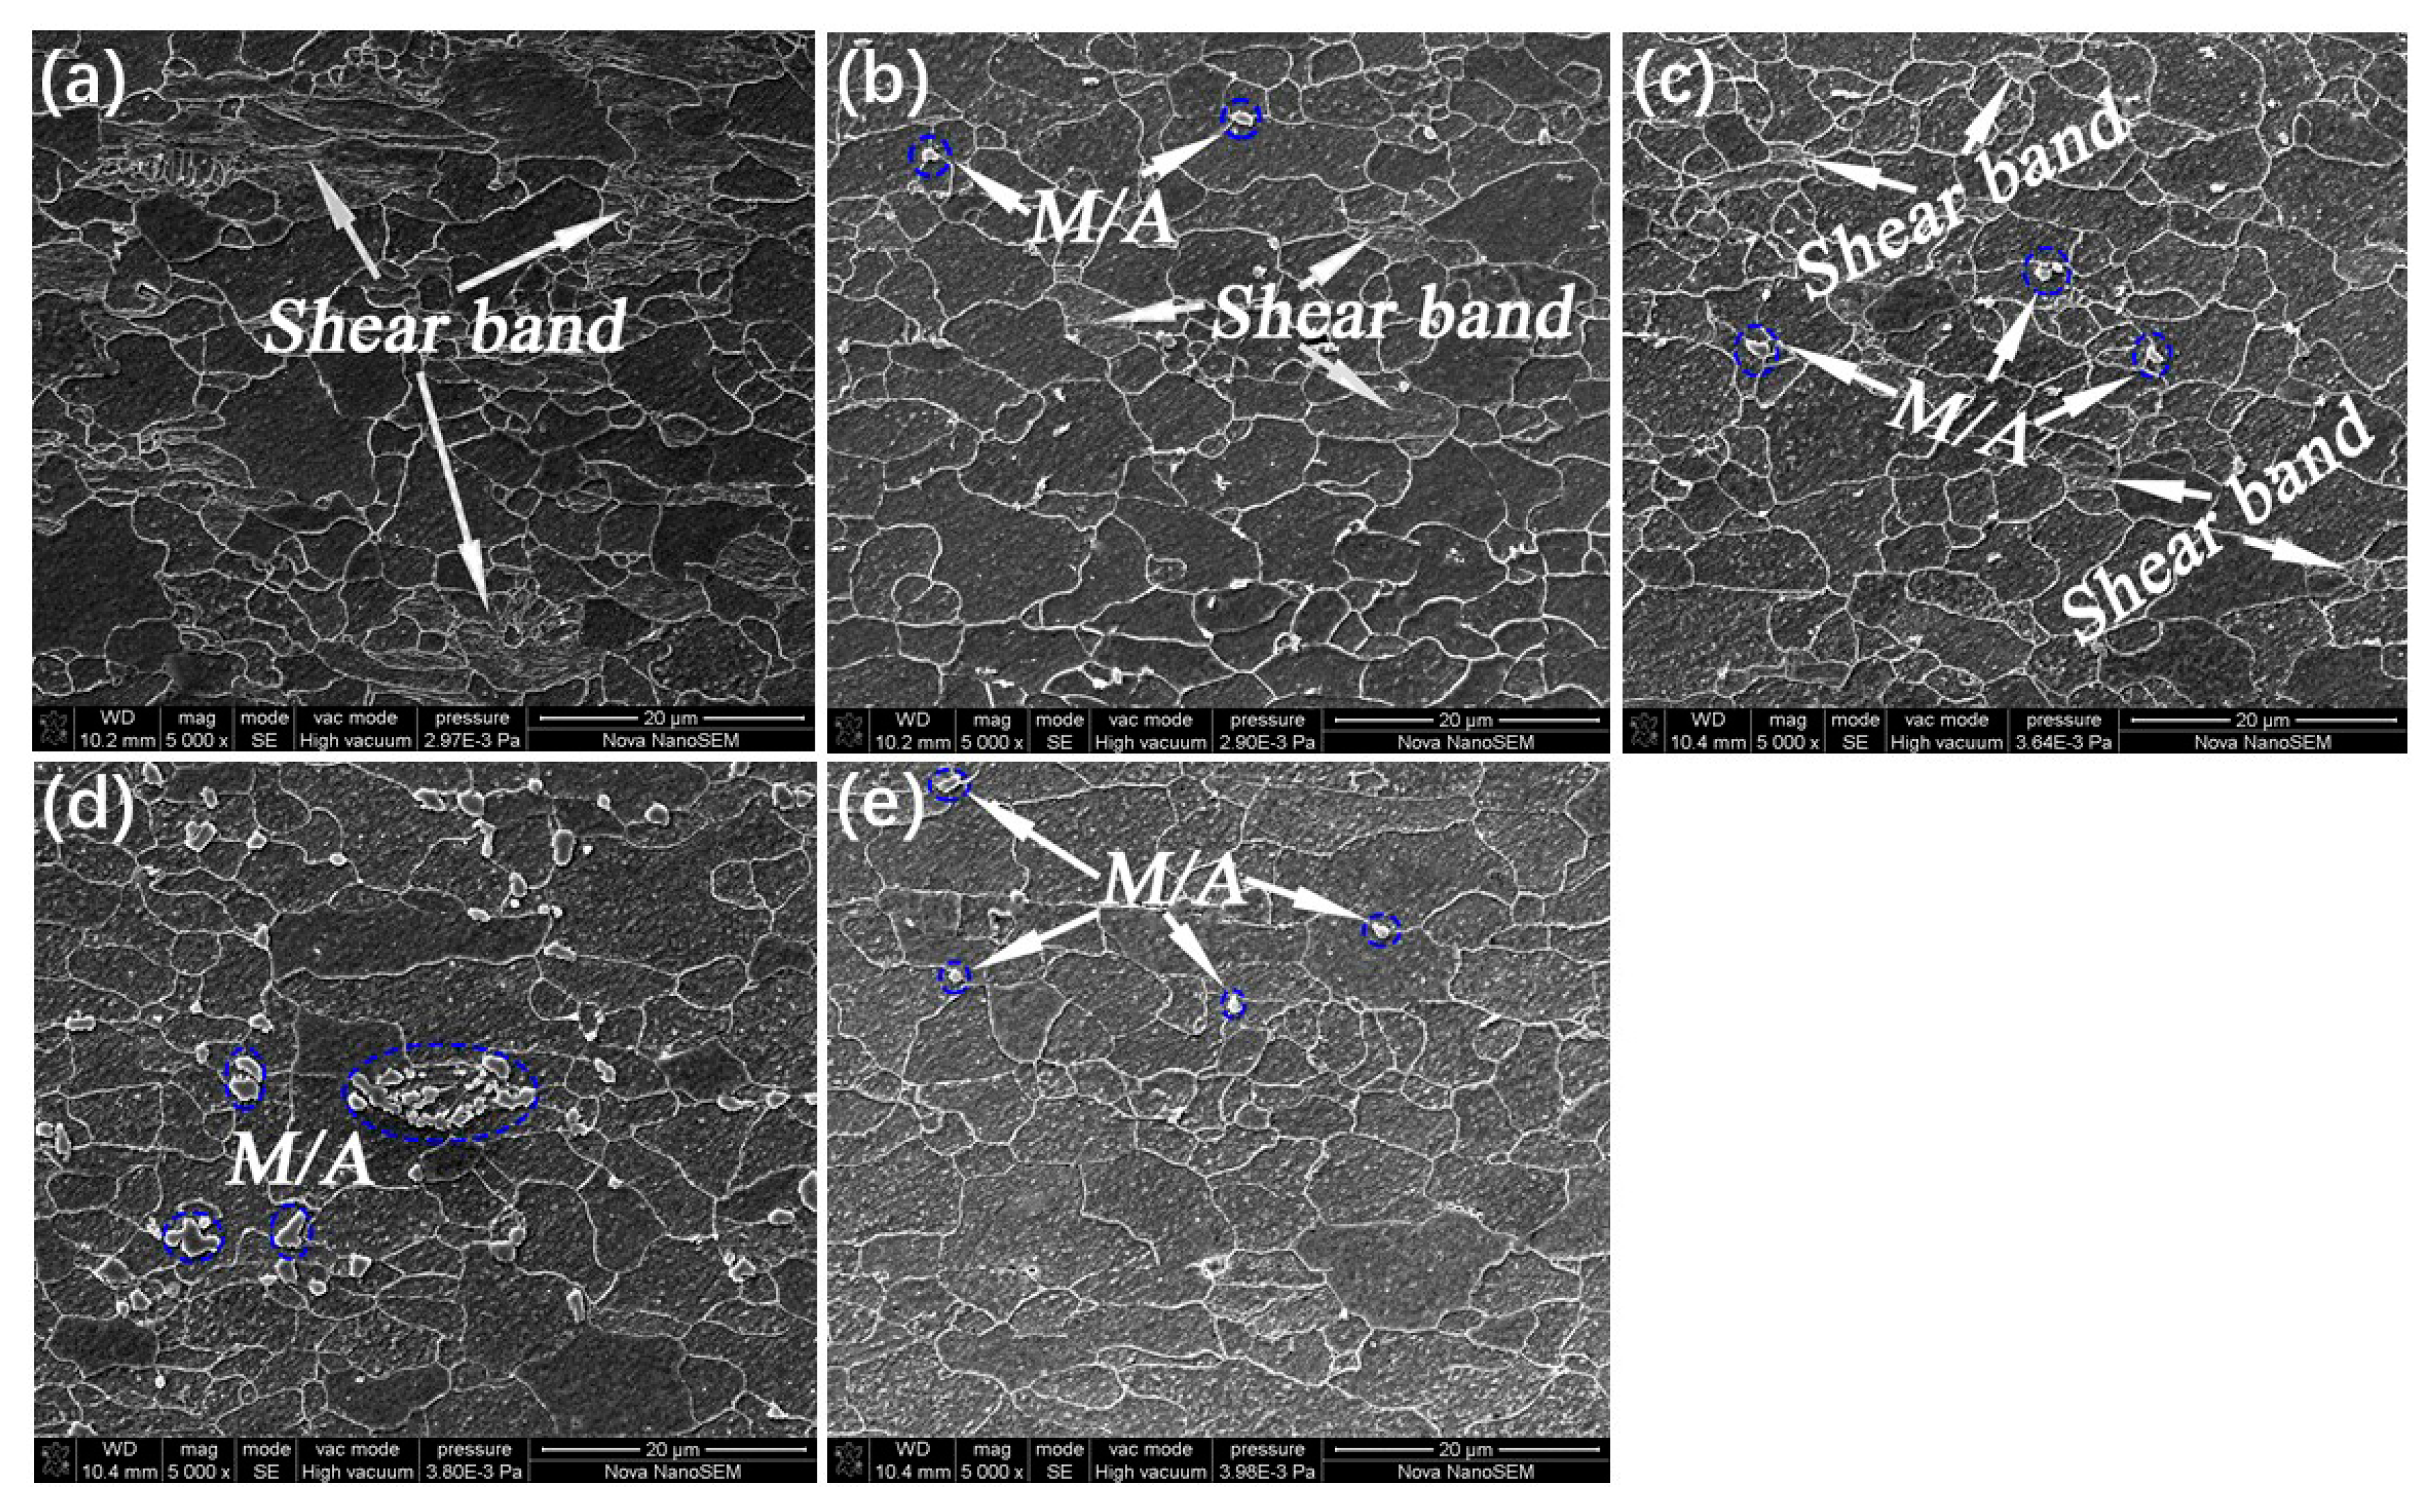
3.3.1. Microstructure

As only a very small fraction of carbon can be dissolved in the ferrite, a substantial fraction of carbon is available for stabilizing austenite in the low alloyed steel during inter-critical annealing [48,49,50]. During inter-critical annealing, a higher carbon content is obtained in the austenite and the carbon-rich austenite transforms into martensite during subsequent cooling [49]. The metallographic microstructures of the samples at different inter-critical annealing temperatures are shown in Figure 5. It can be seen from Figure 5 that there is basically no difference in microstructure among samples annealed at 850 °C and below except there is a little deformed ferrite in samples annealed at 820 °C and below. That is to say, when annealed at 820 °C and below, the samples are not completely recrystallized. The microstructures are all composed of predominant ferrite and carbide, among which is the result that stable chromium carbides are not completely dissolved due to the low inter-critical annealing [51]. Such a low degree of austenitizing results in little martensite as shown in Figure 5a–c. When the annealing temperature is increased to 880 °C, the ferrite is fully recrystallized and the carbide is completely dissolved for stabling austenite, resulting in a microstructure consisting of polygonal ferrite and island martensite. Island martensite having a higher carbon content is formed at the grain boundary between ferritic grains and/or at the triple-points. This indicates that the full potential for stabilizing the austenite has been unlocked at the employed annealing temperature (see Figure 5d). When the annealing temperature is further increased to 900 °C, the microstructure is the same as that of 880 °C, but the content of island martensite is largely reduced (see Figure 5e). This is attributed to the fact that at the high annealing temperature, the carbon content in austenite is not enough to stabilize it and form martensite during subsequent cooling.
Figure 6 presents SEM images of samples annealed at different temperatures, followed by salt bath quenching, which provide more details about microstructure evolution. As shown, at the annealing temperature of 790 °C, recrystallization of ferrite precedes the formation of austenite. There are a lot of non-recrystallized ferrites in the microstructure, which contain a lot of shear bands, as shown in Figure 6a. At the annealing temperature of 820 °C, recrystallization of ferrite and the formation of austenite proceed simultaneously. There are still non-recrystallized ferrites in the microstructure with a certain amount of shear bands, and a small amount of island martensite is formed, as shown in Figure 6b. When the annealing temperature is further raised to 850 °C, the recrystallization of ferrite is basically completed with only a small amount of non-recrystallized ferrite left in the microstructure, and the austenitizing process is slightly promoted as Figure 6c illustrates. As the annealing temperature is further increased to 880 °C, the recrystallization of ferrite and formation of austenite have been fully implemented, the ferrite grains grow up obviously with more island martensite as Figure 6d illustrates. The recrystallized grains grow further and the austenitizing process is more complete at the annealing temperature of 900 °C but the content of island martensite appears to be reduced, as shown in Figure 6e.

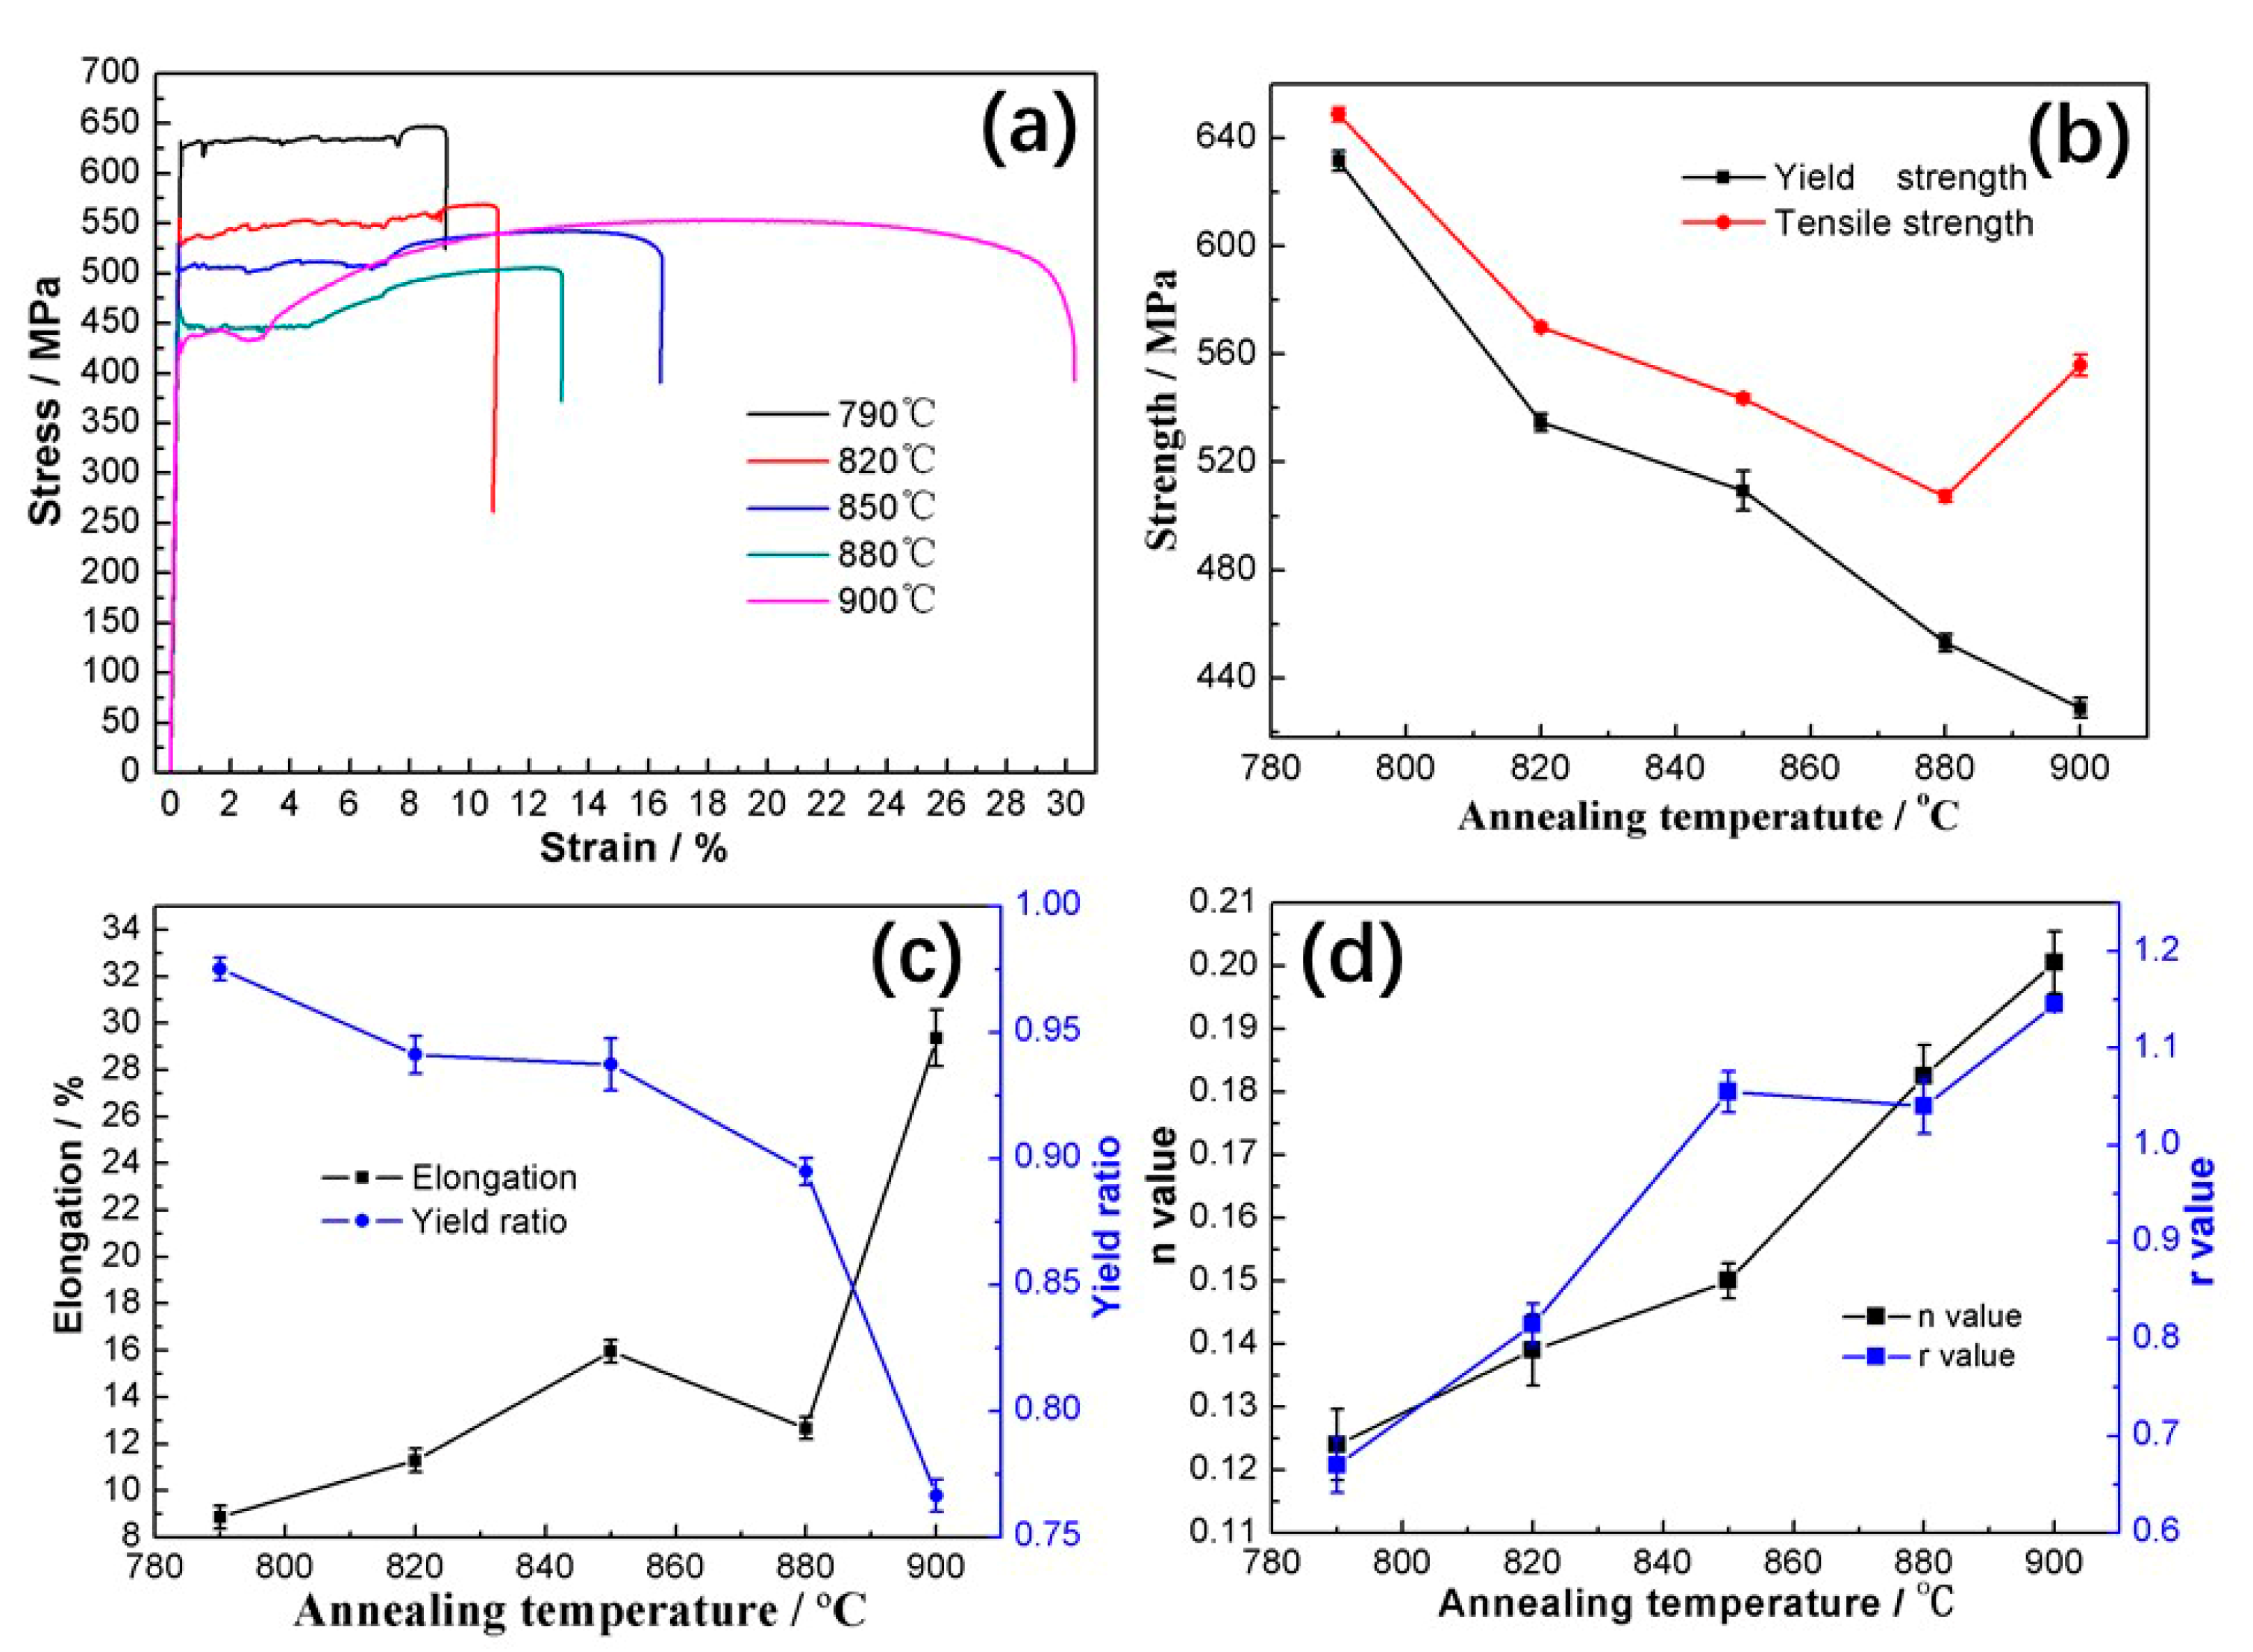
3.3.2. Mechanical Properties
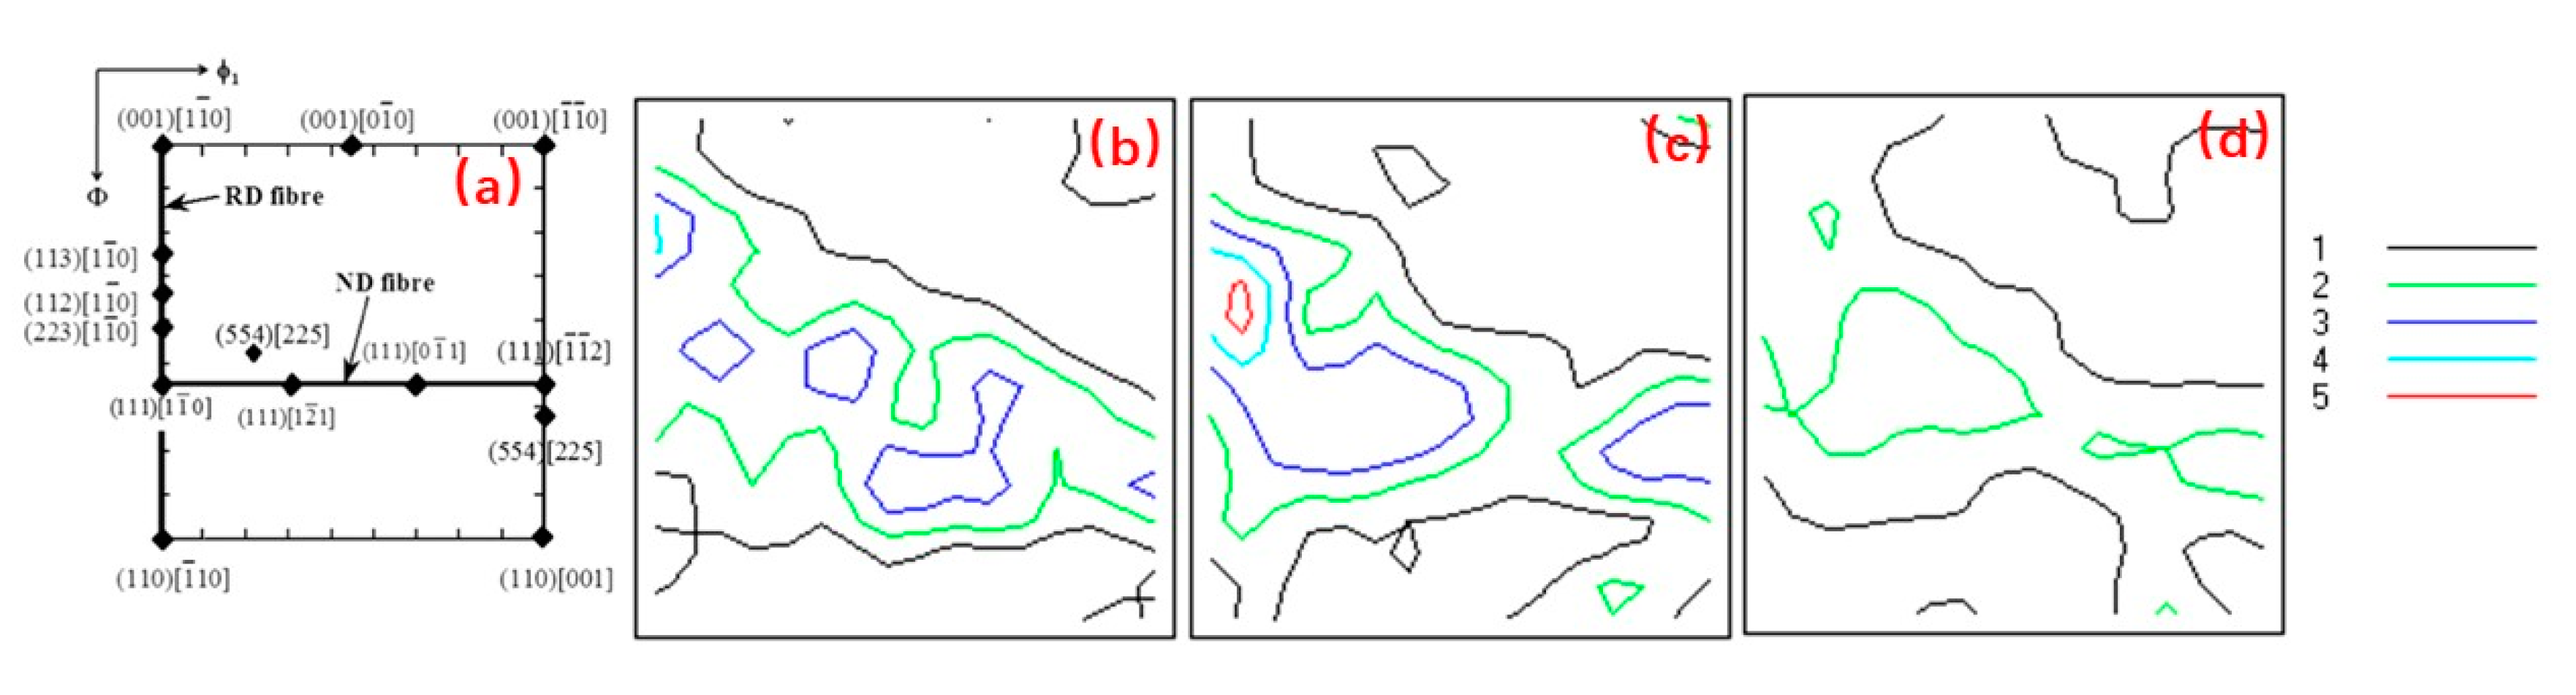
Mechanical properties including initial stress–strain curves, ultimate tensile strength, yield strength, elongation, yield ratio, strain hardening exponent (n value), and plastic strain ratio (r value) of the samples were determined, results of which are illustrated in Figure 7. For all the specimens, their yield strengths and yield ratios decrease with increasing the annealing temperature, while the ultimate tensile strength decreases with increasing annealing temperature up to 880 °C and then it rises. The elongation increases by 41.3% with increasing the annealing temperature up to 850 °C, then decreases by 20.6% at the annealing temperature of 880 °C, and finally increases rapidly. Strain hardening exponent (n value) rises rapidly with increasing the annealing temperature, which is in the range between 0.12 and 0.20. The plastic strain ratio (r value) increases quickly with increasing the annealing temperature up to 850 °C, then decreases by 1.4% at 880 °C, and finally increases again but slowly. The r value is in the range between 0.65 and 1.14. As mentioned earlier, when the sample is annealed at a lower temperature, its recrystallization process is incomplete, resulting in high strength, low elongation, low n value, and low r value. With increasing the annealing temperature, the recrystallization process and the dissolution of carbides become more and more complete, resulting in the decrease in strength but increase in elongation, n and r values. A large number of dissolved carbides can stabilize austenite which is supposed to transform to martensite during the following cooling process, resulting in slight decrease in elongation and r value [52,53]. As the annealing temperature increases to 900 °C, the stability of carbon-rich austenite decreases, thus reducing the content of martensite and leading to a consequent increase in elongation and r value.

3.3.3. Texture

Figure 8 displays the key BCC (body center cubic) texture components in the φ2 = 45° section of the Euler space and the calculated Orientation Distribution Function (ODF) at φ2 = 45° for different annealing temperatures [54,55]. The textures of the samples after annealing show alpha {uvw}<110> and gamma {111}<uvw> textures, which are typical for low carbon steels after cold rolling and annealing, and no significant difference in the texture morphology among the samples is observed in this case. The minor variations in the texture intensities come from statistical variations of the data. The texture of the sample annealed at 850 °C shows components with a maximum intensity of 4.0 mrd (multiples of random density) on the alpha fiber {uvw}<110> components and a maximum intensity of 3.0 mrd on the gamma fiber {111}<uvw> components, as Figure 8b illustrates. As the annealing temperature is increased to 880 °C, the texture is similar to the one at the annealing temperature of 850 °C with a maximum intensity of 5.0 mrd on the alpha fiber {uvw}<110> components and a maximum intensity of 3.0 mrd on the gamma fiber {111}<uvw> components, as shown in Figure 8c. Compared to the previous two annealing temperature, some variations in the texture intensities and the predominant components occur when the annealing temperature is further increased to 900 °C, which show that the alpha fiber {uvw}<110> components disappear and the gamma fiber {111}<uvw> components weaken as shown in Figure 8d. There are higher alpha fiber {uvw}<110> components at the annealing temperature of 880 °C, which may be related to martensitic transformation that produces a large number of dislocations due to the volumetric expansion [16]. However, there are no alpha fiber {uvw}<110> components at the annealing temperature of 900 °C, which may be related to the full recrystallization.

4. Discussion

4.1. Alloy Elements Diffusion

If cooling rate is slow after soaking at full austenitizing or the α + γ region high temperature, the alloy elements in the transformed ferrite will have enough time to diffuse to untransformed austenite domains and stabilize them, so that this part of austenite will finally transform into island martensite. However, if the cooling rate is high, there is no sufficient time for diffusion during the phase transformation process [56], so the original austenite will eventually transform into lath bainite as illustrated in Figure 3. It is a complex process combining recrystallization, carbide dissolution, and austenite transformation during inter-critical annealing [16]. Schematic illustrations of phase transformation during inter-critical annealing are presented in Figure 9. In the case of annealing at low temperatures, a large amount of carbide is not dissolved and only a small amount of austenite is formed, so the content of martensite in the microstructure after cooling is very small as shown in Figure 6b,c and Figure 9a. When the annealing temperature is moderate, the carbide dissolves and stabilizes the austenite, which transforms into martensite during the subsequent cooling process. A higher content of martensite can be consequently obtained as shown in Figure 6d and Figure 9b. At higher annealing temperatures, the increase in the austenite content reduces the content of alloying elements and lowers stability, leading to the decrease in the martensite content during the subsequent cooling process, as shown in Figure 6e and Figure 9c.

4.2. Ferrite Recrystallization and Growth

The recrystallization and grain growth of ferrite during annealing play an important role in affecting mechanical properties of the steel under study. In the case of incomplete recrystallization of ferrite, the sample will have high strength, high yield ratio, low elongation, low n value, and low r value, as shown in Figure 6a,b and Figure 7. When the recrystallization and grain growth of ferrite are fully developed, the sample will have low strength, low yield ratio, high elongation, high n value, and high r value, as Figure 6e and Figure 7 illustrate. Figure 10 shows the distribution of recrystallized grains, sub-structured grains, and deformed grains at higher annealing temperatures. When annealed at 850, 880, and 900 °C, the recrystallized grains are 85.92%, 93.10%, and 97.22%, respectively; while the deformed grains are 11.85%, 4.75%, and 1.50%, respectively; the sub-grains are 2.23%, 2.15%, and 1.28% respectively. This indicates that with an increase in the annealing temperature, the recrystallization process becomes gradually complete, corresponding to the variations in mechanical properties as shown in Figure 7 that the samples annealed at higher temperatures show higher n values and r values. Figure 11 illustrates the distributions of grain boundary misorientation angle for different annealing temperatures. One may see that the percentage of low-angle grain boundaries (LAGBs, 2–15°) decreases and that of high-angle grain boundaries (HAGBs, >15°) increases. There is a certain amount of recovery structure in the sample annealed at a lower temperature, while the recrystallization process is fully completed at a higher temperature, which further verifies the previous discussion.

4.3. Texture Evolution

Texture is an important parameter of steel sheet because it induces plastic anisotropy and appropriate texture can be beneficial to formability [57,58,59,60]. A convenient measure of anisotropy is the r value, which is the ratio of width strain to thickness strain, determined by a simple tensile test. Generally, a higher r value corresponds to a higher deep drawability [60]. A favorable texture for formability is one in which a high proportion of the grains are oriented with their {111} planes parallel to the sheet plane [61]. Other texture components are relatively unfavorable. Thus, to help the steel gain a higher deep drawing capability, one needs to develop the {111} texture components as strong as possible and eliminate or weaken other texture components to a maximum degree.
Texture can be induced by processes involving plastic deformation, e.g., rolling. In general, slip takes place on {110}, {112}, and {123} planes for BCC structure, with the first two as more predominant [62,63,64]. During rolling and deformation, the crystalline orientation aggregates around {001}<110>, then spreads to {112}<110> and {111}<110> along α fiber [62,65]. The internal stored energy with dislocations presented in the deformed grains of a cold-rolled steel provides the driving force for recrystallization at temperatures above the recrystallization temperature. It is commonly believed that the orientation dependence of a deformed structure is responsible for the development of certain texture components during the recrystallization process [57]. The stored energy of deformation structures increases in the sequence {001} < {112} < {111}, and the highest values of all are found in the small proportion of {011} oriented grains. Nucleation by sub-grain growth mechanisms within individual deformed grain should have the highest nucleation rate where the stored energy is the greatest, so that the {111} and {110} texture components are favored [57]. Figure 12 illustrates the nucleation rates of different oriented nuclei, corresponding to different texture components. As shown, the {111} component is the strongest, followed by {112} and {100}. A spread of random texture may be expected, along with a certain amount of {110} oriented grains.
Based on the above discussion, the production of α fiber components in Figure 8b is likely related to the shear bands in the microstructure, as shown in Figure 6c. However, the formation of α fiber components in Figure 8c is related to the dislocations produced during the formation of martensite. For BCC crystals, the slip usually occurs on {110} planes at medium temperatures. Since the martensitic transformation temperature of the steel under study is close to 500 °C, the local deformation from the transformation-induced volumetric dilation would lead to the increase in the {110} texture density. The reason for the weaker γ fiber components shown in Figure 8d should be related to the two transformations, α to γ and γ to α. The ratio of {111} component to other orientation components determines the r value of the material. The higher the ratio, the higher the r value. The results of orientation analysis shown in Figure 8 correspond to the variations in r value illustrated in Figure 7d.

5. Conclusions

Effects of heat treatment on microstructure, texture, and mechanical properties of a designed Fe-Si-Cr-Mo-C deep drawing dual-phase steel were investigated. The following conclusions are drawn from the study.
(1) At high annealing temperatures, ferrite and island martensite are formed when the cooling rate is slow. With increasing the cooling rate, pearlite and bainite are gradually formed while the island martensite gradually disappears. As the cooling rate reaches a certain level, i.e., 15 °C/s, the ferrite also disappears, and the microstructure is basically dominated by lower bainite.
(2) When annealed at temperatures between 780 and 850 °C, recrystallization of ferrite cannot be fully implemented, and shear bands exist in the microstructure. The lower the annealing temperature, the more shear bands in the microstructure. However, when annealed at temperatures between 880 and 900 °C, the recrystallization process is basically completed and there are only a few non-recrystallized grains in the microstructure. When annealed at 820 °C, a small amount of fine island martensite begins to form; with increasing the annealing temperature, the content of island martensite increases; when annealed at 880 °C, the content of island martensite reaches the summit and then decreases when annealed at 900 °C.
(3) With increasing the annealing temperature, the yield strength of the steel decreases. However, the tensile strength first decreases and then increases, leaving a trough at 850 °C. The elongation increases with increasing the annealing temperature, showing a trough at 850 °C and reaches a maximum of 30.1% at 900 °C; but the yield ratio decreases against the annealing temperature. The values of n and r increase with increasing the annealing temperature, and the range of n value is 0.12–0.20. When annealed above 850 °C, the r value is greater than 1.0, and reaches the maximum of 1.15 at 900 °C.
(4) When annealed at 850–900 °C, the density of α-oriented components increases from 4.0 to 5.0 mrd first, then decreases to 1.0 mrd. The density of γ-oriented components decreases from 3.0 to 2.0 mrd. The corresponding ratio of γ-oriented components to α-oriented components decreases first and then increases. Within the current temperature range for annealing, the recrystallization grain fraction of the steel increases from 85.92% to 97.22%, while the proportion of high-angle grain boundaries increases significantly.

Author Contributions

Conceptualization, H.P., X.S., Y.L. and H.W.; Data curation, H.P., X.S., J.C., Y.T., H.W. and Y.X.; Formal analysis, H.P., X.S., J.C. and Y.T.; Fuding acquisition, H.P. and Y.T.; Investigation, H.P. and J.C.; Methodology, H.P., H.W. and Z.W.; Project administration, X.S. and D.L.; Resources, Y.L., H.Z., Z.W. and Y.X.; Software, Z.W.; Supervision, D.L.; Validation, X.S., D.L. and H.Z.; Visualization, H.P. and D.L.; Writing-original draft, H.P.; Writing-review & editing, D.L. All authors have read and agreed to the published version of the manuscript.

Funding

This research was funded by the National Natural Science Foundation of China, grant number 51774006 and NSFC-Iron and Steel Joint Fund of the National Natural Science Foundation of China, grant number U1860105; the major special projects of Anhui Province, grant number 18030901085 and the Liaoning Provincial Natural Science Foundation of China, grant number 2019-KF-25-01.

Conflicts of Interest

The authors declare no conflict of interest.

References

  1. Vaidya, B.; Mouftah, H.T. Connected autonomous electric vehicles as enablers for low-carbon future. In Research Trends and Challenges in Smart Grids; Vaccaro, A., Ed.; IntechOpen: London, UK, 2020; pp. 1–15. [Google Scholar] [CrossRef] [Green Version]
  2. Gusikhin, O.; Filev, D.; Rychtyckyj, N. Intelligent vehicle systems: Applications and new trends. In Informatics in Control, Automation and Robotics; Cetto, J., Ed.; Springer: Berlin/Heidelberg, Germany, 2008; pp. 3–14. [Google Scholar] [CrossRef]
  3. Cao, Y.; You, J.; Shi, Y.; Hu, W. The obstacles of China’s intelligent automobile manufacturing industry development. Chin. Manag. Stud. 2020, 14, 159–183. [Google Scholar] [CrossRef]
  4. Yao, M.; Liu, H.; Feng, X. The development of low-carbon vehicles in China. Energy Policy 2011, 39, 5457–5464. [Google Scholar] [CrossRef]
  5. Behzad, S. The role of the automobile industry in the economy of developed countries. Int. Robot. Autom. J. 2018, 4, 1. [Google Scholar] [CrossRef] [Green Version]
  6. Miglani, S. The Growth of the Indian Automobile Industry: Analysis of the Roles of Government Policy and Other Enabling Factors. Innovation, Economic Development, and Intellectual Property in India and China, ARCIALA Series on Intellect; Liu, K.C., Racherla, U., Eds.; Springer: Singapore, 2019; pp. 439–463. [Google Scholar] [CrossRef] [Green Version]
  7. Patterson, W.C. Technological trends in the automobile industry and their impact on aluminum usage. Technol. Forecast. Soc. Chang. 1980, 18, 205–216. [Google Scholar] [CrossRef]
  8. Zheng, J.; Yu, R.; Liu, Y.; Zou, Y.; Zhao, D. The technological progress of the fuel consumption rate for passenger vehicles in China: 2009–2016. Energies 2019, 12, 2384. [Google Scholar] [CrossRef] [Green Version]
  9. Koffler, C.; Rohde-Brandenburger, K. On the calculation of fuel savings through lightweight design in automotive life cycle assessments. Int. J. Life Cycle Assess. 2009, 15, 128–135. [Google Scholar] [CrossRef]
  10. Hirsch, J.; Hirsch, J. Recent development in aluminium for automotive applications. Trans. Nonferrous Met. Soc. China 2014, 24, 1995–2002. [Google Scholar] [CrossRef]
  11. Mayyas, A.T.; Mayyas, A.; Qattawi, A.; Omar, M. Sustainable lightweight vehicle design: A case study of eco-material selection for body-in-white. Int. J. Sustain. Manuf. 2012, 2, 317. [Google Scholar] [CrossRef]
  12. Witik, R.A.; Payet, J.; Michaud, V.; Ludwig, C.; Månson, J.-A.E. Assessing the life cycle costs and environmental performance of lightweight materials in automobile applications. Compos. Part A Appl. Sci. Manuf. 2011, 42, 1694–1709. [Google Scholar] [CrossRef]
  13. Safari, H.; Nahvi, H.; Esfahanian, M. Improving automotive crashworthiness using advanced high strength steels. Int. J. Crashworthiness 2017, 23, 645–659. [Google Scholar] [CrossRef]
  14. Kang, Y.L. Lightweight vehicle, advanced high strength steel and energy-saving and emission reduction. Iron Steel 2008, 43, 1–7. [Google Scholar] [CrossRef]
  15. Lesch, C.; Kwiaton, N.; Klose, F.B. Advanced High Strength Steels (AHSS) for automotive applications−Tailored properties by smart microstructural adjustments. Steel Res. Int. 2017, 88, 1700210. [Google Scholar] [CrossRef]
  16. Tasan, C.; Diehl, M.; Yan, D.; Bechtold, M.; Roters, F.; Schemmann, L.; Zheng, C.; Peranio, N.; Ponge, D.; Koyama, M.; et al. An overview of dual-phase steels: Advances in microstructure-oriented processing and micromechanically guided design. Annu. Rev. Mater. Res. 2015, 45, 391–431. [Google Scholar] [CrossRef]
  17. Belde, M.; Springer, H.; Inden, G.; Raabe, D. Multiphase microstructures via confined precipitation and dissolution of vessel phases: Example of austenite in martensitic steel. Acta Mater. 2015, 86, 1–14. [Google Scholar] [CrossRef]
  18. Ashrafi, H.; Shamanian, M.; Emadi, R.; Sarmadi, M.A. Comparison of microstructure and tensile properties of dual phase steel welded using friction stir welding and gas tungsten arc welding. Steel Res. Int. 2018, 89. [Google Scholar] [CrossRef]
  19. Cheng, G.; Choi, K.S.; Hu, X.; Sun, X. Predicting deformation limits of dual-phase steels under complex loading paths. JOM 2017, 69, 1046–1051. [Google Scholar] [CrossRef]
  20. Sun, S.; Pugh, M. Properties of thermomechanically processed dual-phase steels containing fibrous martensite. Mater. Sci. Eng. A 2002, 335, 298–308. [Google Scholar] [CrossRef]
  21. Thomser, C.; Uthaisangsuk, V.; Bleck, W. Influence of martensite distribution on the mechanical properties of dual phase steels: Experiments and simulation. Steel Res. Int. 2008, 80, 582–587. [Google Scholar] [CrossRef]
  22. Oliver, S.; Jones, T.B.; Fourlaris, G. Dual phase versus TRIP strip steels: Comparison of dynamic properties for automotive crash performance. Mater. Sci. Technol. 2007, 23, 423–431. [Google Scholar] [CrossRef]
  23. Embury, J.D.; Duncan, J.L. Formability of dual-phase steels. JOM 1982, 34, 24–29. [Google Scholar] [CrossRef]
  24. Yan, B.; Laurin, K.; Xu, K.; Sriram, S.; Huang, M.; Chintamani, J.; Lalam, S. A new dual phase steel for automotive body panels. SAE Tech. Pap. Ser. 2003, 112, 228–237. [Google Scholar] [CrossRef]
  25. Bouaziz, O.; Zurob, H.; Huang, M. Driving force and logic of development of advanced high strength steels for automotive applications. Steel Res. Int. 2013, 84, 937–947. [Google Scholar] [CrossRef]
  26. Gündüz, S. Effect of chemical composition, martensite volume fraction and tempering on tensile behaviour of dual phase steels. Mater. Lett. 2009, 63, 2381–2383. [Google Scholar] [CrossRef]
  27. Ghaheri, A.; Shafyei, A.; Honarmand, M. Effects of inter-critical temperatures on martensite morphology, volume fraction and mechanical properties of dual-phase steels obtained from direct and continuous annealing cycles. Mater. Des. 2014, 62, 305–319. [Google Scholar] [CrossRef]
  28. Bezobrazov, Y.; Naumov, A.A.; Kolbasnikov, N. High strength dual-phase steel structure evolution during hot rolling. In Proceedings of the Materials Science and Technology (MS&T) Conference, Pittsburgh, PA, USA, 7–11 October 2012; Available online: https://www.researchgate.net/publication/282845941 (accessed on 20 November 2012).
  29. Salehi, A.R.; Serajzadeh, S.; Taheri, A.K. A study on the microstructural changes in hot rolling of dual-phase steels. J. Mater. Sci. 2006, 41, 1917–1925. [Google Scholar] [CrossRef]
  30. Rocha, R.; Melo, T.; Pereloma, E.; Santos, D. Microstructural evolution at the initial stages of continuous annealing of cold rolled dual-phase steel. Mater. Sci. Eng. A 2005, 391, 296–304. [Google Scholar] [CrossRef]
  31. Liang, X.; Li, J.; Peng, Y. Effect of water quench process on mechanical properties of cold rolled dual phase steel microalloyed with niobium. Mater. Lett. 2008, 62, 327–329. [Google Scholar] [CrossRef]
  32. Kuang, S.; Liu, R.-D.; Kang, Y.-L.; Yu, H. Effect of continuous annealing parameters on the mechanical properties and microstructures of a cold rolled dual phase steel. Int. J. Miner. Met. Mater. 2009, 16, 159–164. [Google Scholar] [CrossRef]
  33. Hai-Rong, G.; Zheng-Zhi, Z.; Jie-Yun, Y.; Zhi-Gang, W.; Ai-Min, Z. Texture evolution of high-strength deep-drawing dual-phase steels. Mater. Res. Innov. 2015, 19, S5–S631. [Google Scholar] [CrossRef]
  34. Ye, J.Y.; Zhao, Z.Z.; Wang, Z.G.; Zhao, A.M.; Chen, J.J. Microstructures, mechanical properties and textures of deep drawing dual-phase steel. Adv. Mater. Res. 2012, 535, 670–673. [Google Scholar] [CrossRef]
  35. Zhang, Y.; Yuan, Q.; Ye, J.; Weng, X.; Wang, Z. Effect of cold rolling reduction on microstructure, mechanical properties, and texture of deep drawing dual-phase (DP) steel. Mater. Res. Express 2019, 6, 096530. [Google Scholar] [CrossRef]
  36. Wang, Z.-G.; Zhao, A.; Zhao, Z.-Z.; Ye, J.-Y.; Chen, J.-J.; He, J.-G. Precipitation behavior and textural evolution of cold-rolled high strength deep drawing dual-phase steels. J. Iron Steel Res. Int. 2013, 20, 61–68. [Google Scholar] [CrossRef]
  37. Yuan, Q.; Wang, Z.; Zhang, Y.; Ye, J.; Huang, Y.; Huang, A. Effect of warm rolling temperature on the microstructure and texture of microcarbon dual-phase (DP) steel. Metals 2020, 10, 566. [Google Scholar] [CrossRef]
  38. Kong, Z.; Zhang, J.; Li, H.; Kong, N. Deep drawing and bulging forming limit of dual-phase steel under different mechanical properties. Int. J. Adv. Manuf. Technol. 2018, 97, 2111–2124. [Google Scholar] [CrossRef]
  39. Almojil, M.A. Deformation and Recrystallisation in Low Carbon Steels; The University of Manchester: Manchester, UK, 2010; pp. 49–50. [Google Scholar]
  40. Zhao, J.; Jiang, Z. Thermomechanical processing of advanced high strength steels. Prog. Mater. Sci. 2018, 94, 174–242. [Google Scholar] [CrossRef]
  41. Pan, H.; Cao, J.; Fu, B.; Liu, W.; Shen, X.; Yan, J.; Dai, Y.; Wan, Y.; Wang, H. An investigation on microstructure evolution and mechanical properties of cryogenic steel rebars under different cooling conditions. Mater. Res. Express 2019, 6, 106592. [Google Scholar] [CrossRef]
  42. Uranga, P.; Shang, C.-J.; Senuma, T.; Yang, J.-R.; Guo, A.-M.; Mohrbacher, H. Molybdenum alloying in high-performance flat-rolled steel grades. Adv. Manuf. 2020, 8, 15–34. [Google Scholar] [CrossRef] [Green Version]
  43. Jia, X.; Zuo, X.; Chen, N.; Huang, J.; Tang, X.; Rong, Y. Microstructure and properties of Q235 steel treated by novel Q-P-T process. Acta Met. Sin. 2013, 49, 35. [Google Scholar] [CrossRef]
  44. Kozeschnik, E.; Bhadeshia, H.K.D.H. Influence of silicon on cementite precipitation in steels. Mater. Sci. Technol. 2008, 24, 343–347. [Google Scholar] [CrossRef]
  45. Tenaglia, N.E.; Massone, J.M.; Boeri, R.E.; Speer, J.G. Effect of microsegregation on carbide-free bainitic transformation in a high-silicon cast steel. Mater. Sci. Technol. 2020, 36, 690–698. [Google Scholar] [CrossRef]
  46. Timokhina, I.; Liss, K.-D.; Raabe, D.; Rakha, K.; Beladi, H.; Xiong, X.Y.; Hodgson, P.D. Growth of bainitic ferrite and carbon partitioning during the early stages of bainite transformation in a 2 mass% silicon steel studied by in situ neutron diffraction, TEM and APT. J. Appl. Crystallogr. 2016, 49, 399–414. [Google Scholar] [CrossRef] [Green Version]
  47. Chen, J.-P.; Kang, Y.-L. Interstitial solution carbon concentration and defects of Ti + Nb ULC-BH steel by internal friction and positron annihilation methods. J. Iron Steel Res. Int. 2014, 21, 91–97. [Google Scholar] [CrossRef]
  48. Wolf, L.O.; Nuernberger, F.; Rodman, D.; Maier, H.J. 1-Step “quenching and partitioning” of the press-hardening steel 22MnB5. Steel Res. Int. 2016, 88, 1–14. [Google Scholar] [CrossRef]
  49. Speer, J.G.; Edmonds, D.V.; Rizzo, F.; Matlock, D.K. The “quenching and partitioning” process: Background and recent progress. Mater. Res. 2005, 8. [Google Scholar] [CrossRef] [Green Version]
  50. Edmonds, D.; He, K.; Miller, M.K.; Rizzo, F.; Clarke, A.; Matlock, D.K.; Speer, J.G. Microstructural features of ‘quenching and partitioning’: A new martensitic steel heat treatment. Mater. Sci. Forum 2007, 539, 4819–4825. [Google Scholar] [CrossRef]
  51. Wolf, L.O.; Nuernberger, F.; Rodman, D.; Maier, H.J. The effect of intercritical annealing on the microstructure and mechanical properties of ferritic-martensitic two-phase steels. Steel Res. Int. 2016, 88, 1600107. [Google Scholar] [CrossRef]
  52. Escobar, D.P.; Dafé, S.; Santos, D.B. Martensite reversion and texture formation in 17Mn-0.06C TRIP/TWIP steel after hot cold rolling and annealing. J. Mater. Res. Technol. 2015, 4, 162–170. [Google Scholar] [CrossRef] [Green Version]
  53. Ma, D.-D.; Yang, P.; Gu, X.-F.; Onuki, Y.; Sato, S. In-situ neutron diffraction investigation on the martensite transformation, texture evolution and martensite reversion in high manganese TRIP steel. Mater. Charact. 2020, 163, 110244. [Google Scholar] [CrossRef]
  54. Cerda, F.M.C.; Goulas, C.; Sabirov, I.; Papaefthymiou, S.; Monsalve, A.; Petrov, R. Microstructure, texture and mechanical properties in a low carbon steel after ultrafast heating. Mater. Sci. Eng. A 2016, 672, 108–120. [Google Scholar] [CrossRef] [Green Version]
  55. Hillert, M. On the theory of normal and abnormal grain growth. Acta Met. 1965, 13, 227–238. [Google Scholar] [CrossRef]
  56. Ali, M.; Porter, D.; Kömi, J.; Eissa, M.; El Faramawy, H.; Mattar, T. Effect of cooling rate and composition on microstructure and mechanical properties of ultrahigh-strength steels. J. Iron Steel Res. Int. 2019, 26, 1350–1365. [Google Scholar] [CrossRef] [Green Version]
  57. Hutchinson, W.B. Development and control of annealing textures in low-carbon steels. Int. Met. Rev. 1984, 29, 25–42. [Google Scholar] [CrossRef]
  58. Sztwiertnia, K. Recrystallization; InTech Publish: Rijeka, Croatia, 2012; p. 137. [Google Scholar]
  59. Vaish, A.K.; Humane, M.M.; Mahato, B.; Kumar, B.R. Effect of texture formation on formability of cold rolled and annealed extra deep drawing and interstitial free steel sheets. J. Met. Mater. Sci. 2003, 45, 1–10. [Google Scholar]
  60. Donachie, M.J.; Donachie, S.J. Superalloys: A Technical Guide, 2nd ed.; ASM International: Materials Park, OH, USA, 2002; p. 108. [Google Scholar]
  61. Masoumi, M.; Echeverri, E.A.A.; Silva, C.C.; Aguiar, W.M.; De Abreu, H.F.G. Improvement of formability and tensile mechanical properties of SAE 970X steel by controlled rolling process. J. Mater. Res. Technol. 2019, 8, 1353–1365. [Google Scholar] [CrossRef]
  62. Jia, M.; Lu, Y.P.; Lingfeng, X.; Song, Y.P. The influence of friction on the texture formation of a IF steel during hot rolling in the ferrite region. Steel Res. Int. 2013, 84, 761–765. [Google Scholar] [CrossRef]
  63. Mao, W.; Zhang, X. Quantitative Texture Analysis of Crystalline Materials; Metall. Ind. Press: Beijing, China, 1995. [Google Scholar]
  64. Pan, H.; Wan, Y.; Wang, H.; Shen, X.; Fu, B.; Li, D.Y.; Dai, Y.; Yan, J. An investigation of friction coefficient on microstructure and texture evolution of interstitial-free steel during warm rolling and subsequent annealing. Crystals 2019, 9, 565. [Google Scholar] [CrossRef] [Green Version]
  65. Von Schlippenbach, U.; Emren, F.; Lucke, K. Investigation of the development of the cold rolling texture in deep drawing steels by ODF-analysis. Acta Met. 1986, 34, 1289–1301. [Google Scholar] [CrossRef]
Figure 1. Schematic illustration of annealing process.
Crystals 10 00777 g001
Figure 2. Dilatation curve of a sample heated at 10 °C/s (a) and an equilibrium phase diagram calculated by Thermo-calc software (b).
Crystals 10 00777 g002
Figure 3. SEM micrographs of samples cooled at (a) 0.5, (b) 1, (c) 3, (d) 5, (e) 10, (f) 15, (g) 20, and (h) 30 °C/s, respectively. M/A: martensite-austenite island; P: pearlite; B: bainite.
Crystals 10 00777 g003
Figure 4. Hardness versus the cooling rate.
Crystals 10 00777 g004
Figure 5. Optical micrographs of specimens annealed at (a) 790, (b) 820, (c) 850, (d) 880, and (e) 900 °C, respectively.
Crystals 10 00777 g005
Figure 6. SEM micrographs of specimens annealed at (a) 790, (b) 820, (c) 850, (d) 880, and (e) 900 °C, respectively. M/A: martensite-austenite island.
Crystals 10 00777 g006
Figure 7. Mechanical properties of specimens annealed at different temperatures. (a) Stress–strain curves; (b) relation between strength and temperature; (c) relationship between elongation, yield ratio, and temperature; (d) relationship between n value, r value and temperature.
Crystals 10 00777 g007
Figure 8. φ2 = 45° sections of Orientation Distribution Function (ODF) at surface layers in the specimens annealed at different temperatures. (a) Main BCC texture components shown in φ2 = 45° section of the Euler space; (b) 850 °C; (c) 880 °C; (d) 900 °C.
Crystals 10 00777 g008
Figure 9. Schematic illustration of phase transformation during inter-critical annealing. (a) Low annealing temperature; (b) moderate annealing temperature; (c) high annealing temperature. (The color in the figure represents the content of alloy elements in austenite schematically.)
Crystals 10 00777 g009
Figure 10. Electron backscatter diffraction (EBSD) images showing recrystallization fraction of the heat-treated sample versus the inter-critical temperature. (a) 850, (b) 880, and (c) 900 °C. Blue areas represent recrystallized grains, yellow areas are sub-structures, and red areas represent deformed structures.
Crystals 10 00777 g010
Figure 11. Grain boundary misorientation distribution histograms of samples annealed at different temperatures. (a) 850, (b) 880, and (c) 900 °C.
Crystals 10 00777 g011
Figure 12. Schematic sequence of nucleation rates of recrystallized grains during annealing of a cold rolled steel [57].
Crystals 10 00777 g012
Table 1. Chemical composition of the experimental steels (mass fraction, %).
CSiMnNbCrMoAlPSN
0.0260.981.090.0410.150.500.080.0070.003≤60 ppm

