Enhancing Protein Crystallization under a Magnetic Field


1
Quantum Beam Science Division, Korea Atomic Energy Research Institute, Daejeon 34057, Korea
2
Department of Life Sciences, Korea University, Seoul 02841, Korea
3
Nuclear Training and Education Center, Korea Atomic Energy Research Institute, Daejeon 34057, Korea
*
Authors to whom correspondence should be addressed.
Crystals 2020, 10(9), 821; https://0-doi-org.brum.beds.ac.uk/10.3390/cryst10090821
Submission received: 18 August 2020
/
Revised: 15 September 2020
/
Accepted: 15 September 2020
/
Published: 16 September 2020
(This article belongs to the Special Issue Protein Crystallization under the Presence of an Electric Field)
Abstract
:High-quality crystals are essential to ensure high-resolution structural information. Protein crystals are controlled by many factors, such as pH, temperature, and the ion concentration of crystalline solutions. We previously reported the development of a device dedicated to protein crystallization. In the current study, we have further modified and improved our device. Exposure to external magnetic field leads to alignment of the crystal toward a preferred direction depending on the magnetization energy. Each material has different magnetic susceptibilities depending on the individual direction of their unit crystal cells. One of the strategies to acquire a large crystal entails controlling the nucleation rate. Furthermore, exposure of a crystal to a magnetic field may lead to new morphologies by affecting the crystal volume, shape, and quality.
1. Introduction
Many biological systems are composed of neighboring atoms bonded by various hydrogen atoms [1,2]. It is also believed that hydrogen atoms play a crucial role in biological functions, such as enzymatic mechanisms [3,4]. Therefore, the precise localization of the hydrogen atoms in biological problems is more important than in other systems, for example, in the case of solid-state physics [1,5,6]. Until now, the X-ray diffraction technique has been used as a conventional method to resolve unknown crystal structures with easy access [7,8]. However, it also has limitations due to the interactions of the X-rays with electrons of the atoms in the crystal structure. Thus, it is impossible to localize the relative position of the light atoms, such as H or Li, in the presence of a relative heavy atom in a crystal structure. Thus, several sophisticated tools have been developed to delineate the location of the hydrogen atoms and, if possible, to distinguish isotopes such as hydrogen and deuterium [9,10].
Among others, neutrons can be used to determine the relative position of a hydrogen atom in a crystal structure in the presence of a relatively heavy atom [11,12,13]. Although the advantages of neutrons outweigh the benefits of the conventional X-ray technique, a relatively large volume of a sample is required due to the weak interaction between the neutrons and nuclei in the crystal structure. However, obtaining a large volume of a biological sample, for example, a protein crystal, is a non-trivial task. Therefore, many efforts have been made to increase the sample size and also to decrease the time required. Towards this end, many methods have been proposed, including the grid screen and incomplete factorial approaches [14,15,16], controlling the physical parameters such as the temperature [17,18], hydrodynamic field [19], electric field [20,21,22], magnetic field [23,24,25,26,27,28,29,30,31,32,33,34,35,36,37,38], and electromagnetic field [27,39,40]
Despite various trials, obtaining a single crystalline outcome remains a challenge for some proteins owing to their low crystallization ability that prevents screening. In general, experimental parameters such as temperature, pH, and pressure, which are thought to be easily accessible, are selected. A few results are reported as successful [6,17,18,41,42,43,44]. Although temperature and pH are relatively easy to control, the control of pressure requires the design of a special device, which is complex and expensive [45,46].
A possible alternative is a magnetic field. When a crystal is exposed to a magnetic field, the crystal tends to align in the direction of the lowest magnetization energy. Each material has different magnetic susceptibilities depending on the individual direction of the unit crystal cells [19]. A large crystal can be obtained by controlling the nucleation rate. The crystal’s volume, shape, and quality also can be affected when it is exposed to a magnetic field. In our and others’ previous works [28,32,34,35,36,37,38,47], as a part of these efforts, the so-called magnetic compensation was developed using biological samples and successful results have been reported. The device is composed of permanent magnets available commercially and protein crystals larger than 1.0 mm3 were obtained. In this work, we report new results using a newly modified and improved device, and also demonstrate the excellent quality of the protein crystals obtained via X-ray diffraction.
2. Materials and Methods
2.1. Magnetic Device Design
Neodymium magnets were used to determine the effect of the magnetic field on the crystal growth rate, size, and quality. Although we have a magnetic device, for which we designed either a 24-well or a 72-well plate to adjust the sample plate to the magnetic device size, we designed a new device using a 96-well plate for convenience (see Figure 1 and Figure 2).
We also changed the shape of the permanent magnet from round to a rod type. Based on these modifications, we applied a vertical magnetic field to a solution containing crystals. The magnetic field strength was measured using a Gauss Meter and the measured value was 200 mT (see Figure 3). Hanging/sitting drop plates with 96 wells containing a protein and precipitant solution were inserted into the device located in an incubator. The device was made compact enough for use in an incubator and easy temperature control in the range of 4 to 80 °C (± 0.2 °C) during the sample growth. Few days later, microcrystals were observed.
2.2. Cloning, Expression, Purification, and Crystallization
2.2.1. Hen Egg-White Lysozyme (HEWL)
Protein solutions were prepared from hen egg-white lysozyme (Sigma, L6876) powder dissolved in a 50 mM sodium acetate buffer. Four different protein concentrations (10, 20, 30, and 40 mg/mL) and three different pH values (5.0, 5.5, and 6.0) were used. All solutions were filtered through a 0.20 μm Sartorius filter. The protein solutions were prepared, and equal volumes or a 1 μL drop of each protein sample was mixed with a 1.5 μL drop from 50 μL of a 0.8 M NiCl2 reservoir solution [40] via the sitting-drop vapor diffusion method in the 96-well plate (102-0001-20 Hampton Research HR3-163, Aliso Viejo, California, USA). Using a magnetic device, a magnetic field of about 200 mT was applied to the solutions in the gravitational direction during the whole crystal growth process. The experiments were conducted at 291, 293, and 295 K, and the growth required approximately 2 to 3 days.
2.2.2. Enoyl Acyl Carrier Protein Reductase (ENR)
The full-length of gene was cloned into the pET21b vector with 6 His-tag. The ENR Gly93 to Val (G93V) mutation was generated using the original ENR (UniProtKB—P49327, Crystal Genomics Inc). The plasmid was transformed into the Escherichia coli BL21 (DE3) strain (Novagen, California, USA) and the cells were grown at 310 K with ampicillin (50 mg/mL). Protein expression was induced by adding 0.5 mM isopropyl β-d-1-thiogalactopyranoside (IPTG) for an additional 12 h at 291 K.
The pelleted cells were suspended in a buffer containing 50 mM Tris–HCl at pH 7.5, 200 mM NaCl, and 1 mM PMSF) and then lysed by sonication. The lysed cells were centrifuged at 15,000 rpm for 1 h at 277 K. The supernatant was subjected to ion-exchange chromatography on a HiTrap column (GE Healthcare, USA). The protein was stepwise eluted with 50 mM Tris–HCl at pH 7.5, and 100 mM NaCl containing 0.5 M imidazole. For further purification, the eluents were loaded onto a Superdex® 200 (GE Healthcare, Illinois, USA), which was pre-equilibrated with a buffer containing 50 mM Tris–HCl (pH 7.5), 200 mM NaCl, and 2 mM DTT. All the chromatographic steps were carried out at 277 K. Prior to crystallization, the purified protein was concentrated to 10 to 20 mg/mL using an Amicon Ultra-15 ultrafiltration device (Millipore, MA, USA).
Initial crystallization was performed via the sitting-drop vapor diffusion method on a 96-well plate (102-0001-20 Hampton Research HR3-163, USA) at 291, 293, and 295 K. Commercial screening kits, such as Crystal Screen, Crystal Screen 2, PEG/Ion, PEG/Ion 2, Index (Hampton Research, Aliso Viejo, CA, USA), and Morpheus (Molecular Dimensions, Sheffield, UK), were used. The optimal crystallization was obtained under the following conditions: 10% (w/v) PEG 6000, 0.1 M ADA pH 5.6, 0.8 M NaNO3, and 20% (v/v) 2-propanol. Equal volumes of the protein and reservoir solution or a 1 μL drop of the protein sample and 1.5 μL drop of the 50 μL reservoir were mixed for crystallization.
2.3. X-ray Diffraction and Analysis
After crystal growth, the crystals were observed under a digital microscope and some crystals of good quality were selected for the X-ray diffraction experiment. The crystals were transferred to a cryoprotectant under optimized crystallization conditions with 12% (w/v) glycerol (Sigma-Aldrich, G5516-1L) to reduce the radiation damage. Datasets were collected on the BL-7A synchrotron at the Pohang Light Source (PLS) Facility in South Korea [48]. The datasets were indexed, processed, and scaled using a HKL-2000 software package [49,50], as summarized in Table 1. For assessing the effect of mosaicity by freezing, the X-ray data of the HEWL crystals were collected at room temperature (see Supplementary Materials: Table S1).
3. Results
3.1. Hen Egg-White Lysozyme (HEWL)
3.1.1. Crystal Growth and Morphology
Depending on the magnetic field applied, a difference was observed during the lysozyme crystallization process (Figure 4).
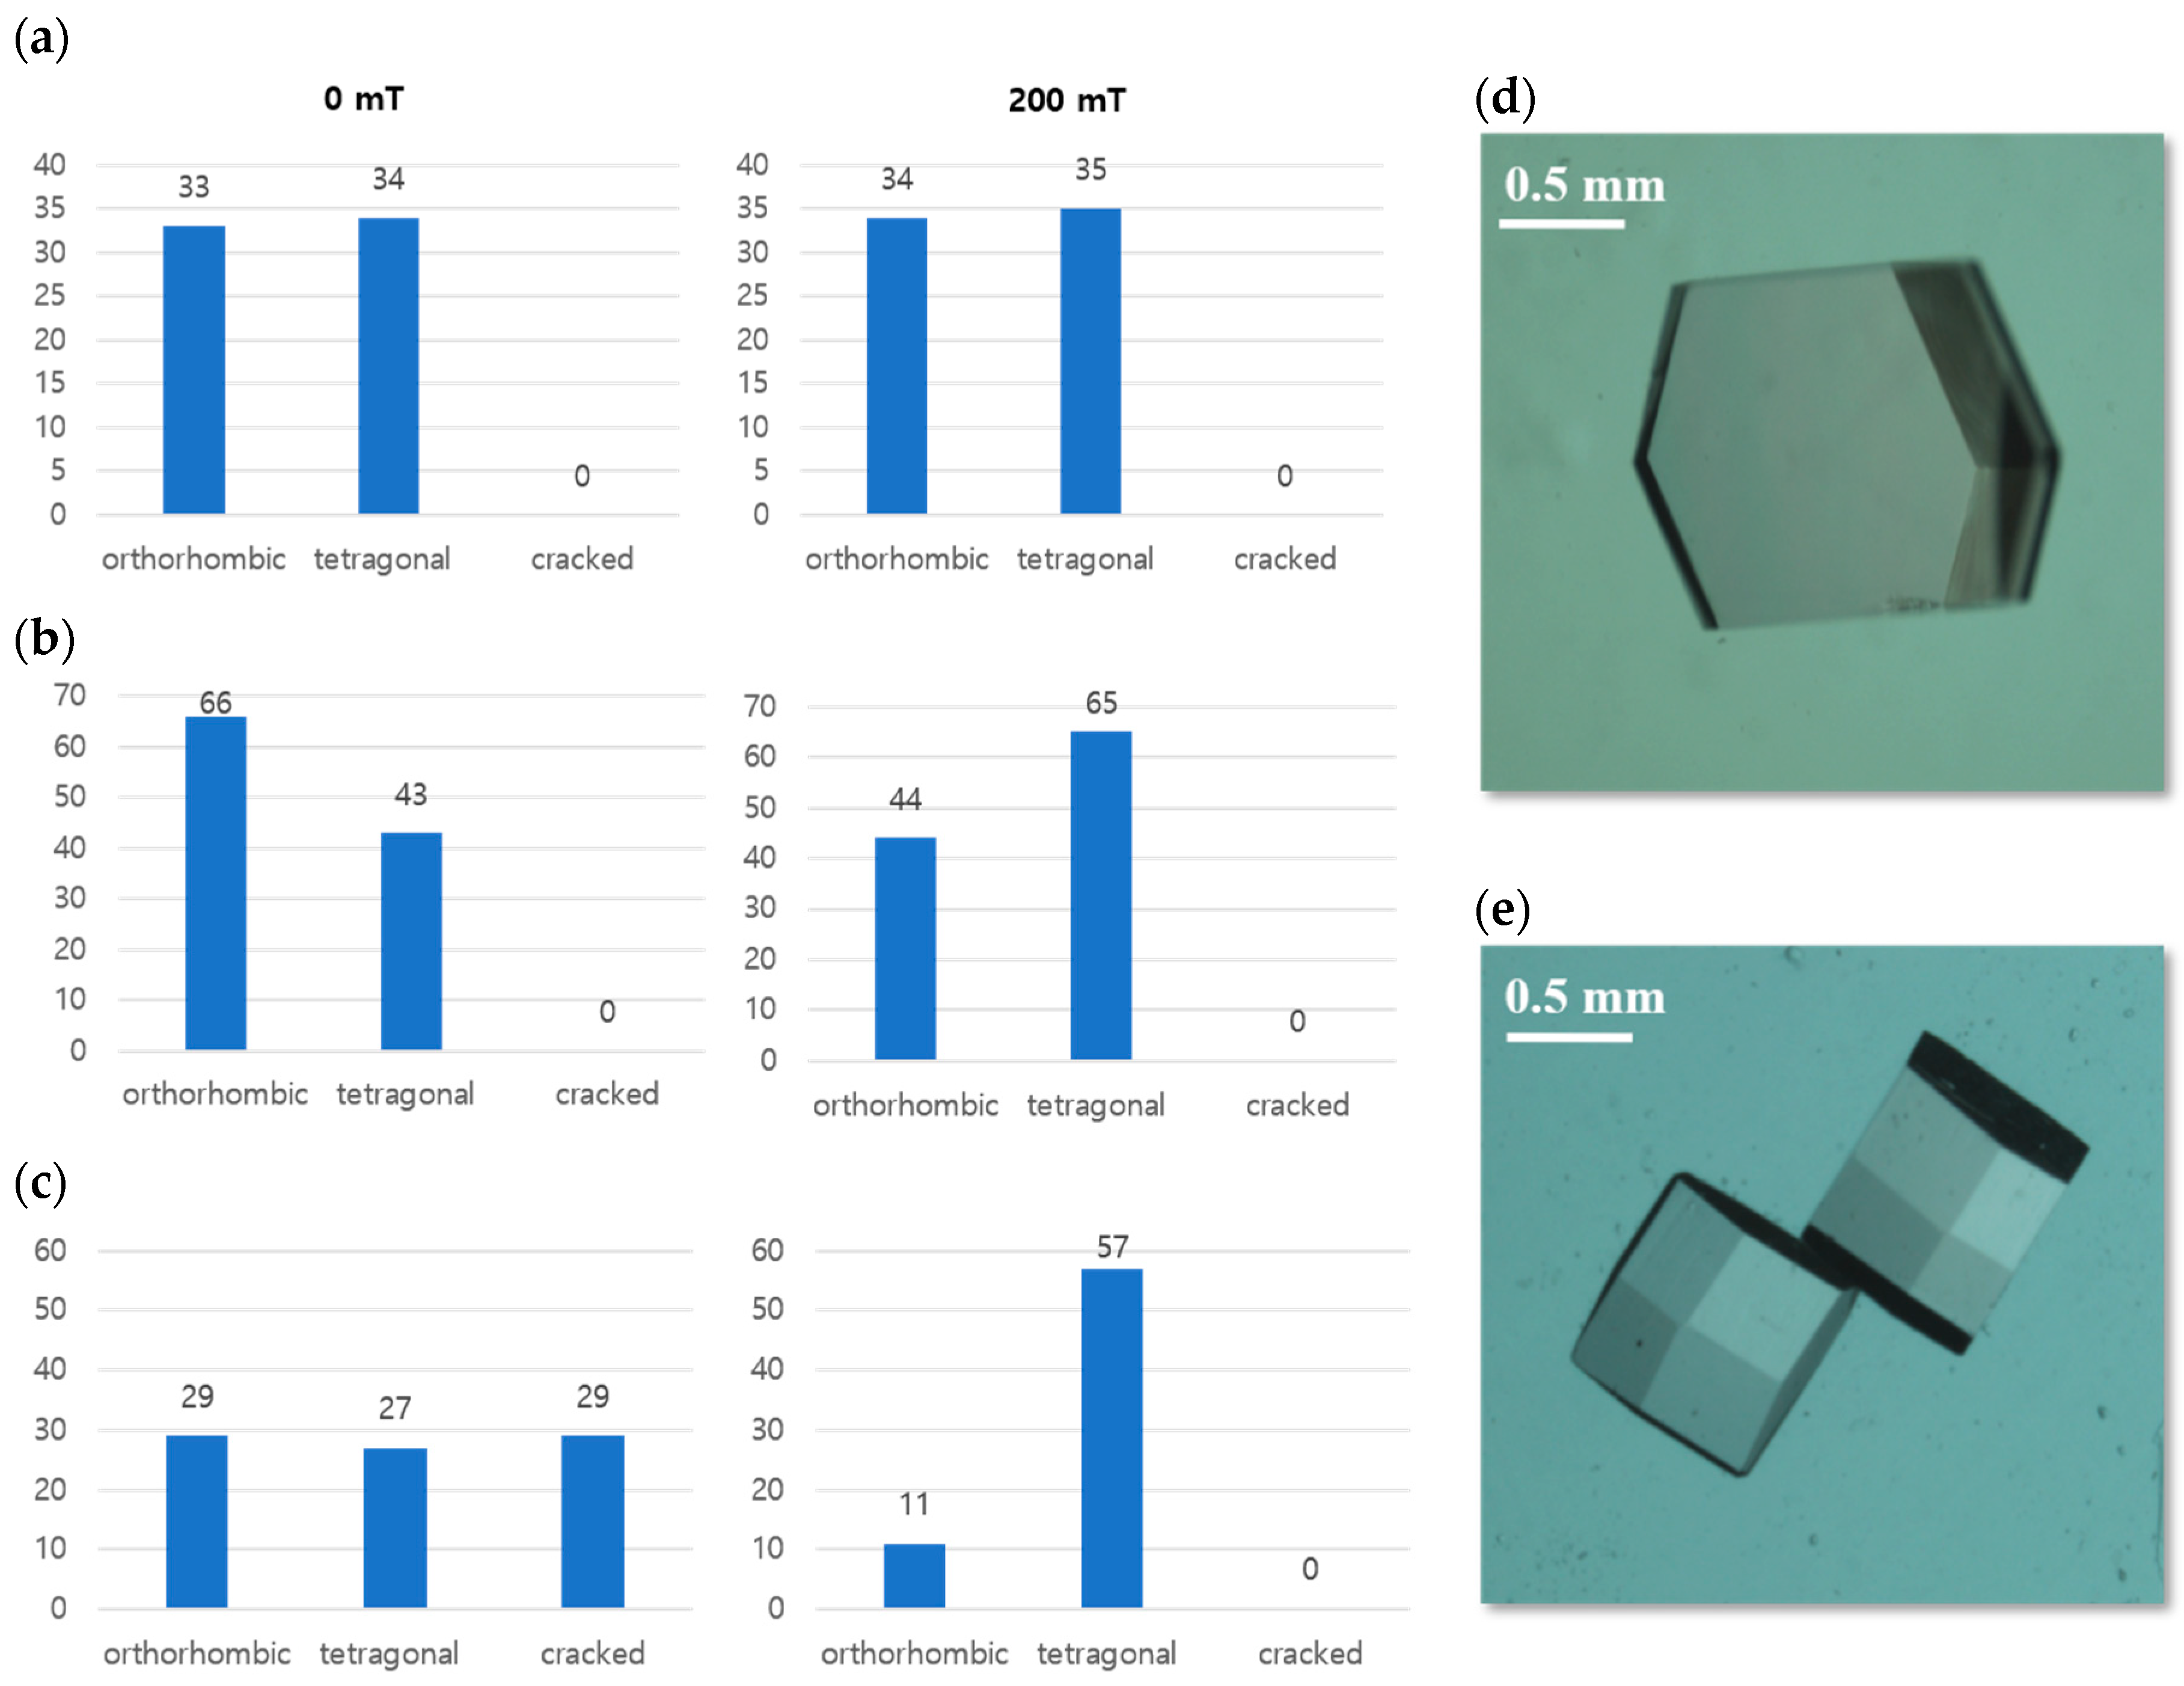
Applying a magnetic field clearly enhanced the nucleation of the protein crystal in each trial. As shown in Figure 5, orthorhombic and tetragonal crystals were obtained at three various pH values (pH 5.0, 5.5, and 6.0).
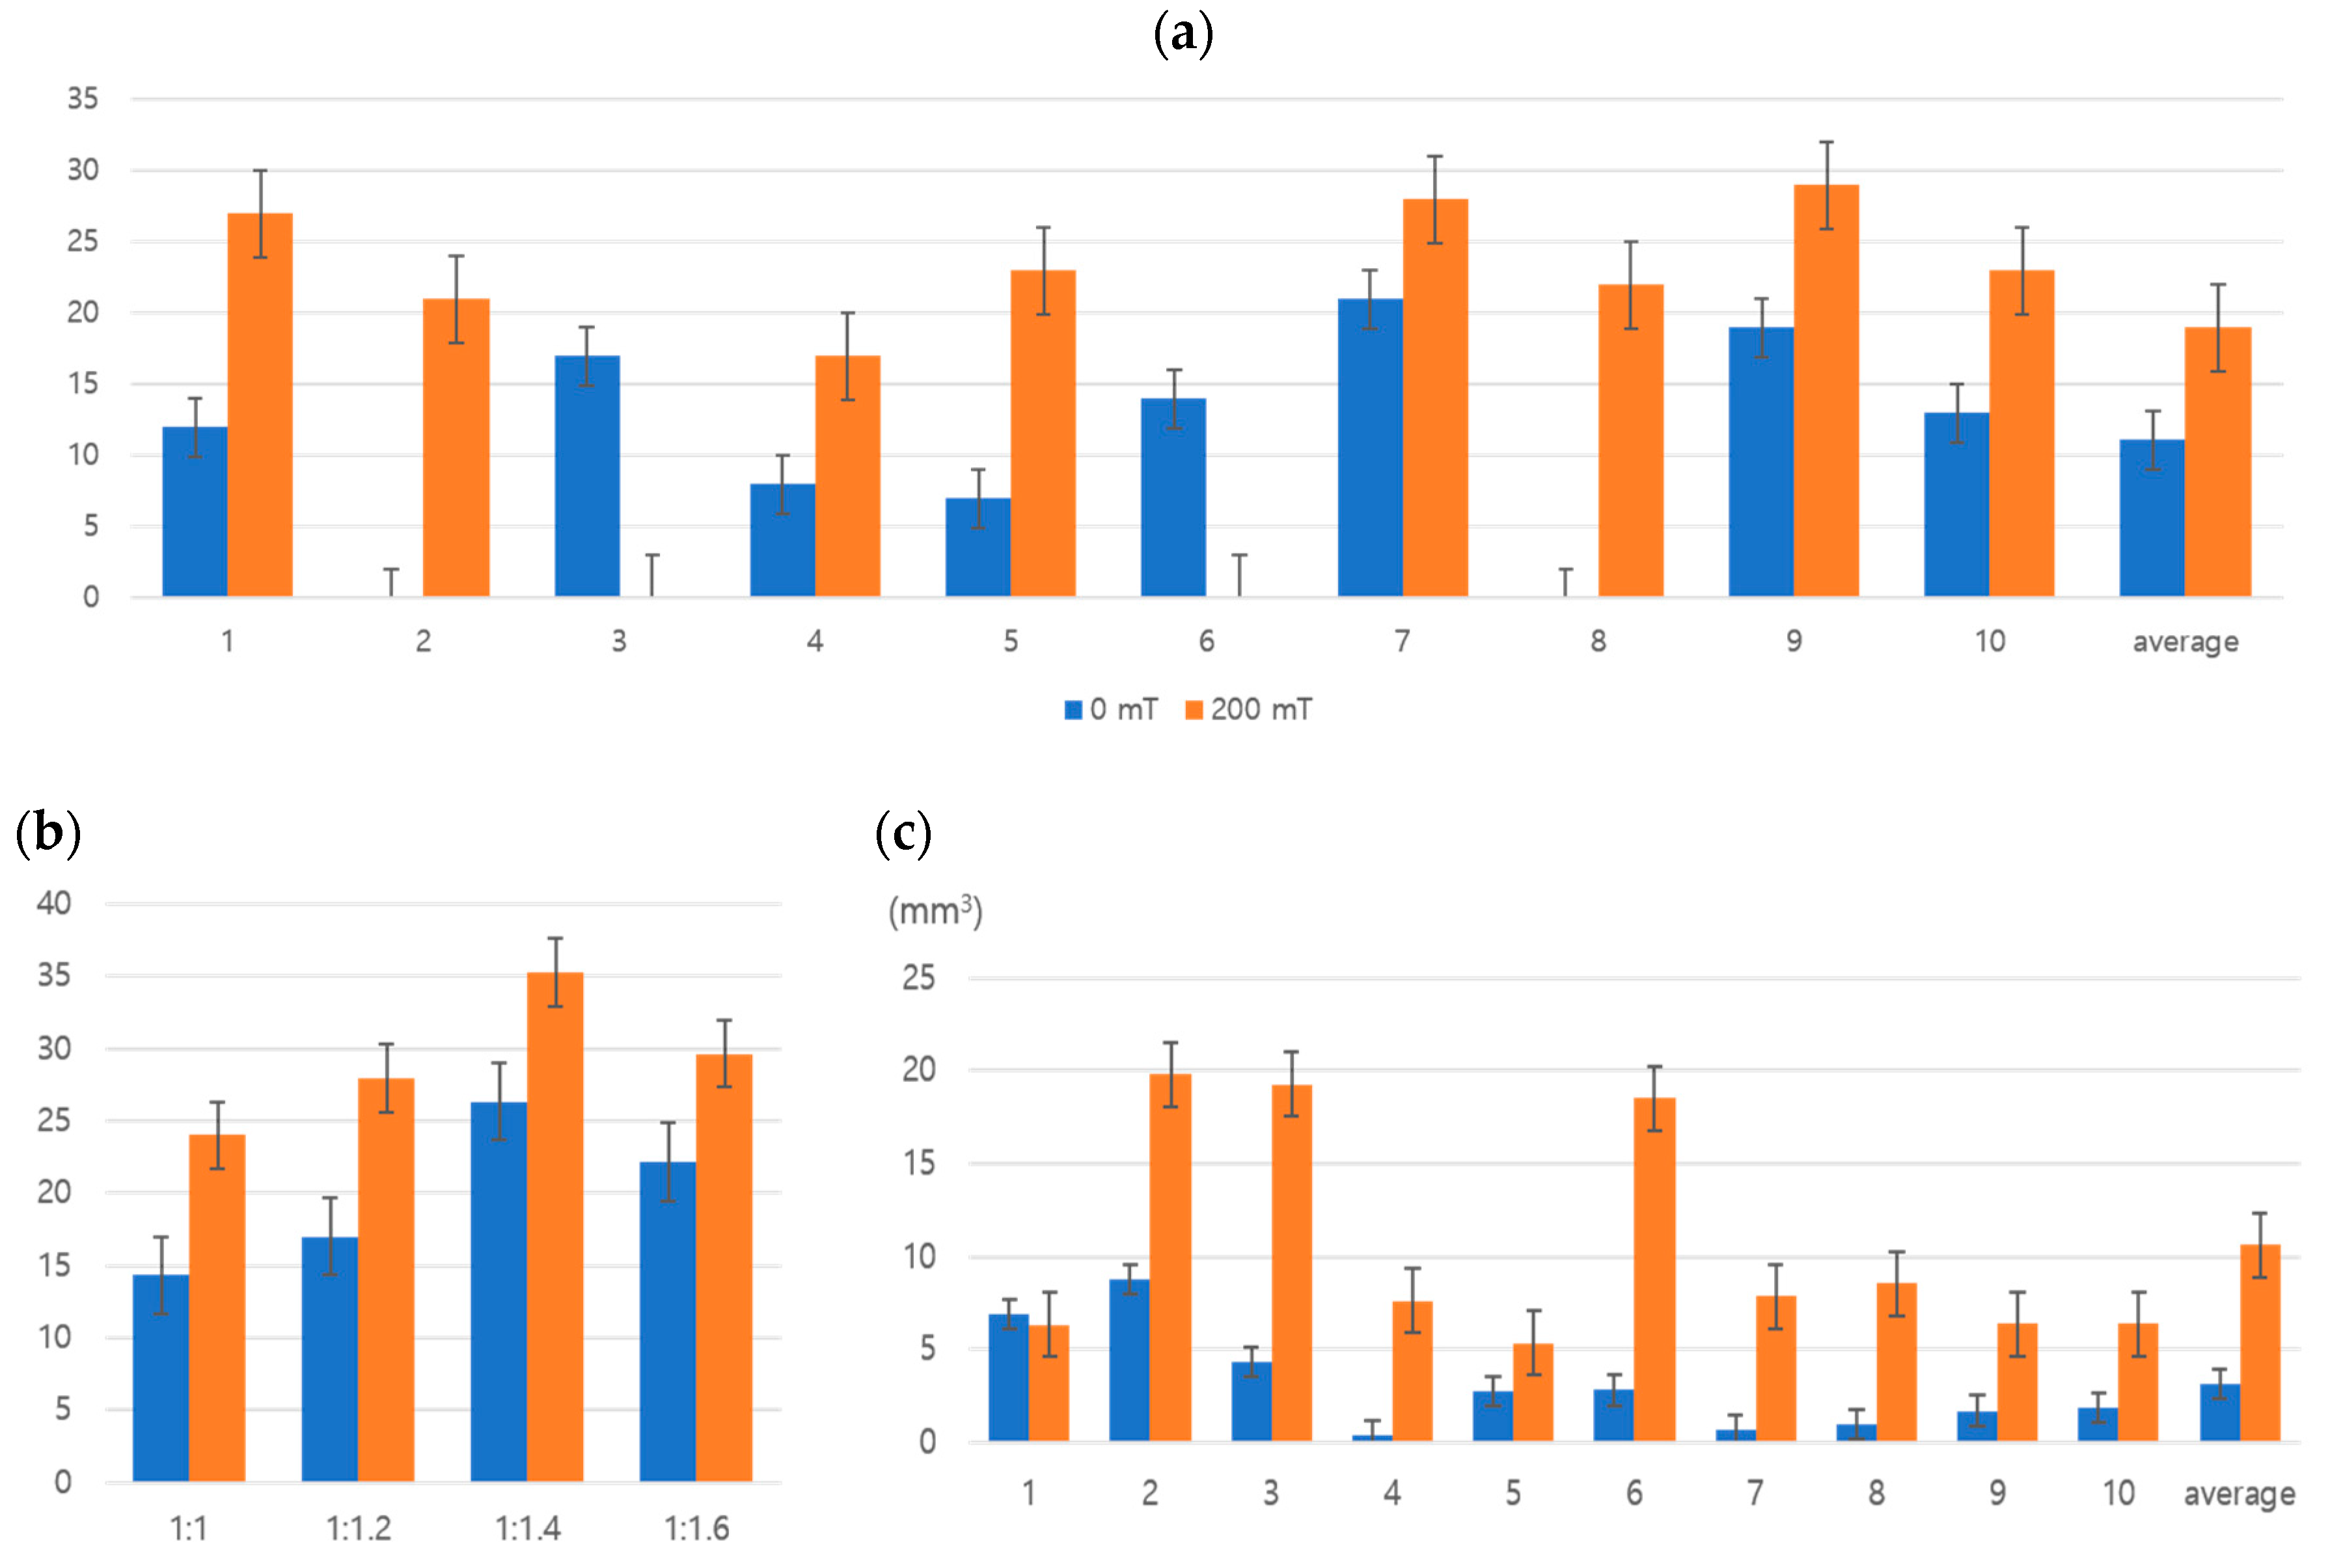
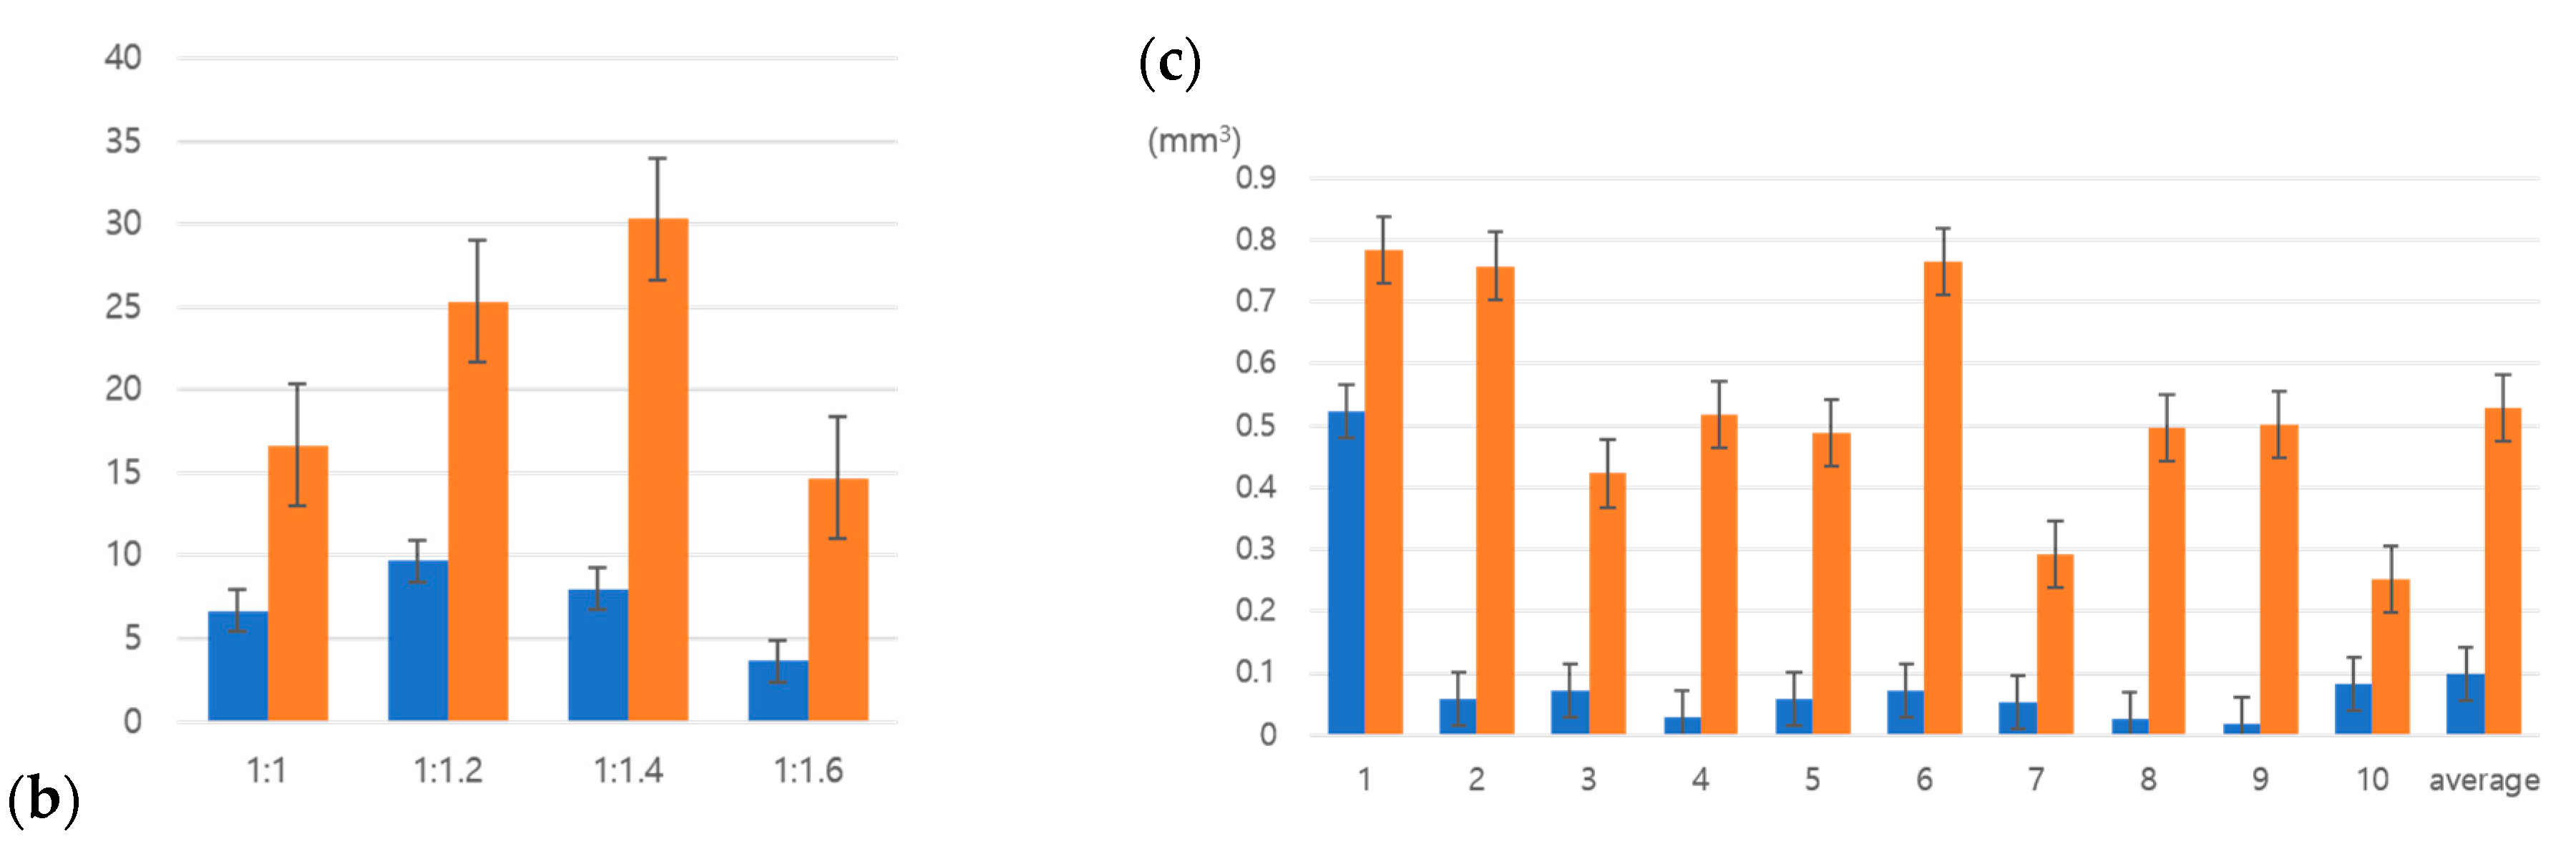
Two types of crystals were obtained at pH 5.0. However, as the pH increased under the magnetic conditions, the tetragonal crystals outnumbered the orthorhombic crystals. The number of hits per crystallization drop in the magnetic field was high (Figure 6 and Table 2). The crystals obtained were compared to evaluate the magnetic field effect on the protein crystal growth (Figure 6). The solutions exposed to a magnetic field yielded higher number of crystals compared with those unexposed. Crystals under a magnetic field also showed a better morphology, larger size and volume, and were more likely single crystals. The positive improvement in size and crystal quality is very advantageous not only for X-ray diffraction but also for neutron diffraction experiments.
3.1.2. Comparison of Diffracting HEWL Crystals
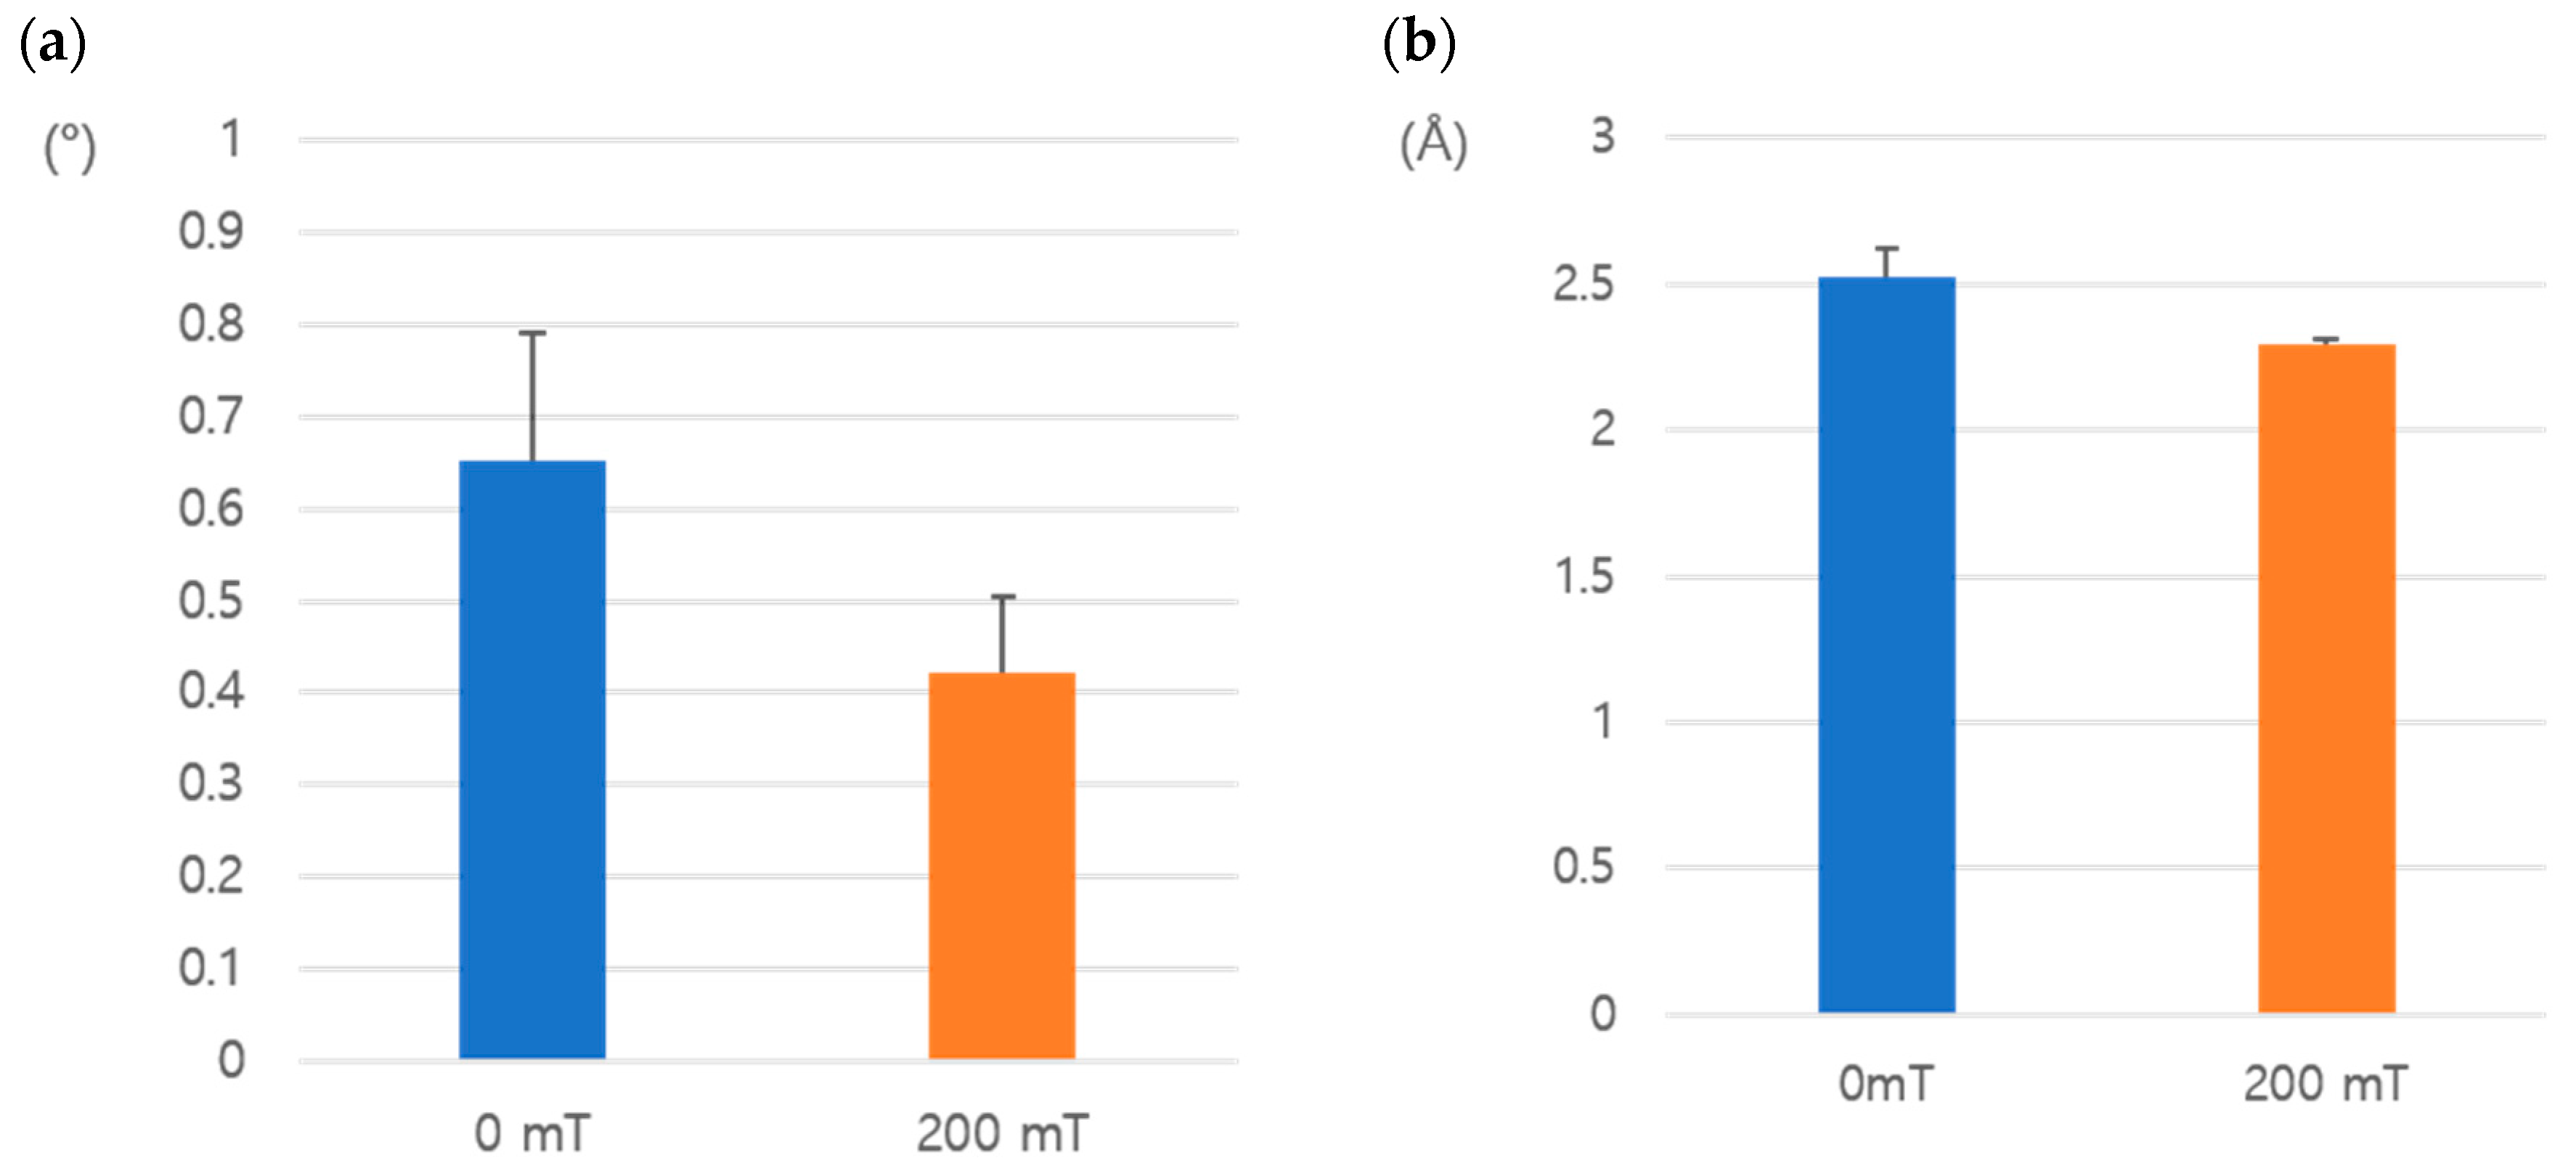
The improved quality of the HEWL crystals using the X-ray diffraction technique is shown (Table 1 and Figure 7). The unit cell parameters of the lysozyme crystals grown under a magnetic field were mostly similar. For the X-ray diffraction experiments, the exposure time was 1 s and the distance between the sample and the detector was 150 mm. Based on the analysis, upon exposure to a magnetic field, HEWL crystallized in a tetragonal system P43212 with lattice parameters (a = b = 76.893 Å and c = 36.975 Å). Without a magnetic field, although the space group was similar, the lattice parameters differed slightly (a = b = 77.383 Å and c = 37.032 Å). The resolution limit and mosaicity were used to evaluate the crystal quality. Figure 7a shows the mosaicity of each crystal. The crystals grown under a magnetic field were better than those unexposed to a magnetic field. Compared to the average normalized resolution of the crystals, the crystals under a magnetic field showed better results (Figure 7b). Consistent results were obtained with the data sets collected at room temperature (Supplementary Materials: Table S1).
3.2. Enol Acyl Reductase Carrer Protein (ENR))
3.2.1. Crystal Growth and Morphology
The best quality crystal with a size greater than 1.0 mm3 was obtained at 30 mg/mL, 0.6 M NaNO3, and 0.5 M ADA (pH 5.6) under a 200 mT magnetic field. The crystals with a maximum size conformed to the plate shape. Irrespective of the presence of the magnetic field, the solution containing NaNO3 produced only plate-shaped crystals. The protein nucleation rate was enhanced by applying a vertical magnetic field strength of 200 mT (see Figure 8 and Table 2). The magnetic field noticeably improved the crystal quality, shape, size, and number of crystals.
The crystals showed a slightly slower growth under conditions other than magnetic fields, compared to the magnetic field conditions, and the maximum size of the crystals also decreased. The non-magnetic field crystallization trials showed crystal formation within 2 weeks with rough edges and flaws, and significant precipitation within the drop (Figure 8). The crystal growth stopped after 3 weeks, and the amount of precipitate persisted. Crystals were stable for several weeks and months, and no further changes were detected within the drops.
The crystals grew at the bottom of the plate in the magnetic device within 10 days and reached their maximum size within 3 weeks. The crystals were also stable for several weeks up to months under a magnetic field. Generally, crystals obtained without a magnetic field were fewer in number and noticeably smaller than those acquired in the presence of a magnetic field (see Figure 9). The magnetic field improved the size and quality of crystals. The magnetic field enhanced the nucleation process of the test proteins.
3.2.2. Comparison of Diffracting ENRG93V Crystals
Crystallographic information was obtained via X-ray diffraction experiments conducted with ENR crystals, as shown in Table 1 and Figure 10.
The exposure time was 1 s and the distance between the detector and the sample was 300 mm; also, a 2-D detector was used. The crystals obtained under both conditions showed similar lattice parameters and crystallized in the orthorhombic space group P212121 (under magnetic field: a = 108.710 Å, b = 78.546 Å, c = 119.951 Å) and without the magnetic field (a = 109.016 Å, b = 78.667 Å, c = 113.883 Å). Significant deviations were found in the c-axis parameter. In the absence of a structural study, it is impossible to explain the lengthening of the c-axis parameter alone under a magnetic field. Further crystallographic investigations are needed to explain this phenomenon.
4. Discussion
We constructed unique and simple magnetic devices suitable for 96-well plates (Hampton Research) that are widely used in protein crystallization. We performed vapor diffusion techniques under a low magnetic field and used the HEWL and ENR proteins as test cases. Using a simple magnetic field device equipped with commercial magnets, we successfully obtained single crystals larger than 1.0 mm3 in volume. The crystals grown under a magnetic field were larger and showed perfect transparency, whereas the crystals grown without a magnetic field exhibited a low quality and cracks (Figure 4 and Figure 8).
The estimation of mosaicity is often convoluted with the intrinsic beam divergence (the angular discrepancy from “perfectly parallel”). The mosaicity of HEWL and ENR crystals was as low as 0.333 and 0.398° from a frozen crystal on a PAL synchrotron 7A beamline with a nearly parallel beam (Table 1). In general, a good quality crystal exhibits a small full-width-at-half-maximum, which is reflected by the mosaicity. The crystals grown under a magnetic field exhibited a slightly better resolution and lower mosaicity based on the X-ray diffraction experiments (Figure 7 and Figure 10, and Supplementary Materials: Table S1). Exposure to a magnetic field yields a higher resolution compared to crystals unexposed to a magnetic field. The high-resolution diffraction experiments suggest a higher angle. At a high angle, the scattering power of light atoms is dramatically reduced, which attenuates the I/σ(I) values. However, in the case of neutron diffraction, the scatter length is independent of the scatter angle. Therefore, neutron diffraction experiments are desirable for crystals exposed to a magnetic field.
The HEWL and ENR crystals grown under a magnetic field showed different effects. Tetragonal crystals derived from HEWL appeared to show more dramatic effects in a magnetic field than ENR, whereas ENR showed significant deviations in the c-axis parameter. Further crystallographic investigations are needed to explain the phenomenon, especially regarding the magnetic field orientation.
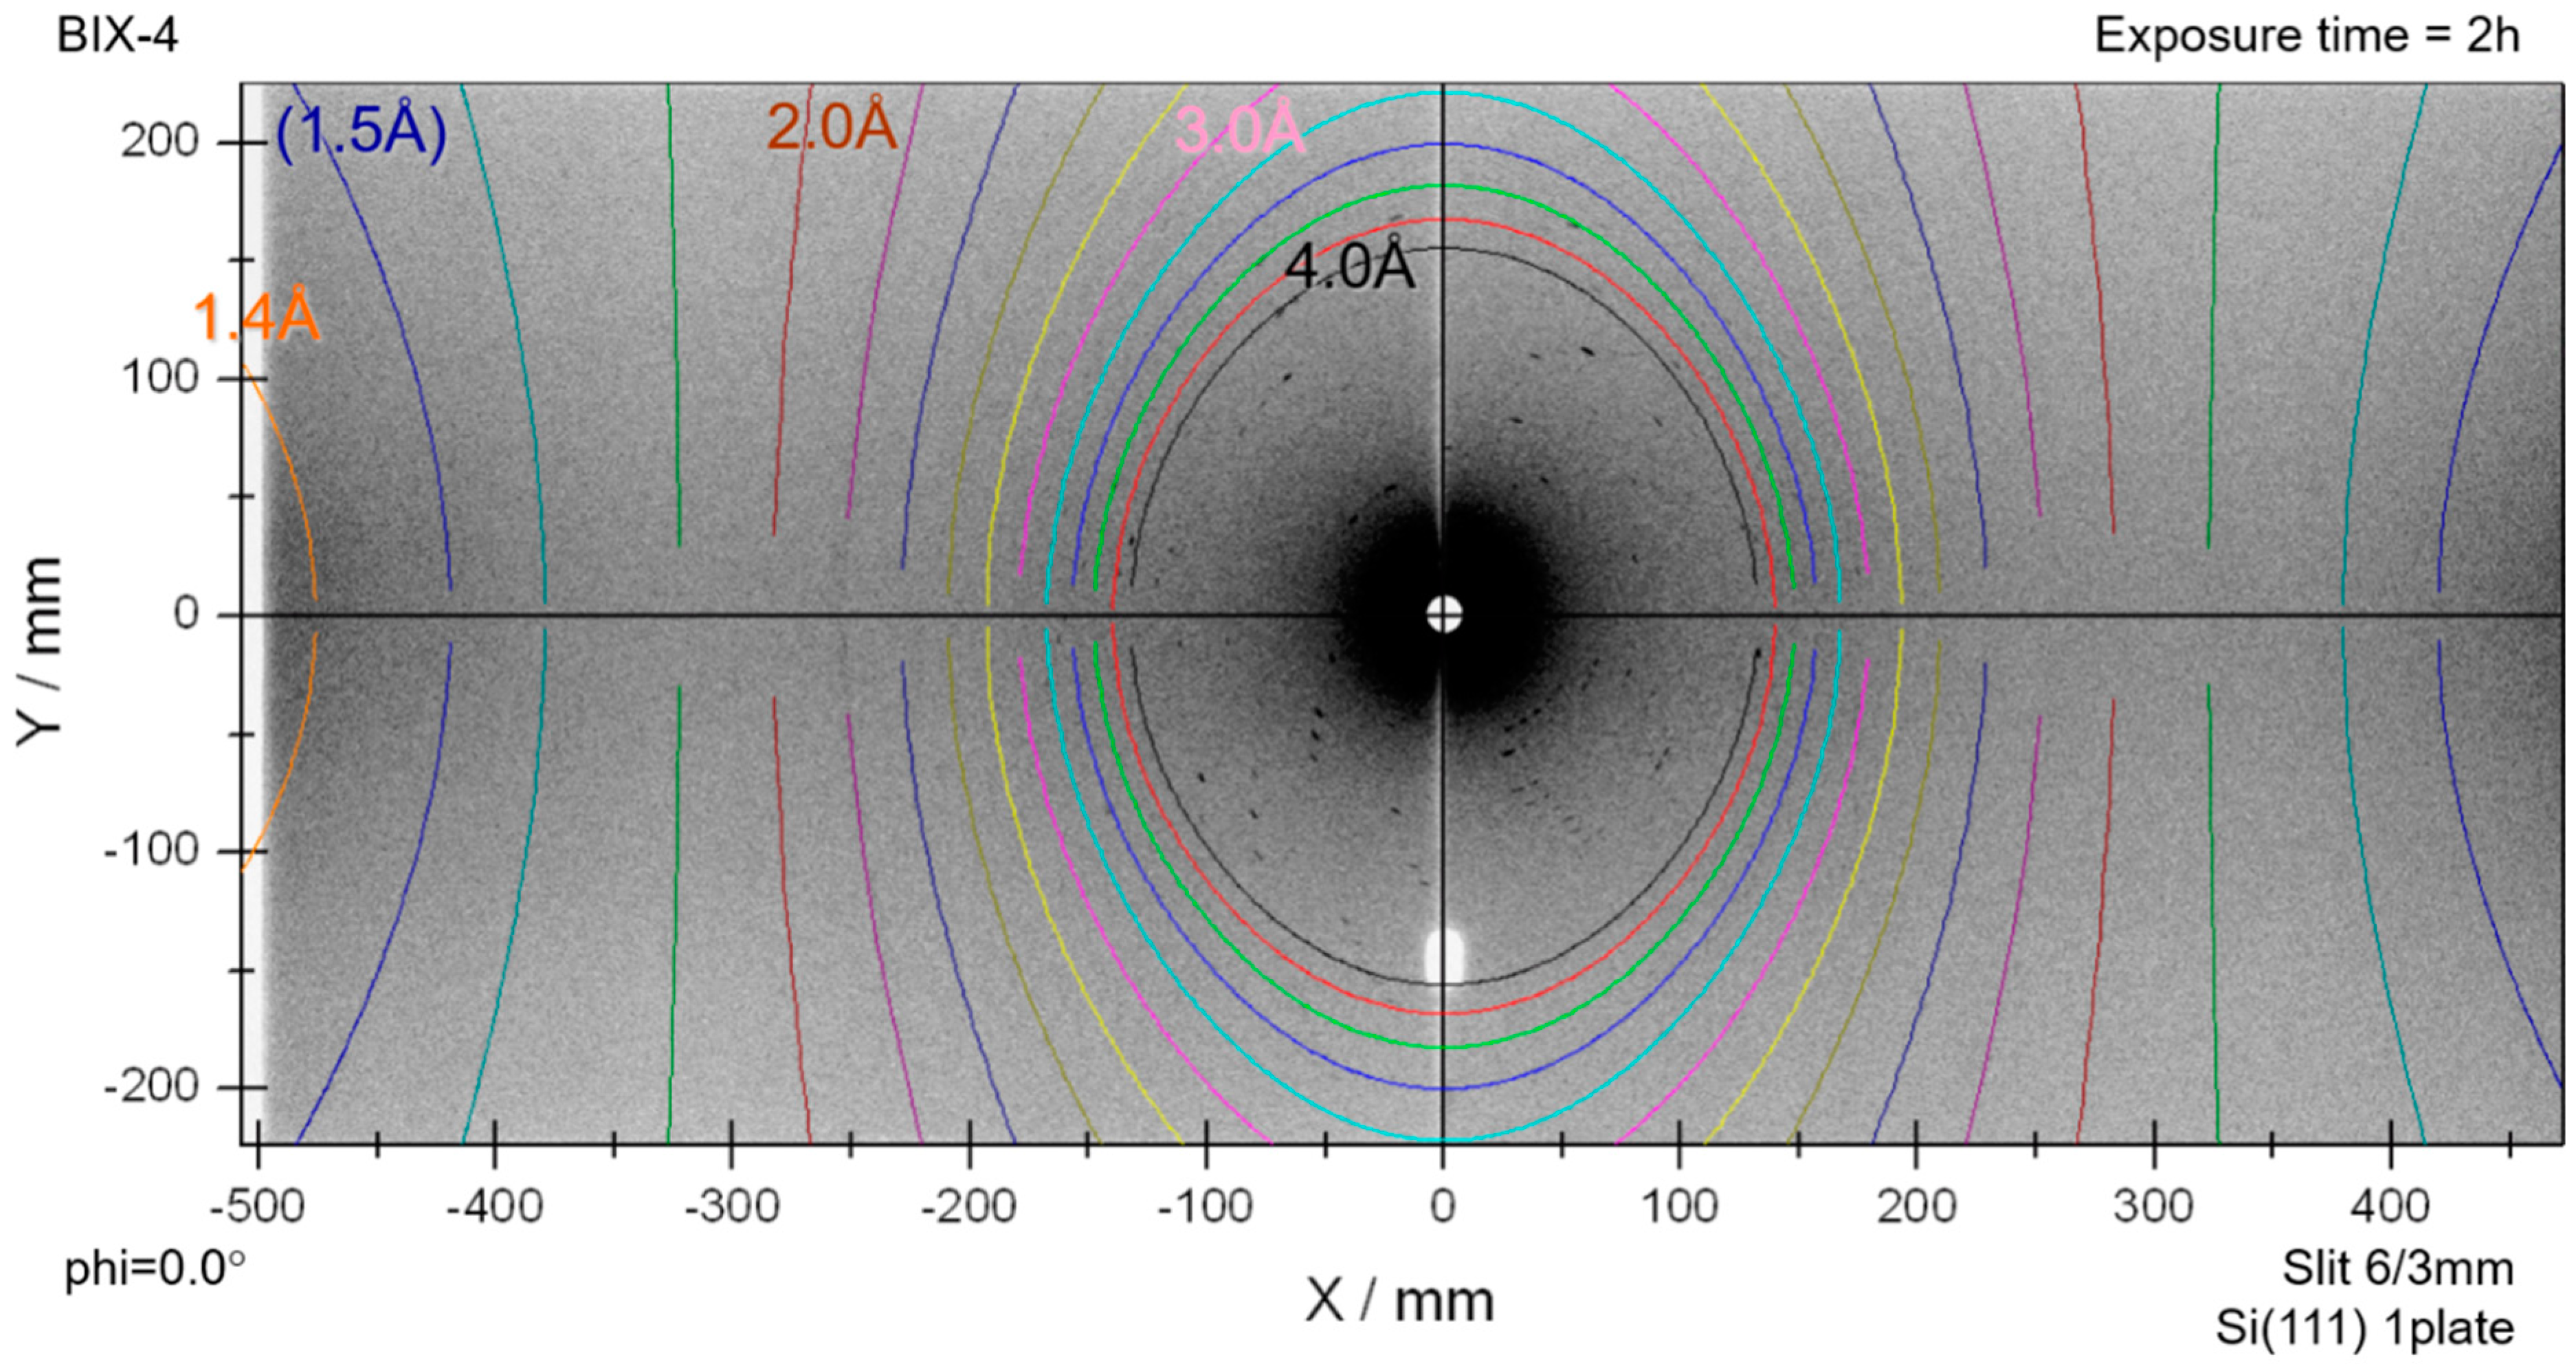
The crystals grown under a magnetic field show a high quality and are large enough for neutron diffraction experiments. The diffraction data of the crystals obtained under an old device were measured using a neutron source. A neutron diffraction experiment was planned to determine the effect of a design modification on crystal quality. Unfortunately, however, our research reactor at the Korea Atomic Energy Research Institute has been shut down and the other facilities are not conducive to such experiments. Based on the measurements involving protein crystals (Figure 11) using our old device (Figure 1), and also based on the comparison using X-ray techniques in this study, it is tempting to expect that the crystals obtained using the modified device deliver substantially improved results.
5. Conclusions
The magnetic field conditions affect the morphology, quality, and growth rate of protein crystals. The nucleation rate was increased at a magnetic field strength of 200 mT, which ensured the growth of a relatively large single crystal within a short time.
Presumably, a magnetic field has no effect on the increase in viscosity near the growing crystal, the reduction in natural convection inside the crystallization solution, or the decrease in the diffusion coefficient of the protein solution [12,47]. Experiments under a strong magnetic field have yet to be attempted; however, the strength of 200 mT is thought to be adequate for nucleation. Additionally, our device is small and portable, and facilitates testing of multiple test samples simultaneously.
Supplementary Materials
The following are available online at https://0-www-mdpi-com.brum.beds.ac.uk/2073-4352/10/9/821/s1, Table S1: Summary of X-ray diffraction data at room temperature of HEWL crystals.
Author Contributions
Conceptualization of the device, S.J.C.; validation, S.Y.R.; investigation, S.Y.R.; resources, S.J.C., S.A.K.; data curation, S.Y.R.; writing—original draft preparation, S.Y.R.; writing—review and editing, I.H.O., H.K.S.; visualization, S.Y.R.; supervision, I.H.O. and H.K.S. All authors have read and agreed to the published version of the manuscript.
Funding
The work at KAERI was funded by the Internal R&D program supported by the Ministry of Science and ICT (MSIT) of Republic of Korea, 524220-20. This work was also supported by National Research Foundation of Korea grants from the Korean government (NRF-2020R1A2C3008285).
Acknowledgments
We thank the staff at beamline 7A, Pohang Accelerator Laboratory, Korea and BIX-4 in JRR-3, JAERI, Japan for their help with the X-ray and neutron data collection.
Conflicts of Interest
The authors declare the absence of any conflict of interest.
References
- Hamilton, W.C.; Ibers, J.A. Hydrogen Bonding in solids; Methods of Molecular Structure Determination; W.A. Benjamin: New York, NY, USA, 1968; pp. 1–284. [Google Scholar]
- Chayen, N.E.; Helliwell, J.R.; Snell, E.H. Macromolecular Crystallization and Crystal Perfection; Oxford University Press: Oxford, UK, 2010. [Google Scholar]
- Park, S.H.; Suh, S.W.; Song, H.K. A cytosine modification mechanism revealed by the structure of a ternary complex of deoxycytidylate hydroxymethylase from bacteriophage T4 with its cofactor and substrate. IUCRJ 2019, 6, 206–217. [Google Scholar] [CrossRef] [PubMed]
- Hong, B.; Haddad, M.; Maley, F.; Jensen, J.H.; Kohen, A. Hydride transfer versus hydrogen radical transfer in thymidylate synthase. J. Am. Chem Soc. 2006, 128, 5636–5637. [Google Scholar] [CrossRef] [PubMed] [Green Version]
- Cai, R.; Yang, H.; He, J.; Zhu, W. The effects of magnetic fields on water molecular hydrogen bonds. J. Mol. Struct. 2009, 938, 15–19. [Google Scholar] [CrossRef]
- Chang, K.-T.; Weng, C.-I. The effect of an external magnetic field on the structure of liquid water using molecular dynamics simulation. J. Appl. Phys. 2006, 100. [Google Scholar] [CrossRef] [Green Version]
- Adams, P.D.; Afonine, P.V.; Baskaran, K.; Berman, H.M.; Berrisford, J.; Bricogne, G.; Brown, D.G.; Burley, S.K.; Chen, M.; Feng, Z.; et al. Announcing mandatory submission of pdbx/mmcif format files for crystallographic depositions to the protein data bank (PDB). Acta Cryst. D Struct Biol. 2019, 75, 451–454. [Google Scholar] [CrossRef] [Green Version]
- Burley, S.K.; Berman, H.M.; Kleywegt, G.J.; Markley, J.L.; Nakamura, H.; Velankar, S. Protein data bank (PDB): The single global macromolecular structure archive. Methods Mol. Biol. 2017, 1607, 627–641. [Google Scholar] [CrossRef] [Green Version]
- Takeda, M.; Miyanoiri, Y.; Terauchi, T.; Yang, C.J.; Kainosho, M. Use of h/d isotope effects to gather information about hydrogen bonding and hydrogen exchange rates. J. Magn. Reson. 2014, 241, 148–154. [Google Scholar] [CrossRef]
- Hodge, E.A.; Benhaim, M.A.; Lee, K.K. Bridging protein structure, dynamics, and function using hydrogen/deuterium-exchange mass spectrometry. Protein Sci. 2020, 29, 843–855. [Google Scholar] [CrossRef]
- Wilson, C.C. The evolution of hydrogen atom parameters under changing external conditions by time-of-flight single crystal neutron diffraction. Crystallogr. Rev. 2007, 13, 143–198. [Google Scholar] [CrossRef]
- Ohashi, Y.; Hosoya, T.; Ohhara, T. Hydrogen migration mechanism in crystalline-state photoisomerization by analyzed neutron diffraction. Crystallogr. Rev. 2006, 12, 83–123. [Google Scholar] [CrossRef]
- Liebschner, D.; Afonine, P.V.; Moriarty, N.W.; Langan, P.; Adams, P.D. Evaluation of models determined by neutron diffraction and proposed improvements to their validation and deposition. Acta Cryst. D Struct. Biol. 2018, 74, 800–813. [Google Scholar] [CrossRef] [PubMed]
- Gorrec, F. Protein crystallization screens developed at the mrc laboratory of molecular biology. Drug Discov. Today 2016, 21, 819–825. [Google Scholar] [CrossRef] [PubMed] [Green Version]
- Carter, C.W., Jr.; Carter, C.W. Protein crystallization using incomplete factorial experiments. J. Biol. Chem. 1979, 254, 12219–12223. [Google Scholar] [PubMed]
- Cox, M.J.; Weber, P.C. An investigation of protein crystallization parameters using successive automated grid searches (sags). J. Cryst. Growth 1988, 90, 318–324. [Google Scholar] [CrossRef]
- Luft, J.R.; Wolfley, J.R.; Said, M.I.; Nagel, R.M.; Lauricella, A.M.; Smith, J.L.; Thayer, M.H.; Veatch, C.K.; Snell, E.H.; Malkowski, M.G.; et al. Efficient optimization of crystallization conditions by manipulation of drop volume ratio and temperature. Protein Sci. 2007, 16, 715–722. [Google Scholar] [CrossRef] [Green Version]
- Wang, X.-K.; Yin, D.-C.; Zhang, C.-Y.; Lu, Q.-Q.; Guo, Y.-Z.; Guo, W.-H. Effect of temperature programmes on protein crystallisation. Cryst. Res. Technol. 2010, 45, 479–489. [Google Scholar] [CrossRef]
- Asai, T.; Suzuki, Y.; Sazaki, G.; Tamura, K.; Sawada, T.; Nakajima, K. Effects of high pressure on the solubility and growth kinetics of monoclinic lysozyme crystals. Cell. Mol. Biol. 2004, 50, 329–334. [Google Scholar]
- Hammadi, Z.; Veesler, S. New approaches on crystallization under electric fields. Prog. Biophys Mol. Biol. 2009, 101, 38–44. [Google Scholar] [CrossRef]
- Al-Haq, M.I.; Lebrasseur, E.; Choi, W.K.; Tsuchiya, H.; Torii, T.; Yamazaki, H.; Shinohara, E. An apparatus for electric-field-induced protein crystallization. J. Appl. Crystallogr. 2007, 40, 199–201. [Google Scholar] [CrossRef]
- Al-Haq, M.I.; Lebrasseur, E.; Tsuchiya, H.; Torii, T. Protein crystallization under an electric filed. Crystallogr. Rev. 2007, 13, 29–64. [Google Scholar] [CrossRef]
- Dong, J.; Boggon, T.J.; Chayen, N.E.; Raftery, J.; Bi, R.C.; Helliwell, J.R. Bound-solvent structures for microgravity-, ground control-, gel- and microbatch-grown hen egg-white lysozyme crystals at 1.8 a resolution. Acta Cryst. D Biol. Cryst. 1999, 55, 745–752. [Google Scholar] [CrossRef]
- Koizumi, H.; Uda, S.; Fujiwara, K.; Nozawa, J. Control of effect on the nucleation rate for hen egg white lysozyme crystals under application of an external ac electric field. Langmuir 2011, 27, 8333–8338. [Google Scholar] [CrossRef] [PubMed]
- Yin, D.C.; Wakayama, N.I.; Inatomi, Y.; Huang, W.D.; Kuribayashi, K. Strong magnetic field effect on the dissolution process of tetragonal lysozyme crystals. Gravit. Eff. Phys. Chem. Process. 2003, 32, 217–223. [Google Scholar]
- Sazaki, G. Crystal quality enhancement by magnetic fields. Prog. Biophys Mol. Biol. 2009, 101, 45–55. [Google Scholar] [CrossRef] [PubMed]
- Pareja-Rivera, C.; Cuéllar-Cruz, M.; Esturau-Escofet, N.; Demitri, N.; Polentarutti, M.; Stojanoff, V.; Moreno, A. Recent advances in the understanding of the influence of electric and magnetic fields on protein crystal growth. Cryst. Growth Des. 2016, 17, 135–145. [Google Scholar] [CrossRef]
- Yin, D.-C. Protein crystallization in a magnetic field. Prog. Cryst. Growth Charact. Mater. 2015, 61, 1–26. [Google Scholar] [CrossRef]
- Toledo, E.J.L.; Ramalho, T.C.; Magriotis, Z.M. Influence of magnetic field on physical–chemical properties of the liquid water: Insights from experimental and theoretical models. J. Mol. Struct. 2008, 888, 409–415. [Google Scholar] [CrossRef]
- Yanagiya, S.; Sazaki, G.; Durbin, S.D.; Miyashita, S.; Nakajima, K.; Komatsu, H.; Watanabe, K.; Motokawa, M. Effects of a magnetic field on the growth rate of tetragonal lysozyme crystals. J. Cryst. Growth 2000, 208, 645–650. [Google Scholar] [CrossRef]
- Guo, Y.Z.; Yin, D.C.; Cao, H.L.; Shi, J.Y.; Zhang, C.Y.; Liu, Y.M.; Huang, H.H.; Liu, Y.; Wang, Y.; Guo, W.H.; et al. Evaporation rate of water as a function of a magnetic field and field gradient. Int. J. Mol. Sci. 2012, 13, 16916–16928. [Google Scholar] [CrossRef] [Green Version]
- Gavira, J.A.; Garcia-Ruiz, J.M. Effects of a magnetic field on lysozyme crystal nucleation and growth in a diffusive environment. Cryst. Growth Des. 2009, 9, 2610–2615. [Google Scholar] [CrossRef]
- Yin, D.-C.; Lu, H.-M.; Geng, L.-Q.; Shi, Z.-H.; Luo, H.-M.; Li, H.-S.; Ye, Y.-J.; Guo, W.-H.; Shang, P.; Wakayama, N.I. Growing and dissolving protein crystals in a levitated and containerless droplet. J. Cryst. Growth 2008, 310, 1206–1212. [Google Scholar] [CrossRef]
- Ataka, M.; Katoh, E.; Wakayama, N.I. Magnetic orientation as a tool to study the initial stage of crystallization of lysozyme. J. Cryst. Growth 1997, 173, 592–596. [Google Scholar] [CrossRef]
- Qi, J.W.; Wakayama, N.I.; Ataka, M. Magnetic suppression of convection in protein crystal growth processes. J. Cryst. Growth 2001, 232, 132–137. [Google Scholar] [CrossRef]
- Saijo, S.; Yamada, Y.; Sato, T.; Tanaka, N.; Matsui, T.; Sazaki, G.; Nakajima, K.; Matsuura, Y. Structural consequences of hen egg-white lysozyme orthorhombic crystal growth in a high magnetic field: Validation of x-ray diffraction intensity, conformational energy searching and quantitative analysis of b factors and mosaicity. Acta Cryst. D Biol. Cryst. 2005, 61, 207–217. [Google Scholar] [CrossRef] [Green Version]
- Sato, T.; Yamada, Y.; Saijo, S.; Hori, T.; Hirose, R.; Tanaka, N.; Sazaki, G.; Nakajima, K.; Igarashi, N.; Tanaka, M.; et al. Enhancement in the perfection of orthorhombic lysozyme crystals grown in a high magnetic field (10 T). Acta Cryst. D Biol. Cryst. 2000, 56, 1079–1083. [Google Scholar] [CrossRef] [Green Version]
- Sazaki, G.; Yoshida, E.; Komatsu, H.; Nakada, T.; Miyashita, S.; Watanabe, K. Effects of a magnetic field on the nucleation and growth of protein crystals. J. Cryst. Growth 1997, 173, 231–234. [Google Scholar] [CrossRef]
- Calabrò, E.; Magazù, S. Electromagnetic fields effects on the secondary structure of lysozyme and bioprotective effectiveness of trehalose. Adv. Phys. Chem. 2012, 2012, 1–6. [Google Scholar] [CrossRef]
- Okutsu, T.; Furuta, K.; Terao, M.; Hiratsuka, H.; Yamano, A.; Ferte, N.; Veesler, S. Light-induced nucleation of metastable hen egg-white lysozyme solutions. Cryst. Growth Des. 2005, 5, 1393–1398. [Google Scholar]
- Russo Krauss, I.; Merlino, A.; Vergara, A.; Sica, F. An overview of biological macromolecule crystallization. Int. J. Mol. Sci. 2013, 14, 11643–11691. [Google Scholar] [CrossRef] [Green Version]
- Lee, B.G.; Kim, M.K.; Song, H.K. Structural insights into the conformational diversity of clpp from bacillus subtilis. Mol. Cells 2011, 32, 589–595. [Google Scholar] [CrossRef]
- Lee, B.G.; Park, E.Y.; Lee, K.E.; Jeon, H.; Sung, K.H.; Paulsen, H.; Rubsamen-Schaeff, H.; Brotz-Oesterhelt, H.; Song, H.K. Structures of clpp in complex with acyldepsipeptide antibiotics reveal its activation mechanism. Nat. Struct Mol. Biol. 2010, 17, 471–478. [Google Scholar] [CrossRef] [PubMed]
- Kwon, D.H.; Park, O.H.; Kim, L.; Jung, Y.O.; Park, Y.; Jeong, H.; Hyun, J.; Kim, Y.K.; Song, H.K. Insights into degradation mechanism of n-end rule substrates by p62/sqstm1 autophagy adapter. Nat. Commun. 2018, 9, 3291. [Google Scholar] [CrossRef] [PubMed] [Green Version]
- Huang, Q.; Gruner, S.M.; Kim, C.U.; Mao, Y.; Wu, X.; Szebenyi, D.M. Reduction of lattice disorder in protein crystals by high-pressure cryocooling. J. Appl. Cryst. 2016, 49, 149–157. [Google Scholar] [CrossRef] [PubMed] [Green Version]
- Kim, J.K.; Lomelino, C.L.; Avvaru, B.S.; Mahon, B.P.; McKenna, R.; Park, S.; Kim, C.U. Active-site solvent replenishment observed during human carbonic anhydrase ii catalysis. IUCRJ 2018, 5, 93–102. [Google Scholar] [CrossRef] [PubMed] [Green Version]
- Magay, E.; Cho, S.J.; Kim, S.A. Enhancing the volume and the optical quality of hen egg-white lysozyme crystals by coupling the salt concentration gradient crystallization method with a magnetic field. J. Appl. Cryst. 2012, 45, 1066–1068. [Google Scholar] [CrossRef] [Green Version]
- Suk-Youl, P.; Sung-Chul, H.; Yeon-Gil, K. The protein crystallography beamlines at the pohang light source ii. Biodesign 2017, 5, 30–34. [Google Scholar]
- Wlodawer, A.; Minor, W.; Dauter, Z.; Jaskolski, M. Protein crystallography for aspiring crystallographers or how to avoid pitfalls and traps in macromolecular structure determination. Febs J. 2013, 280, 5705–5736. [Google Scholar] [CrossRef] [Green Version]
- Powell, H.R. X-ray data processing. Biosci. Rep. 2017, 37. [Google Scholar] [CrossRef] [Green Version]
- Arndt, U.W.; Crowther, R.A.; Mallett, J.F.W. A computer-linked cathode-ray tube microdensitometer for x-ray crystallography. J. Phys. E-Sci. Instrum. 1968, 1, 510. [Google Scholar] [CrossRef]
Figure 1.
Devices designed previously consisting of a simple cassette with round magnets compactly packed into an aluminum frame and covered by carbon steel and aluminum plates. (a) Disassembled and assembled positions of the device with a 24-well plate. (b) Disassembled and assembled positions of the device with 72-wells. (c) Schematic diagram of the direction of the magnetic field for the 24-well device. (d) Schematic diagram of the direction of the magnetic field for the 72-well device.

Figure 2.
The magnetic field directions of the first device (a) and additional magnets at the top and bottom parallel to the existing magnets (b).
Figure 2.
The magnetic field directions of the first device (a) and additional magnets at the top and bottom parallel to the existing magnets (b).

Figure 3.
The new devices consist of a simple cassette in which the rod magnets are compactly packed into an aluminum frame and covered by carbon steel and aluminum plates. (a) Disassembled and assembled positions of the device. (b) Graphic representation of magnetic field density vs. distance.
Figure 3.
The new devices consist of a simple cassette in which the rod magnets are compactly packed into an aluminum frame and covered by carbon steel and aluminum plates. (a) Disassembled and assembled positions of the device. (b) Graphic representation of magnetic field density vs. distance.

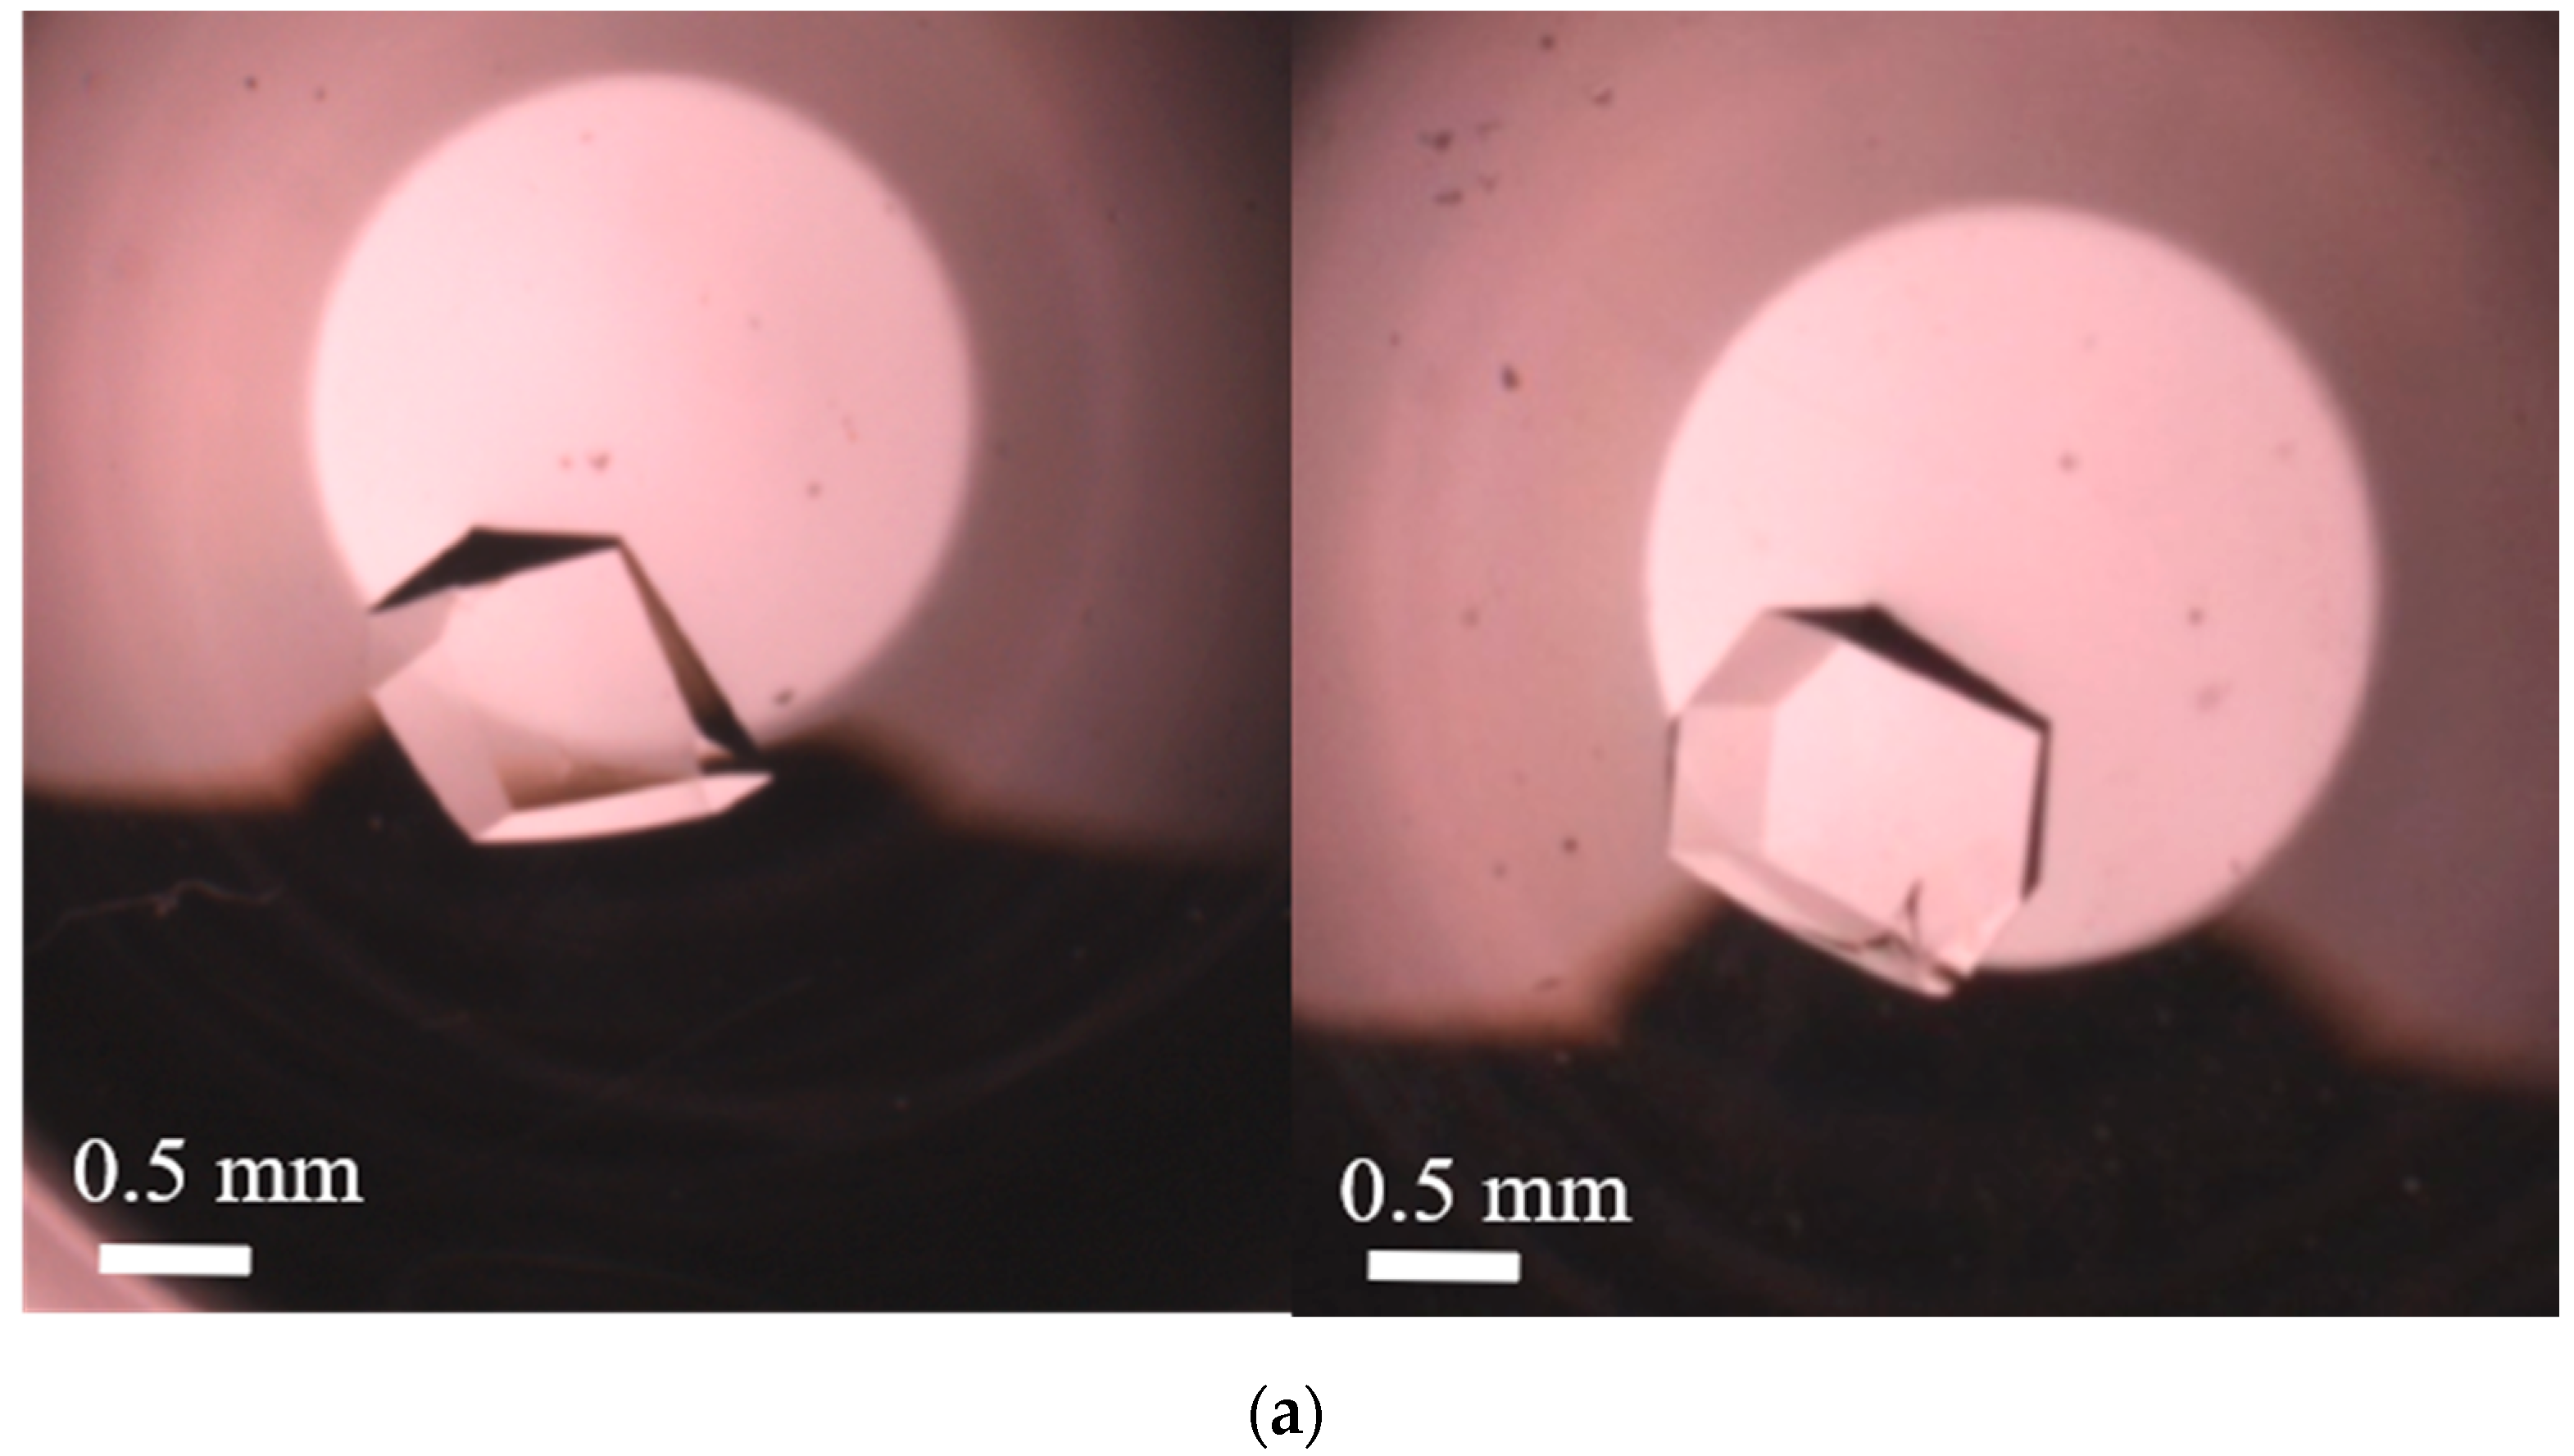
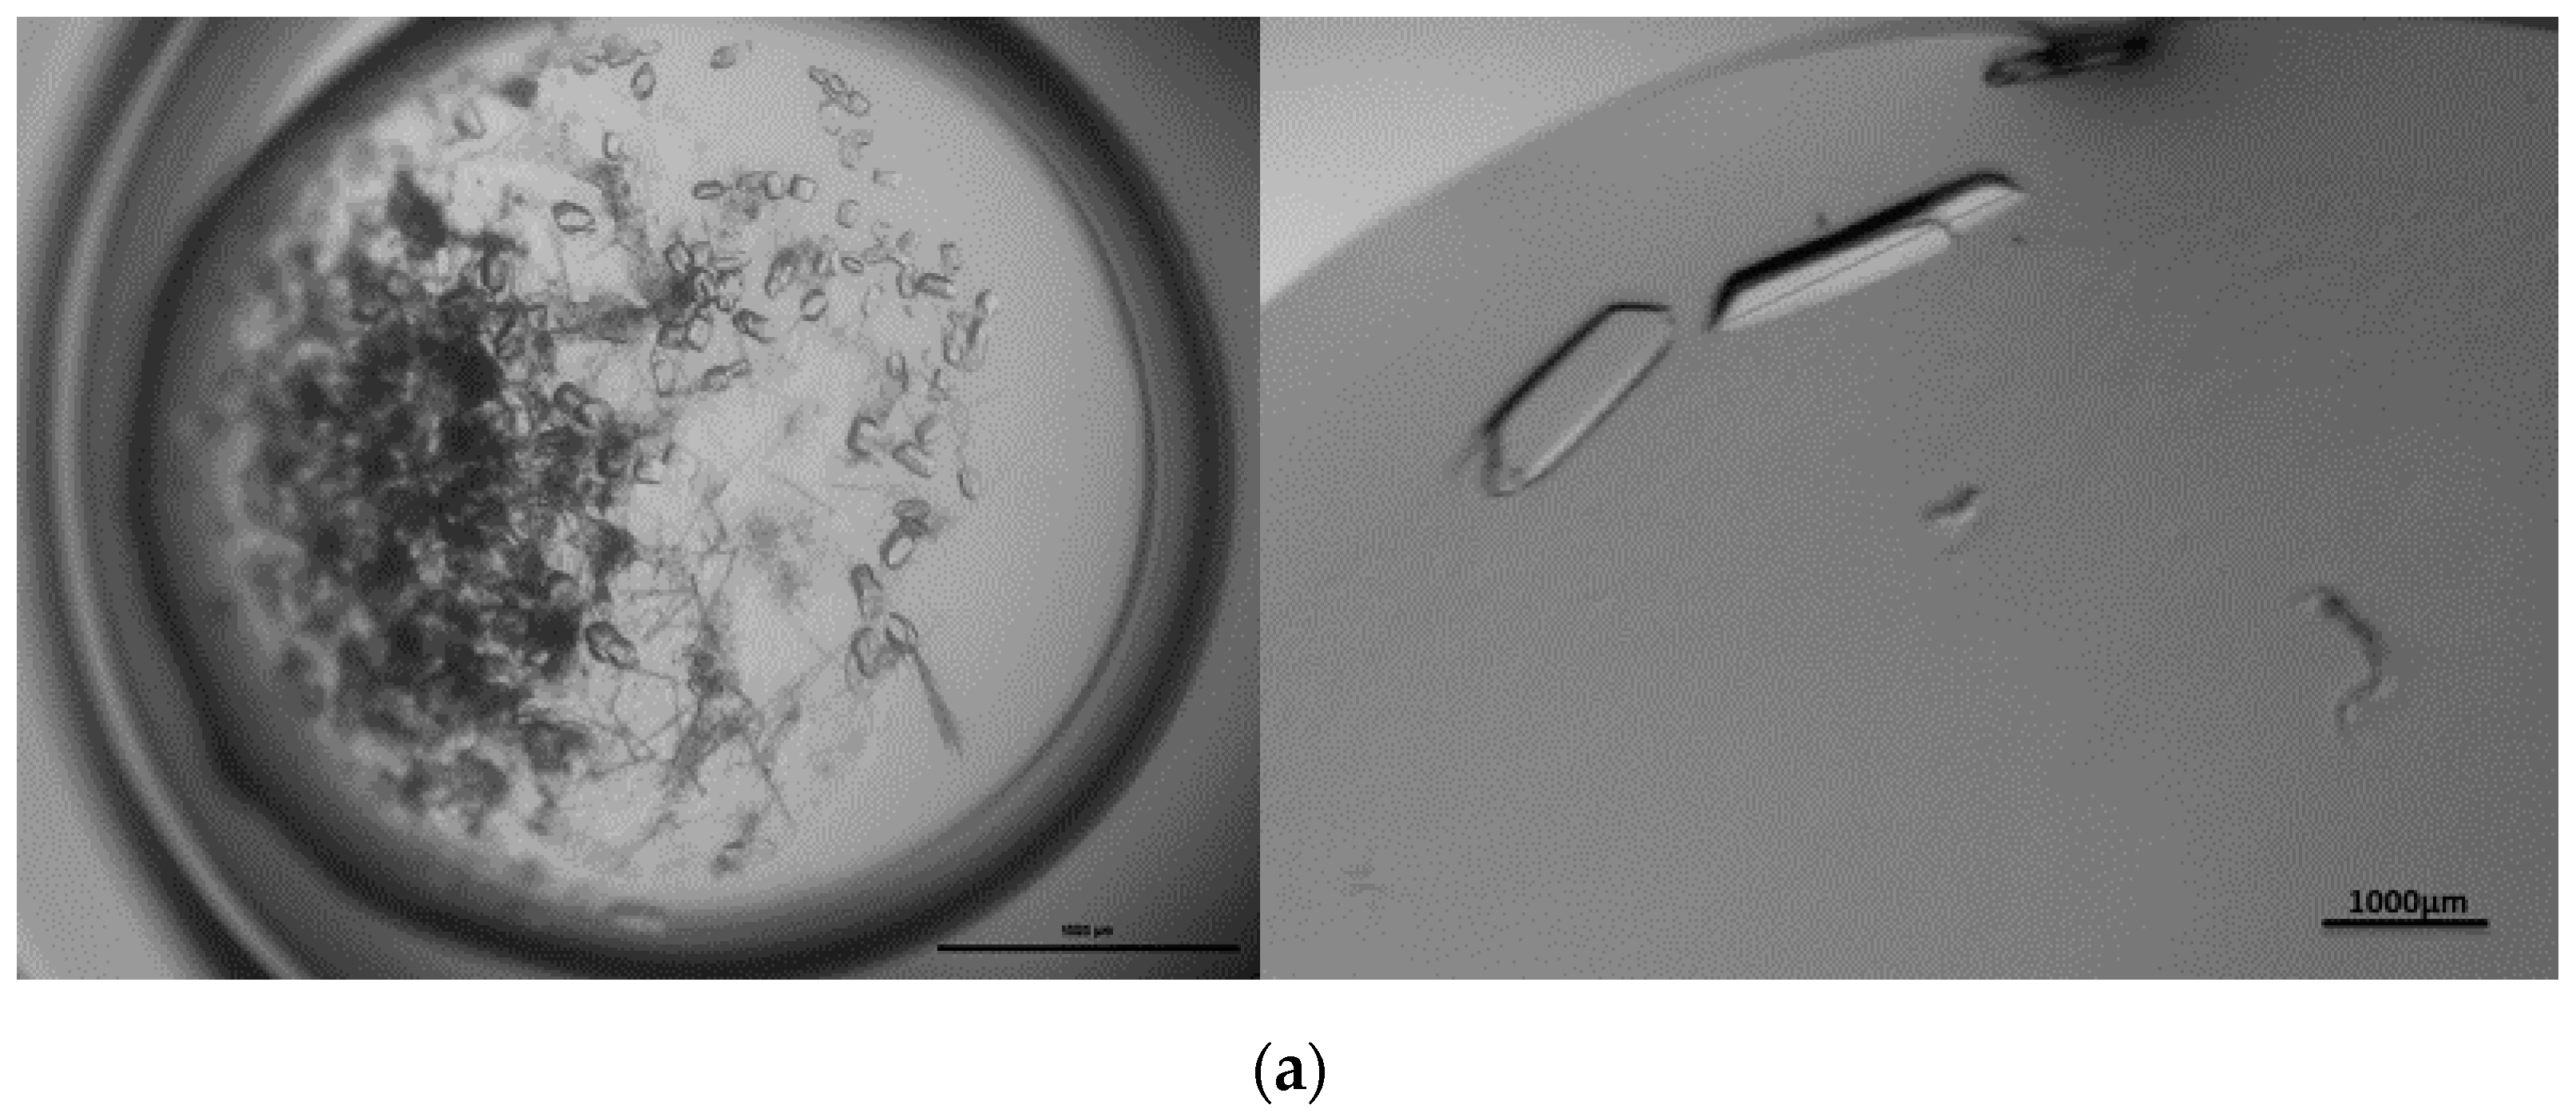
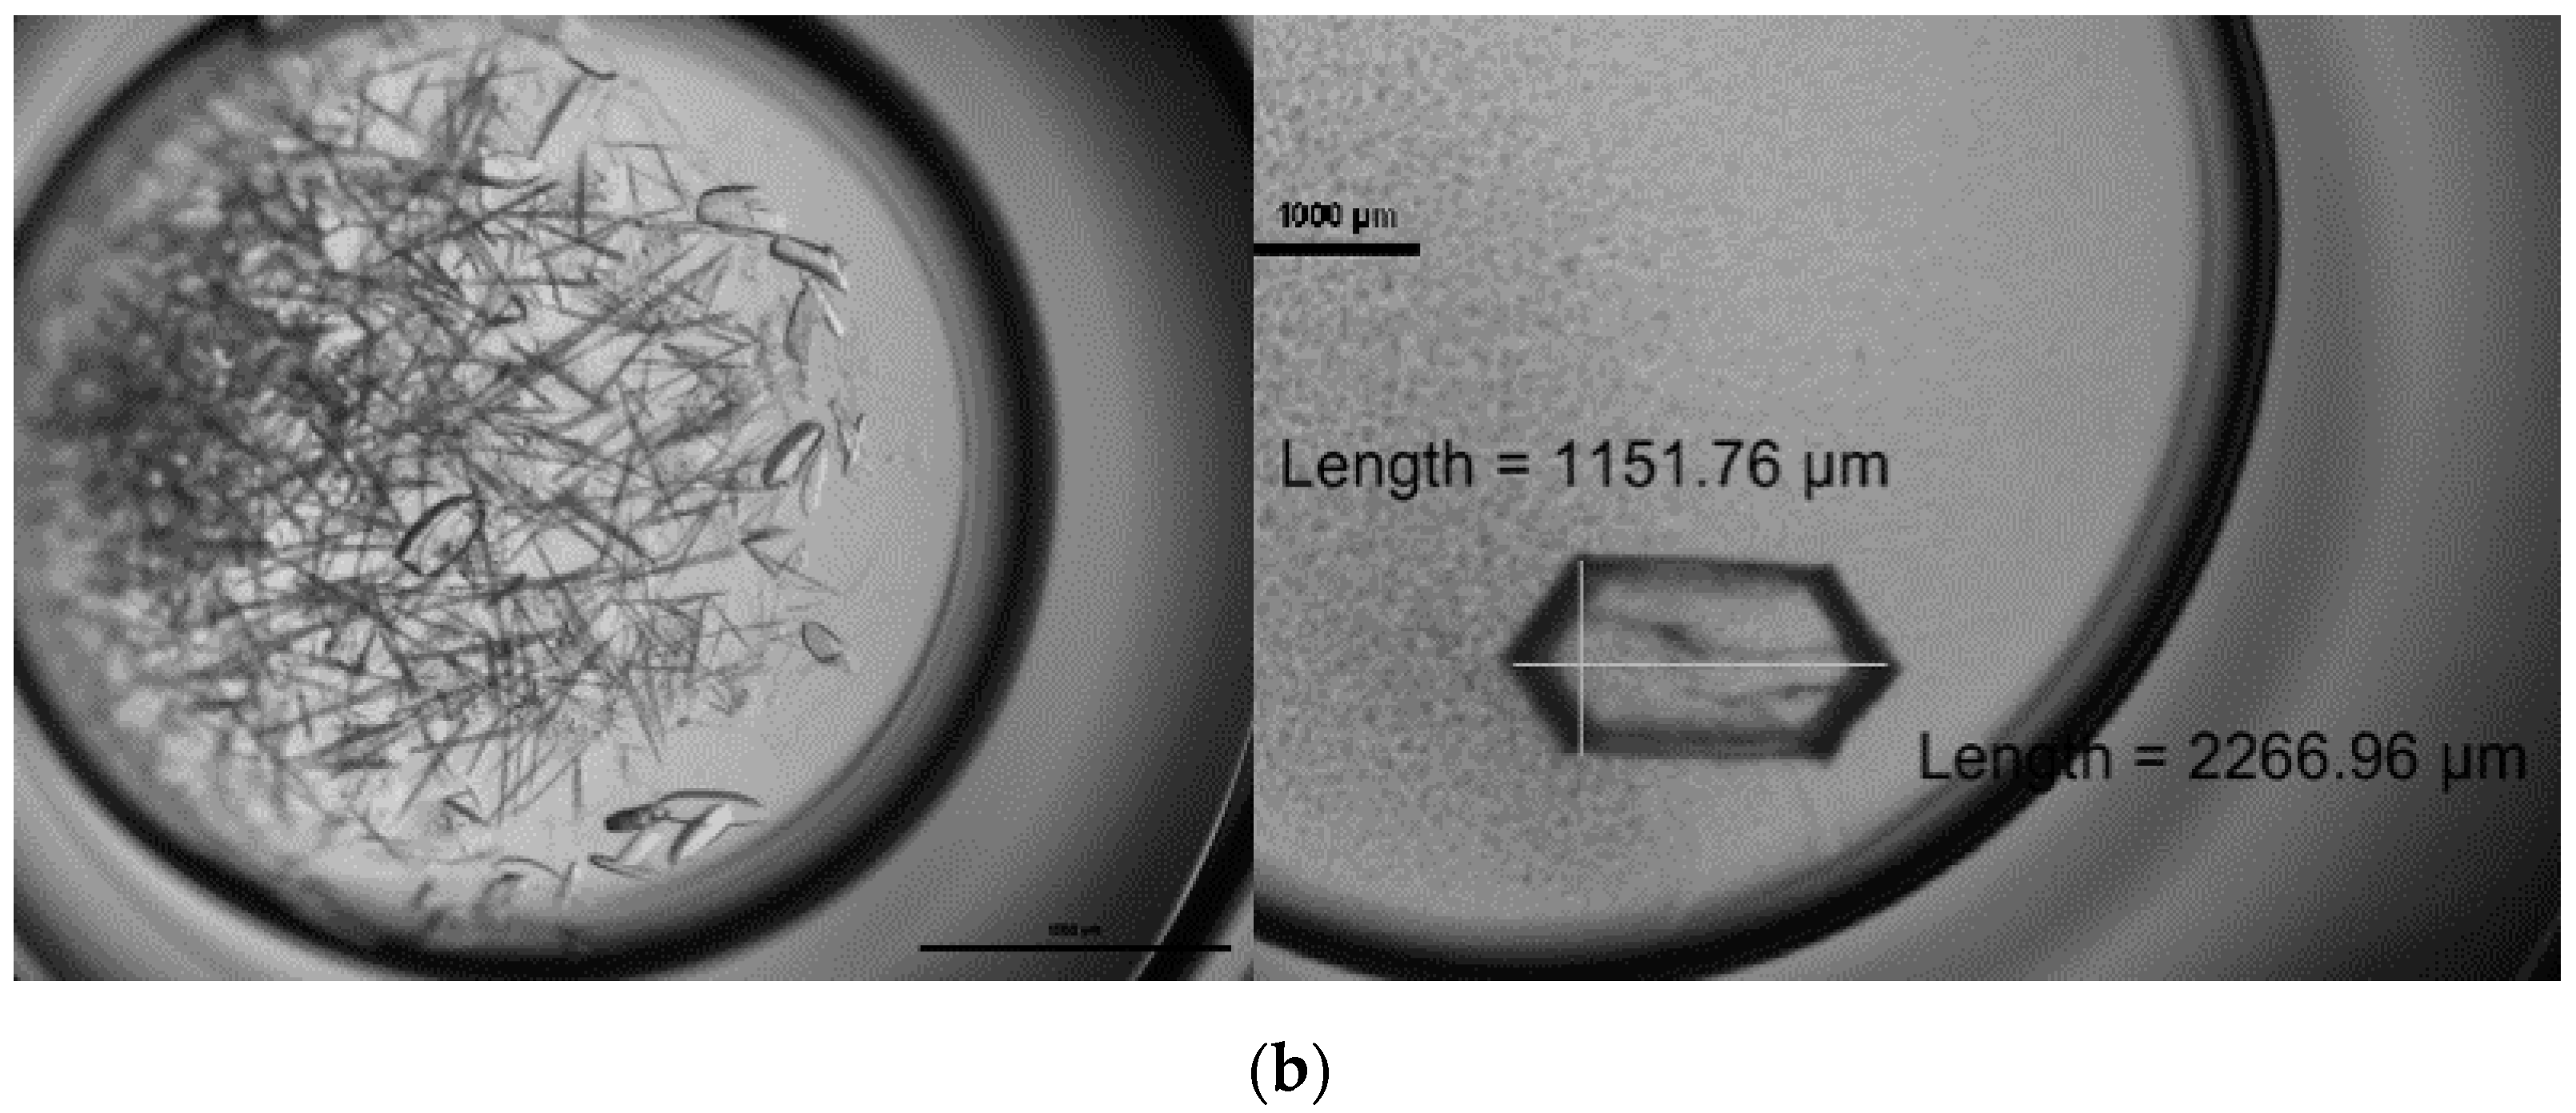
Figure 4.
HEWL crystal shapes with and without magnetic field. (a) Without magnetic field (0 T); (b) with magnetic field (200 mT).
Figure 4.
HEWL crystal shapes with and without magnetic field. (a) Without magnetic field (0 T); (b) with magnetic field (200 mT).


Figure 5.
Number of HEWL crystals with and without a magnetic field. (a) pH 5.0, (b) pH 5.5, (c) pH 6.0, (d) orthorhombic crystals, and (e) tetragonal crystals.
Figure 5.
Number of HEWL crystals with and without a magnetic field. (a) pH 5.0, (b) pH 5.5, (c) pH 6.0, (d) orthorhombic crystals, and (e) tetragonal crystals.

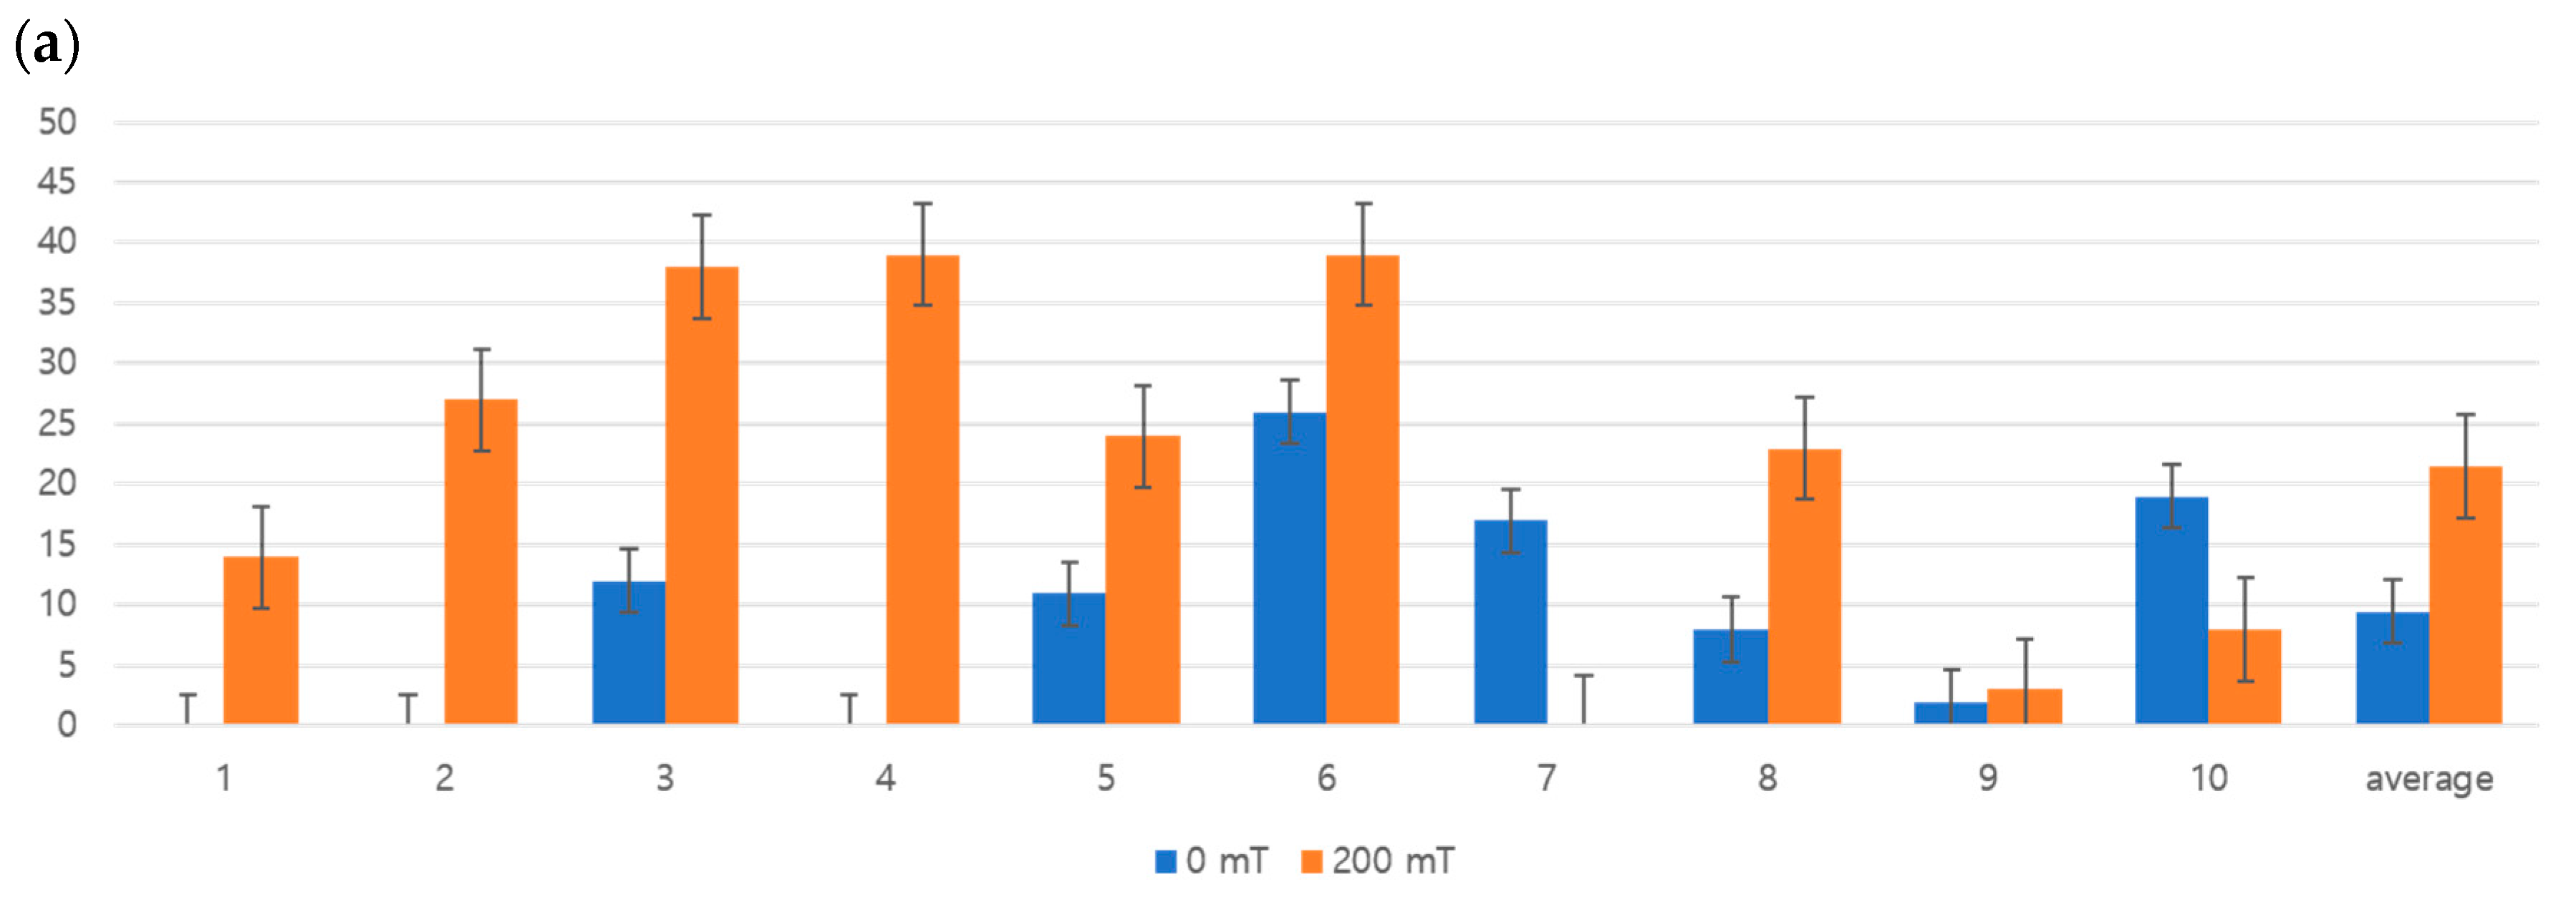
Figure 6.
Comparison of HEWL crystal growth under a magnetic field: number of crystallization screening hits under the magnetic field. (a) Number of crystals per well. (b) Number of crystals based on the ratio of protein solutions per reservoir. (c) Volume (a × b × c) of the crystals.
Figure 6.
Comparison of HEWL crystal growth under a magnetic field: number of crystallization screening hits under the magnetic field. (a) Number of crystals per well. (b) Number of crystals based on the ratio of protein solutions per reservoir. (c) Volume (a × b × c) of the crystals.

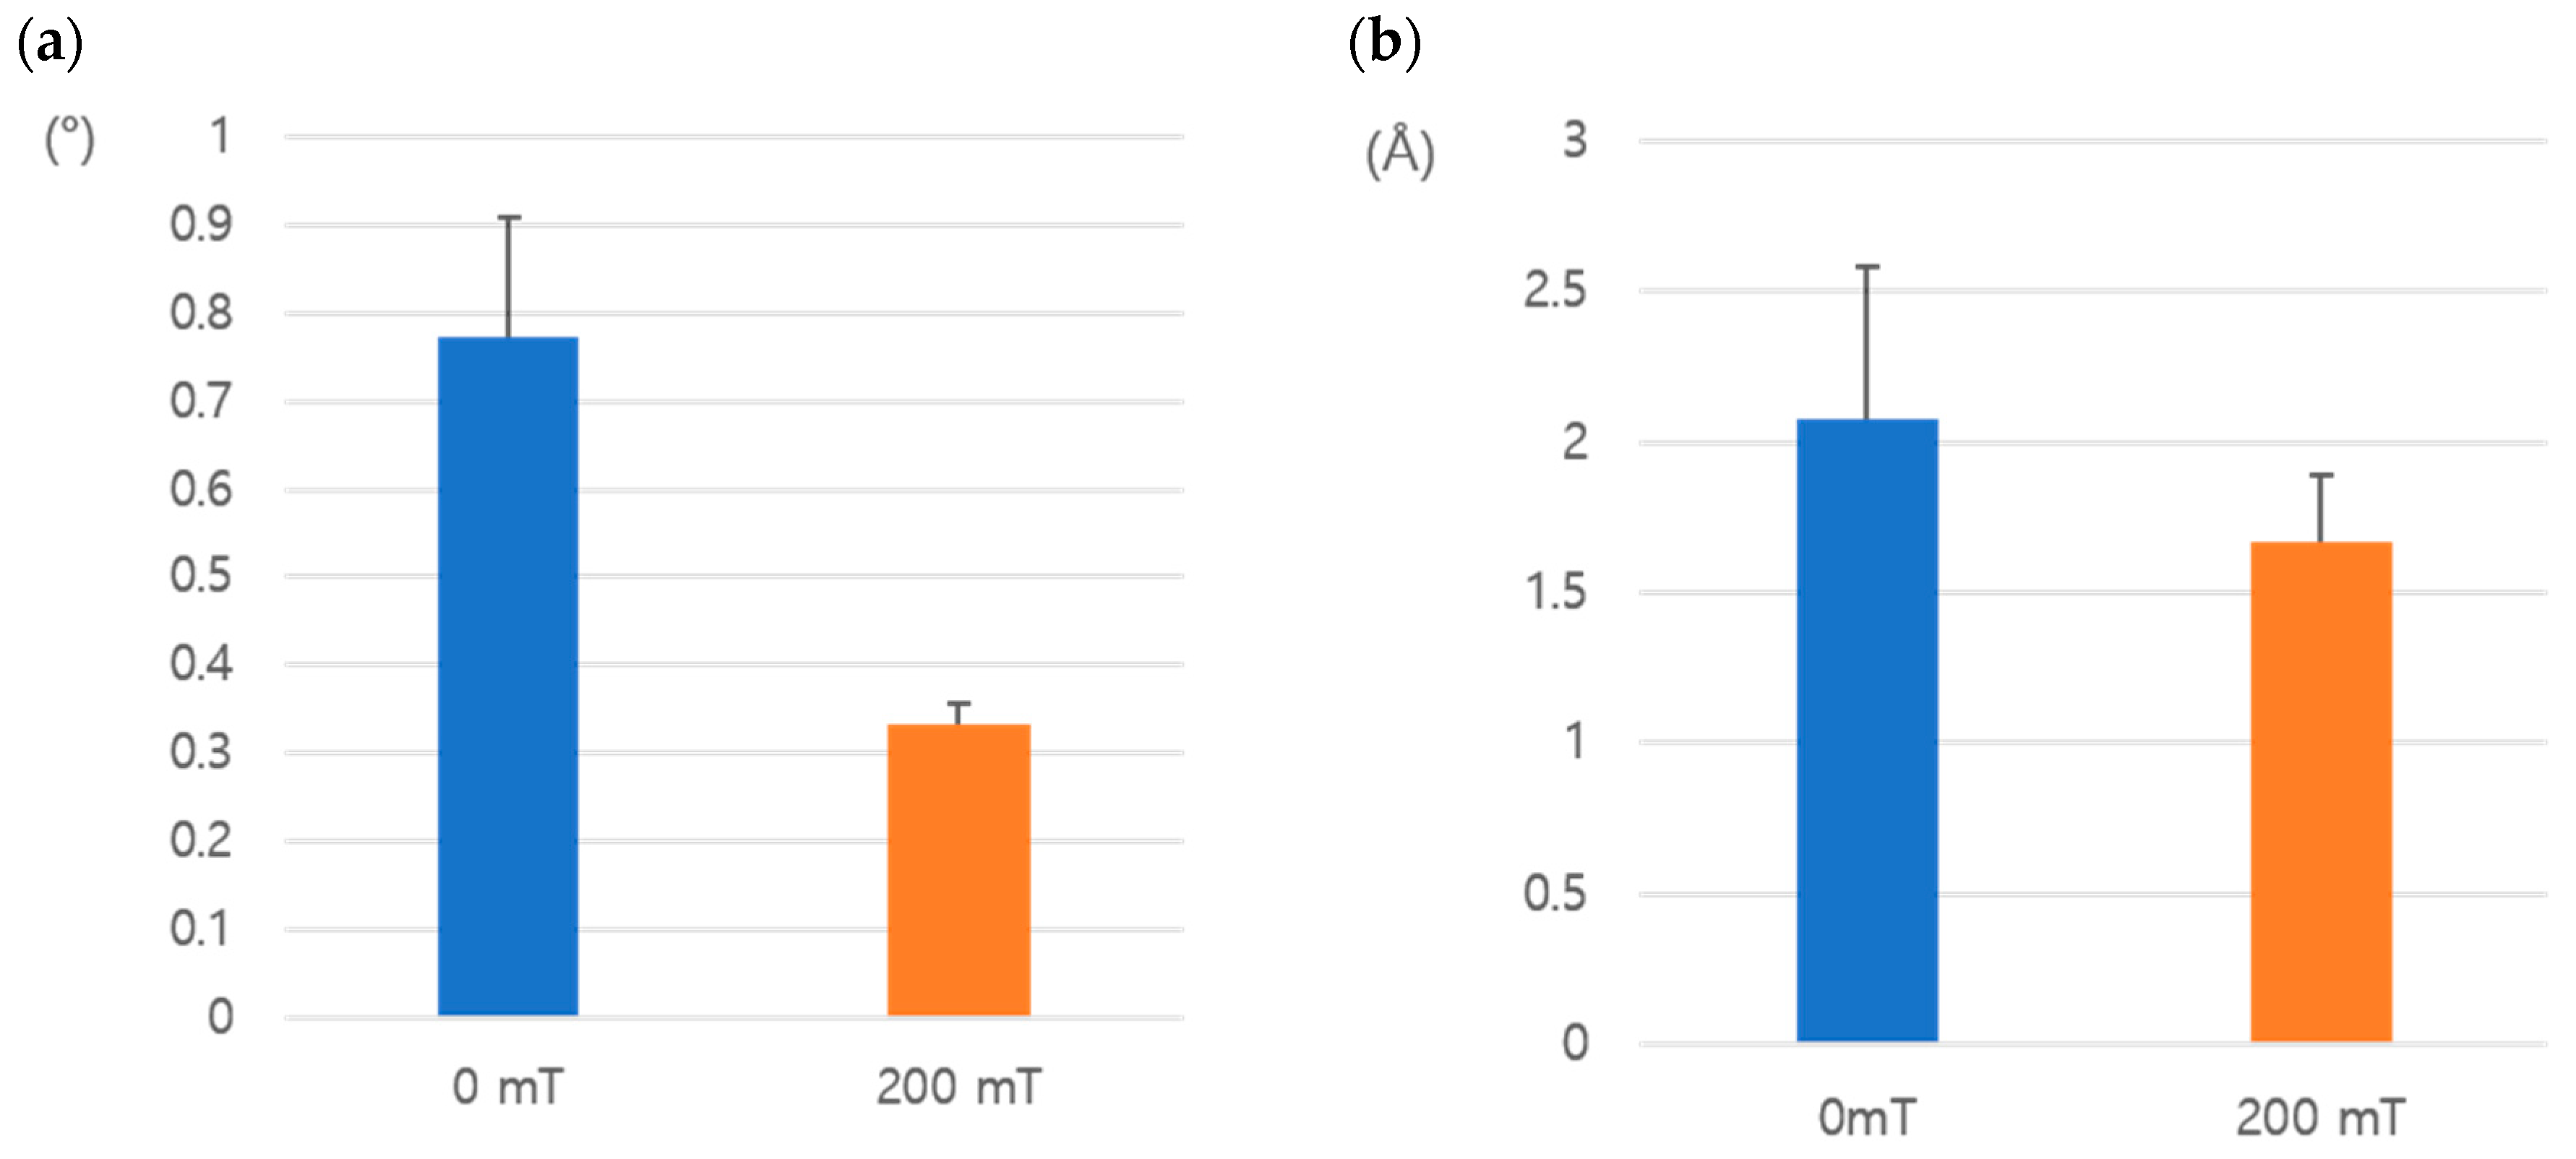
Figure 7.
Comparison of the mosaicity and resolution of HEWL: (a) mosaicity; (b) resolution. The number of collected data sets of crystals grown under 0 and 200 mT are 20 and 20, respectively.
Figure 7.
Comparison of the mosaicity and resolution of HEWL: (a) mosaicity; (b) resolution. The number of collected data sets of crystals grown under 0 and 200 mT are 20 and 20, respectively.

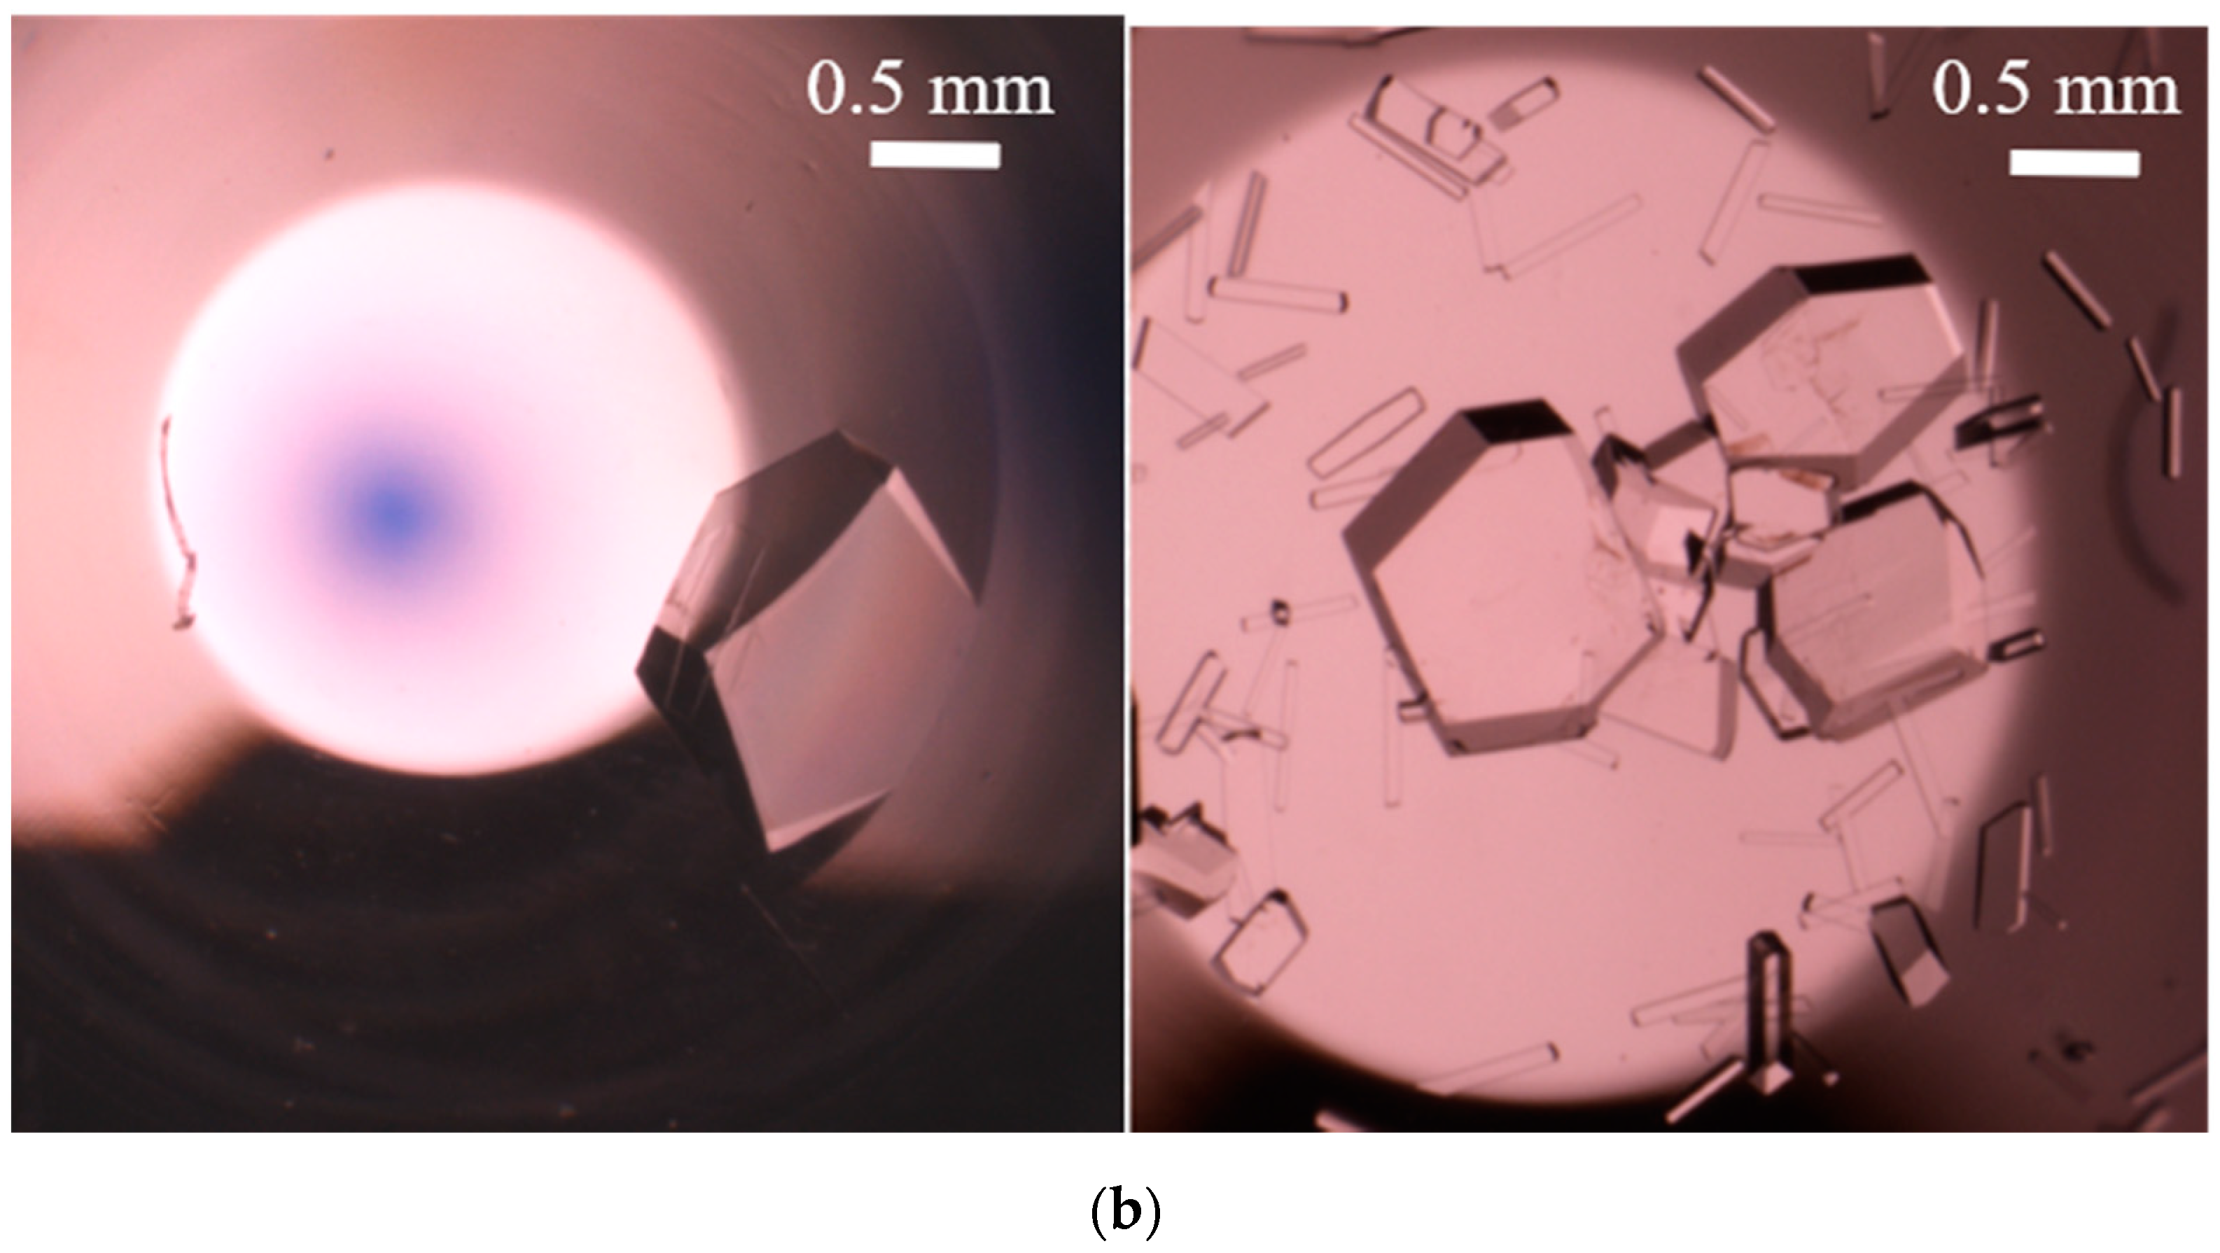
Figure 8.
The effect of a magnetic field on nucleation. Crystal growth (a) without and (b) with a magnetic field using a 96-well plate.
Figure 8.
The effect of a magnetic field on nucleation. Crystal growth (a) without and (b) with a magnetic field using a 96-well plate.


Figure 9.
Comparison of the ENR crystal growth under a magnetic field. Number of crystallization screening hits under the magnetic field. (a) Number of crystals per well. (b) Number of crystals based on protein solutions per reservoir ratio. (c) Volume (a × b × c) of the crystals.
Figure 9.
Comparison of the ENR crystal growth under a magnetic field. Number of crystallization screening hits under the magnetic field. (a) Number of crystals per well. (b) Number of crystals based on protein solutions per reservoir ratio. (c) Volume (a × b × c) of the crystals.


Figure 10.
Comparison of the mosaicity and resolution of the ENR: (a) mosaicity; (b) resolution. The number of collected data sets of crystals grown under 0 and 200 mT are 14 and 15, respectively.
Figure 10.
Comparison of the mosaicity and resolution of the ENR: (a) mosaicity; (b) resolution. The number of collected data sets of crystals grown under 0 and 200 mT are 14 and 15, respectively.

Figure 11.
HEWL neutron diffraction pattern determined using previous devices (in BIX-4, Japan). Resolution limit, 100−3.0 Å; and mosaicity, 1.0°.
Figure 11.
HEWL neutron diffraction pattern determined using previous devices (in BIX-4, Japan). Resolution limit, 100−3.0 Å; and mosaicity, 1.0°.


Table 1.
Summary of the X-ray diffraction data of the HEWL and ENR crystals grown with and without a magnetic field (values in parentheses represent the highest resolution shell).
Table 1.
Summary of the X-ray diffraction data of the HEWL and ENR crystals grown with and without a magnetic field (values in parentheses represent the highest resolution shell).
| Data Collection | Proteins | |||
|---|---|---|---|---|
| HEWL | ENR | |||
| Magnetic Strength (mT) | 0 | 200 | 0 | 200 |
| Diffraction source | 7A, PAL | 7A, PAL | 7A, PAL | 7A, PAL |
| Wavelength (Å) | 0.97935 | 0.97935 | 0.97933 | 0.97933 |
| Temperature (K) | 100 | 100 | 100 | 100 |
| Distance (mm) | 150 | 150 | 300 | 300 |
| Space group | P43212 | P43212 | P212121 | P212121 |
| a, b, c (Å) | 77.383 | 76.893 | 109.016 | 108.710 |
| 77.369 | 76.893 | 78.667 | 78.546 | |
| 37.032 | 36.975 | 113.883 | 119.951 | |
| α, β, γ (°) | 90.000 | 90.000 | 90.000 | 90.000 |
| 90.000 | 90.000 | 90.000 | 90.000 | |
| 90.000 | 90.000 | 90.000 | 90.000 | |
| Resolution range 1 (Å) (outer shell) | 50.0–1.78 | 50.0–1.08 | 50.0–2.56 | 50.0–2.27 |
| (1.81–1.78) | (1.10–1.08) | (2.60–2.56) | (2.31–2.27) | |
| No. of total reflections | 314,860 | 1,076,894 | 413,142 | 650,615 |
| Completeness (%) | 100 (100) | 93.3 (33.2) | 100 (99.9) | 100.0 (99.9) |
| 2 | 0.054 (0.115) | 0.089 (0.695) | 0.114 (0.315) | 0.139 (0.470) |
| 67.192 (22.444) | 36.846 (0.583) | 18.362 (5.500) | 21.567 (4.421) | |
| Mosaicity (°) | 0.622 | 0.333 | 0.650 | 0.398 |
| Redundancy | 14.4 (14.5) | 24.0 (2.0) | 7.6 (7.1) | 14.5 (11.5) |
1 In X-ray crystallography, the resolution is the smallest distance between the crystal lattice planes that is resolved in the diffraction pattern. 2, 〈Ihkl〉 is the average of symmetry-related observations of a unique reflection. The formula was originally proposed by Arndt, U.W., Crowther, R.A. and Mallet, J.F.W. [51].
Table 2.
Nucleation rate per drop with and without a magnetic field.
| Protein | Magnetic Field (mT) | Number of Nucleation (Average) | Increasing Rate |
|---|---|---|---|
| HEWL | 0 | 11.1 | +1.71 |
| 200 | 19.0 | ||
| ENR | 0 | 9.5 | +2.26 |
| 200 | 21.5 |
© 2020 by the authors. Licensee MDPI, Basel, Switzerland. This article is an open access article distributed under the terms and conditions of the Creative Commons Attribution (CC BY) license (http://creativecommons.org/licenses/by/4.0/).
Share and Cite
MDPI and ACS Style
Ryu, S.Y.; Oh, I.H.; Cho, S.J.; Kim, S.A.; Song, H.K. Enhancing Protein Crystallization under a Magnetic Field. Crystals 2020, 10, 821. https://0-doi-org.brum.beds.ac.uk/10.3390/cryst10090821
AMA Style
Ryu SY, Oh IH, Cho SJ, Kim SA, Song HK. Enhancing Protein Crystallization under a Magnetic Field. Crystals. 2020; 10(9):821. https://0-doi-org.brum.beds.ac.uk/10.3390/cryst10090821
Chicago/Turabian StyleRyu, Sun Young, In Hwan Oh, Sang Jin Cho, Shin Ae Kim, and Hyun Kyu Song. 2020. "Enhancing Protein Crystallization under a Magnetic Field" Crystals 10, no. 9: 821. https://0-doi-org.brum.beds.ac.uk/10.3390/cryst10090821
Note that from the first issue of 2016, this journal uses article numbers instead of page numbers. See further details here.