Top-Down Synthesis of a Lamivudine-Zidovudine Nano Co-Crystal


1
Division of Pharmaceutics, Faculty of Pharmacy, Rhodes University, Makhanda 6140, South Africa
2
Department of Pharmacy, DDT College of Medicine, Gaborone 0000, Botswana
3
Department of Chemistry, Faculty of Science, Rhodes University, Makhanda 6140, South Africa
*
Author to whom correspondence should be addressed.
Crystals 2021, 11(1), 33; https://0-doi-org.brum.beds.ac.uk/10.3390/cryst11010033
Submission received: 27 November 2020
/
Revised: 20 December 2020
/
Accepted: 25 December 2020
/
Published: 30 December 2020
(This article belongs to the Special Issue The Realm of Pharmaceutical Multicomponent Forms)
Abstract
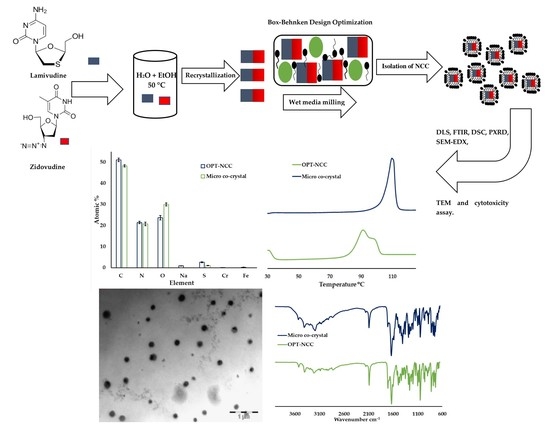
:Lamivudine (3TC) and zidovudine (AZT) are antiretroviral agents used to manage HIV/AIDS infection. A wet media milling top-down approach was used to develop and produce nano co-crystals of 3TC and AZT. Micro co-crystals were prepared by solvent evaporation and subsequently milled in the presence of two surfactants, viz., sodium lauryl sulfate (SLS) and α-tocopheryl polyethylene glycol succinate 1000 (TPGS 1000). Optimisation was undertaken using design of experiments (DoE) and response surface methodology (RSM) to establish and identify parameters that may affect the manufacturing of nano co-crystals. The impact of SLS and TPGS 1000 concentration, milling time, and number of units of milling medium on the manufacturing of nano co-crystals, was investigated. The critical quality attributes (CQA) monitored were particle size (PS), Zeta potential (ZP), and polydispersity index (PDI). Powder X-ray diffraction, Fourier transform infrared spectroscopy, differential scanning calorimetry, transmission electron microscopy, energy dispersive X-ray spectroscopy scanning electron microscopy, and cytotoxicity assays were used for additional characterization of the optimised nano co-crystal. The mean PS, PDI, and ZP of the optimised top-down nanocrystal were 271.0 ± 92.0 nm, 0.467 ± 0.073, and −41.9 ± 3.94 mV, respectively. In conclusion, a simple, inexpensive, rapid, and precise method of nano co-crystal manufacturing was developed, validated, and optimised using DoE and RSM, and the final product exhibited the target CQA.
1. Introduction
HIV/AIDS remains one of the most widespread diseases in the world with an estimated 37 million people living with HIV at the end of 2018, and approximately 1.8 million new infections are reported, annually [1]. Despite Sub-Saharan Africa being home to only 12% of the global population, it is the most affected by this pandemic with 71% of the global burden of HIV infections [2].
The only effective regimen for HIV treatment is highly active antiretroviral treatment (HAART), which requires the use of more than one class of antiretroviral (ARV) compound [3]. Lamivudine (3TC) and zidovudine (AZT) are ARVs used in combination with other molecules for the suppression of HIV to halt progression of HIV to AIDS [4,5,6]. The bioavailability of AZT is relatively poor due to low solubility, while hepatic first-pass metabolism of AZT necessitates frequent dosing to achieve therapeutic levels, often resulting in poor adherence to therapy, subsequently leading to poor clinical outcomes [7,8,9]. Furthermore, 3TC has a short biological half-life, requiring frequent doses to achieve therapeutic concentrations, in addition to exhibiting poor blood–brain barrier permeation capacity [10].
Co-crystallisation is the production of crystalline entities generated by the combination of two or more different molecular compounds by weak noncovalent intermolecular interactions [11] such as hydrogen bonding, π-π stacking, halogen bonding, amongst others [12]. The pharmaceutical industry has benefitted from this technology as the properties of active pharmaceutical ingredients (APIs) can be attenuated using complementary molecules known as co-formers (CF) [6]. An alternative approach used for mitigating the properties of crystalline APIs is the use of nano-downsizing, which has been applied in synthetic chemistry, materials science, and medicine [13]. Nanocrystals that are solely comprised of organic compounds are relatively unexplored, in spite of the variety of physicochemical properties that exist due to the diversity of functional group characteristics [14]. A co-crystal of nanometre dimensions may be referred to as a nano co-crystal (NCC) and may display similar advantages as those associated with co-crystals and nanocrystals [15].
Nanocrystals and nano co-crystals (NCC) are generally prepared using two approaches, viz., a top-down technique using shear forces to reduce the particle size from micrometre to nanometre dimensions [16,17] or a bottom-up approach in which crystal growth is inhibited by use of a suitable stabiliser(s) to ensure nanometre dimensions are retained [18,19].
During wet media milling of an API, size reduction occurs when a coarse aqueous suspension with dispersed micrometre sized crystals of API is milled with a solution of stabiliser(s) in the presence of hard beads used as the milling medium. The mechanical attrition on the API particles occurs due to the milling media, resulting in a decrease in particle size of the API. Typically, hard ceramic materials such as zirconium oxide or yttrium stabilised polystyrene beads are used as the milling medium to minimise wear of the beads and/or the equipment [20,21,22,23,24]. The beads wear according to their structure and hardness in addition to the hardness and shape of the material undergoing milling [25]. By operating in an optimal energy input area, with qualified materials, wear equipment can be minimised [21].
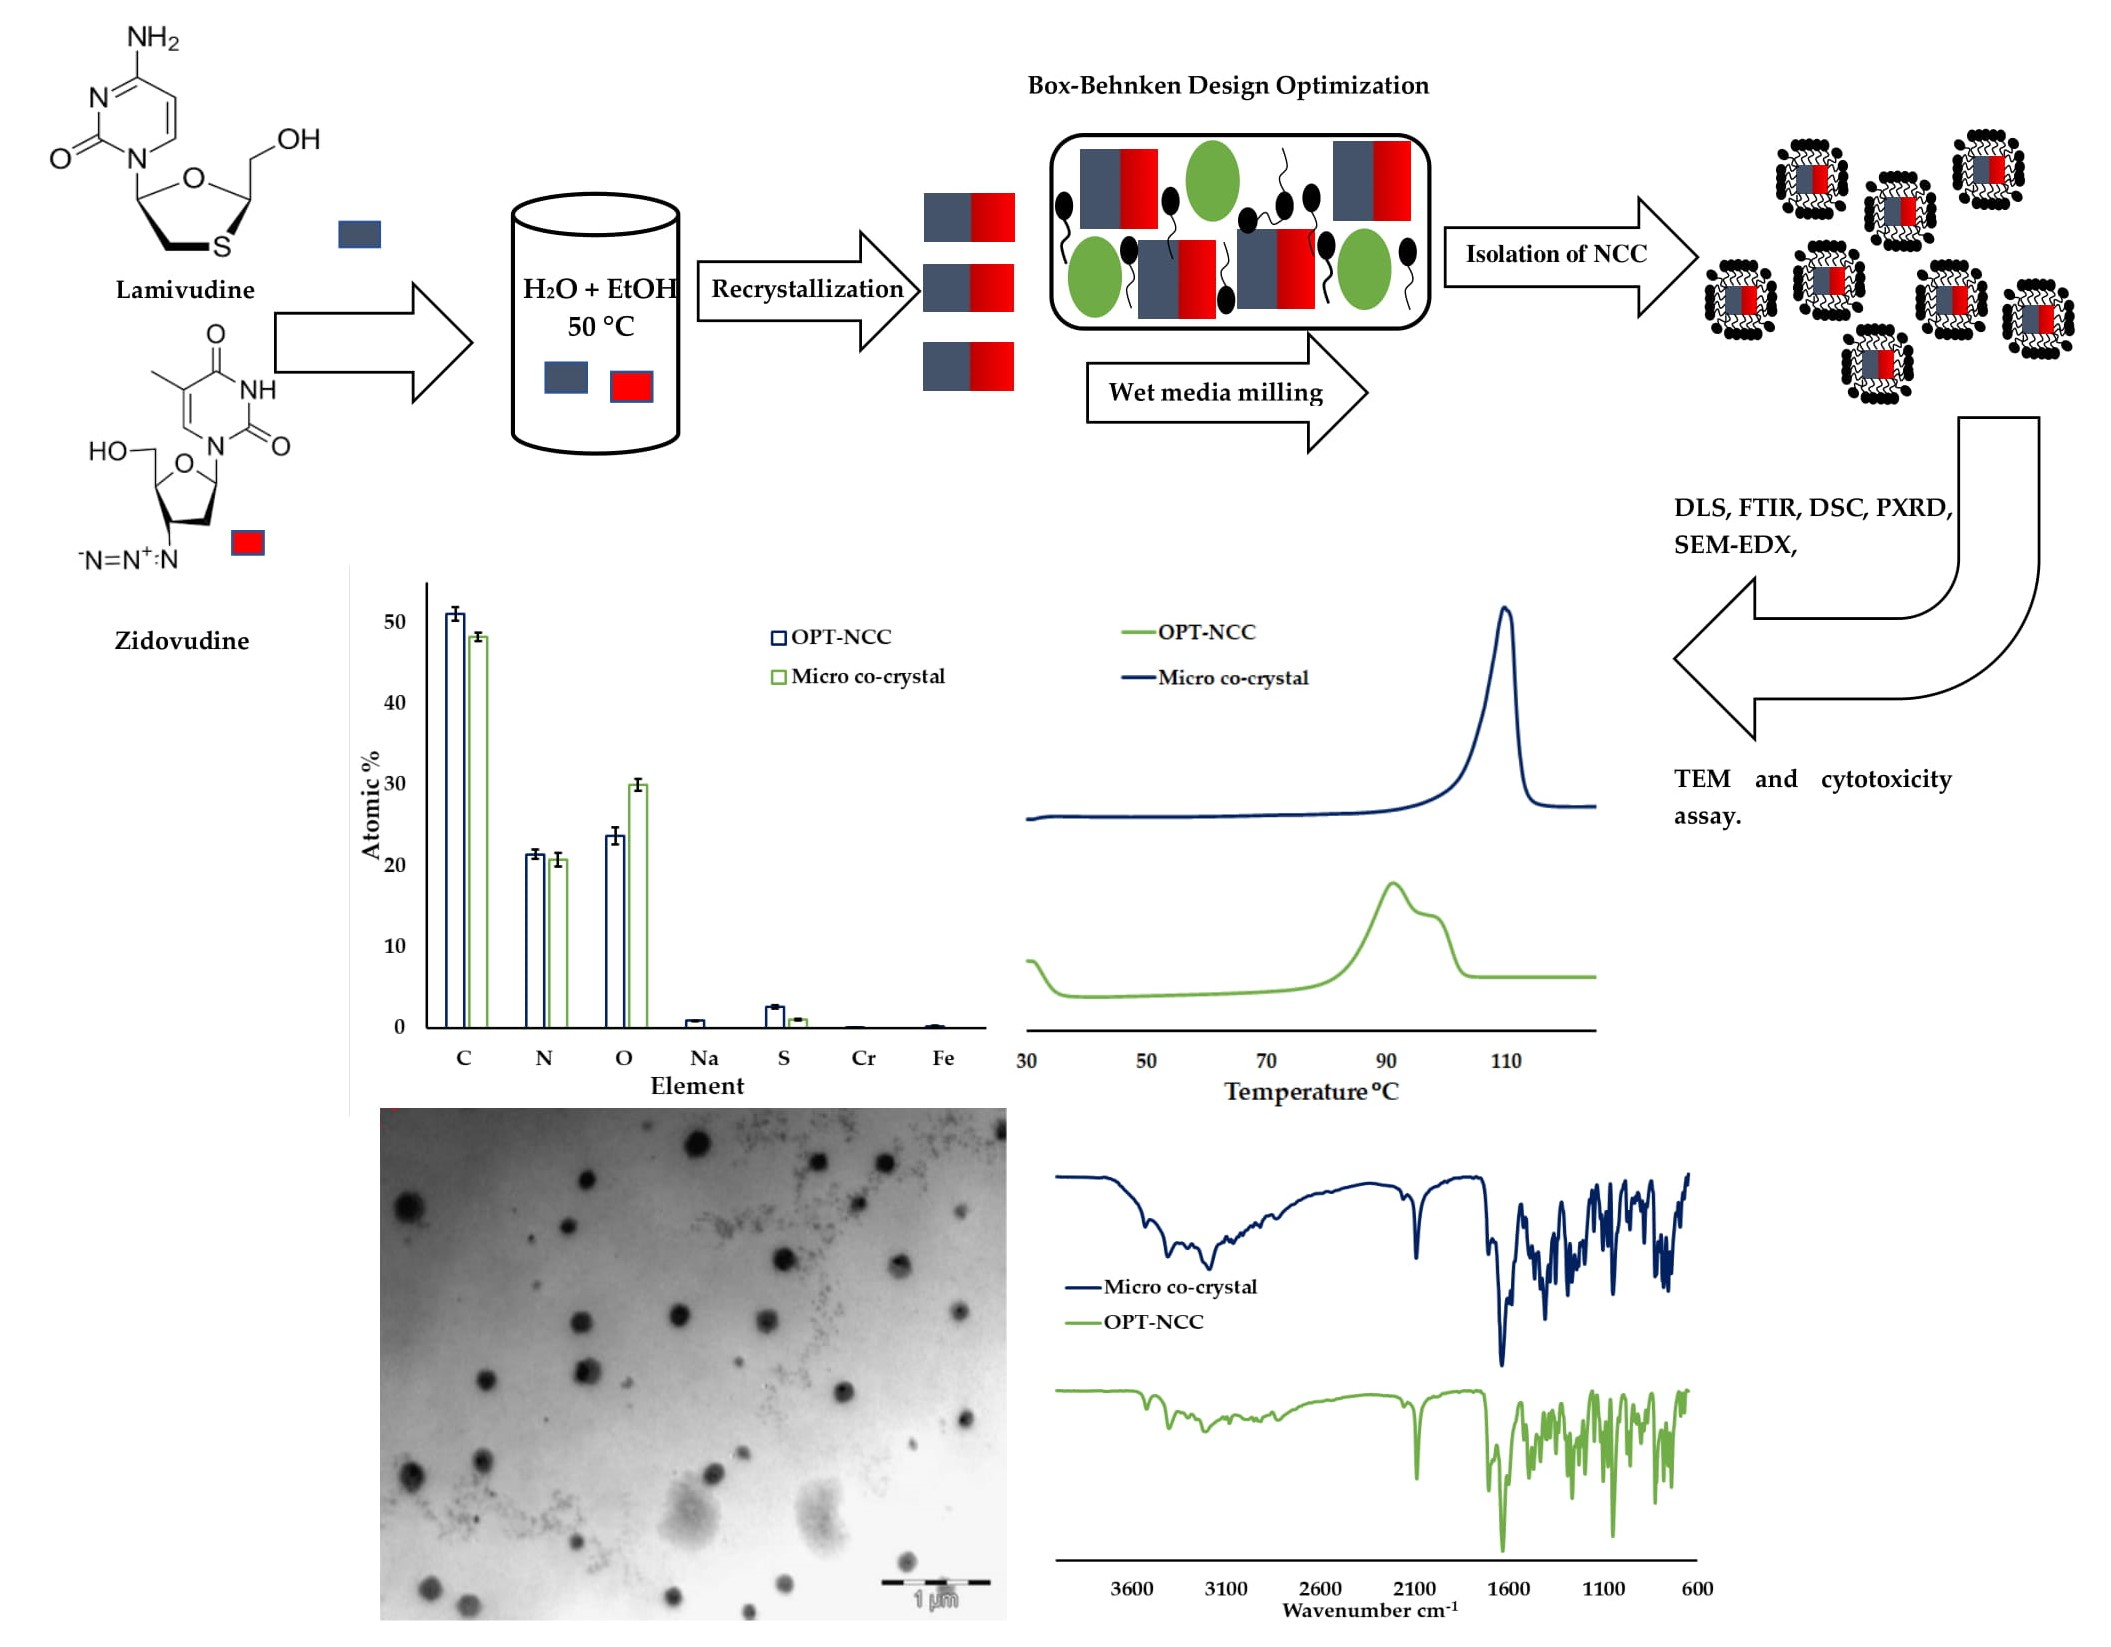
Size reduction in media milling is dependent on the number and intensity of collisions between API particles and milling beads used [26,27]. In nano wet media milling, crystals of APIs collide with milling media, other API particles, and the walls of the milling chamber [17]. Most of the forces responsible for particle reduction in media milling, are due to API particle-bead interactions, with particle–particle interactions making a minor contribution (Figure 1). With jet-milling and high-pressure homogenisation (HPH), particle–particle and particle–wall interactions have a significant impact on size reduction forces [28].
One of the benefits of nano wet media milling is that poorly aqueous soluble APIs can be easily modified to form nanosuspensions, which is a significant advantage. Furthermore, the process is easily scalable with minimal batch-to-batch variability and a narrow size distribution (polydispersity index (PDI)) of the final product [29]. The major shortcomings of nano wet media milling include possible generation of residues of milling media in the final product due to wear of the milling media [29] and formation of amorphous materials and/or polymorphic changes to the API material [30,31]. In particular, since contamination may arise due to wear of milling medium components when long milling times are used, the milling devices, particularly milling pearls/beads, must be manufactured from highly resistant materials and may be coated to minimize or avoid erosion [32].
Changes in physical form or amorphisation of an API is a further concern during milling [33]. An increase in lattice vibrations due to mechanical pressure applied above the critical pressure value destabilises the crystal lattice and results in an increase in number of imperfections and ultimate transformation of the API into an amorphous form [34]. Therefore, the formation of amorphous regions during the milling is a consequence of the properties of individual API(s), stabiliser(s), possible interactions between the materials, and process parameters used. However, unlike dry milling processes, during wet milling of crystalline API the solvent may act as an inhibitor to the formation of amorphous material, due to the reduction in glass-transition temperature of the materials [35].
The manufacture of nano co-crystals using wet media milling has been successful [15,36,37] and an itraconazole-adipic acid nano co-crystal suspension with a particle diameter of 549 nm was prepared by wet milling of a physical mixture of itraconazole and adipic acid with Tween® 80. The dissolution and oral absorption of the nano co-crystal was equivalent or greater than that observed for a formulation of the amorphous form [36].
Suspensions of nano co-crystals of carbamazepine, indomethacin, and furosemide with mean diameters <300 nm were prepared by wet milling of co-crystals with hydroxypropyl methylcellulose (HPMC) and sodium lauryl sulphate (SLS), which were used as stabilisers [15].
A conventional top-down HPH method of manufacturing was used to produce nano co-crystals of baicalein and nicotinamide. The resulting NCC were evaluated in vitro and in vivo to assess if the dissolution and bioavailability of baicalein had been improved [37].
A case-by-case optimisation approach must be used when producing nanosuspension formulations with the aid of a factorial design, following screening studies that are typically used to establish the effects of critical formulation parameters (CFP) and process parameters (CPP) on the quality target product profile (QTPP). The choice of stabiliser(s) is based on the biocompatibility of the surfactants/polymers [38] and their ability to provide suitable wettability [39]. Instead of measuring individual product qualities and monitoring all process parameters, a quality by design (QbD) approach can be used to build quality into products and processes throughout the entire manufacturing chain [40,41,42]. The use of QbD for production of nanocrystals and NCC of API, stabiliser(s), and manufacturing processes are initially identified, after which critical quality attributes (CQA) of the product are defined prior to design space elucidation [43].
Macrophages are cell carriers of HIV in humans [44,45,46], and targeting macrophages through use of nanotechnological approaches is considered a useful route for more efficient treatment of HIV and for halting progression of the disease to AIDS [47,48,49,50]. Macrophages are known to preferentially target negatively charged particles [51] of <1000 nm in size [52,53,54].
The use of nanocrystals and the potential of NCC to improve the circulation half-life of an API following parenteral administration, consequently improves bioavailability [47,55]. Therefore, the main purpose of this investigation was to develop and optimise a surface-modified nano co-crystal formulation, using wet media milling within a QbD approach using design of experiments (DoE) and response surface methodology (RSM). The NCC produced have the potential to improve the aforementioned shortcomings of AZT and 3TC while providing an alternative approach to the previously reported techniques used to produce antiretroviral NCC [56]. The resultant NCC may have the potential to be formulated into a drug delivery system, downstream, for the delivery of 3TC and AZT, whilst improving the side effect profile, using a patient-friendly dosing regimen. Following initial screening studies performed in our laboratories [57], the surfactants α-tocopheryl polyethylene glycol succinate 1000 (TPGS 1000) and SLS were used during formulation optimisation studies. Specifically, SLS and TPGS 1000 concentration, milling time, and number of beads of the same size were key parameters evaluated during the optimisation process.
2. Materials and Methods
2.1. Materials
AZT and 3TC were purchased from China Skyrun Co. Ltd. (Taizhou, China). Sodium lauryl sulphate (SLS) and α-tocopheryl polyethylene glycol succinate 1000 (TPGS 1000) were purchased from Merck (Johannesburg, South Africa). Human cervix adenocarcinoma (HeLa) cells were purchased from Cellonex® (Separation Scientific SA (Pty) Ltd, Pretoria, South Africa) and Dulbecco’s Modified Eagle Medium (DMEM) was purchased from (Lonza Group AG, Basel, Switzerland). An in-house modified Makita-4329K jigsaw (Makita Corporation, Sumiyoshicho, Japan) was used as the actuator and 5.5 mm ± 0.5 mm diameter stainless-steel balls of 850 mg ± 2 mg in weight were used as the milling media.
HPLC grade methanol (MeOH) was purchased from Honeywell Burdick and Jackson™ (Anatech Instruments, Johannesburg, South Africa). Ultrapure water with an 18.2 mΩ resistivity at 25 °C was prepared by reverse osmosis using a RephiLe® Direct-Pure Ultra-Pure Reverse Osmosis water system (Microsep® Johannesburg, South Africa). The water was filtered through a RephiDuo® H PAK de-ionisation cartridge and RephiDuo® PAK polishing cartridge prior to harvesting through a 0.22 µm PES (polyethersulfone) high flux capsule filter (Microsep® Johannesburg, South Africa), prior to use.
2.2. Methods
2.2.1. Co-Crystal Manufacture
Co-crystals were manufactured using a previously described method [57] with slight modification. Co-crystals were manufactured by weighing 5.725 g of 3TC and 6.675 g of AZT using a Mettler Toledo AG 135 (Greifensee, Switzerland) electronic balance that were then dissolved in 80 ml water and 50 ml ethanol (EtOH), respectively, after which the mixture was stirred at 50 °C using a LabconTM model MSH 10 magnetic stirrer (Maraisburg, South Africa) for sixty minutes prior to storing at 22 °C for 48 h to facilitate co-crystallisation. The resultant co-crystals were harvested and dried at 30 °C for a further 12 h prior to nanosizing and evaluation.
2.2.2. NCC Manufacture
NCC were manufactured with a top-down method, more specifically, wet media milling using an in-house modified Makita-4329K jigsaw (Makita Corporation, Sumiyoshicho, Japan) as the actuator.
A 115 mg aliquot of the harvested or dried co-crystal was accurately weighed using a Mettler Toledo AG 135 electronic balance (Greifensee, Switzerland) and placed in a 1.5 ml stainless steel milling chamber. The volume of surfactant solution (1 ml) and different % w/v TPGS 1000 and SLS concentrations as defined by the Box–Behnken design (BBD) were added to the chamber. Stainless-steel balls of 5.5 mm ± 0.5 mm diameter and 850 mg ± 2 mg weight were used in quantities of 1, 2, or 3 balls at a time with milling times of 10, 20, or 30 minutes at a constant milling speed of 3900 rpm (65 Hz).
2.2.3. Optimisation of Electrosteric NCC (OPT-NCC).
A Box–Behnken design (BBD) generated with version 11 Design Expert® software (Stat-Ease Inc., Minneapolis, Minnesota, USA) was used for the optimisation of formulation variables and process parameters for the production of NCC by wet media milling. Four independent input factors, viz., number of milling balls, milling time, and SLS and TPGS 1000 concentrations were established as critical factors affecting the CQA of the NCC. The particle size (PS), PDI, and Zeta potential (ZP) of the NCC were monitored after conducting BBD experiments as summarised in Table 1. In an effort to reduce bias, all experiments were performed in triplicate (n = 3) in a randomised manner.
2.2.4. Dynamic Light Scattering
The ZP, PS, and PDI were measured using a Nano-ZS 90 Zetasizer (Malvern Instruments, Worcestershire, United Kingdom). The PS and PDI was determined by photon correlation spectroscopy (PCS) at a scattering angle of 90° at a temperature of 25 °C. An aliquot (30 μl) of the NCC dispersion was diluted with 10 ml HPLC-grade water and transferred to a 10 × 10 × 45 mm polystyrene cell, and the PS and PDI were determined immediately.
Laser Doppler anemometry (LDA) was used to determine the ZP of the NCC, and dilute samples were prepared for analysis as described, prior to placing them into folded polystyrene capillary cells before measurement in replicate (n = 6).
2.2.5. Formulation Optimisation
Several different methods can be applied for the optimisation of CFP and CPP, however, numerical optimisation is a comprehensive and effective approach for any continuous optimisation process [58] and for locating a point in space that maximises the desirability function, while modifying the characteristics of a target by altering the significance of that target [59]. To produce nanosuspensions with the target QTPP, numerical optimisation was undertaken using version 11 Design Expert® software (Stat-Ease Inc., Minneapolis, Minnesota, United States of America) to identify optimum formulation and process parameters that would yield CQA suitable for macrophage targeting and maximize the stability of the product produced. A summary of the formulation parameters used for optimisation of nano co-crystals are listed in Table 2.
The identified parameters were concentration of TPGS 1000 of 1.50% w/v, SLS of 1.00% w/v when using 2 milling balls and a milling time of 30 minutes. The desired target level for each input variable and associated predicted response for PS, PDI, and ZP are summarised in Table 2.
2.2.6. Characterisation of Optimised NCC
FTIR Spectroscopy
Approximately 5 mg of powder was placed onto a diamond crystal of a Model 100 Spectrum FTIR ATR Spectrophotometer (PerkinElmer, Waltham, MA, USA). The spectra that were generated were analysed over the wavenumber range of 4000–650 cm−1 at a rate of 4 cm−1 in replicate (n = 5) using version 4.00 Peak® Spectroscopy software (Operant LLC, Burke, Virginia, USA).
Differential Scanning Calorimetry (DSC)
Thermal characteristics were studied using a DSC 6000 PerkinElmer Differential Scanning Calorimeter (Waltham, Massachusetts, USA) and the data generated were analysed using version 11 Pyris™ Manager Software (PerkinElmer, Waltham, Massachusetts, United States of America). Accurately weighed samples (2–5 mg) were placed into an aluminium pan, crimped, and heated at the scanning rate of 10 °C/ min over a temperature range of 30 to 150 °C under nitrogen. All DSC analyses were conducted in triplicate (n = 3), under a nitrogen atmosphere purged at a flow rate of 20 ml/min.
Powder X-ray Diffraction (PXRD)
X-ray powder diffraction pattern data were collected using a Bruker D8 Discover diffractometer (Billerica, Massachusetts, USA) equipped with a proportional counter, Cu-Kα radiation of λ = 1.5405 Å, and a nickel filter. Samples were placed onto a silicon wafer slide and measured using a generator setting of 30 kV and current of 40 mA. Data was collected in triplicate, in the range of 2θ = 10° to 50° at a scanning rate of 1.5° min−1. The X-ray diffraction data were treated using evaluation curve fitting (Eva) software and the baseline was corrected by subtracting a spline function fitted to the curved background.
Transmission Electron Microscopy (TEM)
The OPT-NCC sample was prepared by placing a drop of the dispersion on a 400-mesh copper grid and then placing the grid onto a piece of Whatman® 110 filter paper (Maidstone, UK) to remove any excess liquid. The sample was allowed to dry overnight at 22 °C after which it was visualised using a Zeiss Libra® 120 TEM (Carl Zeiss AG, Munich, Germany).
Energy Dispersive X-ray Spectroscopy Scanning Electron Microscopy (SEM-EDX)
A Vega® Scanning Electron Microscope (TESCAN, Brno, Czechia) fitted with an INCA PENTA FET was used to determine the elemental composition of the OPT-NCC and reference material by dusting approximately 1 mg of the sample onto a graphite plate and irradiating it at an accelerated voltage of 20 kV (n = 3).
In Vitro Cytotoxicity
For the culture of HeLa cells, DMEM was supplemented with 10% w/w foetal calf serum and a cocktail of penicillin/streptomycin/amphotericin at 37 °C in a 5% CO2 incubator. HeLa cells were transferred to 96-well plates at a cell density of 1 x 10⁴ cells per well in 150 µL culture medium and then grown overnight.
The test compounds were incubated with the cells for an additional forty-eight h in a concentration of 50 µM. Cell viability was determined by adding 20 µl 0.54 mM resazurin in PBS to the wells and culturing for an additional 2–4 h. A SpectraMax® M3 plate reader (Molecular Devices, San Jose, CA, USA) was used to establish the numbers of cells that survived treatment by reading resorufin fluorescence at an excitation wavelength of 560 nm and emission wavelength of 590 nm. Fluorescence readings for individual wells were converted to percent (%) cell viability and compared to the average readings observed for untreated control wells. Plots of % cell viability vs. log[compound] were used to determine IC50 values by non-linear regression using version 5.02 GraphPad Prism (GraphPad Holdings LLC, La Jolla, CA, USA).
AZT, 3TC, the optimised NCC, and a physical mixture of AZT and 3TC were tested in a stoichiometrically equivalent ratio, the same as that used to produce the NCC and micro co-crystals.
3. Results and Discussion
A summary of the input variables used to optimise the manufacturing of NCC identified using the BBD are summarised in Table 3. The data reveal that PS is primarily affected by the combined effects of milling time, number of milling balls, and concentration of surfactant used. The ZP of the nanosuspension was directly related to the amount of SLS used, whereas the PDI was not affected by any of the input variables investigated. The particle size is reported as an intensity distribution and z-average.
3.1. Formulation Development
3.1.1. Particle Size (PS)
The BBD data generated suggest a quadratic model best describes the effect on particle size. The relationship between the coded factors and particle size was assessed using Equation (1) and 3D response surface plots.
PS = 62.81A + 67.17B − 330.43C + 12.98D − 217.70AB − 139.38AC + 109.00AD − 157.00BC + 127.00BD − 142.55CD + 315.14A2 + 39.10B2 + 144.01C2 + 47.42D2 + 289.3
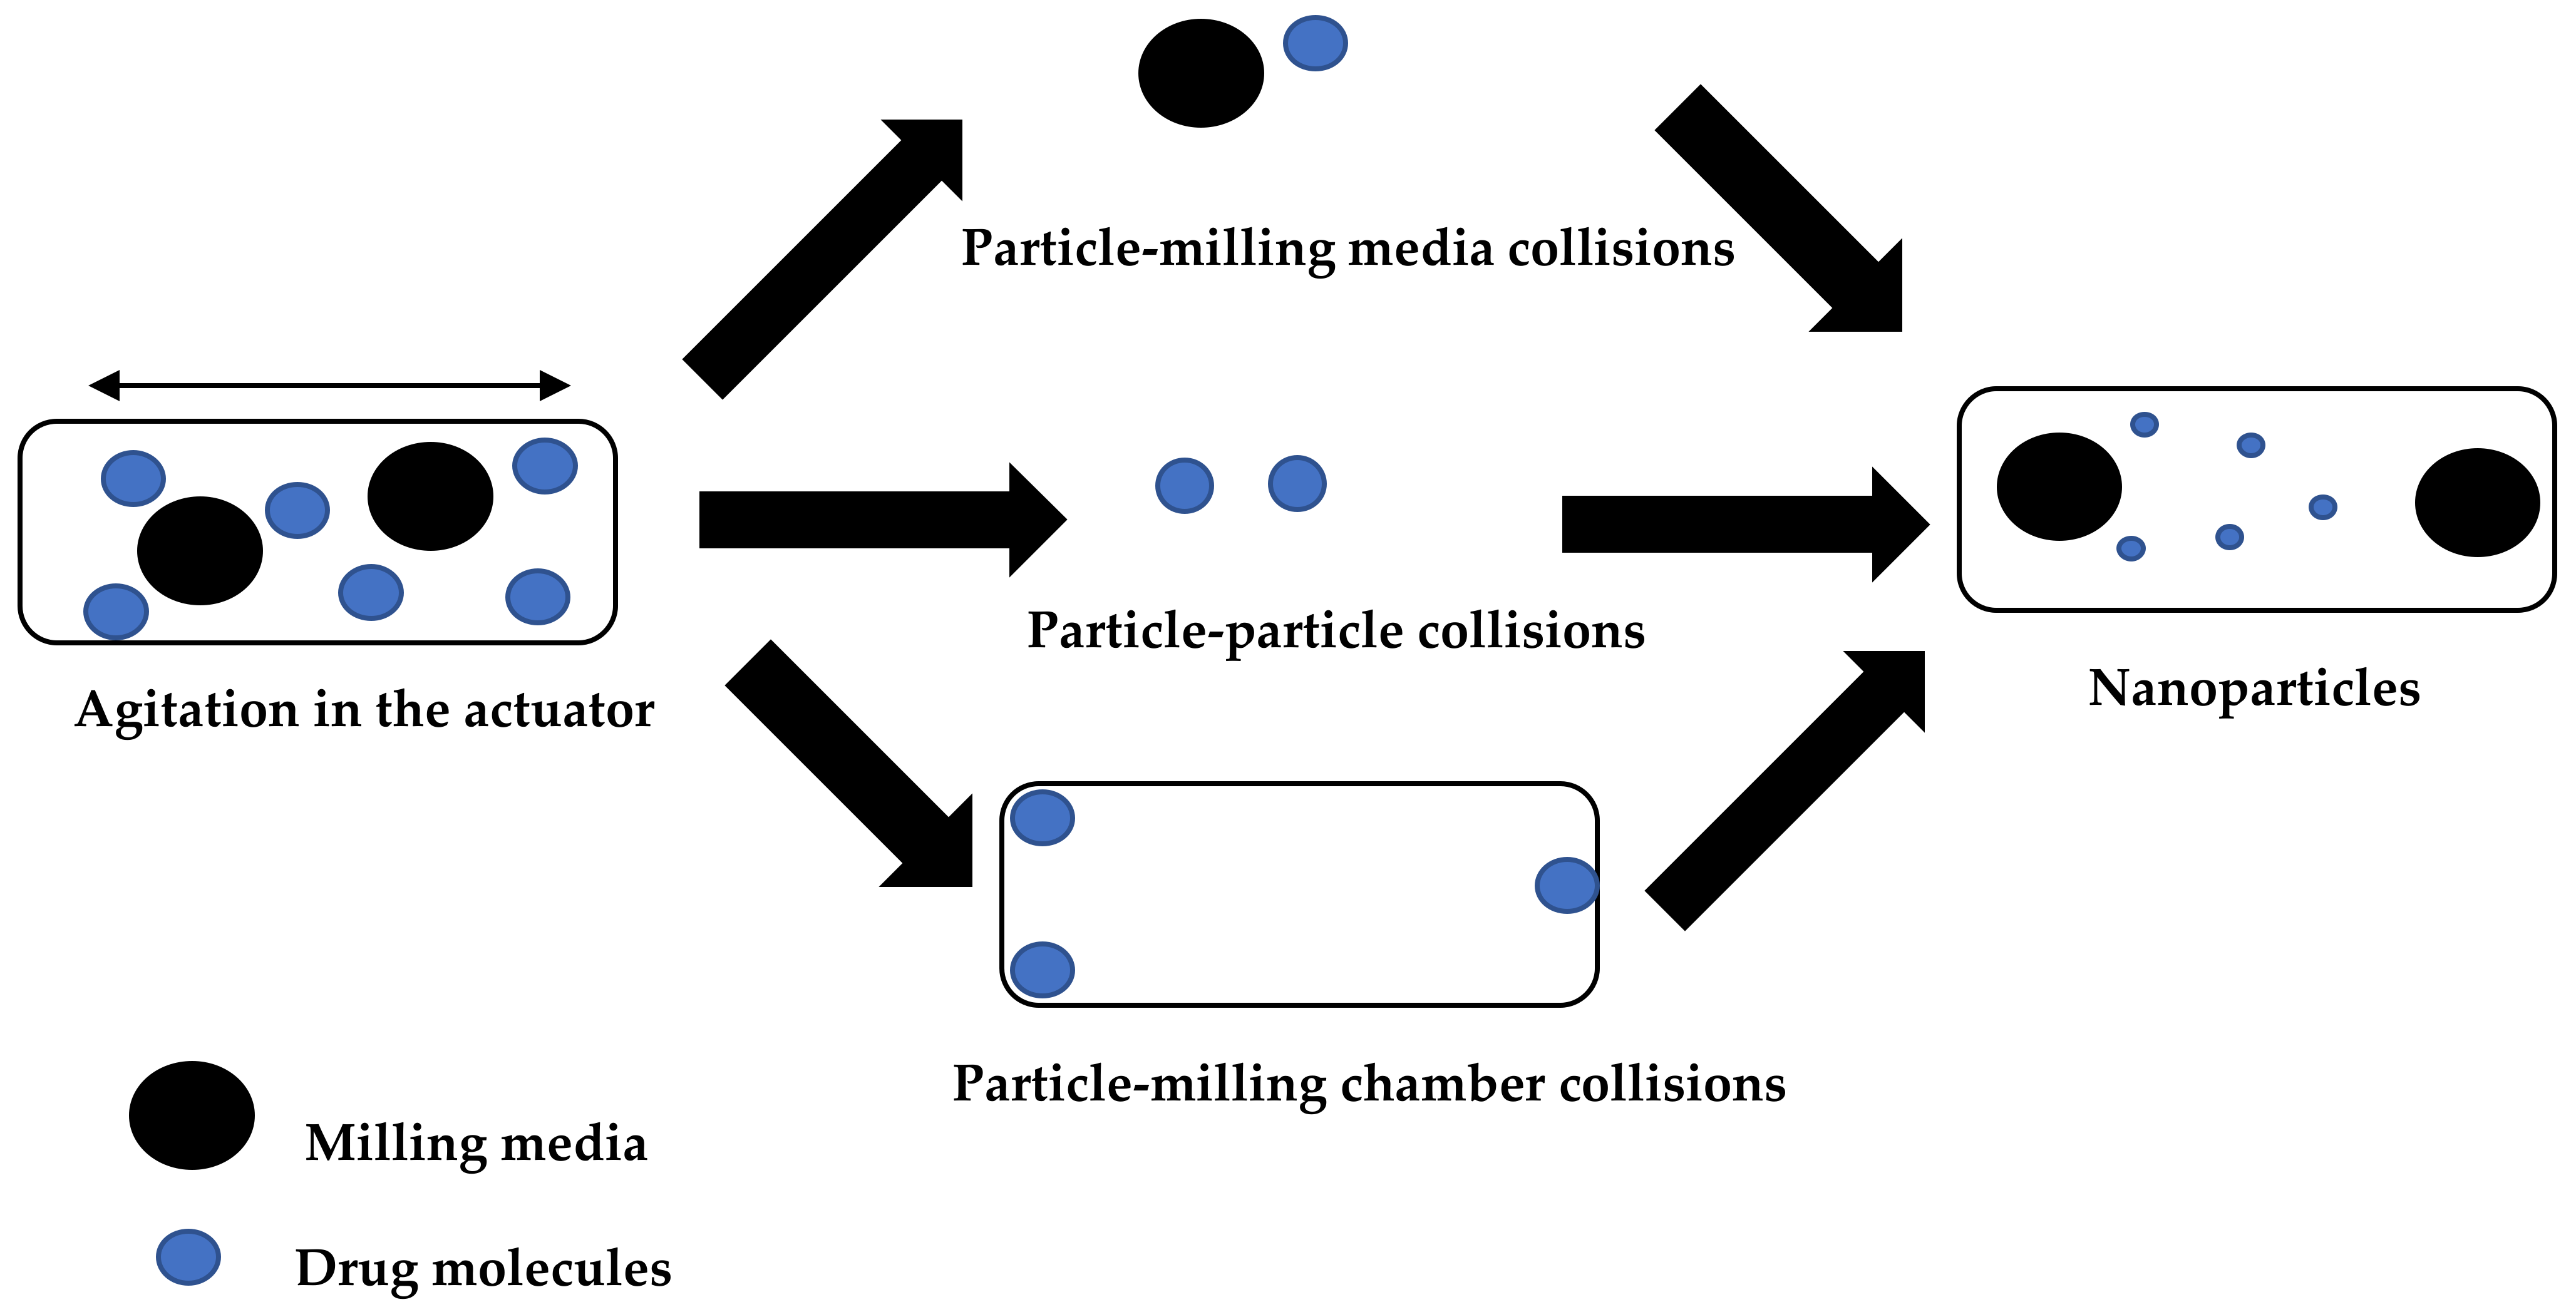
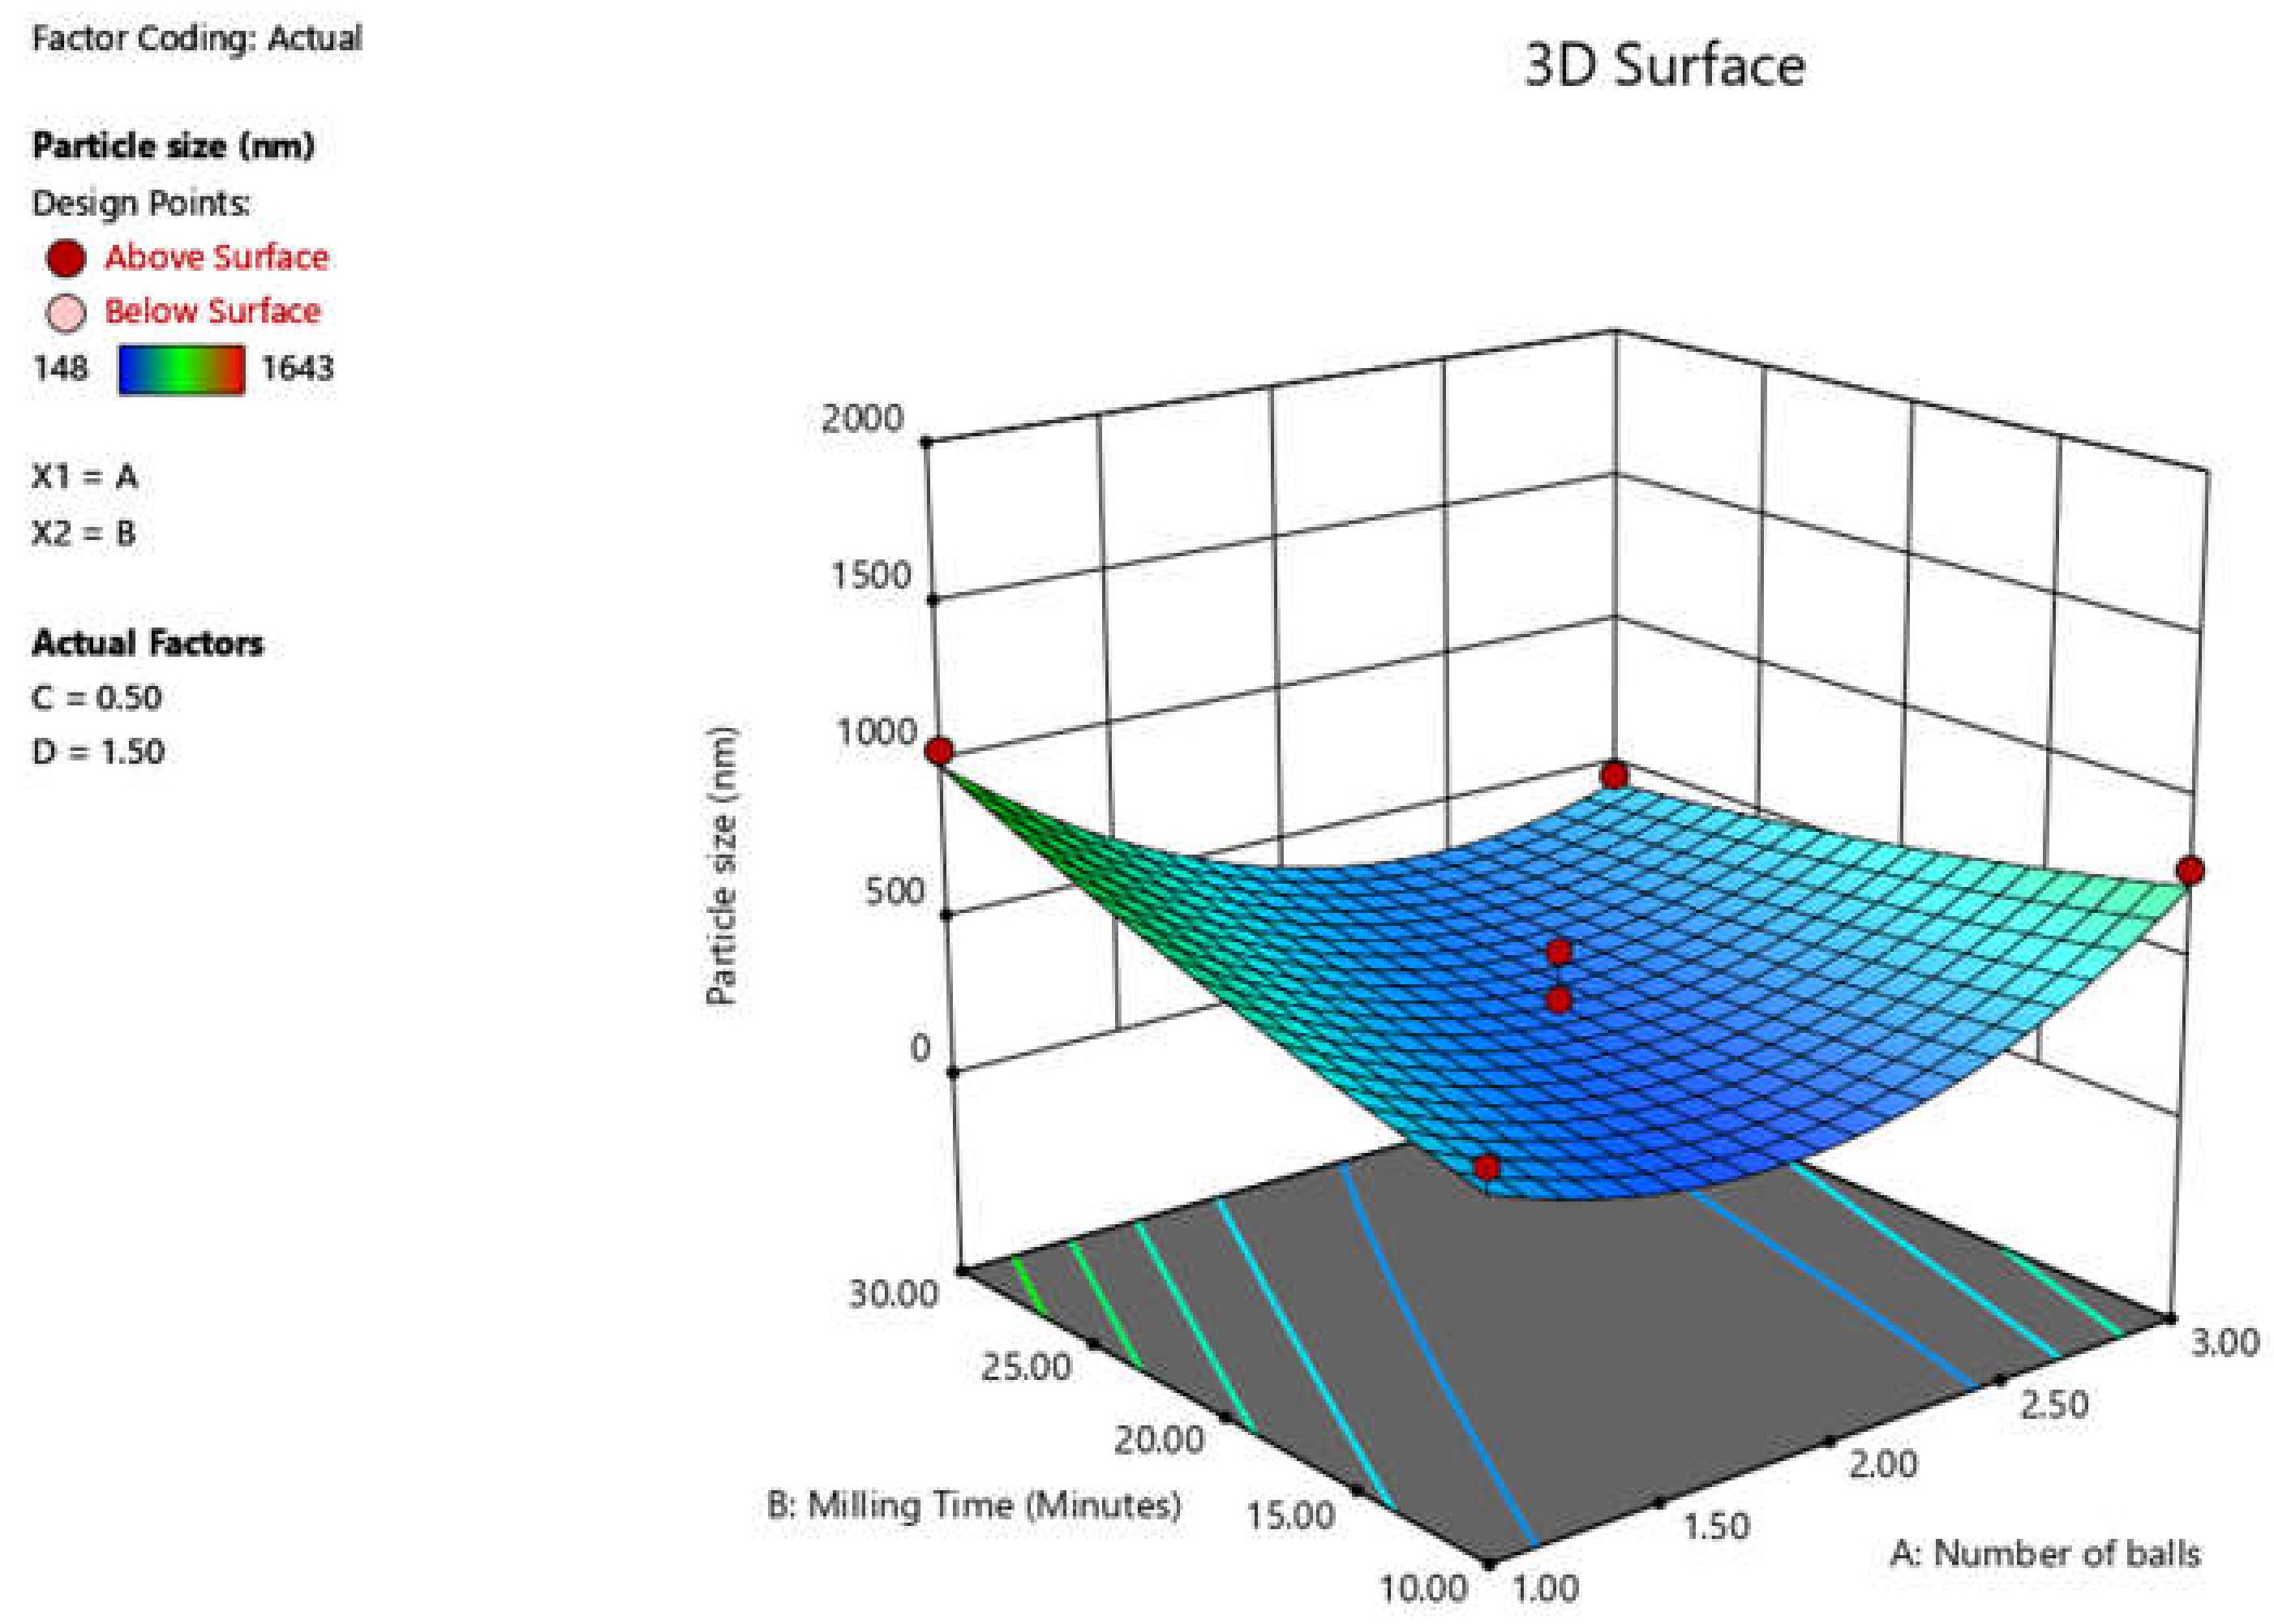
The results of PS determination reveal that an antagonistic relationship between milling time and number of balls or volume of milling media used on particle size exists. The 3D response surface plot in which the impact of the milling time and the number of milling balls used is depicted in Figure 2.
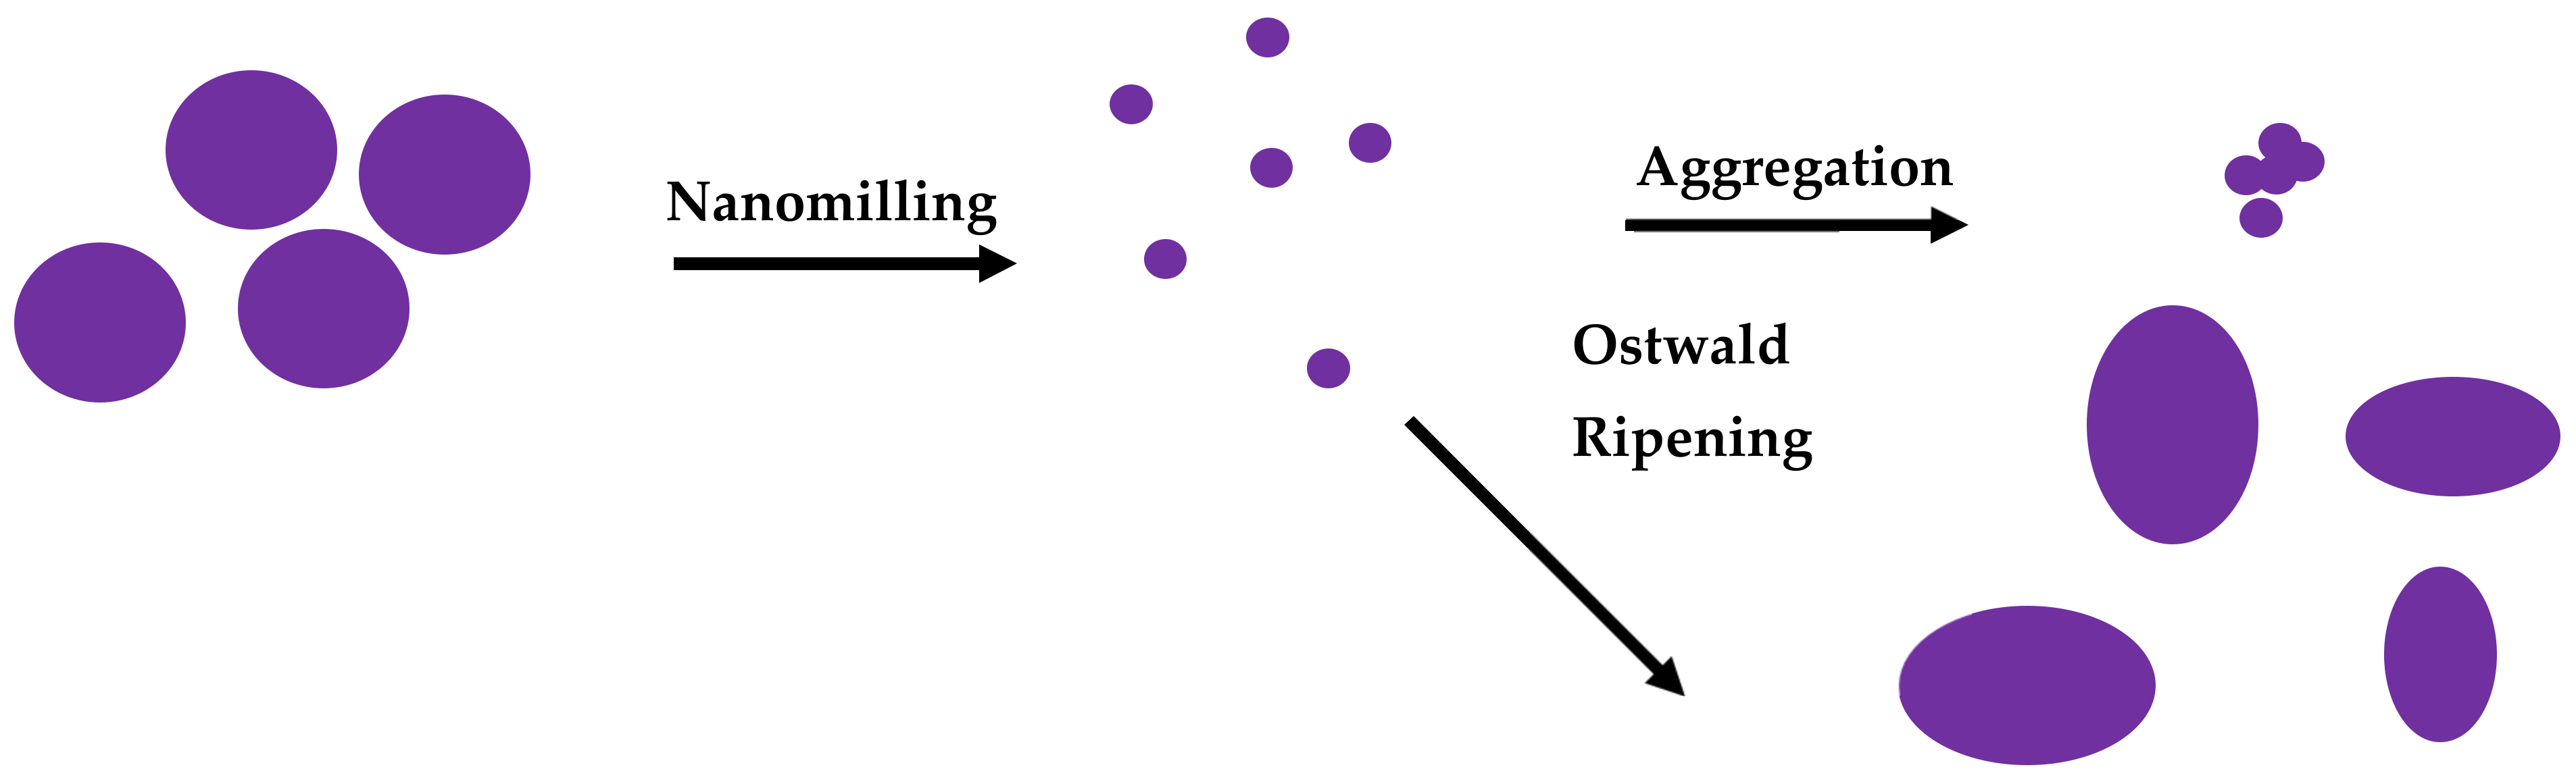
The data suggest that an antagonistic relationship between milling time, number of balls or volume of milling media used, and particle size exists. The plot reveals that small NCC are produced when the number of balls used is high and milling time is short and the same effect is observed when the number of balls used is low and milling time is lengthened. To produce particles of the target size, careful selection of the number of balls and milling time must be identified, as milling beyond a certain time results in particle aggregation, specifically when the number of balls used is at a maximum. Generally, longer milling times are expected to facilitate and enhance comminution due to the higher number of collisions between API particles and milling beads [60], however, long milling times are also associated with an increase in temperature in the milling chamber, which in turn may facilitate an increase in crystal growth due to a higher tendency for Ostwald ripening to occur in the system [61]. A schematic representation of the possible interactions and mechanisms occurring during the milling process is depicted in Figure 3.
The data also reveal that SLS has an effect on particle size, as an increase in SLS concentration results in a reduction in the particle size, suggesting that electrostatic stabilisation has a substantial effect on particles, and the 3D response surface plot in which the impact of surfactant concentration on PS is depicted in Figure S1 (see Supplementary Materials). These results are similar to those obtained from a bottom-up approach [56]. The creation of additional surface area and interfaces is implied when manufacturing NCC, and as the Gibbs free energy changes, the nanosuspensions formed are thermodynamically unstable and will tend to minimize their total energy by agglomeration [39]. Kinetically, the process of agglomeration depends on its activation energy. This activation energy can be influenced by adding stabilisers to the system. Primarily, a requirement for stabilising a system is that it provides wetting of the hydrophobic surfaces of the drug particles. In addition, the stabilisers should stop agglomeration of the nanoparticles by providing an increase in the activation energy of the process.
The ANOVA results summarised in Table 4 reveal that particle size is influenced by the number of milling balls, milling time, and SLS and TPGS 1000 concentration used. An increase in number of milling balls and SLS concentration resulted in a reduction in particle size, while an increase in milling time and TPGS concentration resulted in an increase in particle size and a milling time >20 minutes resulted in particle aggregation/particle coarsening, specifically when the number of milling balls used was at a maximum.
3.1.2. Polydispersity Index (PDI)
The PDI values generated ranged between 0.224 and 0.761. However, all formulations with the exception of one exhibited a PDI < 0.6, indicating a homogeneous and narrow particle size distribu-tion, and a PDI value of <0.5 is considered acceptable. A linear model best describes the factors affecting the PDI, and the relationship between PDI and the coded factors is described by Equation (2).
PDI = (−4.417 × 10⁻³)A − 0.035B + 0.030C + 0.047D + 0.46
3.1.3. Zeta Potential (ZP)
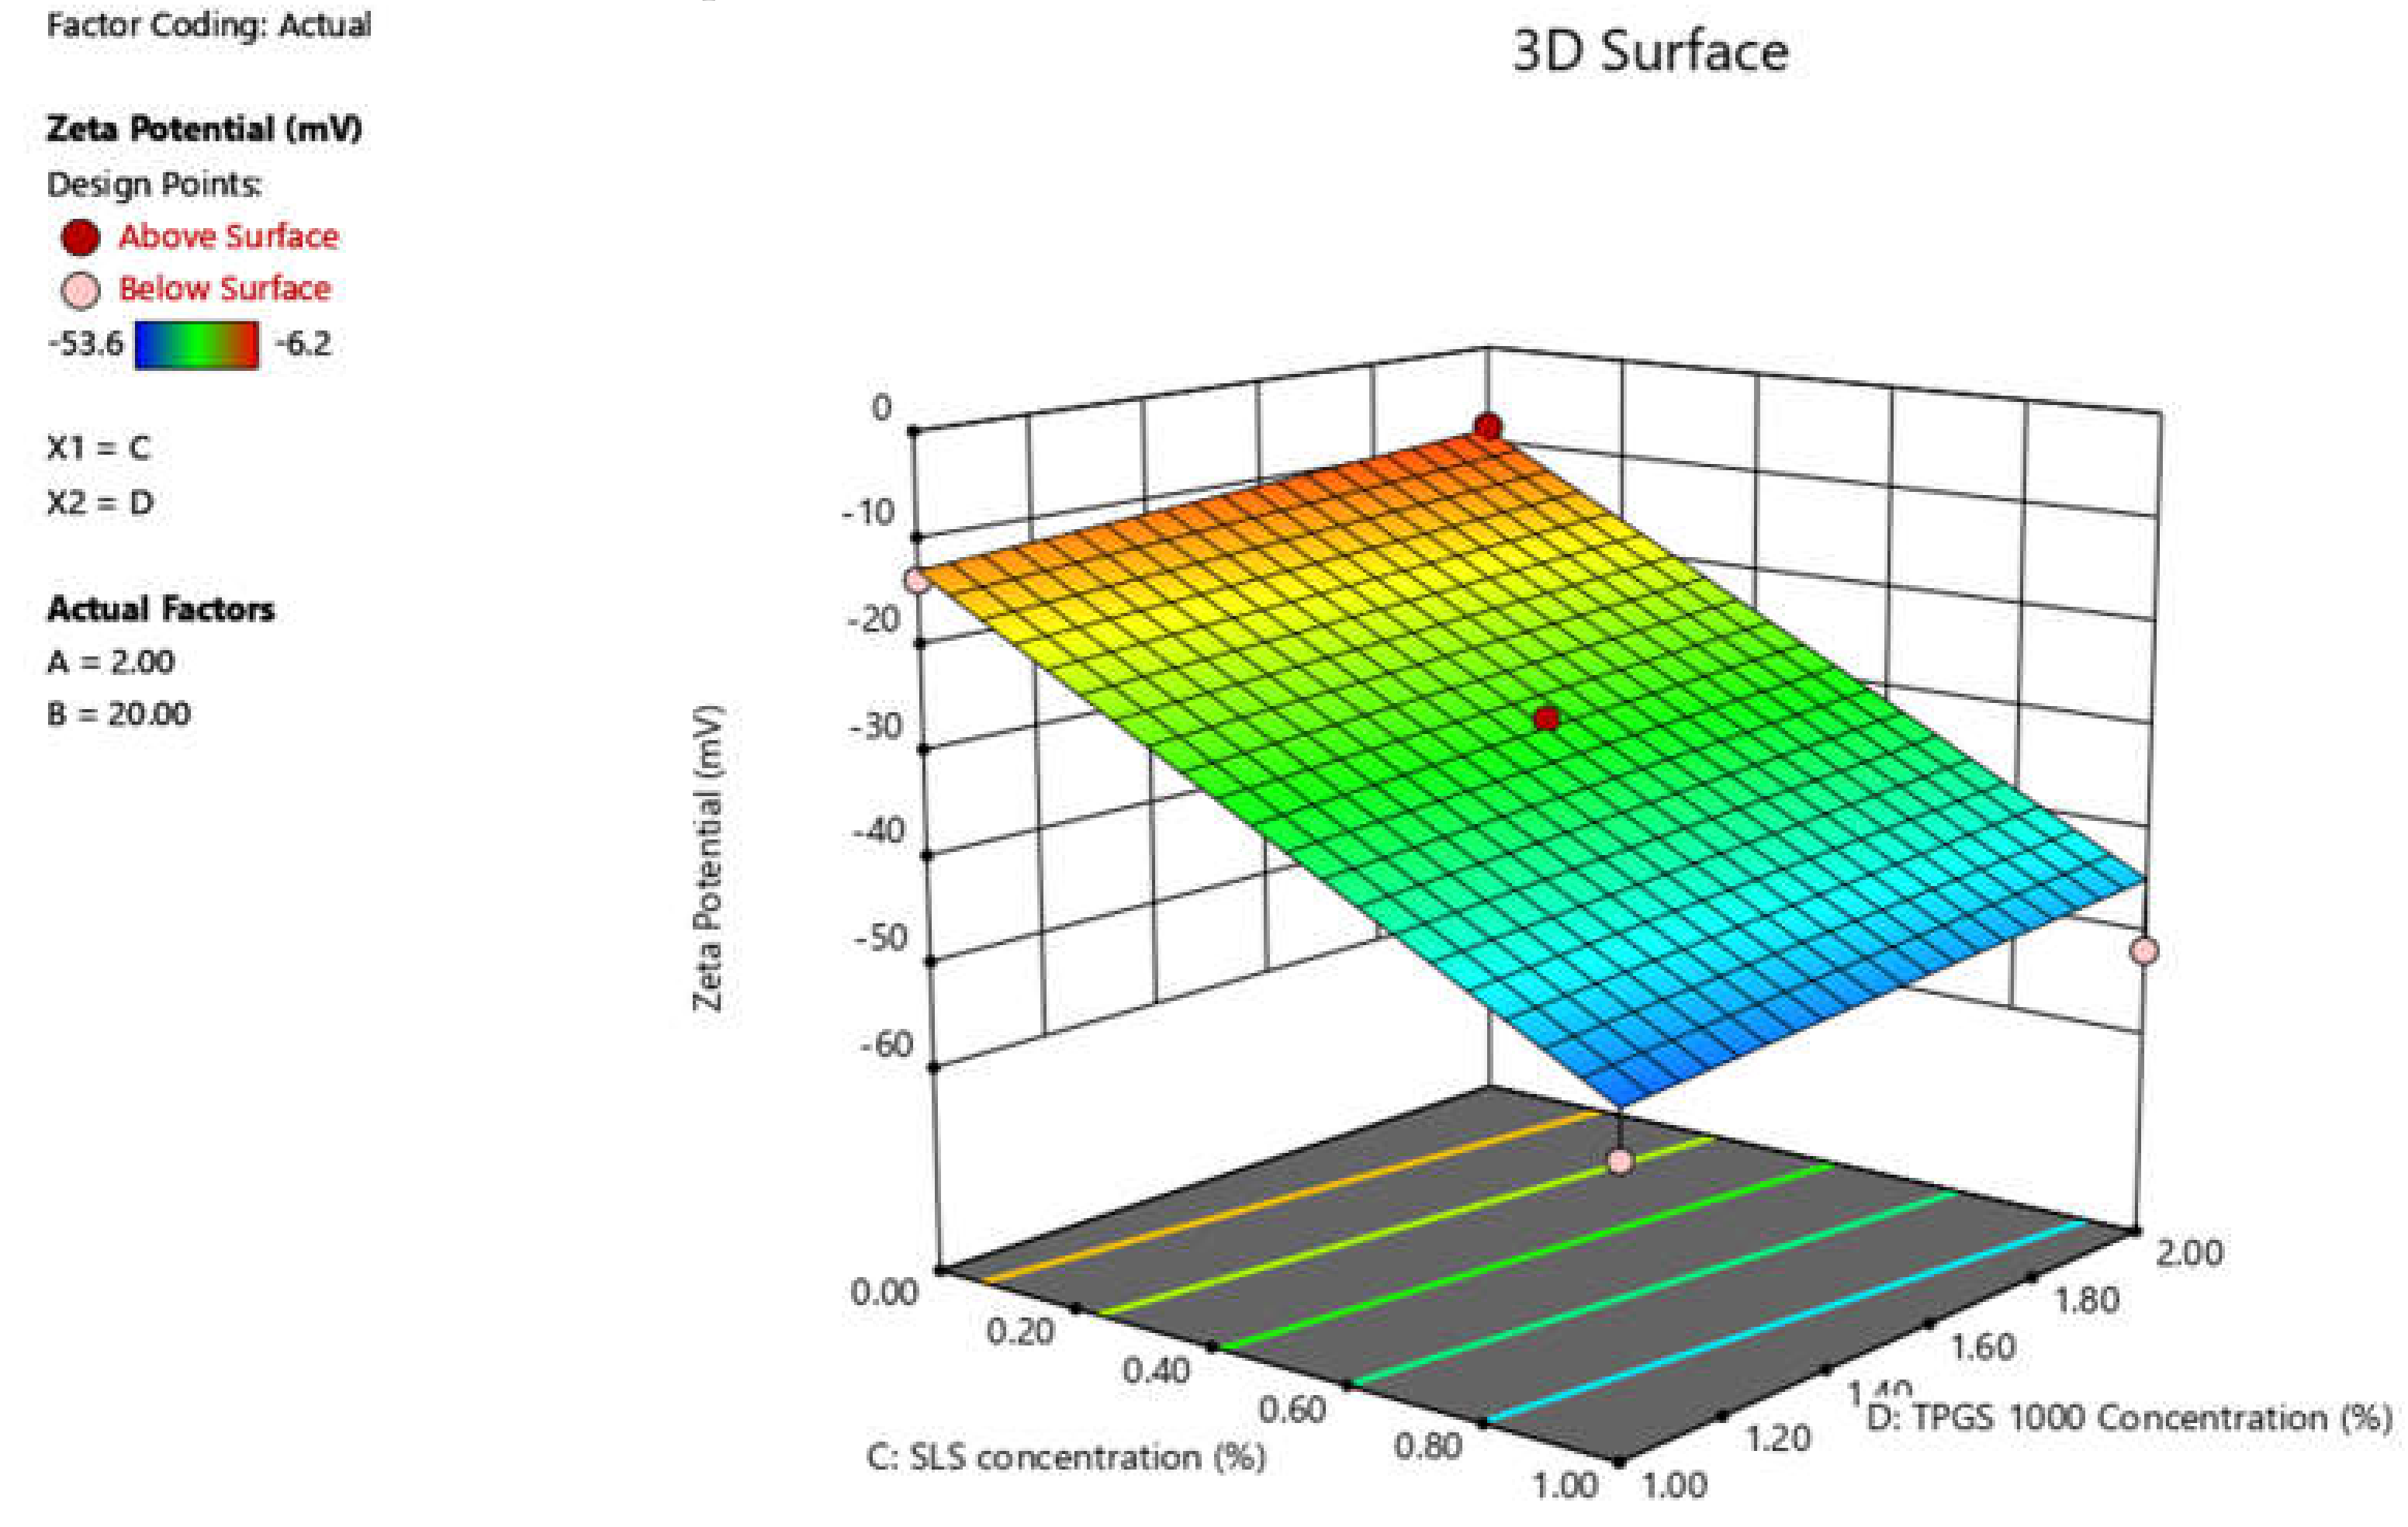
The Zeta potential is a useful parameter for interpreting the stability of nanosuspensions. Generally, a Zeta potential >+30 and <−30 mV reflects stability of a system. The higher the absolute value for the Zeta potential, the greater the repulsion between suspended particles, rendering the suspension stable. The Zeta potential values of the NCC ranged between −6.2 and −53.6 mV (Table 6) and the relationship between ZP and the coded factors is described using Equation (3).
ZP = 0.53A − 1.02B − 18.08C + 2.13D − 28.80
The results of the ANOVA for the response surface linear model for ZP are listed in Table 6, and the model F value of 45.51 indicates that the model is significant, and that ZP is only affected by SLS concentration, where an increase in SLS concentration results in a reduction in ZP.
The 3D response surface plot depicted in Figure 4 shows the impact of SLS and TPGS 1000 concentration on ZP of the NCC and that a direct linear relationship between the ZP and SLS content exists. An increase in SLS concentration has a linear decrease in the ZP of the NCC and these data are consistent with previously reported effects of SLS on ZP [62,63,64]. The low ZP value of the nanosuspension with SLS is in agreement with Derjaguin, Landau, Verwey, and Overbeek (DLVO) theory [65,66] as the anionic head group of SLS, viz., SO4−2, adsorbs onto the surface of the nano co-crystals resulting in a higher negative charge [66].
3.2. Formulation Optimisation
3.3. Characterisation of OPT-NCC
3.3.1. FTIR
The FTIR spectra depicted in Figure S3 reveals the presence of characteristic peaks for the NCC that are identical to those of the micro co-crystal, which is evidence that the NCC contain the same moieties as the micro co-crystals that include peaks for AZT, 3TC, and the presence of water.
3.3.2. DSC
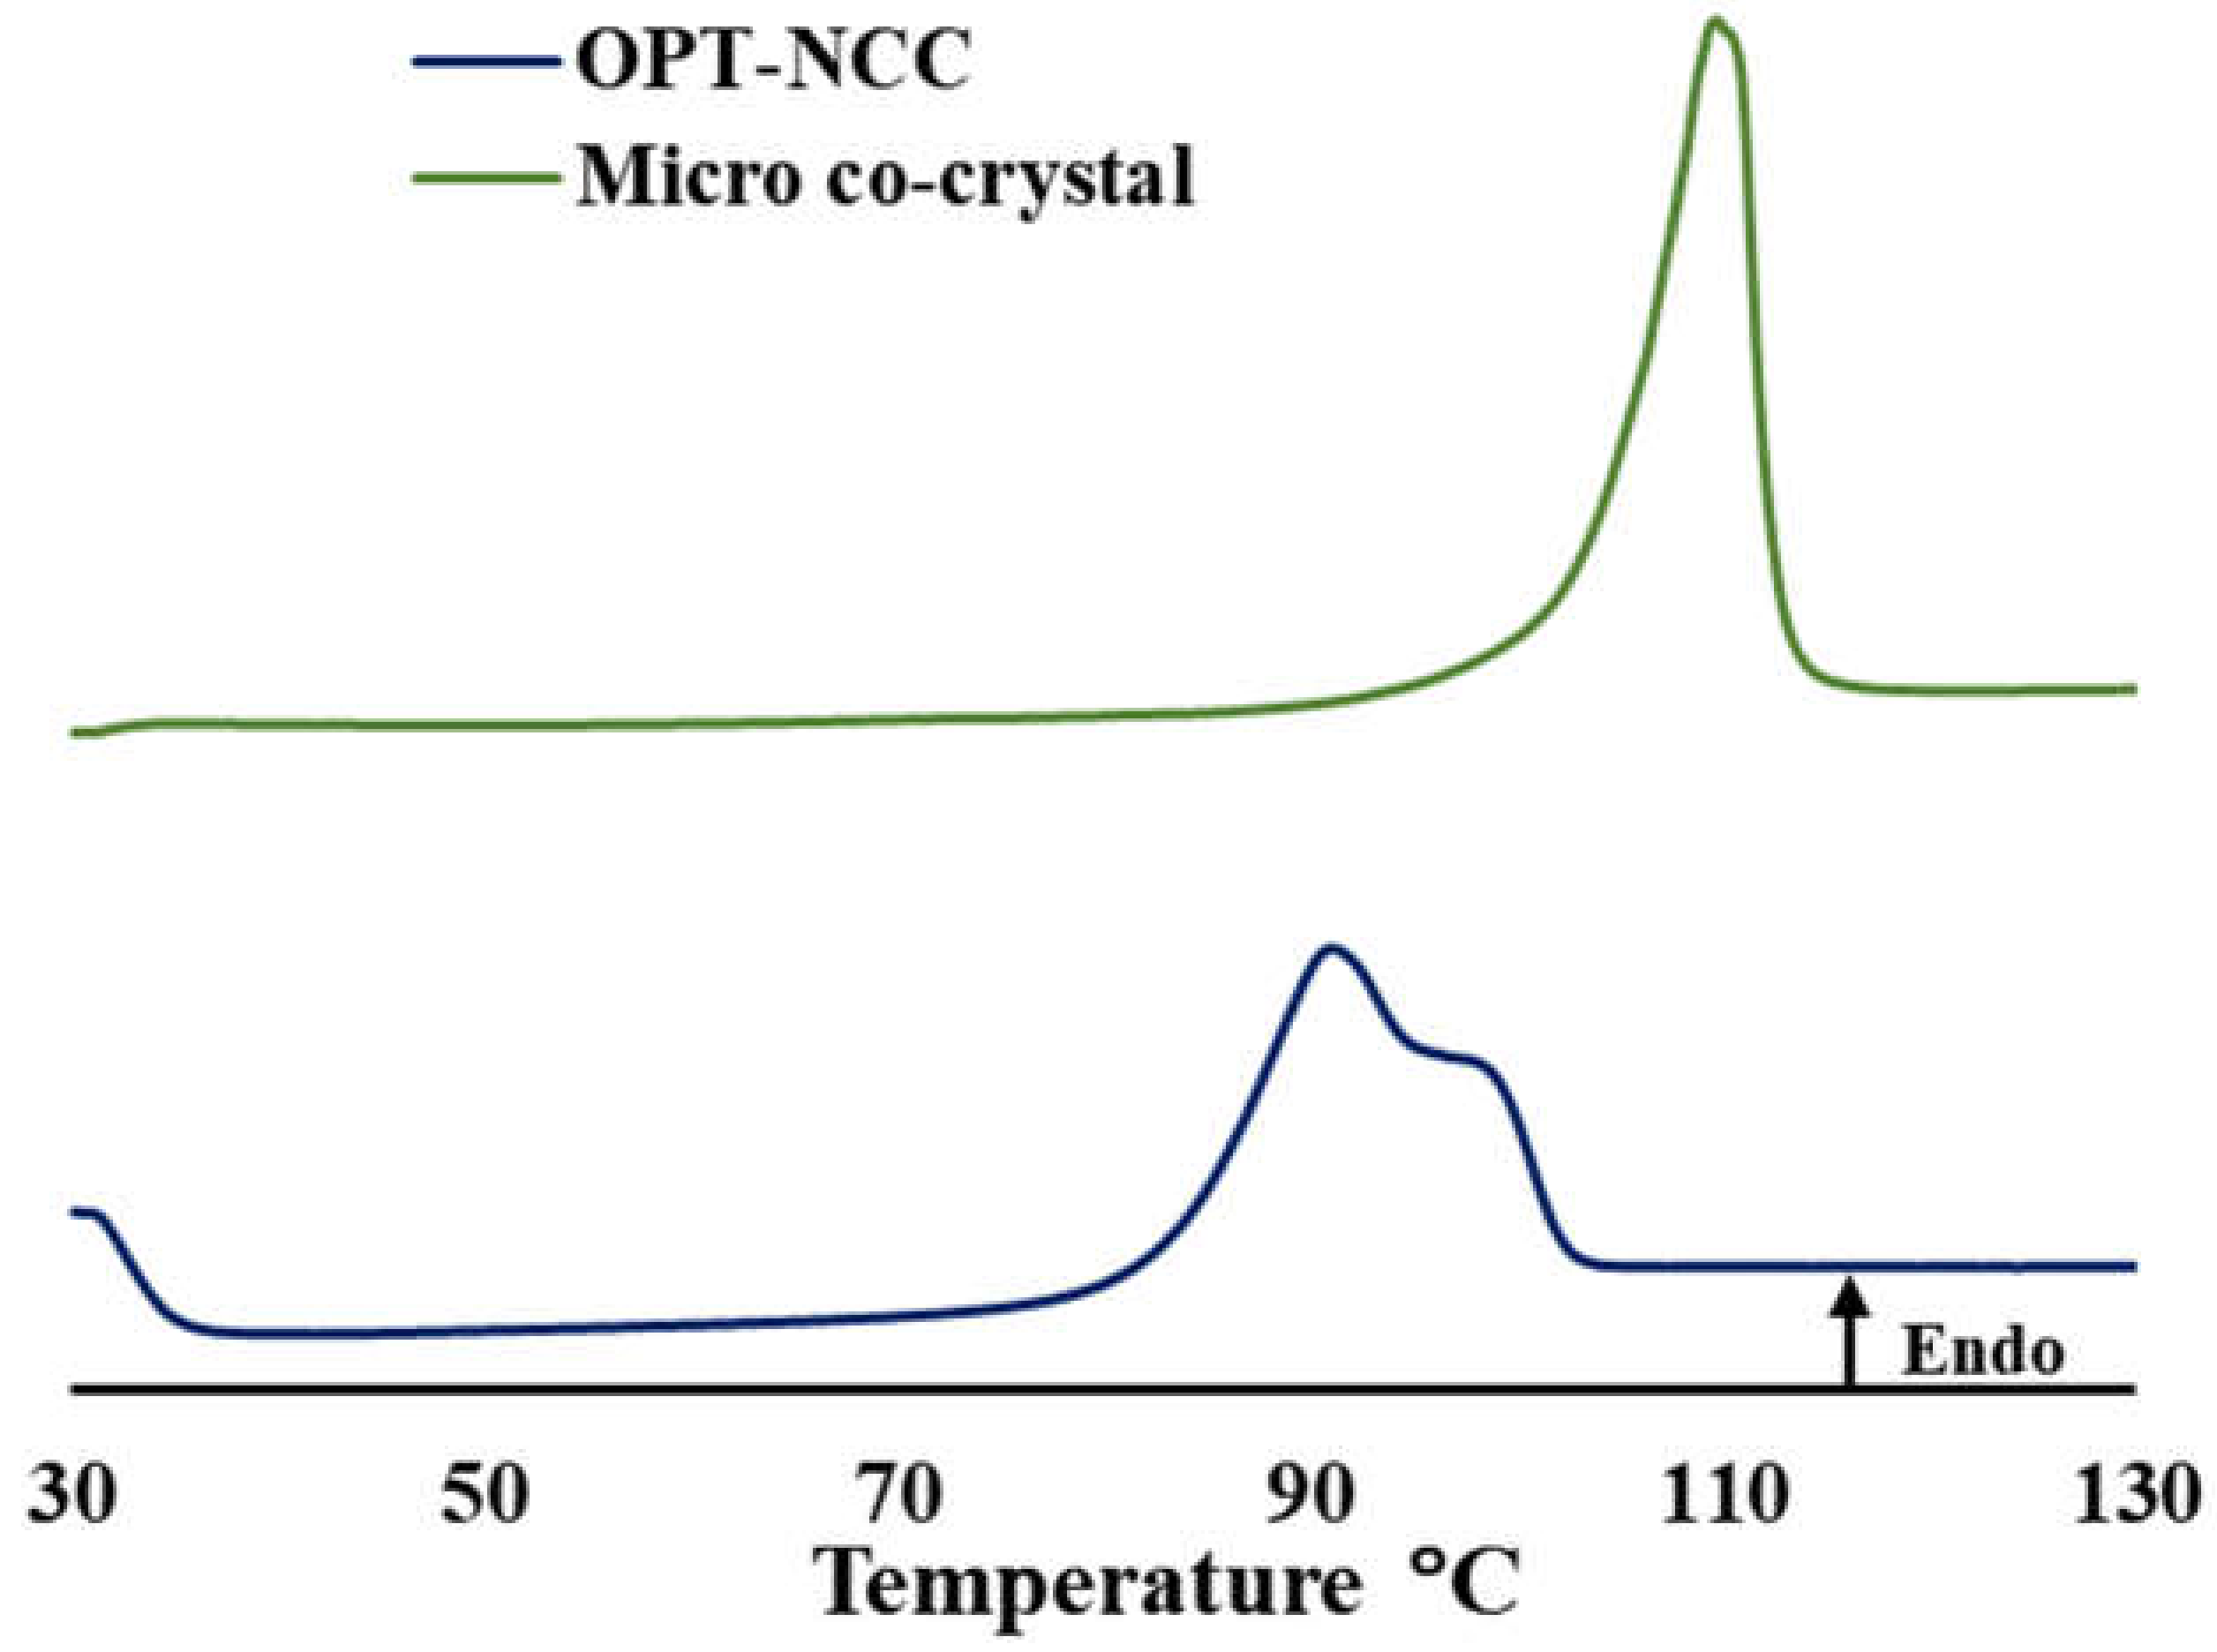
DSC was used to investigate whether polymorphic changes occurred during manufacture of NCC using wet media milling. A melting endotherm was observed at Tpeak, at 88.6 °C, as depicted in Figure 5. A decrease in melting point is associated with a reduction in melting due to a greater surface-to-volume ratio in nanomaterials [67,68]. Binding of surface atoms in the solid phase is greater in the bulk of the solid than it is at the surface, due to fewer neighbouring atoms being in close proximity [69]. The increased surface-to-volume ratio implies less energy is required to separate the molecules, and a subsequent reduction in melting point is observed.
3.3.3. PXRD
The powder diffractograms depicted in Figures S4 and S5 reveal that the NCC produced using a top-down approach are a co-crystal solvate with water located in the crystalline network. The NCC exhibit many peaks that are similar to those in the diffractogram of the micro co-crystal REFCODE: WOMHEM reported in the Cambridge Structural Database (CSD) with a high degree of overlap, as depicted in Figure S5. However, preferred orientation and particle size reduction are responsible for the differences in peak symmetry and peak intensity observed [70,71,72,73], and when viewed in conjunction with DSC, the PXRD results confirm the crystallinity of the OPT-NCC.
3.3.4. TEM
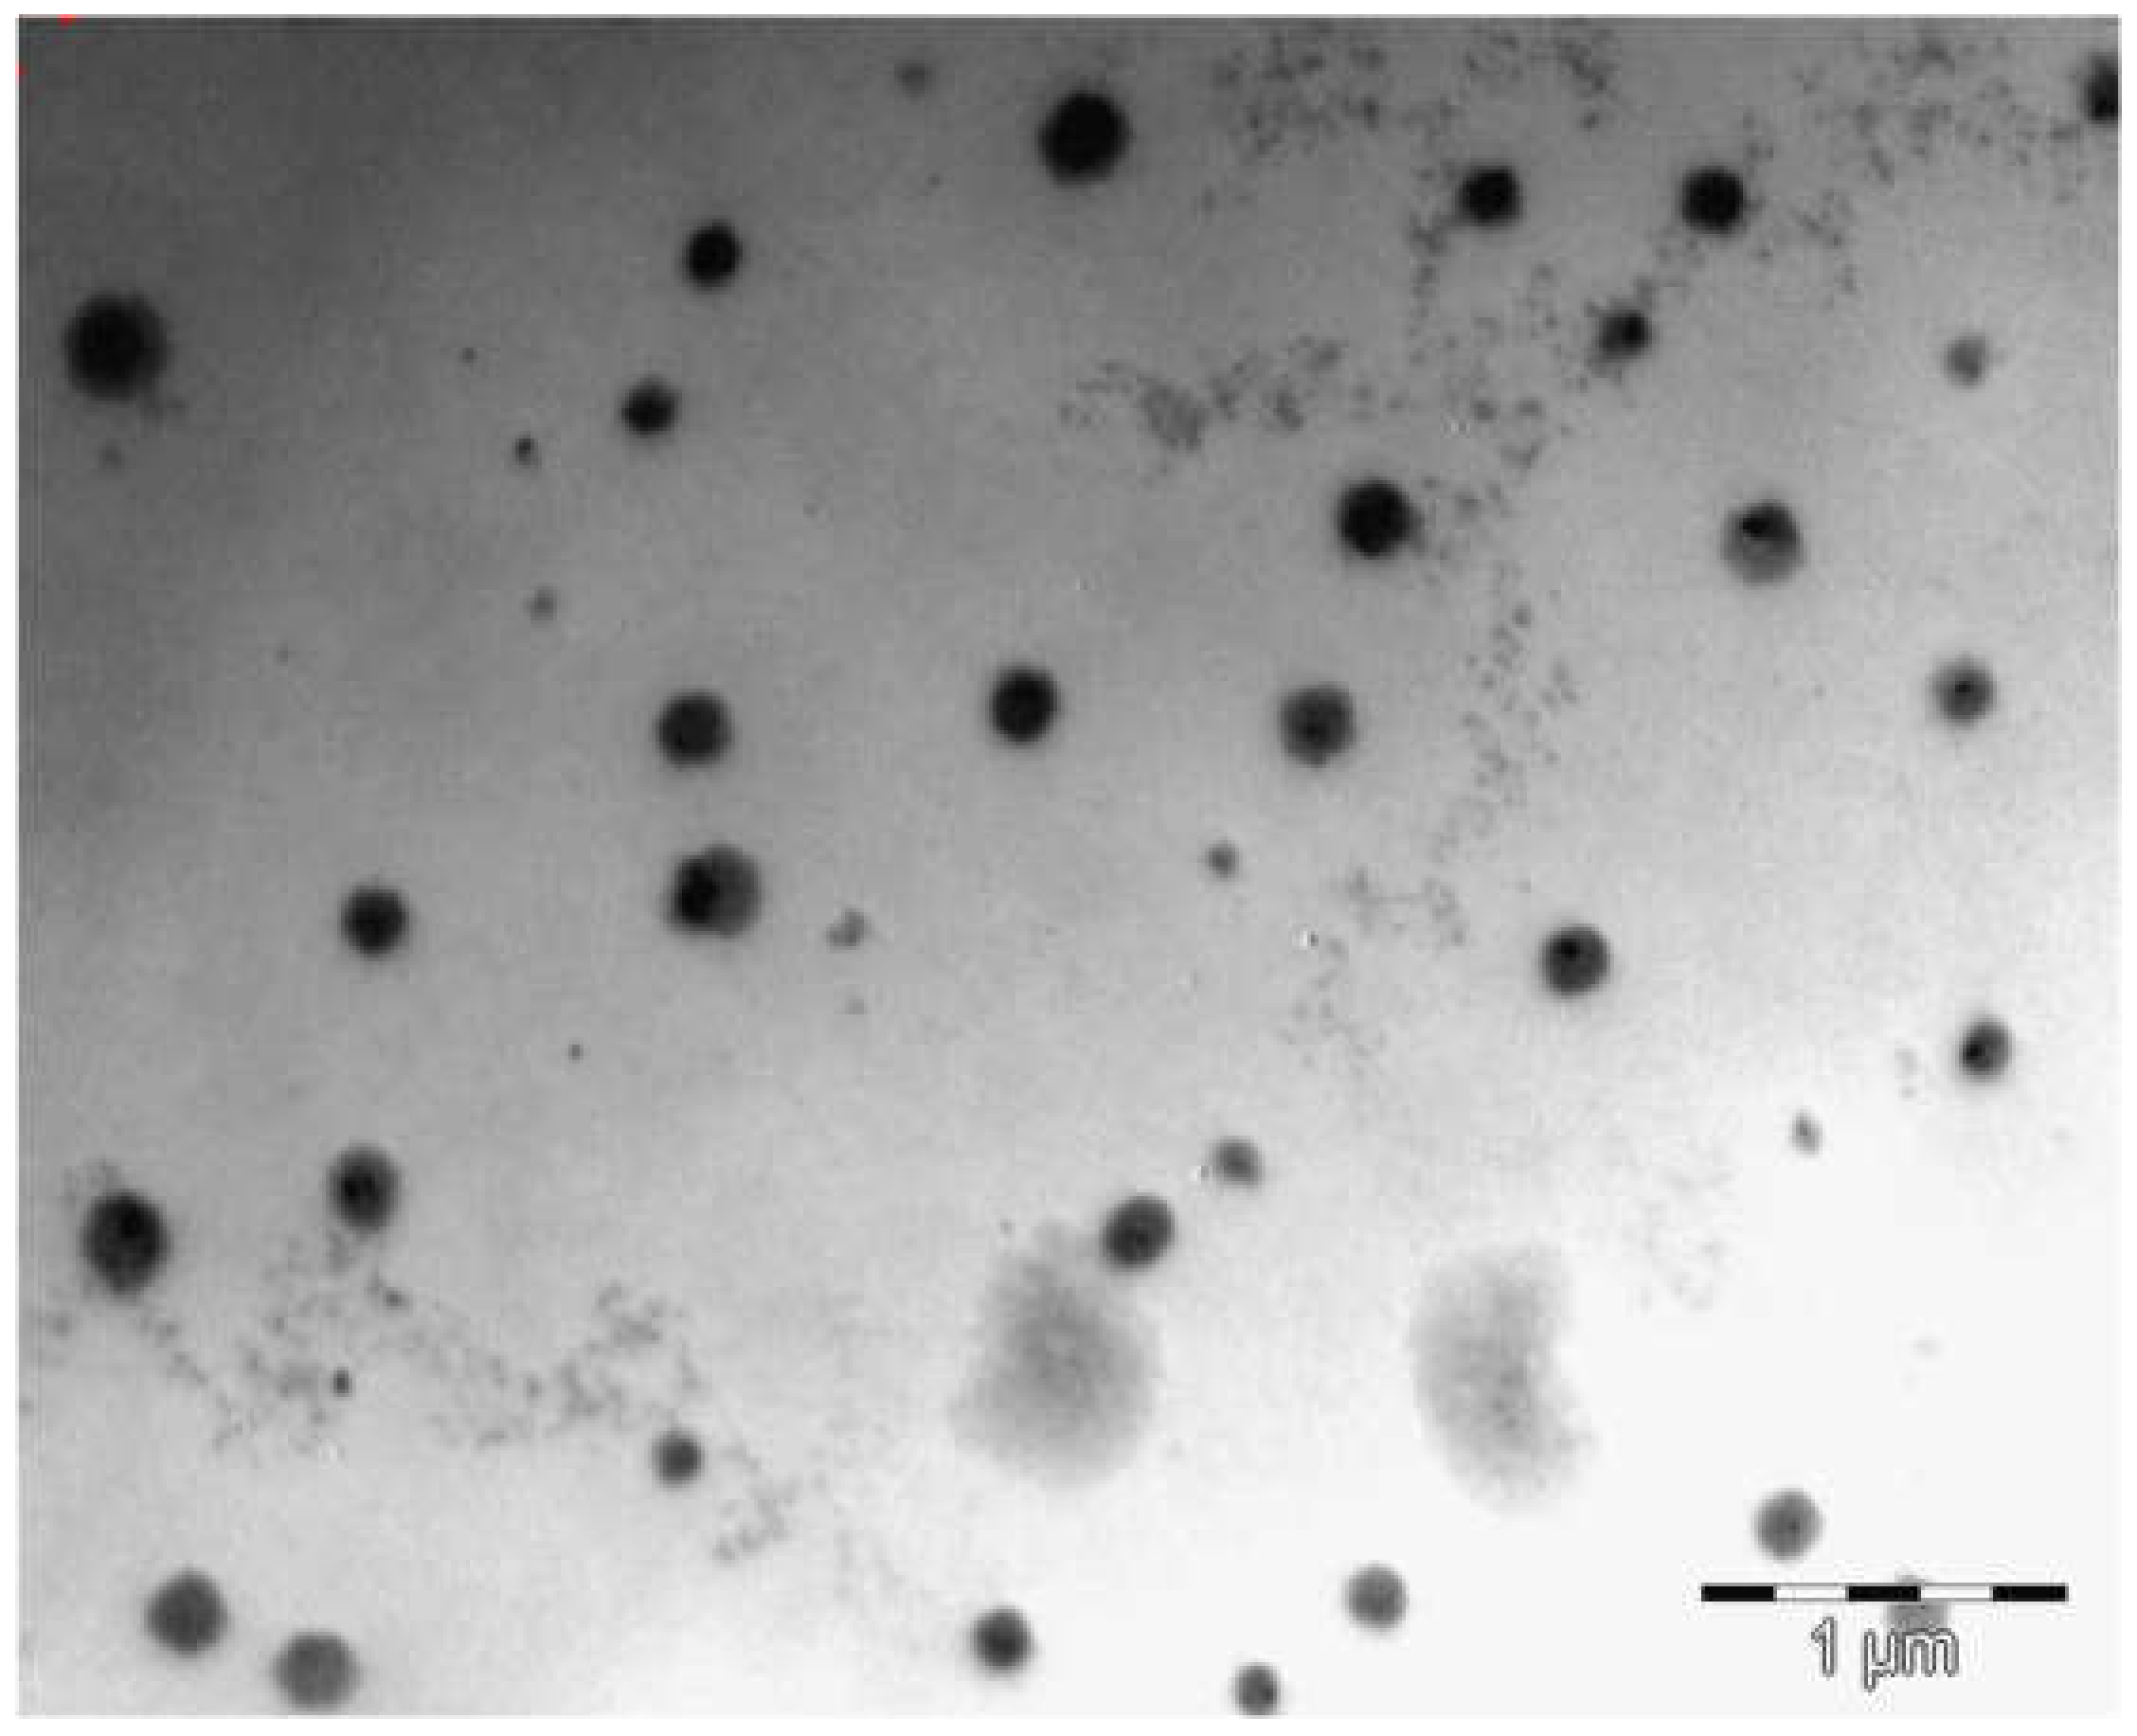
The crystals that were produced were spherical in shape as observed in Figure 6 and are in close agreement with the Design Expert® predicted and experimental data for particle size generated using DLS. The particles are expected to become more spherical and less fragile at higher temperature [74], and as wet media milling was performed at ambient temperature 22 °C and generally produces heat, spherical shaped particles were expected.
3.3.5. SEM-EDX
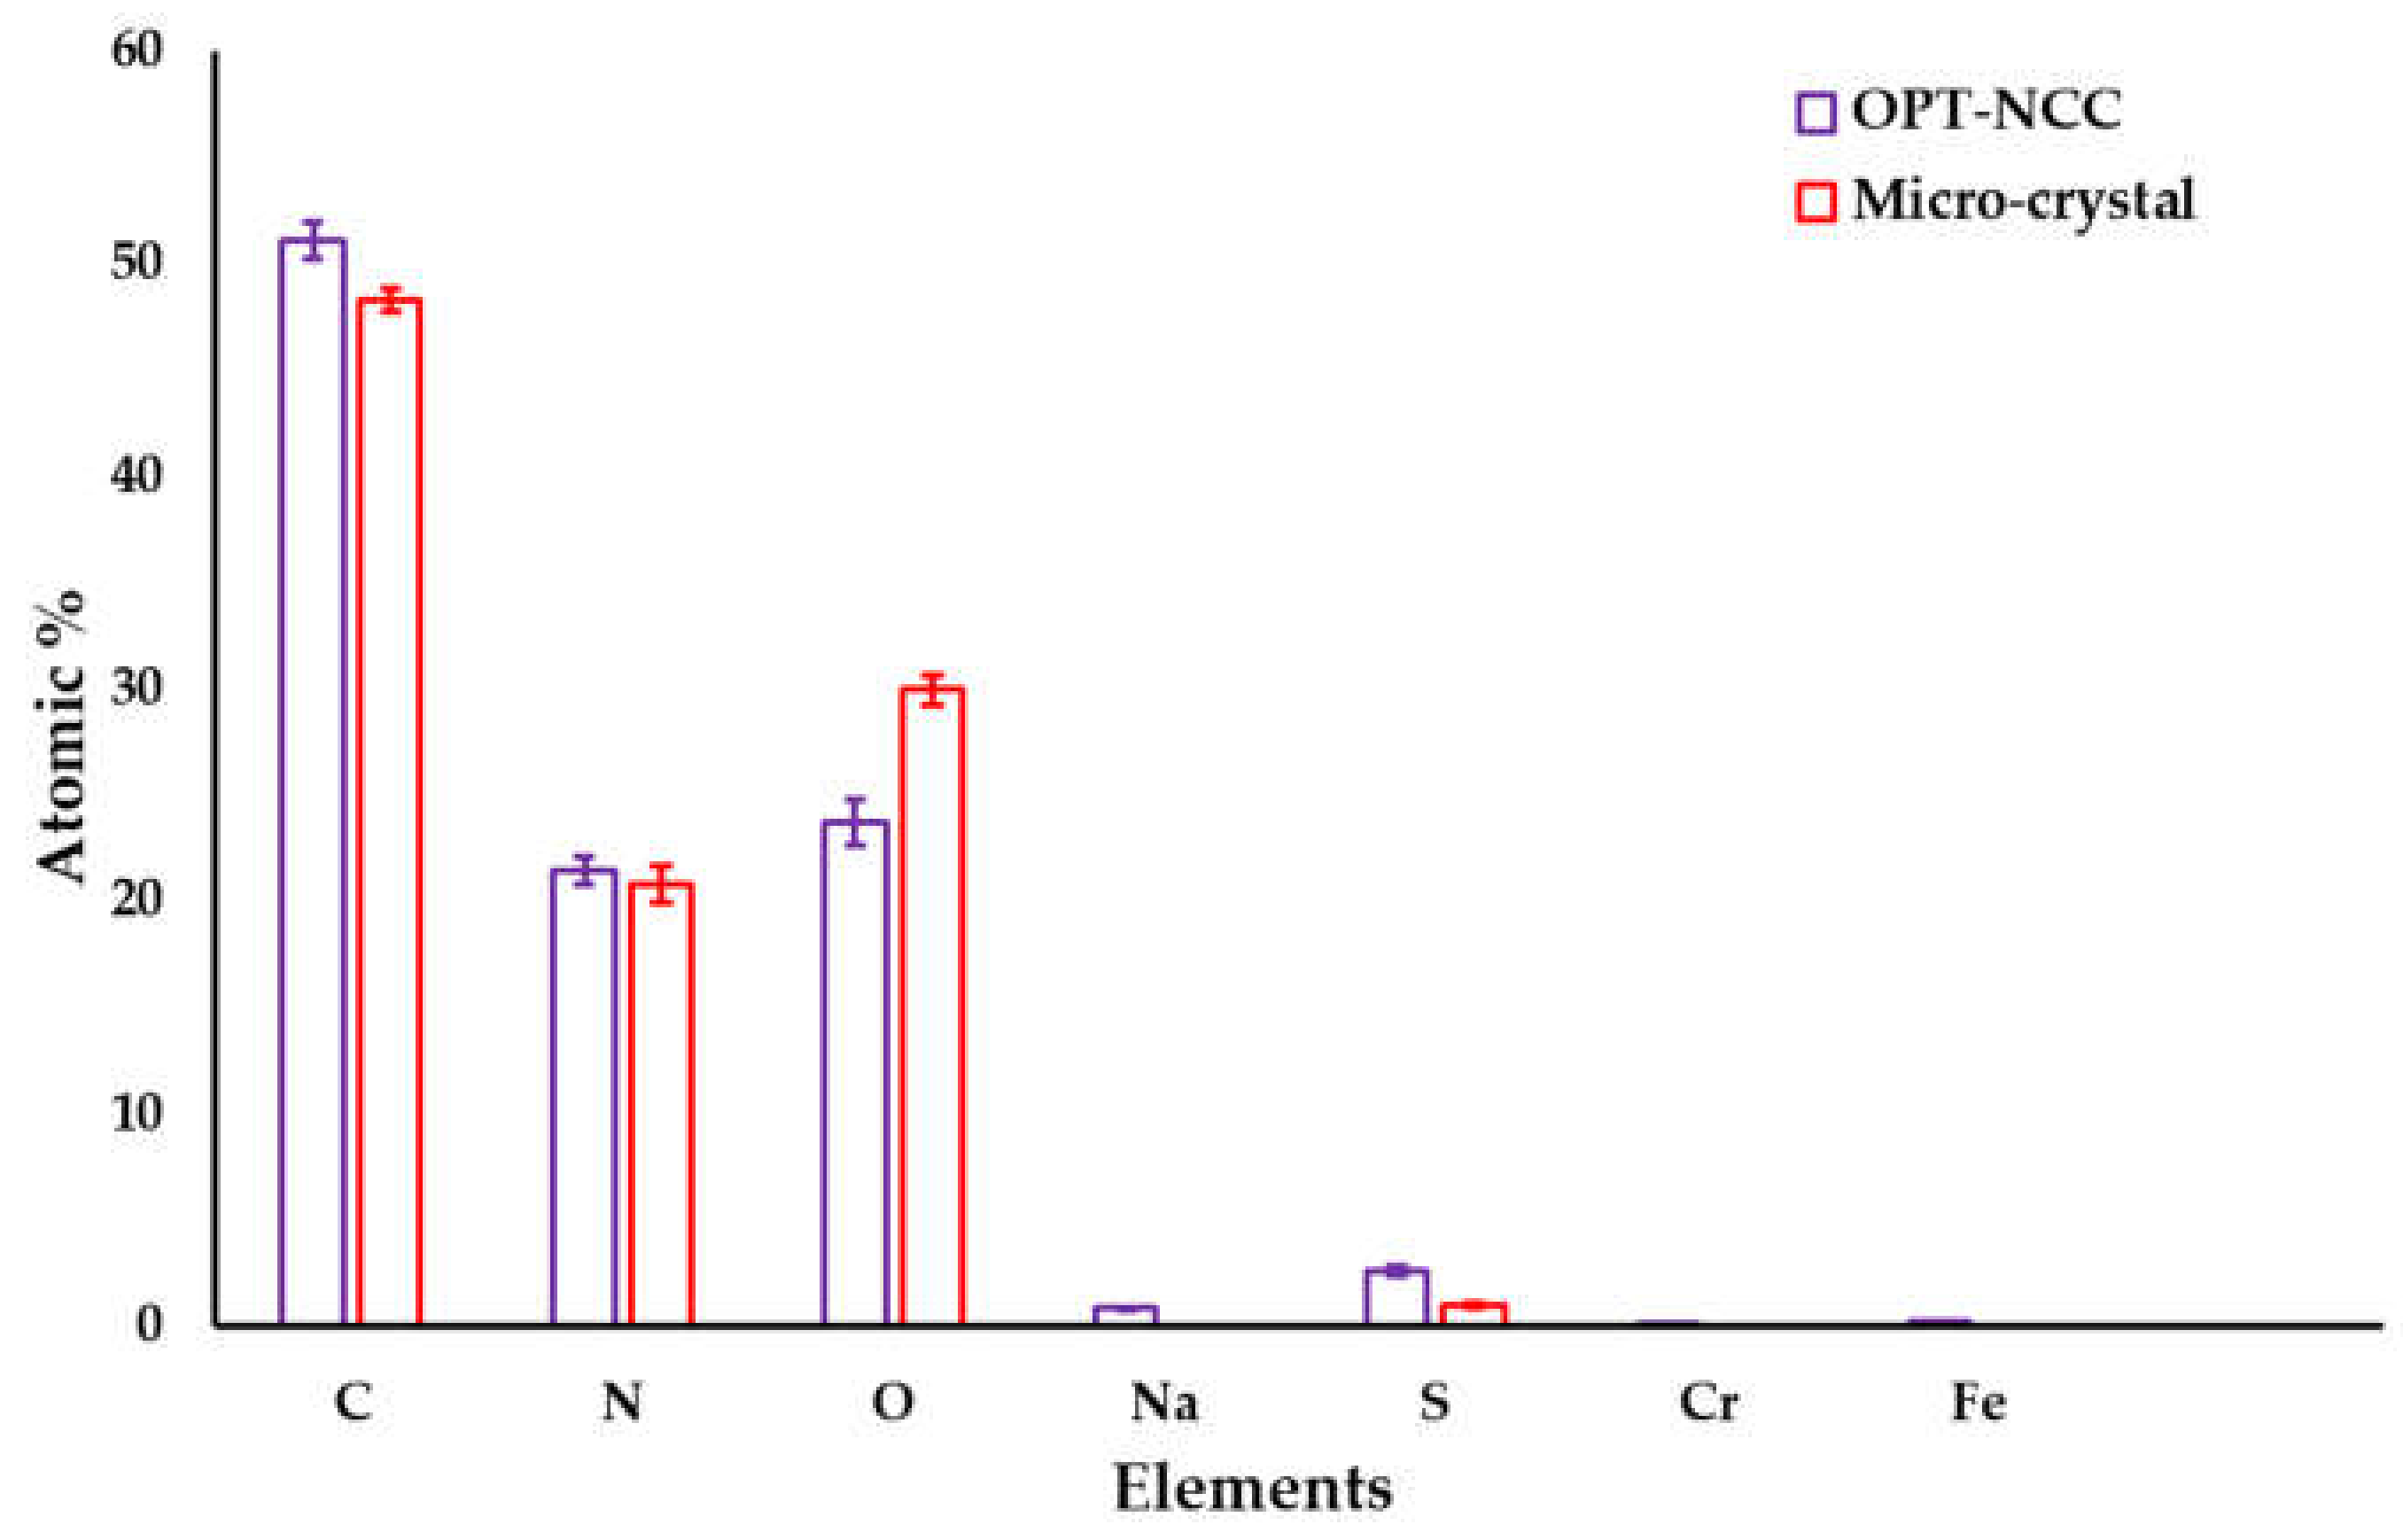
Elemental analysis revealed the presence of elemental sodium in the SLS/TPGS stabilised OPT-NCC in addition to the presence of more elemental carbon and sulphur when compared to that of the micro co-crystal, which is attributed to the presence of surfactant. However, the OPT-NCC had less oxygen than did the micro co-crystal, as the overall weight ratio was low due to the presence of elemental sodium and additional sulphur from the stabiliser combination used. The OPT-NCC product exhibited some contamination from the milling media used, with trace amounts of iron and chromium detected. Consequently, the use of yttrium-stabilised zirconium oxide milling media would likely result in a reduction in contamination [21,75]. The results of the elemental analysis are summarized in Table 8 and Figure 7.
3.3.6. In Vitro Cytotoxicity Assessment
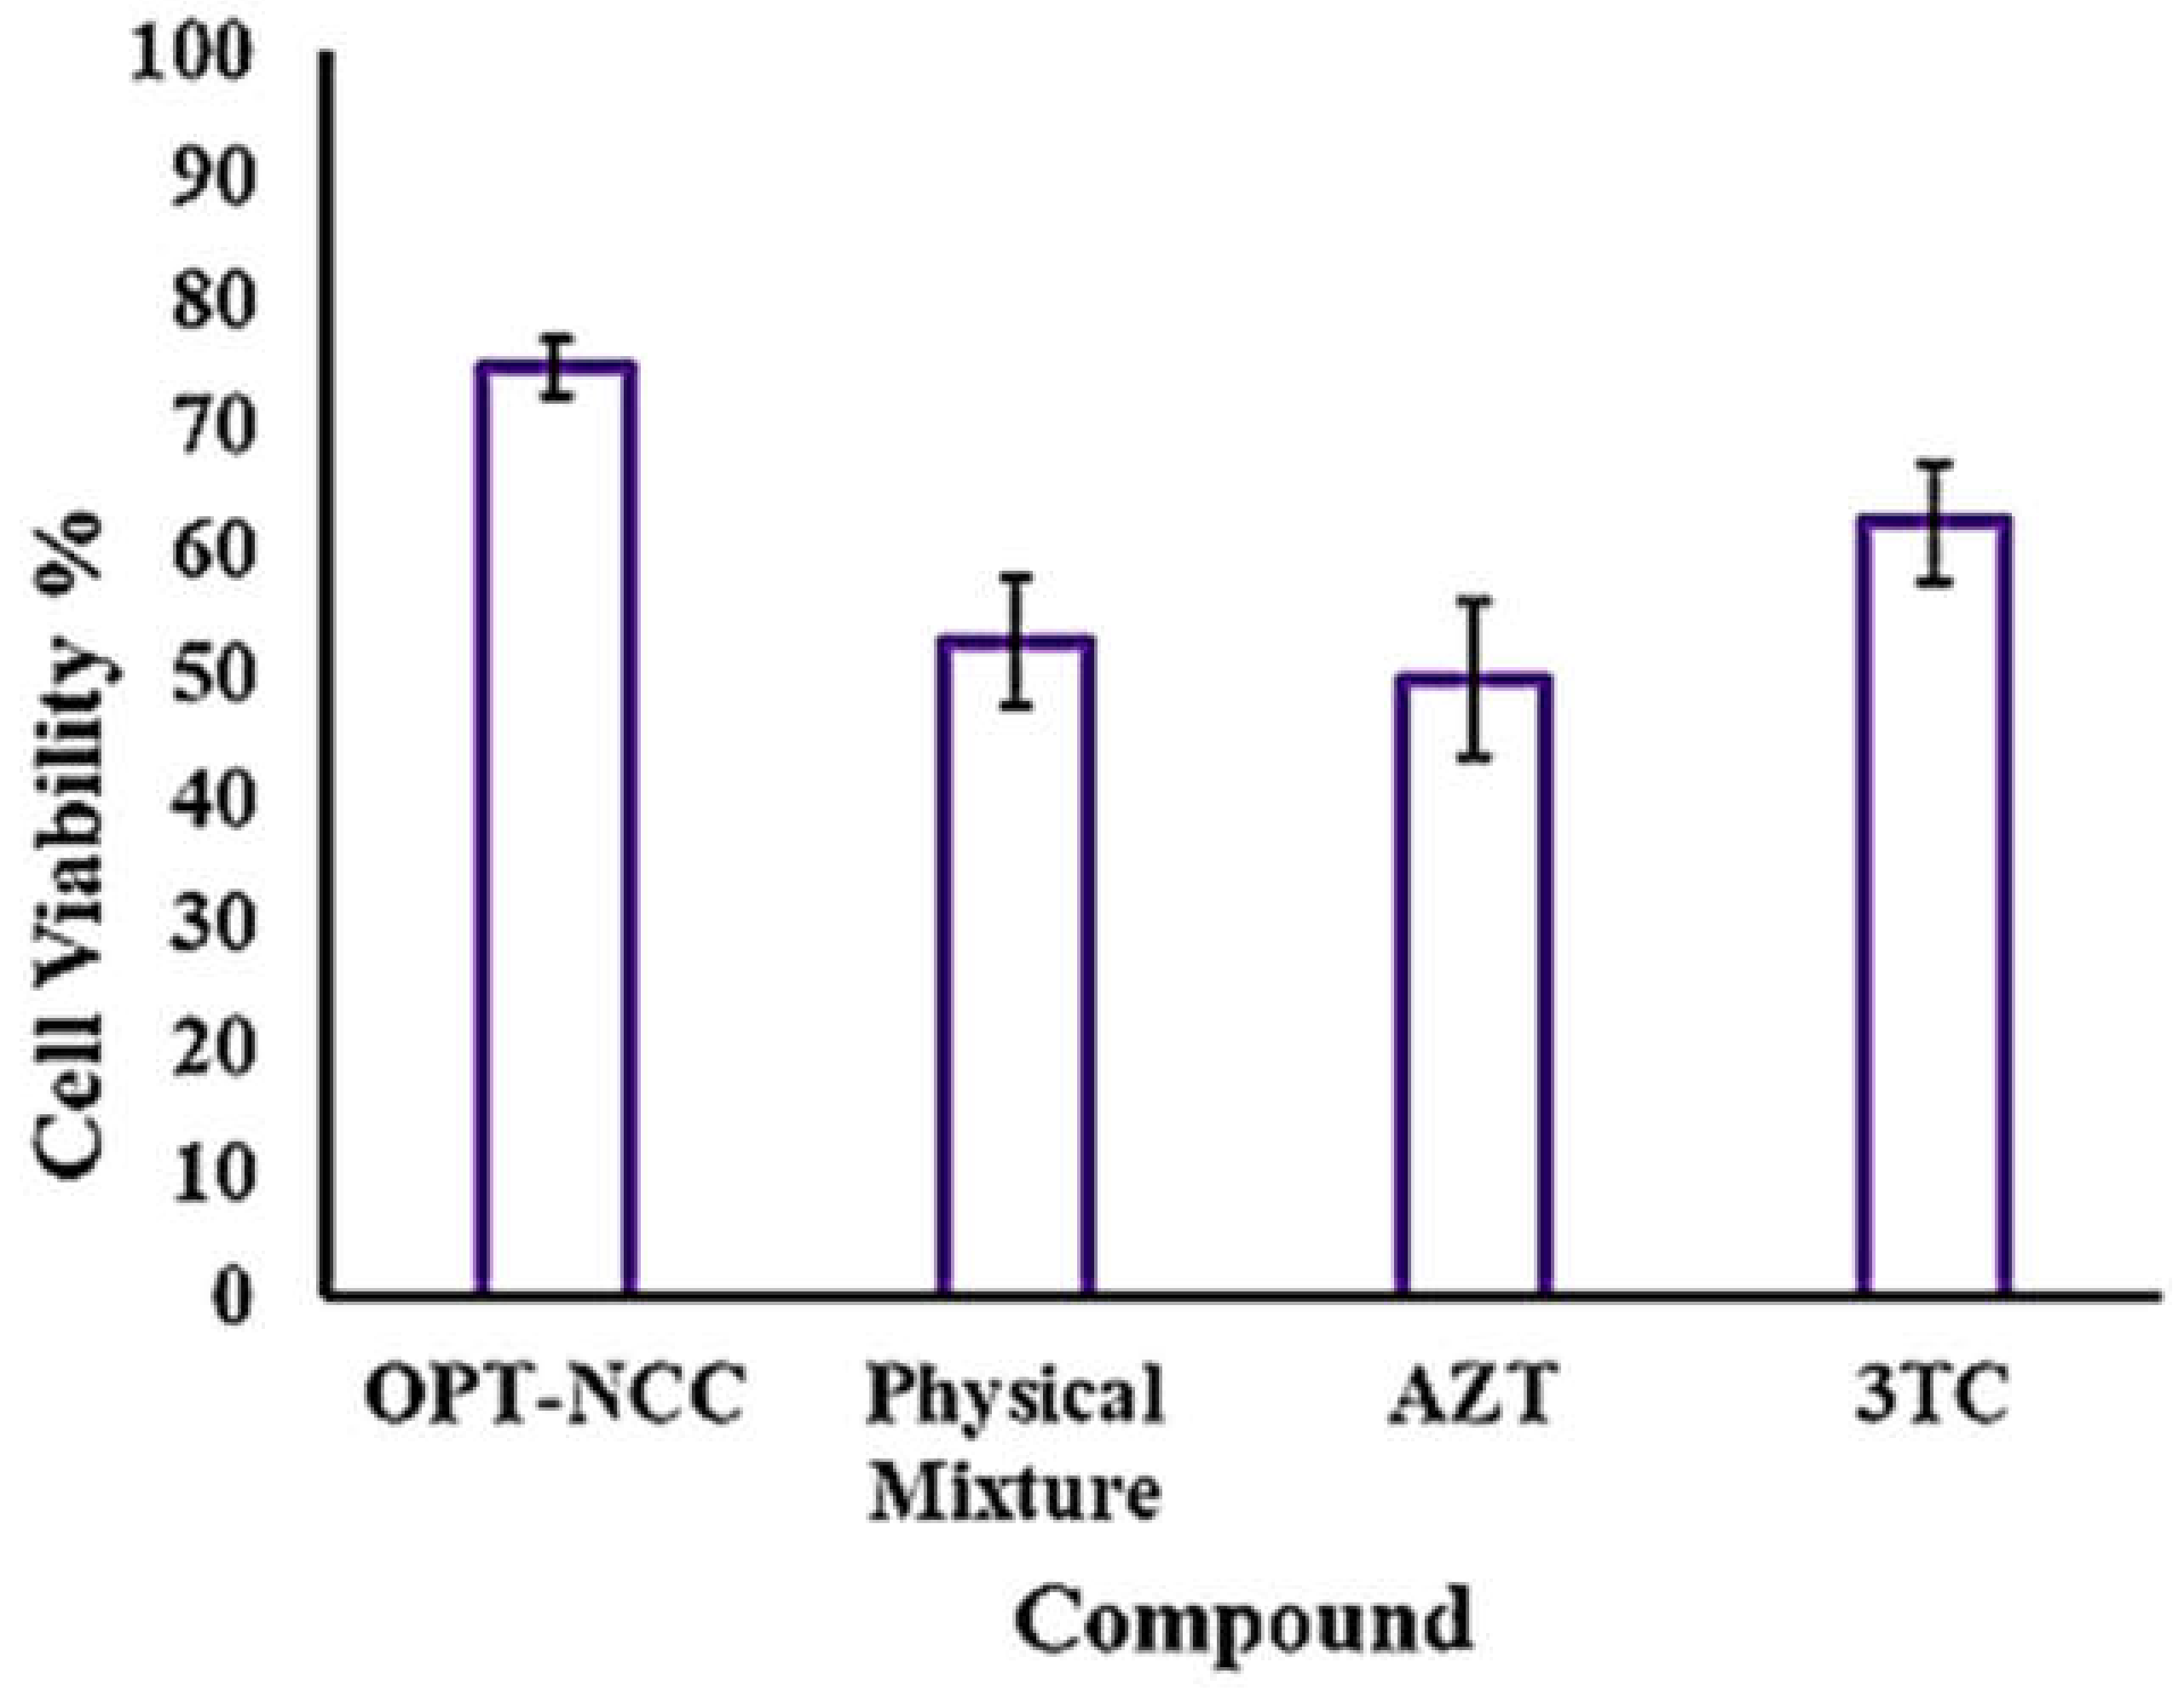
The OPT-NCC demonstrated a significant (p < 0.05) and improved cell viability when compared to the previously reported cell viability when 3TC and AZT raw materials were tested [56]. This finding may be due, in part, to the stabilisation effects of the surfactants that could have a shielding effect on the NCC. In addition, the use of TPGS 1000, a derivatised polyethylene glycol based surfactant, may also impart stealth properties to the NCC, thereby preventing uptake by the HeLa cells [76,77]. A summary of cell viability data is listed in Table S1 and depicted in Figure 8. The results observed were similar to those for NCC manufactured using a bottom-up approach and reported elsewhere [56]. The top-down NCC exhibited lower cell viability when compared to the bottom-up NCC, which is possibly due to the presence of milling contaminants from the top-down procedure used to produce the NCC, however, this difference in cell viability was not significant (p = 0.53).
4. Conclusions
A wet media milling approach was successfully used to manufacture 3TC and AZT nano co-crystals using SLS and TPGS 1000 as stabilisers. TPGS 1000 and SLS were included in the formulation to impart steric and electrostatic stabilisation properties to the NCC, respectively. A BBD was successfully used to identify the optimum production and composition parameters for surfactant concentration of TPGS 1000 1.50% w/v, SLS 1.00% w/v, milling with 2 balls, and a milling time of 30 minutes.
The PS was directly affected by the combined antagonistic effect of the number of milling balls and milling time, indicating that increasing the number of milling balls required a reduction in milling time to achieve the target PS. The PDI was not significantly affected by any of the factors investigated, and the PDI for the optimised formulation was within the specification of <0.500, set for these experiments. The ZP was primarily dependent on the presence of SLS. In order to achieve the development of a suitable technology for the delivery of AZT and 3TC, the ZP had to be minimised in order to increase the stability of potential carrier formulations for the prospective targeting of macrophages.
The physicochemical characterisation permitted determination of morphological features of the optimised nano co-crystals and revealed that the NCC were in the nanometre range and were crystalline in nature, thereby increasing stability. The in vitro cytotoxicity assay data revealed that the optimised NCC were less toxic than the 3TC and AZT when dosed individually as physical mixtures prepared in stoichiometric ratios similar to those used for the micro and NCC.
The success of this work is based on the manufacture of nanosuspensions capable of producing co-crystals of 3TC and AZT without using organic solvents during the nanosizing process. This method provides an additional and alternative approach to the previously developed and reported bottom-up process [56,57]. Of importance is that the top-down method described herein produced NCC with smaller dimensions and a more homogenous particle size distribution, when compared to those produced using the bottom-up technique. The proposed nano-formulation is a promising drug delivery tool for macrophage targeting and treatment of HIV/AIDS. In addition, the nanosuspensions may exhibit a reduced side effect profile, which could lead to increased adherence to therapy, thereby reducing the possibility of resistance to therapy.
Supplementary Materials
The following are available online at https://0-www-mdpi-com.brum.beds.ac.uk/2073-4352/11/1/33/s1. Figure S1: 3D response surface plot depicting the impact of SLS and TPGS concentrations on PS. Figure S2: 3D response surface plot depicting the impact of SLS and TPGS concentrations on PDI. Figure S3: FTIR spectra of the micro co-crystals (blue) [51] and OPT-NCC (green). Figure S4: PXRD diffractogram for the micro co-crystals (blue) [51] and the OPT-NCC (green). Figure S5: PXRD diffractograms of OPT-NCC (orange) and nano co-crystals (black) (Diffractogram obtained from CSD [78]). REFCODE: WOMHEM.
Author Contributions
B.A.W. performed the experiments, analysed the data, contributed to the conceptualisation of the research and wrote the manuscript. R.B.W. supervised and contributed to the conceptualisation of the research and writing and editing of the manuscript. V.J.S. contributed to the conceptualisation, supervision, bibliography research, and proofreading of the manuscript. All authors have read and agreed to the published version of the manuscript.
Funding
This research did not receive any specific grant from funding agencies in the public, commercial, or not-for-profit sectors.
Acknowledgments
The authors acknowledge the National Research Foundation (N.R.F.) (B.A.W.), the Research Committee of Rhodes University (R.B.W. and V.J.S.), and the Sandisa Imbewu fund (V.J.S.) for financial assistance.
Conflicts of Interest
The authors declare no conflict of interest.
References
- 1UNAIDS UNAIDS Data; 2019. Available online: https://www.unaids.org/en/resources/documents/2019/2019-UNAIDS-data (accessed on 29 December 2020).
- 2UNAIDS UNAIDS Data; 2020. Available online: https://www.unaids.org/en/resources/documents/2020/unaids-data (accessed on 29 December 2020).
- World Health Organization. National Centre for AIDS and STD Control National Anti-Retroviral Therapy Guidelines; World Health Organization: Geneva, Switzerland, 2009. [Google Scholar]
- Cihlar, T.; Ray, A.S. Nucleoside and nucleotide HIV reverse transcriptase inhibitors: 25 years after zidovudine. Antivir. Res. 2010, 85, 39–58. [Google Scholar] [CrossRef]
- Perry, C.M.; Faulds, D. Lamivudine. Drugs 1997, 53, 657–680. [Google Scholar] [CrossRef]
- Mandelbrot, L.; Landreau-Mascaro, A.; Rekacewicz, C.; Berrebi, A.; Benifla, J.L.; Burgard, M.; Lachassine, E.; Barret, B.; Chaix, M.-L.; Bongain, A.; et al. Lamivudine-Zidovudine Combination for Prevention of Maternal-Infant Transmission of HIV-1. Obstet. Gynecol. Surv. 2001, 56, 603–604. [Google Scholar] [CrossRef]
- Govender, T.; Ojewole, E.; Naidoo, P.; Mackraj, I. Polymeric Nanoparticles for Enhancing Antiretroviral Drug Therapy. Drug Deliv. 2008, 15, 493–501. [Google Scholar] [CrossRef] [PubMed]
- Flexner, C. Antiretroviral Agents and Treatment of HIV infection. In Goodman and Gilman’s The Pharmacological Basis of Therapeutics; McGraw-Hill: New York, NY, USA, 2011. [Google Scholar]
- Carr, A.; Cooper, D.A. Adverse effects of antiretroviral therapy. Lancet 2000, 356, 1423–1430. [Google Scholar] [CrossRef]
- Johnson, M.A.; Moore, K.H.; Yuen, G.J.; Bye, A.; Pakes, G.E. Clinical Pharmacokinetics of Lamivudine. Clin. Pharmacokinet. 1999, 36, 41–66. [Google Scholar] [CrossRef]
- Aitipamula, S.; Banerjee, R.; Bansal, A.K.; Biradha, K.; Cheney, M.L.; Choudhury, A.R.; Desiraju, G.R.; Dikundwar, A.G.; Dubey, R.; Duggirala, N.; et al. Polymorphs, Salts, and Cocrystals: What’s in a Name? Cryst. Growth Des. 2012, 12, 2147–2152. [Google Scholar] [CrossRef]
- Peterson, M.L.; Hickey, M.B.; Zhang, Z.; Almarsson, Ö. Expanding the scope of crystal form evaluation in pharmaceutical science. J. Pharm. Pharm. Sci. 2006, 9, 317–326. [Google Scholar]
- Sander, J.R.G.; Bučar, D.-K.; Henry, R.F.; Zhang, G.G.Z.; MacGillivray, L.R. Pharmaceutical Nano-Cocrystals: Sonochemical Synthesis by Solvent Selection and Use of a Surfactant. Angew. Chem. Int. Ed. 2010, 49, 7284–7288. [Google Scholar] [CrossRef]
- Maginn, S. Crystal engineering: The design of organic solidsby G. R. Desiraju. J. Appl. Crystallogr. 1991, 24, 265. [Google Scholar] [CrossRef] [Green Version]
- Karashima, M.; Kimoto, K.; Yamamoto, K.; Kojima, T.; Ikeda, Y. A novel solubilization technique for poorly soluble drugs through the integration of nanocrystal and cocrystal technologies. Eur. J. Pharm. Biopharm. 2016, 107, 142–150. [Google Scholar] [CrossRef] [PubMed]
- Merisko-Liversidge, E.; Liversidge, G.G. Nanosizing for oral and parenteral drug delivery: A perspective on formulating poorly-water soluble compounds using wet media milling technology. Adv. Drug Deliv. Rev. 2011, 63, 427–440. [Google Scholar] [CrossRef] [PubMed]
- Merisko-Liversidge, E.; Liversidge, G.G.; Cooper, E.R. Nanosizing: A formulation approach for poorly-water-soluble compounds. Eur. J. Pharm. Sci. 2003, 18, 113–120. [Google Scholar] [CrossRef]
- Sinha, B.; Müller, R.H.; Möschwitzer, J.P. Bottom-up approaches for preparing drug nanocrystals: Formulations and factors affecting particle size. Int. J. Pharm. 2013, 453, 126–141. [Google Scholar] [CrossRef]
- De Waard, H.; Frijlink, H.W.; Hinrichs, W.L. Bottom-Up Preparation Techniques for Nanocrystals of Lipophilic Drugs. Pharm. Res. 2010, 28, 1220–1223. [Google Scholar] [CrossRef] [Green Version]
- Li, M.; Yaragudi, N.; Afolabi, A.; Dave, R.; Bilgili, E. Sub-100nm drug particle suspensions prepared via wet milling with low bead contamination through novel process intensification. Chem. Eng. Sci. 2015, 130, 207–220. [Google Scholar] [CrossRef]
- Juhnke, M.; Martin, D.; John, E. Generation of wear during the production of drug nanosuspensions by wet media milling. Eur. J. Pharm. Biopharm. 2012, 81, 214–222. [Google Scholar] [CrossRef]
- Juhnke, M.; Berghausen, J.; Timpe, C. Accelerated Formulation Development for Nanomilled Active Pharmaceutical Ingredients Using a Screening Approach. Chem. Eng. Technol. 2010, 33, 1412–1418. [Google Scholar] [CrossRef]
- Liu, P.; de Wulf, O.; Laru, J.; Heikkilä, T.; van Veen, B.; Kiesvaara, J.; Hirvonen, J.; Peltonen, L.; Laaksonen, T. Dissolution Studies of Poorly Soluble Drug Nanosuspensions in Non-sink Conditions. AAPS PharmSciTech 2013, 14, 748–756. [Google Scholar] [CrossRef] [Green Version]
- Li, M.; Azad, M.; Davé, R.; Bilgili, E. Nanomilling of Drugs for Bioavailability Enhancement: A Holistic Formulation-Process Perspective. Pharmaceutics 2016, 8, 17. [Google Scholar] [CrossRef] [Green Version]
- Becker, M.; Schwedes, J. Comminution of ceramics in stirred media mills and wear of grinding beads. Powder Technol. 1999, 105, 374–381. [Google Scholar] [CrossRef]
- Cerdeira, A.M.; Mazzotti, M.; Gander, B. Miconazole nanosuspensions: Influence of formulation variables on particle size reduction and physical stability. Int. J. Pharm. 2010, 396, 210–218. [Google Scholar] [CrossRef] [PubMed]
- Kwade, A. Wet comminution in stirred media mills—Research and its practical application. Powder Technol. 1999, 105, 14–20. [Google Scholar] [CrossRef]
- Brosh, T.; Kalman, H.; Levy, A.; Peyron, I.; Ricard, F. DEM–CFD simulation of particle comminution in jet-mill. Powder Technol. 2014, 257, 104–112. [Google Scholar] [CrossRef]
- Merisko-Liversidge, E.; McGurk, S.L.; Liversidge, G.G. Insulin Nanoparticles: A Novel Formulation Approach for Poorly Water-Soluble Zn-Insulin. Pharm. Res. 2004, 21, 1545–1553. [Google Scholar] [CrossRef] [PubMed]
- Ali, H.S.M.; York, P.; Ali, A.M.A.; Blagden, N. Hydrocortisone nanosuspensions for ophthalmic delivery: A comparative study between microfluidic nanoprecipitation and wet milling. J. Control. Release 2011, 149, 175–181. [Google Scholar] [CrossRef] [PubMed]
- Colombo, M.; Orthmann, S.; Bellini, M.; Staufenbiel, S.; Bodmeier, R. Influence of Drug Brittleness, Nanomilling Time, and Freeze-Drying on the Crystallinity of Poorly Water-Soluble Drugs and Its Implications for Solubility Enhancement. AAPS PharmSciTech 2017, 18, 2437–2445. [Google Scholar] [CrossRef]
- Peltonen, L.; Hirvonen, J. Pharmaceutical nanocrystals by nanomilling: Critical process parameters, particle fracturing and stabilization methods. J. Pharm. Pharmacol. 2010, 62, 1569–1579. [Google Scholar] [CrossRef]
- Chamarthy, S.P.; Pinal, R. The nature of crystal disorder in milled pharmaceutical materials. Colloids Surfaces A Physicochem. Eng. Asp. 2008, 331, 68–75. [Google Scholar] [CrossRef]
- Crowley, K.J.; Zografi, G. Cryogenic grinding of indomethacin polymorphs and solvates: Assessment of amorphous phase formation and amorphous phase physical stability. J. Pharm. Sci. 2002, 91, 492–507. [Google Scholar] [CrossRef]
- Sharma, P.; Denny, W.A.; Garg, S. Effect of wet milling process on the solid state of indomethacin and simvastatin. Int. J. Pharm. 2009, 380, 40–48. [Google Scholar] [CrossRef] [PubMed]
- De Smet, L.; Saerens, L.; de Beer, T.; Carleer, R.; Adriaensens, P.; van Bocxlaer, J.; Vervaet, C.; Remon, J.P. Formulation of itraconazole nanococrystals and evaluation of their bioavailability in dogs. Eur. J. Pharm. Biopharm. 2014, 87, 107–113. [Google Scholar] [CrossRef] [PubMed] [Green Version]
- Pi, J.; Wang, S.; Li, W.; Kebebe, D.; Zhang, Y.; Qi, D.; Guo, P.; Li, N.; Zhidong, L. A nano-cocrystal strategy to improve the dissolution rate and oral bioavailability of baicalein. Asian J. Pharm. Sci. 2019, 14, 154–164. [Google Scholar] [CrossRef] [PubMed]
- Witika, B.; Mweetwa, L.; Matafwali, S.; Chabalenge, B.; Mwila, C.; Kalungia, A.C.; Nkanga, C.I.; Bapolisi, A.M.; Walker, R. Biocompatibility of Biomaterials for Nanoencapsulation: Current Approaches. Nanomaterilas 2020, 10, 1649. [Google Scholar] [CrossRef] [PubMed]
- Nielloud, F.; Marti-Mestres, G. Pharmaceutical Emulsions and Suspensions; Informa UK Limited: London, UK, 2000. [Google Scholar]
- Eon-Duval, A.; Valax, P.; Solacroup, T.; Broly, H.; Gleixner, R.; E Strat, C.L.; Sutter, J. Application of the quality by design approach to the drug substance manufacturing process of an Fc fusion protein: Towards a global multi-step design space. J. Pharm. Sci. 2012, 101, 3604–3618. [Google Scholar] [CrossRef]
- Martin-Moe, S.; Lim, F.J.; Wong, R.L.; Alavattam, S.; Sundaram, J.; Sane, S.U. A new roadmap for biopharmaceutical drug product development: Integrating development, validation, and quality by design. J. Pharm. Sci. 2011, 100, 3031–3043. [Google Scholar] [CrossRef]
- Bhatia, H.; Read, E.; Agarabi, C.D.; Brorson, K.; Lute, S.; Yoon, S. A design space exploration for control of Critical Quality Attributes of mAb. Int. J. Pharm. 2016, 512, 242–252. [Google Scholar] [CrossRef] [Green Version]
- Li, J.; Qiao, Y.; Wu, Z. Nanosystem trends in drug delivery using quality-by-design concept. J. Control. Release 2017, 256, 9–18. [Google Scholar] [CrossRef]
- Nowacek, A.S.; McMillan, J.; Miller, R.; Anderson, A.; Rabinow, B.; Gendelman, H.E. Nanoformulated Antiretroviral Drug Combinations Extend Drug Release and Antiretroviral Responses in HIV-1-Infected Macrophages: Implications for NeuroAIDS Therapeutics. J. Neuroimmune Pharmacol. 2010, 5, 592–601. [Google Scholar] [CrossRef] [Green Version]
- Orenstein, J.M. Replication of HIV-1 in Vivo and in Vitro. Ultrastruct. Pathol. 2007, 31, 151–167. [Google Scholar] [CrossRef]
- Koppensteiner, H.; Brack-Werner, R.; Schindler, M. Macrophages and their relevance in Human Immunodeficiency Virus Type I infection. Retrovirology 2012, 9, 82. [Google Scholar] [CrossRef] [PubMed] [Green Version]
- Van’t Klooster, G.; Hoeben, E.; Borghys, H.; Looszova, A.; Bouche, M.-P.; van Velsen, F.; Baert, L. Pharmacokinetics and Disposition of Rilpivirine (TMC278) Nanosuspension as a Long-Acting Injectable Antiretroviral Formulation. Antimicrob. Agents Chemother. 2010, 54, 2042–2050. [Google Scholar] [CrossRef] [Green Version]
- Kelly, C.; Jefferies, C.; Cryan, S.-A. Targeted Liposomal Drug Delivery to Monocytes and Macrophages. J. Drug Deliv. 2011, 2011, 1–11. [Google Scholar] [CrossRef] [PubMed]
- Bender, A.; Schfer, V.; Steffan, A.; Royer, C.; Kreuter, J.; Rübsamen-Waigmann, H.; von Briesen, H.; Schäfer, V. Inhibition of HIV in vitro by antiviral drug-targeting using nanoparticles. Res. Virol. 1994, 145, 215–220. [Google Scholar] [CrossRef]
- Désormeaux, A.; Bergeron, M.G. Lymphoid Tissue Targeting of Anti-HIV Drugs Using Liposomes. Methods Enzymol. 2005, 391, 330–351. [Google Scholar] [CrossRef] [PubMed]
- Ahsan, F. Targeting to macrophages: Role of physicochemical properties of particulate carriers—Liposomes and microspheres—On the phagocytosis by macrophages. J. Control. Release 2002, 79, 29–40. [Google Scholar] [CrossRef]
- Chono, S.; Tanino, T.; Seki, T.; Morimoto, K. Uptake characteristics of liposomes by rat alveolar macrophages: Influence of particle size and surface mannose modification. J. Pharm. Pharmacol. 2007, 59, 75–80. [Google Scholar] [CrossRef]
- Chono, S.; Tauchi, Y.; Morimoto, K. Influence of Particle Size on the Distributions of Liposomes to Atherosclerotic Lesions in Mice. Drug Dev. Ind. Pharm. 2006, 32, 125–135. [Google Scholar] [CrossRef]
- Chono, S.; Tanino, T.; Seki, T.; Morimoto, K. Influence of particle size on drug delivery to rat alveolar macrophages following pulmonary administration of ciprofloxacin incorporated into liposomes. J. Drug Target. 2006, 14, 557–566. [Google Scholar] [CrossRef]
- Baert, L.; Klooster, G.V.T.; Dries, W.; François, M.; Wouters, A.; Basstanie, E.; Iterbeke, K.; Stappers, F.; Stevens, P.; Schueller, L.; et al. Development of a long-acting injectable formulation with nanoparticles of rilpivirine (TMC278) for HIV treatment. Eur. J. Pharm. Biopharm. 2009, 72, 502–508. [Google Scholar] [CrossRef]
- Witika, B.; Smith, V.J.; Walker, R. Quality by Design Optimization of Cold Sonochemical Synthesis of Zidovudine-Lamivudine Nanosuspensions. Pharmaceutics 2020, 12, 367. [Google Scholar] [CrossRef] [PubMed] [Green Version]
- Witika, B.; Smith, V.J.; Walker, R. A Comparative Study of the Effect of Different Stabilizers on the Critical Quality Attributes of Self-Assembling Nano Co-Crystals. Pharmaceutics 2020, 12, 182. [Google Scholar] [CrossRef] [PubMed] [Green Version]
- Bezerra, M.A.; Santelli, R.E.; Oliveira, E.P.; Villar, L.S.; Escaleira, L.A. Response surface methodology (RSM) as a tool for optimization in analytical chemistry. Talanta 2008, 76, 965–977. [Google Scholar] [CrossRef] [PubMed]
- Wong, H.L.; Chattopadhyay, N.; Wu, X.Y.; Bendayan, R. Nanotechnology applications for improved delivery of antiretroviral drugs to the brain. Adv. Drug Deliv. Rev. 2010, 62, 503–517. [Google Scholar] [CrossRef] [PubMed]
- Toziopoulou, F.; Malamatari, M.; Nikolakakis, I.; Kachrimanis, K. Production of aprepitant nanocrystals by wet media milling and subsequent solidification. Int. J. Pharm. 2017, 533, 324–334. [Google Scholar] [CrossRef]
- Peltonen, L. Design Space and QbD Approach for Production of Drug Nanocrystals by Wet Media Milling Techniques. Pharmaceutics 2018, 10, 104. [Google Scholar] [CrossRef] [Green Version]
- Srivalli, K.M.R.; Mishra, B. Drug nanocrystals: A way toward scale-up. Saudi Pharm. J. 2016, 24, 386–404. [Google Scholar] [CrossRef] [Green Version]
- Ige, P.P.; Baria, R.K.; Gattani, S.G. Fabrication of fenofibrate nanocrystals by probe sonication method for enhancement of dissolution rate and oral bioavailability. Coll. Surf. B Biointerf. 2013, 108, 366–373. [Google Scholar] [CrossRef]
- Wigger-Alberti, W.; Krebs, A.; Elsner, P. Experimental irritant contact dermatitis due to cumulative epicutaneous exposure to sodium lauryl sulphate and toluene: Single and concurrent application. Br. J. Dermatol. 2000, 143, 551–556. [Google Scholar] [CrossRef]
- Adair, J.H.; Suvaci, E.; Sindel, J. Surface and Colloid Chemistry. In Encyclopedia of Materials: Science and Technology; Buschow, K.H.J., Cahn, R.W., Flemings, M.C., Ilschner, B., Kramer, E.J., Mahajan, S., Veyssière, P.B.T.-E., Eds.; Elsevier: Oxford, UK, 2001; pp. 1–10. ISBN 978-0-08-043152-9. [Google Scholar]
- Keck, C.M. Cyclosporine Nanosuspensions: Optimised Size Characterisation and Oral Formulations. Ph.D. Thesis, Freie Universitat Berlin, Berlin, Germany, 2006. [Google Scholar]
- Lopeandía, A.; Rodríguez-Viejo, J. Size-dependent melting and supercooling of Ge nanoparticles embedded in a SiO2 thin film. Thermochim. Acta 2007, 461, 82–87. [Google Scholar] [CrossRef]
- Sun, J.; Simon, S.L. The melting behavior of aluminum nanoparticles. Thermochim. Acta 2007, 463, 32–40. [Google Scholar] [CrossRef]
- Diwan, B.D. Size Effect on the Cohesive Energy of Palladium Nanoparticle. J. Comput. Theor. Nanosci. 2013, 10, 2779–2781. [Google Scholar] [CrossRef]
- Borchert, H.; Shevchenko, E.V.; Robert, A.; Mekis, I.; Kornowski, A.; Grübel, A.G.; Weller, H. Determination of Nanocrystal Sizes: A Comparison of TEM, SAXS, and XRD Studies of Highly Monodisperse CoPt3Particles. Langmuir 2005, 21, 1931–1936. [Google Scholar] [CrossRef] [PubMed]
- Bhaskar, R.; Li, J.; Xu, L. A Comparative Study of Particle Size Dependency of IR and XRD Methods for Quartz Analysis. Am. Ind. Hyg. Assoc. J. 1994, 55, 605–609. [Google Scholar] [CrossRef] [PubMed]
- Lang, A. X-ray diffraction procedures for polycrystal-line and amorphous materials. Acta Met. 1956, 4, 102. [Google Scholar] [CrossRef]
- Kamb, W.B. Theory of Preferred Crystal Orientation Developed by Crystallization under Stress. J. Geol. 2009, 67, 153–170. [Google Scholar] [CrossRef]
- Li, X.-S.; Wang, J.-X.; Shen, Z.-G.; Zhang, P.-Y.; Chen, J.-F.; Yun, J. Preparation of uniform prednisolone microcrystals by a controlled microprecipitation method. Int. J. Pharm. 2007, 342, 26–32. [Google Scholar] [CrossRef]
- Hennart, S.; Domingues, M.; Wildeboer, W.; van Hee, P.; Meesters, G. Study of the process of stirred ball milling of poorly water-soluble organic products using factorial design. Powder Technol. 2010, 198, 56–60. [Google Scholar] [CrossRef]
- Romberg, B.; Hennink, W.E.; Storm, G. Sheddable Coatings for Long-Circulating Nanoparticles. Pharm. Res. 2007, 25, 55–71. [Google Scholar] [CrossRef] [Green Version]
- Jadhav, P.; Bothiraja, C.; Pawar, A.P. Methotrexate-Loaded Nanomixed Micelles: Formulation, Characterization, Bioavailability, Safety, and In Vitro Anticancer Study. J. Pharm. Innov. 2018, 13, 213–225. [Google Scholar] [CrossRef]
- Groom, C.R.; Bruno, I.J.; Lightfoot, M.P.; Ward, S.C. The Cambridge Structural Database. Acta Crystallogr. Sect. B Struct. Sci. Cryst. Eng. Mater. 2016, 72, 171–179. [Google Scholar] [CrossRef] [PubMed]
Figure 1.
Schematic depiction of the wet media milling process used to produce nanoparticles.

Figure 2.
3D response surface plot depicting the impact of milling time and number of milling balls on particle size of a nano co-crystal (NCC).
Figure 2.
3D response surface plot depicting the impact of milling time and number of milling balls on particle size of a nano co-crystal (NCC).

Figure 3.
Schematic representation of possible mechanisms of particle interaction that may occur during wet media milling (Adapted from [24]).
Figure 3.
Schematic representation of possible mechanisms of particle interaction that may occur during wet media milling (Adapted from [24]).

Figure 4.
3D response surface plot depicting the impact of TPGS 1000 and SLS concentration on the ZP of the NCC.
Figure 4.
3D response surface plot depicting the impact of TPGS 1000 and SLS concentration on the ZP of the NCC.

Figure 5.
DSC thermogram of micro co-crystals (green) [57] and OPT-NCC (blue).
Figure 5.
DSC thermogram of micro co-crystals (green) [57] and OPT-NCC (blue).

Figure 6.
TEM micrograph of optimised NCC (OPT-NCC).

Figure 7.
Elemental analysis of micro co-crystals (red) and OPT-NCC (violet).

Figure 8.
Comparison of cytotoxicity assays of OPT-NCC, lamivudine (3TC), zidovudine (AZT), and physical mixture.
Figure 8.
Comparison of cytotoxicity assays of OPT-NCC, lamivudine (3TC), zidovudine (AZT), and physical mixture.


Table 1.
Summary of the Box–Behnken design (BBD) experiments.
| Std Run | Formulation Code | No. of Balls (A) | Milling Time min (B) | SLS * % w/v (C) | TPGS 1000 * % w/v (D) |
|---|---|---|---|---|---|
| 4 | 1 | 3 | 30 | 0.5 | 1.5 |
| 6 | 2 | 2 | 20 | 1.0 | 1.0 |
| 21 | 3 | 2 | 10 | 0.5 | 1.0 |
| 9 | 4 | 1 | 20 | 0.5 | 1.0 |
| 24 | 5 | 2 | 30 | 0.5 | 2.0 |
| 12 | 6 | 3 | 20 | 0.5 | 2.0 |
| 13 | 7 | 2 | 10 | 0.0 | 1.5 |
| 10 | 8 | 3 | 20 | 0.5 | 1.0 |
| 19 | 9 | 1 | 20 | 1.0 | 1.5 |
| 17 | 10 | 1 | 20 | 0.0 | 1.5 |
| 20 | 11 | 3 | 20 | 1.0 | 1.5 |
| 7 | 12 | 2 | 20 | 0.0 | 2.0 |
| 26 | 13 | 2 | 20 | 0.5 | 1.5 |
| 18 | 14 | 3 | 20 | 0.0 | 1.5 |
| 23 | 15 | 2 | 10 | 0.5 | 2.0 |
| 15 | 16 | 2 | 10 | 1.0 | 1.5 |
| 25 | 17 | 2 | 20 | 0.5 | 1.5 |
| 11 | 18 | 1 | 20 | 0.5 | 2.0 |
| 8 | 19 | 2 | 20 | 1.0 | 2.0 |
| 5 | 20 | 2 | 20 | 0.0 | 1.0 |
| 28 | 21 | 2 | 20 | 0.5 | 1.5 |
| 14 | 22 | 2 | 30 | 0.0 | 1.5 |
| 2 | 23 | 3 | 10 | 0.5 | 1.5 |
| 22 | 24 | 2 | 30 | 0.5 | 1.0 |
| 3 | 25 | 1 | 30 | 0.5 | 1.5 |
| 29 | 26 | 2 | 20 | 0.5 | 1.5 |
| 16 | 27 | 2 | 30 | 1.0 | 1.5 |
| 27 | 28 | 2 | 20 | 0.5 | 1.5 |
| 1 | 29 | 1 | 10 | 0.5 | 1.5 |
* SLS—sodium lauryl sulphate; TPGS 1000—α-tocopheryl polyethylene glycol succinate 1000
Table 2.
Summary of optimisation parameters and predicted outputs.
| Number of Balls | Milling Time min | SLS Conc. %w/v | TPGS Conc. %w/v | D |
|---|---|---|---|---|
| 2 | 30 | 1 | 1.5 | 1 |
D = Desirability.
Table 3.
Results observed following BBD experiments.
| Std. Run | Formulation Code | * PS nm | * PDI | * ZP mV |
|---|---|---|---|---|
| 4 | 1 | 456.1 ± 86.9 | 0.504 ± 0.113 | −28.7 ± 1.2 |
| 6 | 2 | 455.5 ± 16.5 | 0.513 ± 0.070 | −43.6 ± 3.9 |
| 21 | 3 | 548.7 ± 25.5 | 0.49 ± 0.023 | −28.5 ± 2.4 |
| 9 | 4 | 836.1 ± 14.7 | 0.537 ± 0.029 | −29.7 ± 1.8 |
| 24 | 5 | 553.8 ± 26.9 | 0.556 ± 0.023 | −20.4 ± 0.6 |
| 12 | 6 | 486.5 ± 38.2 | 0.516 ± 0. 026 | −19.4 ± 0.7 |
| 13 | 7 | 216.1 ± 22.1 | 0.364 ± 0.092 | −8.4 ± 0.1 |
| 10 | 8 | 194.5 ± 58.6 | 0.414 ± 0.108 | −28.4 ± 1.2 |
| 19 | 9 | 229.5 ± 33.7 | 0.479 ± 0.099 | −42.8 ± 4.6 |
| 17 | 10 | 1167 ± 29.0 | 0.495 ± 0.020 | −8.2 ± 0.7 |
| 20 | 11 | 148.0 ± 17.7 | 0.434 ± 0.011 | −49 ± 3.2 |
| 7 | 12 | 893.7 ± 40.4 | 0.517 ± 0.180 | −8.3 ± 0.5 |
| 26 | 13 | 205.3 ± 2.8 | 0.557 ± 0.041 | −27.9 ± 2.3 |
| 18 | 14 | 1643 ± 28.5 | 0.224 ± 0.090 | −6.2 ± 1.1 |
| 23 | 15 | 315.7 ± 40.2 | 0.507 ± 0.111 | −27.7 ± 2.9 |
| 15 | 16 | 219.1 ± 28.9 | 0.415 ± 0,060 | −43.3 ± 3.2 |
| 25 | 17 | 461.4 ± 47.2 | 0.37 ± 0.021 | −29.9 ± 1.2 |
| 11 | 18 | 692.1 ± 88.2 | 0.576 ± 0.047 | −29.3 ± 2.7 |
| 8 | 19 | 153.3 ± 28.8 | 0.51 ± 0.087 | −31.8 ± 3.1 |
| 5 | 20 | 625.7 ± 48.2 | 0.307 ± 0.077 | −13.7 ± 1.2 |
| 28 | 21 | 235.3 ± 22.7 | 0.428 ± 0.049 | −30.1 ± 1.1 |
| 14 | 22 | 840.6 ± 83.7 | 0.444 ± 0.035 | −27.1 ± 22.6 |
| 2 | 23 | 783.1 ± 76.2 | 0.761 ± 0.045 | −29 ± 2.1 |
| 22 | 24 | 278.8 ±52.3 | 0.355 ± 0.055 | −28.5 ± 3.0 |
| 3 | 25 | 1042 ± 18.4 | 0.355 ± 0.152 | −26.6 ± 2.1 |
| 29 | 26 | 305.7 ± 62.8 | 0.497 ± 0.076 | −29.8 ± 0.9 |
| 16 | 27 | 215.6 ± 37.7 | 0.364 ± 0.143 | −42.3 ± 0.3 |
| 27 | 28 | 239.1 ± 48.2 | 0.419 ± 0.106 | −30.2 ± 0.8 |
| 1 | 29 | 498.2 ± 31.3 | 0.464 ± 0.037 | −30.4 ± 1.8 |
* PS—particle size; PDI—polydispersity index; ZP—Zeta potential.
Table 4.
ANOVA data for the response surface quadratic model for PS.
| Source | Sum of Squares | Df | Mean Square | F-Value | p-Value Prob > F | |
|---|---|---|---|---|---|---|
| Model | 14 | 1.91 × 10⁵ | 3.02 | 0.0237 | ||
| A: Number of balls | 47,338.6 | 1 | 47,338.64 | 0.75 | 0.4019 | |
| B: Milling Time | 54,136.3 | 1 | 54,136.33 | 0.85 | 0.3709 | |
| C: SLS conc. | 1.31 × 10⁶ | 1 | 1.31 × 10⁶ | 20.69 | 0.0005 | |
| D: TPGS 1000 conc. | 2022.8 | 1 | 2022.8 | 0.032 | 0.8607 | |
| AB | 1.90 × 10⁵ | 1 | 1.90 × 10⁵ | 2.99 | 0.1056 | |
| AC | 77,701.6 | 1 | 77,701.56 | 1.23 | 0.2867 | |
| AD | 47,524 | 1 | 47,524 | 0.75 | 0.401 | |
| BC | 98,596 | 1 | 98,596 | 1.56 | 0.2326 | |
| BD | 64,516 | 1 | 64,516 | 1.02 | 0.33 | |
| CD | 81,282 | 1 | 81,282.01 | 1.28 | 0.2763 | |
| A2 | 6.44 × 10⁵ | 1 | 6.44 × 10⁵ | 10.17 | 0.0066 | |
| B2 | 9916.18 | 1 | 9916.18 | 0.16 | 0.6983 | |
| C2 | 1.35 × 10⁵ | 1 | 1.35 × 10⁵ | 2.12 | 0.1671 | |
| D2 | 14,588.4 | 1 | 14,588.44 | 0.23 | 0.6387 | |
| Residual | 8.867 × 10⁵ | 14 | 63,338.53 | |||
| Lack of Fit | 8.444 × 10⁵ | 10 | 84,436.01 | 7.97 | 0.0301 | |
| Pure Error | 42,379.4 | 4 | 10,594.85 | |||
| Cor Total | 28 | |||||
Table 5.
ANOVA data for the response surface linear model for PDI.
| Source | Sum of Squares | Df | Mean Square | F-Value | P-Value Prob > F |
|---|---|---|---|---|---|
| Model | 0.053 | 4 | 0.013 | 1.37 | 0.2724 |
| A: Number of balls | 2.341 × 10⁻⁴ | 1 | 2.34 × 10⁻⁴ | 0.024 | 0.8773 |
| B:Milling Time | 0.015 | 1 | 0.015 | 1.55 | 0.2251 |
| C: SLS conc. | 0.011 | 1 | 0.011 | 1.15 | 0.2947 |
| D: TPGS 1000 conc. | 0.027 | 1 | 0.027 | 2.78 | 0.1087 |
| Residual | 0.23 | 24 | 9.62 × 10⁻³ | ||
| Lack of Fit | 0.21 | 20 | 0.01 | 1.96 | 0.2718 |
| Pure Error | 0.021 | 4 | 5.35 × 10⁻³ | ||
| Cor Total | 0.28 | 28 | |||
Table 6.
ANOVA data for the response surface linear model for ZP.
| Source | Sum of Squares | Df | Mean Square | F Value | P-Value Prob > F |
|---|---|---|---|---|---|
| Model | 3990.57 | 4 | 997.64 | 45.51 | <0.0001 |
| A: Number of balls | 3.31 | 1 | 3.31 | 0.15 | 0.7011 |
| B: Milling Time | 12.61 | 1 | 12.61 | 0.58 | 0.4556 |
| C: SLS conc. | 3920.47 | 1 | 3920.47 | 178.85 | <0.0001 |
| D: TPGS 1000 conc. | 54.19 | 1 | 54.19 | 2.47 | 0.129 |
| Residual | 526.09 | 24 | 21.92 | ||
| Lack of Fit | 522.46 | 20 | 26.12 | 28.8 | 0.0025 |
| Pure Error | 3.63 | 4 | 0.91 | ||
| Cor Total | 4516.66 | 28 |
Table 7.
Summary of results for the NCC using optimum formulation and process parameters.
| Response | Predicted | Experimental | % Predicted Error |
|---|---|---|---|
| PS (nm) | 252.18 | 271.0 ± 92.0 | 7.47 |
| PDI | 0.456 | 0.467 ± 0.073 | 2.41 |
| ZP (mV) | −47.9 | −41.9 ± 3.9 | 12.53 |
Table 8.
Summary of the elemental analysis of OPT-NCC and micro co-crystals.
| Element | OPT-NCC | Micro Co-Crystal |
|---|---|---|
| Atomic % | Atomic % | |
| C | 51.07 ± 0.88 | 48.26 ± 0.52 |
| N | 21.43 ± 0.62 | 20.75 ± 0.87 |
| O | 23.70 ± 1.06 | 29.96 ± 0.73 |
| Na | 0.90 ± 0.04 | - |
| S | 2.63 ± 0.21 | 1.03 ± 0.09 |
| Cr | 0.06 ± 0.01 | - |
| Fe | 0.21 ± 0.08 | - |
Publisher’s Note: MDPI stays neutral with regard to jurisdictional claims in published maps and institutional affiliations. |
© 2020 by the authors. Licensee MDPI, Basel, Switzerland. This article is an open access article distributed under the terms and conditions of the Creative Commons Attribution (CC BY) license (http://creativecommons.org/licenses/by/4.0/).
Share and Cite
MDPI and ACS Style
Witika, B.A.; Smith, V.J.; Walker, R.B. Top-Down Synthesis of a Lamivudine-Zidovudine Nano Co-Crystal. Crystals 2021, 11, 33. https://0-doi-org.brum.beds.ac.uk/10.3390/cryst11010033
AMA Style
Witika BA, Smith VJ, Walker RB. Top-Down Synthesis of a Lamivudine-Zidovudine Nano Co-Crystal. Crystals. 2021; 11(1):33. https://0-doi-org.brum.beds.ac.uk/10.3390/cryst11010033
Chicago/Turabian StyleWitika, Bwalya A., Vincent J. Smith, and Roderick B. Walker. 2021. "Top-Down Synthesis of a Lamivudine-Zidovudine Nano Co-Crystal" Crystals 11, no. 1: 33. https://0-doi-org.brum.beds.ac.uk/10.3390/cryst11010033
Note that from the first issue of 2016, this journal uses article numbers instead of page numbers. See further details here.