Article

Micromechanics of Void Nucleation and Early Growth at Incoherent Precipitates: Lattice-Trapped and Dislocation-Mediated Delamination Modes

1
Department of Materials Science and Engineering, Rutgers University, Piscataway, NJ 08854, USA
2
Sandia National Laboratories, Albuquerque, NM 87185, USA
*
Author to whom correspondence should be addressed.
Submission received: 21 November 2020 / Revised: 30 December 2020 / Accepted: 2 January 2021 / Published: 7 January 2021
(This article belongs to the Special Issue Crystal Plasticity at Micro- and Nano-scale Dimensions)

Abstract

:
The initial stages of debonding at hard-particle interfaces during rupture is relevant to the fracture of most structural alloys, yet details of the mechanistic process for rupture at the atomic scale are poorly understood. In this study, we employ molecular dynamics simulation of a spherical Al2Cu θ precipitate in an aluminum matrix to examine the earliest stages of void formation and nanocrack growth at the particle-matrix interface, at temperatures ranging from 200–400 K and stresses ranging from 5.7–7.2 GPa. The simulations revealed a three-stage process involving (1) stochastic instantaneous or delayed nucleation of excess free volume at the particle-matrix interface involving only tens of atoms, followed by (2) steady time-dependent crack growth in the absence of dislocation activity, followed by (3) dramatically accelerated crack growth facilitated by crack-tip dislocation emission. While not all three stages were present for all stresses and temperatures, the second stage, termed lattice-trapped delamination, was consistently the rate-limiting process. This lattice-trapped delamination process was determined to be a thermally activated brittle fracture mode with an unambiguous Arrhenius activation energy of 1.37 eV and an activation area of 1.17 Å2. The role of lattice-trapped delamination in the early stages of particle delamination is not only relevant at the high strain-rates and stresses associated with shock spallation, but Arrhenius extrapolation suggests that the mechanism also operates during quasi-static rupture at micrometer-scale particles.

1. Introduction

Void nucleation is the first step towards fracture in many different contexts, including quasi-static tearing, dynamic spall, creep rupture, irradiation creep, and wear debris generation. Voids are predominantly thought to nucleate at second phase particles, either when the particles crack or when the interface between the particle and matrix debonds [1]. Here, we focus on the earliest stages of void nucleation via particle delamination. Subsequent to nucleation, these voids grow until they induce fracture. While many studies have employed continuum models, such as finite element modeling [2,3,4,5], to evaluate the process of void nucleation, the atomistic mechanisms governing nucleation are less well studied. And yet, since void nucleation begins at the nanoscale, it is intrinsically an atomistic process [6]. Our goal in this work is to evaluate void nucleation in a model system with an incoherent, second-phase particle (θ-particle in Al) in an effort to reveal the underlying micromechanics and kinetically limiting processes.
Given its central role in fracture, continuum damage models commonly invoke void nucleation in their underlying formalisms. Perhaps the most popular approach is the porous plasticity model of Gurson, Tvergaard, and Needleman [7] which utilizes a yield criterion that is a function of the void volume fraction, f . In this model, the void volume fraction is governed by a differential equation of the form:
f ˙ = f ˙ nuc + f ˙ growth
where f ˙ nuc and f ˙ growth account for the contributions from nucleation and growth events, respectively. Ideally, the term f ˙ nuc would be derived from a fundamental, micromechanics-based understanding of void nucleation. Given that this understanding is lacking, a more phenomenological approach is commonly utilized. For example, it is commonly assumed that void nucleation occurs at particles when a critical plastic strain, ε c P , is reached, and that ε c P varies from particle to particle according to a probability density function F ( ε P / ε c P ) where ε P is the equivalent plastic strain [8,9]. The void volume fraction then increases in time as a result of void nucleation according to the expression:
f ˙ nuc = F ( ε P / ε c P ) ε ˙ P
where ε ˙ P is the equivalent plastic strain rate. Usually, F ( ε P / ε c P ) is assumed to be a normal distribution with mean ε ¯ c P and standard deviation s ε c [8], however there is no direct evidence which justifies this choice. Furthermore, ε ¯ c P and s ε c are treated as empirical parameters that are fitted against experimental data (e.g., stress-strain curves). While this and other similar phenomenological approaches have been applied pervasively across the literature, the Sandia Fracture Challenges have recently shown that these models often fare poorly when making blind fracture predictions [10,11,12]. This motivates a deeper look at the micromechanics of void nucleation, so that strong assumptions about what governs fracture (a critical strain?) and how the propensity for fracture varies across the population of particles (normally distributed?) can be lifted.
Unfortunately, the critical strain ε c P is not easily studied using micromechanical simulations because plastic strain is really a homogenized, macroscale concept; at the microscale where discrete dislocations interact with particles, plastic strain is not a very relevant concept. On the other hand, some damage mechanics models employ a critical stress σ c at which nucleation occurs [9], which is more consistent with micromechanics modeling (the stress state can be specified in molecular dynamics, for example). Here, we argue, however, that rather than focusing on a “critical stress” at which void nucleation occurs, it makes more sense to consider how the nucleation rate varies with stress state, temperature, etc. In other words, void nucleation can occur over a range of stresses, with the nucleation rate increasing as the stress is increased. This view is more consistent with other works on crack nucleation, which focus on the nucleation rate [13,14]. Within this view, the critical stress is the stress at which the nucleation rate goes to infinity, meaning that nucleation occurs instantaneously. We note that the nucleation rate for a given state is likely only well-defined in an average sense, because nucleation is a stochastic phenomenon. This means that at each state, there is a distribution of nucleation rates (which could be interpreted in probabilistic terms). We argue that the possibility of “subcritical” nucleation, i.e., with σ < σ c , and the statistical aspects of nucleation could be important to the overall nucleation process. For these reasons, our focus here is on the stress and temperature dependence of the void nucleation rate.
An important nuance to the study of void nucleation is deciding when exactly a void is said to “nucleate.” As soon as a crack appears within the particle-matrix interface? Or after a significant fraction of the interface has delaminated? We may expect that a clear nucleation event occurs whereby a crack “suddenly” appears along the interface, allowing us to disentangle this terminological ambiguity, although the appearance of a crack is often limited by the spatial and temporal resolution of the techniques employed. In the present approach, with atomic-scale and picosecond resolution, the initial emergence of a crack is still difficult to define: we observed steady growth of an interfacial crack starting from a vacancy-sized nucleus. We were unable to determine the precise mechanism by which the vacancy-sized nucleus appeared, however. Furthermore, the appearance of the vacancy-sized nucleus did not control the kinetics of void nucleation. Instead, we found that it was the subsequent growth of the crack that governed the overall delamination (e.g., void nucleation) process. Hence, we find that it is the delamination rate, controlled by the growth of a crack, which governs the void nucleation rate. For this reason, we refer to our simulations as studying void nucleation and “early growth.”
Void nucleation has been studied in perfect crystals [15,16,17,18,19,20,21,22], at grain boundaries [23,24], ahead of crack tips [25], and at second-phase particles [26,27,28,29] using molecular dynamics. In most cases, void nucleation results from interactions between several crystallographic defects, such as grain boundaries and twins/dislocations [23,24], pairs of intersecting stacking faults [21], and particles and dislocations [26,27,30]. The previous work on particle-mediated void nucleation is most relevant here. Coffman et al. [31] studied void nucleation in Si under uniaxial tension with a cubic nanograin “particle” that delaminated from the surrounding matrix. They first performed atomistic simulations to calibrate a continuum fracture model (a cohesive zone model), and then compared atomistic and continuum predictions of void nucleation. In general, they found poor agreement between the models, motivating the need for further studies of void nucleation with atomistic resolution. Pogorelko and Mayer [26,27,28,29] and Cui and Chen [30] studied void nucleation at spherical particles in a variety of material systems, considering the influence of strain rate, temperature, simulation box size, and particle volume fraction on the delamination behavior under a fixed uniaxial strain rate. In simulations with face-centered cubic (FCC) matrices [26,27,29,30], nucleation was observed to occur in two stages: first a crack nucleated at the top and bottom poles along the loading axis (similar to the behavior predicted by continuum models [2]), and then after some subsequent growth dislocations were emitted from the crack tips. On the other hand, nucleation with body-centered cubic and hexagonal close-packed (HCP) matrices seemed to initiate from defects in the matrix rather than at the particle-matrix interface [28]. While the tensile strength of these systems has been characterized extensively using these simulation results, the nucleation rate could not be estimated because of the fixed-strain-rate boundary conditions.
Our study here had two goals: (1) to assess the stress and temperature dependence of the void nucleation and early growth rate with MD and (2) identify the micromechanical processes which govern the kinetics. In contrast to previous work [26,27,28,29,30], we perform simulations here with a fixed stress state (and temperature), so that our results can be used to estimate the stress and temperature-dependent rates. Our findings indicate that void nucleation may be rate limited by the kinetics of crack growth processes rather than the kinetics of crack nucleation (e.g., the time it takes for a crack to appear). Furthermore, we show two distinct delamination modes with drastically different growth kinetics. Finally, we conclude that a brittle delamination mode which we term lattice-trapped delamination may be an important contributor to void nucleation. While the stress range employed here (5.7 to 7.2 GPa) is high relative to quasi-static loading, it is in the range where shock spallation is observed under high loading rates [32,33]. Furthermore, through a thermal activation analysis of our data we are able to extrapolate our results down to lower stress conditions. The remainder of the work is organized as follows. In Section 2 we discuss our simulation setup and analysis methods, in Section 3 we present our results, in Section 4 we discuss the implications of our findings and compare results with existing theories, and finally conclude the manuscript in Section 5.

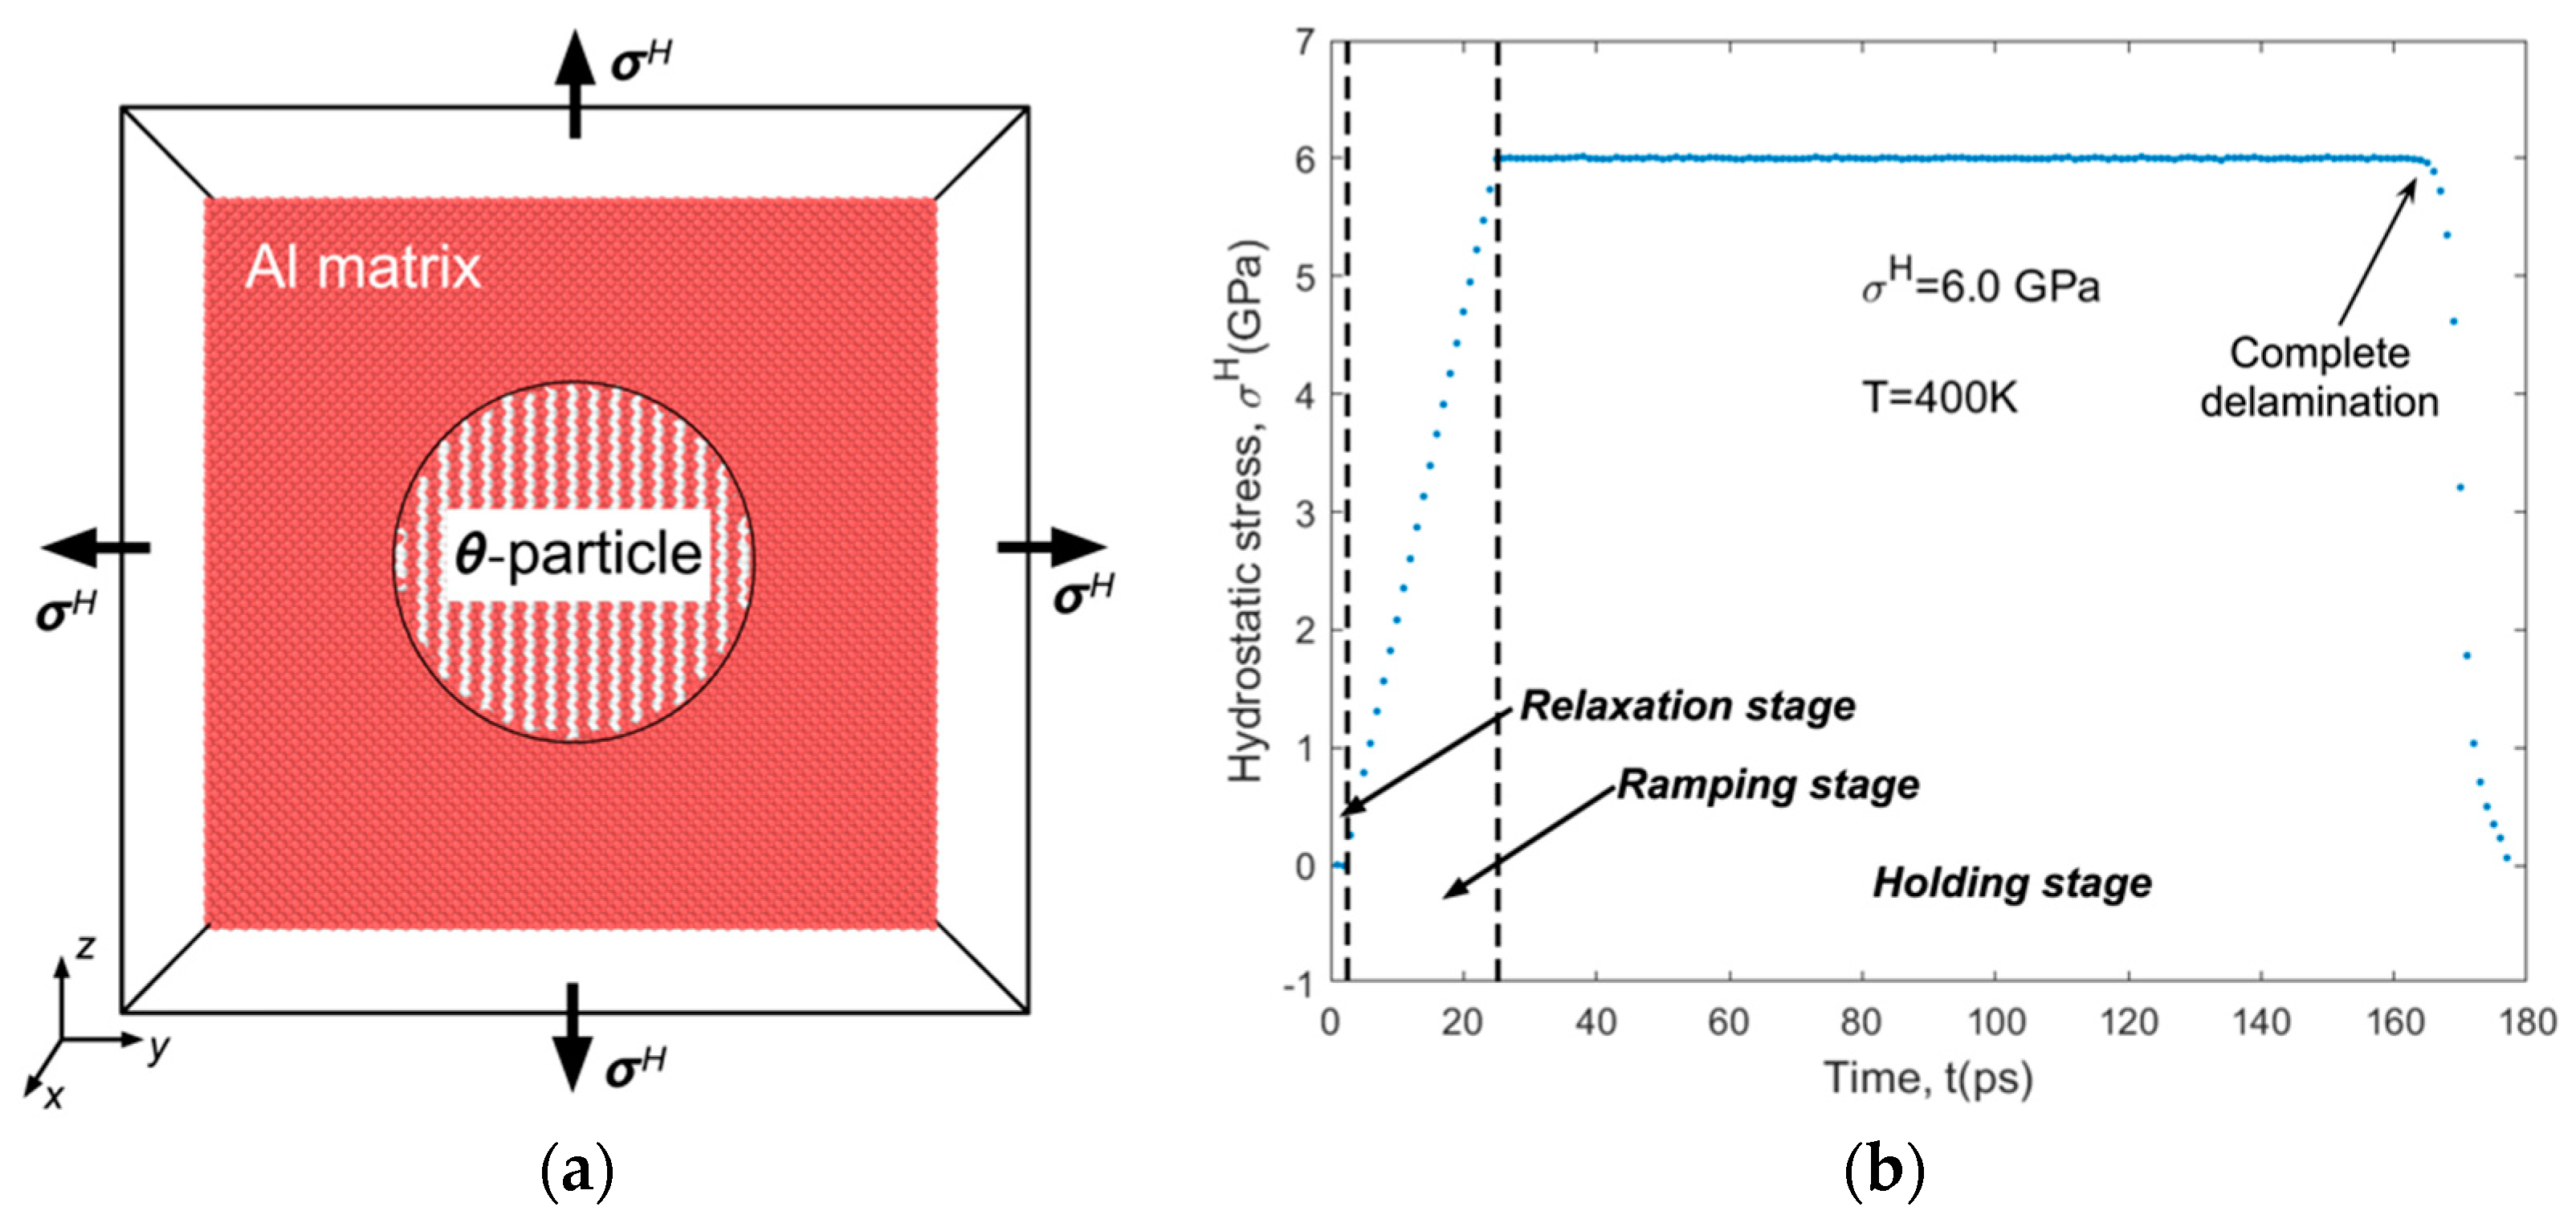
2. Materials and Methods

As a model system, we consider void nucleation at θ-particles in an FCC Al matrix. θ is the thermodynamically stable intermetallic phase of the Al-Cu system and is commonly observed in Al-Cu-copper alloys (e.g., 2xxx series) in the overaged condition [34]. θ-particles have a composition of Al2Cu and a body-centered tetragonal C16 crystal structure. They are incoherent with the matrix and typically adopt plate-like geometries [35]. However, for simplicity in this work we will use a spherical precipitate geometry. While there is evidence that voids may nucleate at θ-particles [36], we emphasize that we are using the θ-Al system as a model incoherent precipitate system with the goal of gaining general insight into the micromechanics and kinetics of void nucleation.
MD simulations were performed using LAMMPS [37] with the Al-Cu angular-dependent interatomic potential of Apostol and Mishin [38]. The angular-dependent potential framework is an enriched version of the embedded atom method that enables incorporation of angular-dependent interactions. These interactions enable the potential to capture the lattice constants, anisotropic elastic moduli, and formation energy of the θ-phase with reasonable accuracy. Our simulation cell geometry is shown in Figure 1a; we initially inserted an incoherent spherical particle with a radius of R = 50 Å into a pure Al lattice using the zero-temperature lattice parameters predicted by the potentials. The Al lattice and θ-particle are oriented so that their unit cell axes are aligned with the simulation box. The c-axis of the θ-lattice is oriented in the z-direction of the simulation cell. Periodic boundary conditions were used in all directions with a 200 Å cubic simulation cell. The sequence of each simulation is shown in Figure 1b. During the relaxation stage, we used an NPT (constant number of atoms N, pressure P, and temperature T) ensemble and simulated 2 ps at the chosen temperature and zero hydrostatic stress. Subsequently, during the ramping stage we ramped the hydrostatic stress up to the target value σ H over a duration of 23 ps. This duration was chosen empirically; if the stress was ramped too quickly we observed “premature” void nucleation, likely because of stress spikes resulting from imperfect performance of the barostat. See Appendix A for additional information. Finally, during the holding stage, the hydrostatic stress was held constant for the duration of the simulation until the particle completely debonded from the matrix or the simulation terminated after 1-week of wall time. All simulations used a thermostat damping parameter value of 0.01 ps, barostat damping parameter value of 1 ps, and a time step size of 0.001 ps.
We note that while the MD barostat controls the average (virial) stress state in the simulation cell, the local stress state may vary. In fact, we expect there to be variation because the elastic constants between the matrix and particle differ, i.e., this is an Eshelby inhomogeneity problem [39]. Furthermore, the particle images resulting from periodic boundary conditions will interact with each other, further complicating the stress field. These effects are quite complex, especially given the anisotropic nature of the C16 θ-phase. For simplicity, in our analysis of the data we assume that the applied hydrostatic stress σ H dominates the delamination behavior; our successful thermal activation analysis below justifies this assumption. We note that Pogorelko and Mayer have analyzed the spatially varying stress field near a second-phase particle under uniaxial loading and its influence on the delamination process [26,27,29].
Results from a total of 290 MD simulations are reported in this study at temperatures ranging from 200 to 400 K and stresses in the range of 5.7 to 7.2 GPa (the precise stress range differed for each temperature). In most cases, 10 simulations with different thermalization histories (initial atomic velocities) were performed at each stress-temperature condition. In many simulations, we observed nucleation of dislocations at the particle interface. To enable efficient detection of the appearance of Shockley partial dislocations in our simulation cell, we exploited the fact that atoms situated in stacking faults (e.g., produced by a Shockley partial dislocation) appear as HCP atoms when analyzed via common neighbor analysis (CNA) [40]. Hence, by simply monitoring the number of “HCP” atoms in the simulation cell N H C P , we could identify when a dislocation appeared. We note that there was always a small, non-zero number of HCP atoms detected, due to thermal noise in the lattice and the imperfect detection capacity of CNA. To prevent false detection of a dislocation, we established a threshold value for the appearance of a dislocation, N H C P d , based on empirical analysis of our data. We set this threshold at N H C P d = 40 HCP atoms, so if N H C P > 40 we “detected” appearance of a dislocation. Furthermore, we applied a moving average to the raw N H C P vs. time data using a window of width 0.005 ps. This served to smooth out the data a bit and remove spurious spikes in N H C P which did not lead to a sustained increase in N H C P over time (as was expected if a dislocation had nucleated and remained in the system). This approach to dislocation detection was validated by manually analyzing several datasets in OVITO Pro [41]. All simulation snapshots were produced using OVITO Pro [41].

3. Results

We begin the Results section by discussing the overall behaviors observed in our simulations, showing that two modes of delamination were observed which we call lattice-trapped delamination and dislocation-mediated delamination.

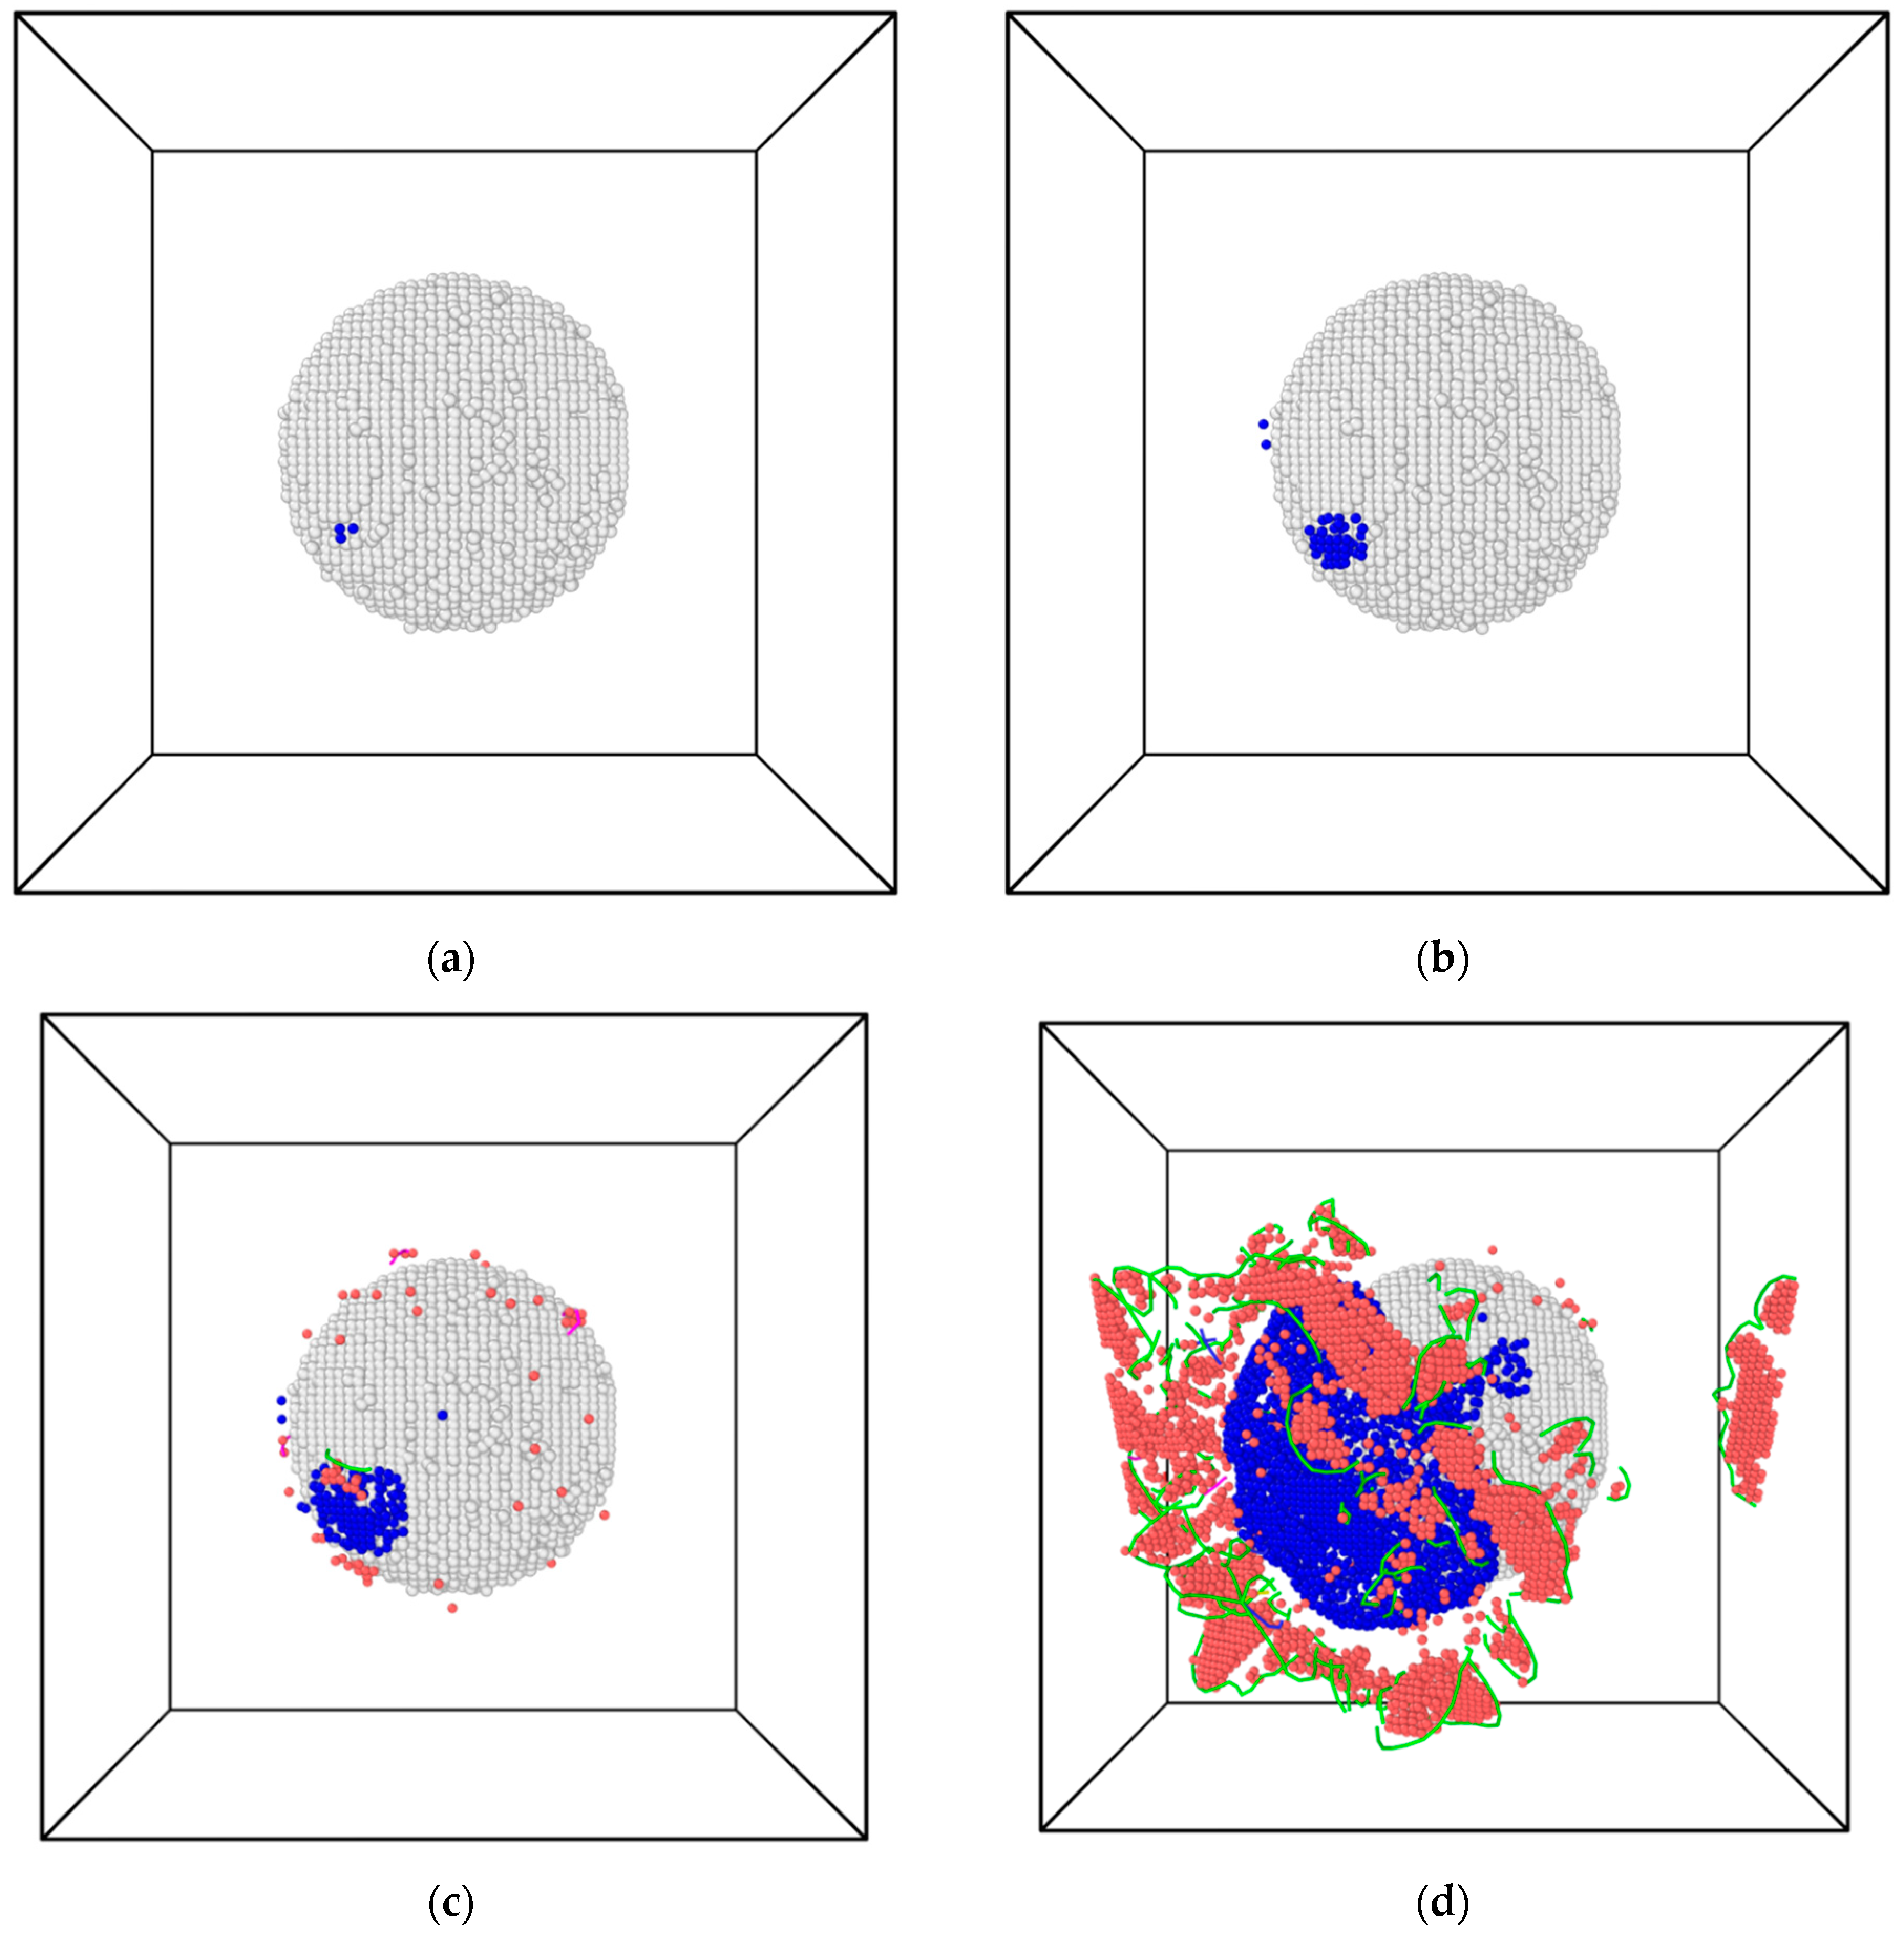
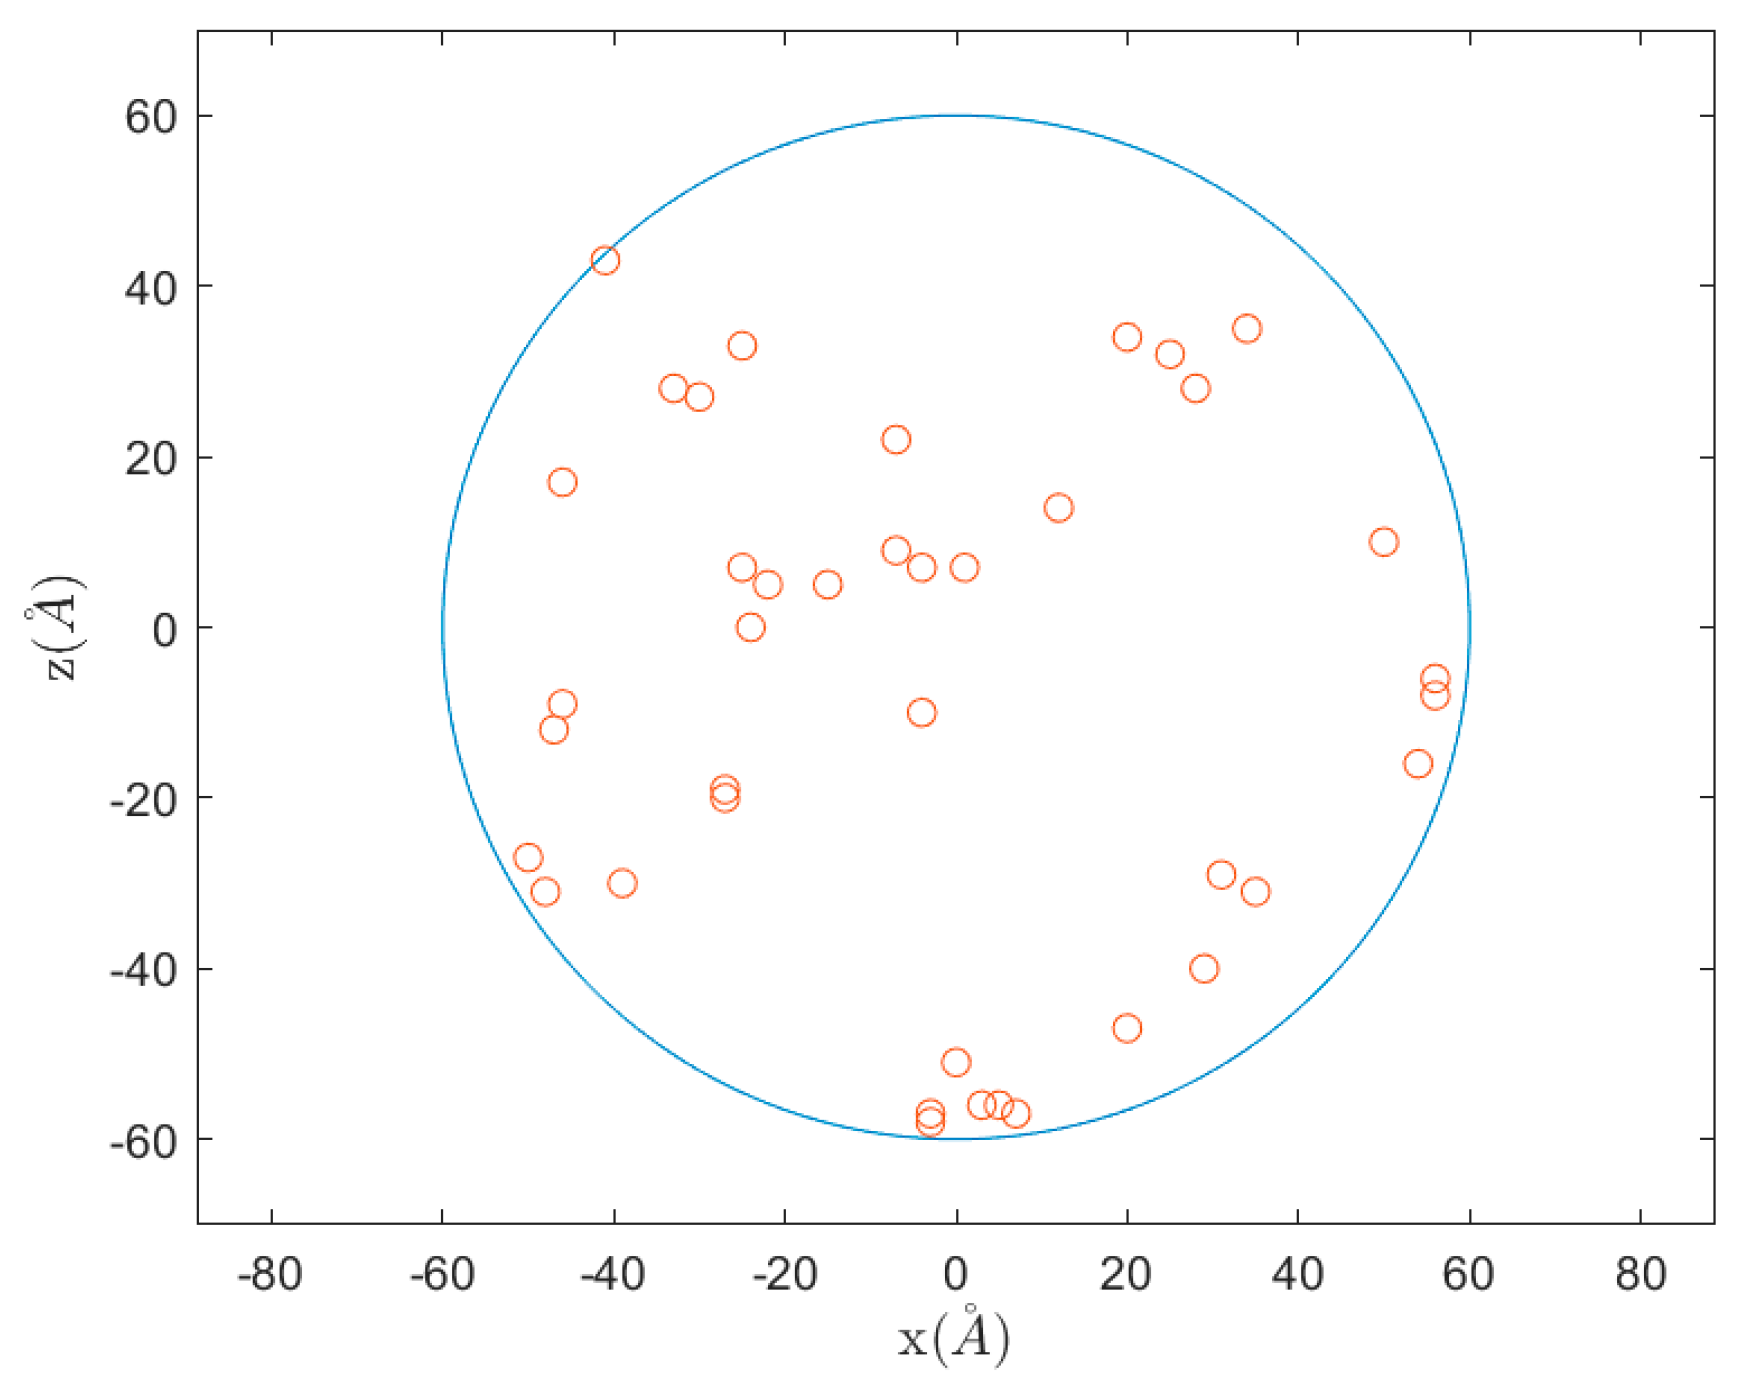
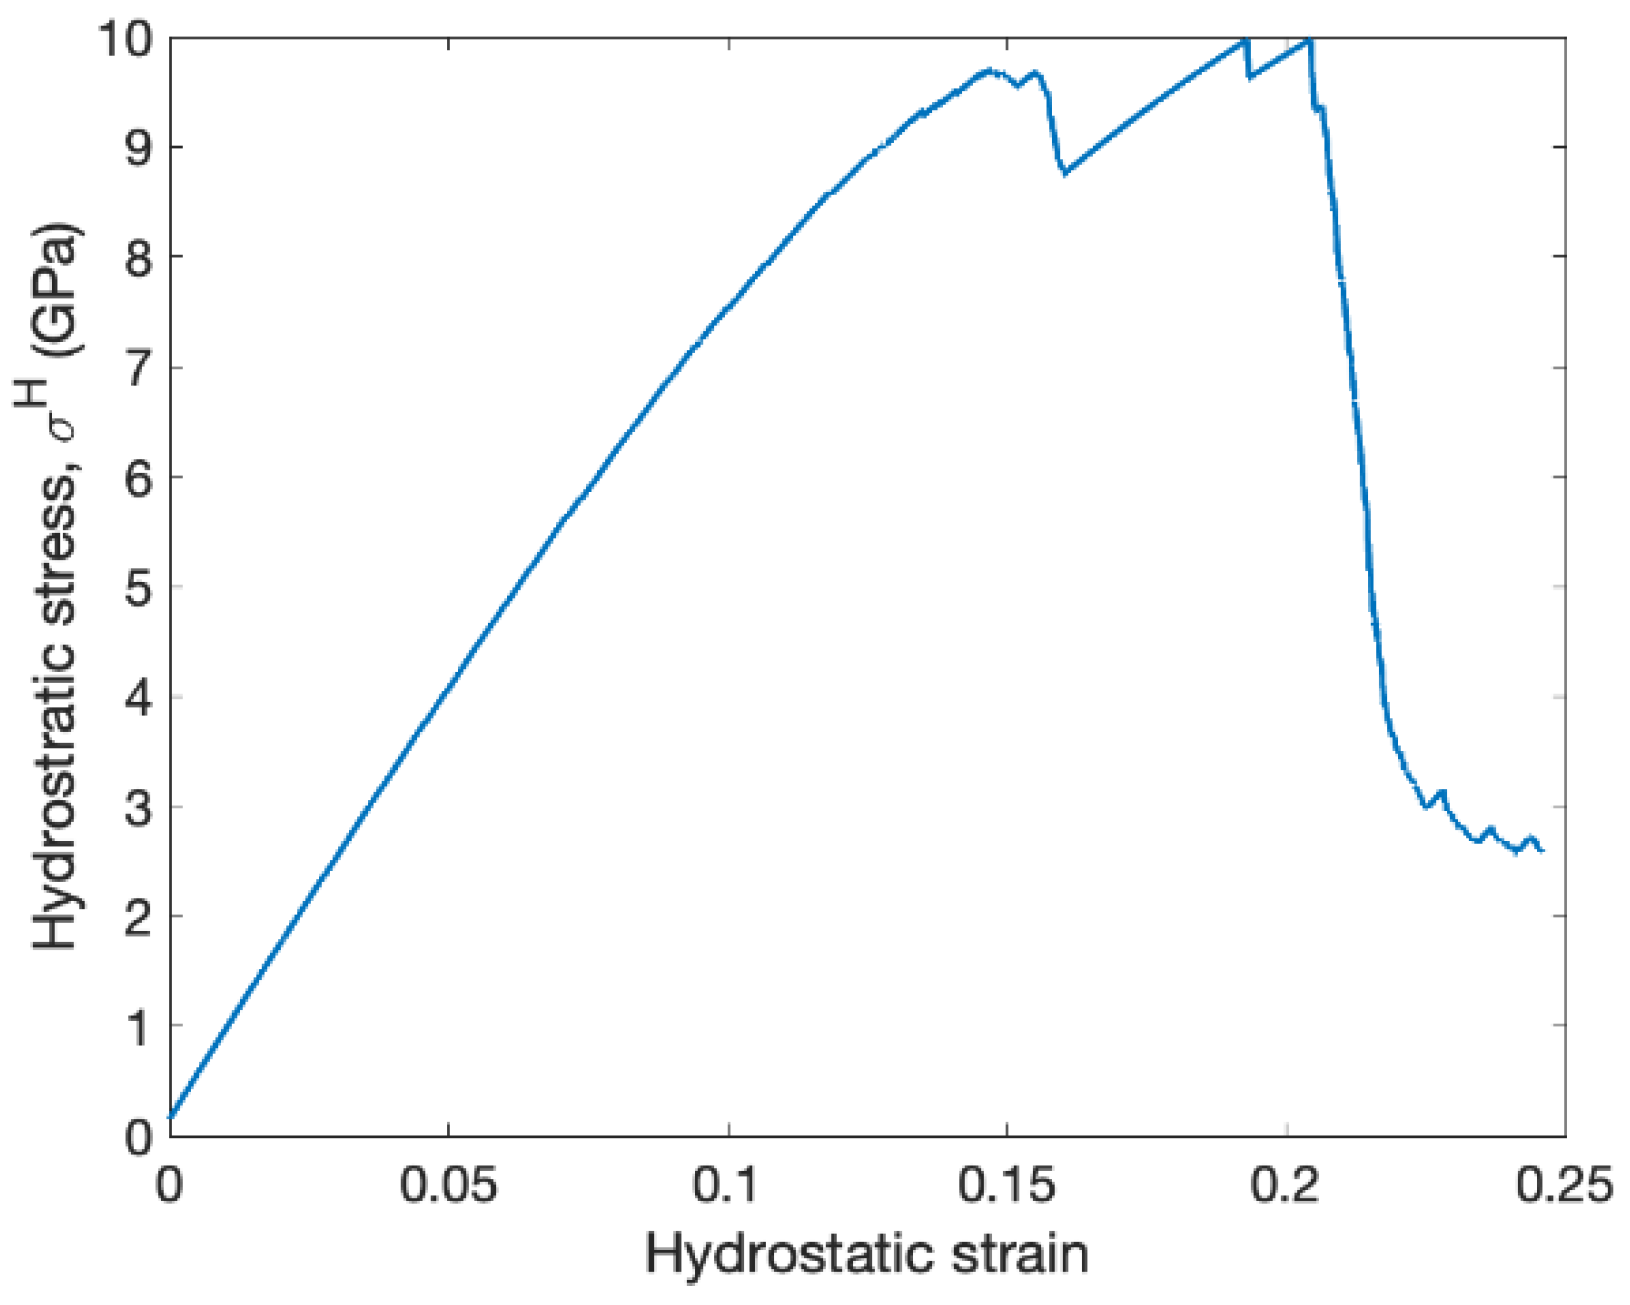
3.1. Void Nucleation Process

In our simulations, we generally observed the sequence of events depicted in Figure 2. At the start of the load holding step there was no evidence of cracking or voiding at the particle interface. After some time, one or more clusters of atoms began exhibiting relatively large atomic volumes, indicating the nucleation of a crack with the size of a small vacancy cluster. For example, in Figure 2a we show atoms in blue whose atomic volume exceeds 30 Å3 based on Voronoi analysis. For reference, the atomic volume of aluminum is 16.7 Å3. The specific mechanism by which this vacancy clustered appeared could not be determined. Over time this crack grew, leading to a larger patch of atoms with volumes exceeding 30 Å3 as shown in Figure 2b. Importantly, this crack growth was not accompanied by any dislocation activity. Instead, the crack grew steadily in time; in the Discussion we demonstrate that this delamination rate is governed by the lattice trapping phenomenon [42], and hence refer to this as lattice-trapped delamination. Eventually, once the crack reached a critical size, Shockley partial dislocations nucleated at the tip of the crack approximately in the plane of the crack, as shown in Figure 2c. These dislocations then rapidly glided away from the particle into the bulk and began to multiply, joined by additional dislocations nucleating from the crack tip. The crack growth rate increased rapidly upon appearance of the dislocations, leading to total delamination of the particle from the matrix. We call this process dislocation-mediated delamination.
Figure 3 shows atomic displacements associated with the two delamination modes. Figure 3a shows the atomic displacement vectors as black arrows over an 18 ps time period from the snapshot in Figure 2b to the moment just before dislocation nucleation Figure 2c. As shown, most of the crack growth is accommodated by displacements of atoms at the crack tip along the circumference of the particle. These displacements under lattice-trapped delamination are rather incoherent, in the sense that their direction and magnitude vary along the crack front in an uncoordinated manner. For example, several atoms experience large displacements while their immediate neighbors do not displace much at all (see yellow circled atoms). Displacements associated with dislocation-mediated crack growth over a 2 ps time period between the snapshots shown in Figure 2c,d are shown in Figure 3b. Once again, the displacements largely occur at the crack tip and in the circumferential direction, however these displacements are more coordinated in their direction and magnitude. These displacements appear to be due to nucleation and glide of the dislocations visible in the figure, i.e., they are generally aligned with the Burgers vectors.
To determine whether there were preferential nucleation sites on the particle’s surface, we extracted the approximate crack nucleation location from 40 simulations and plot these locations in Figure 4 as a point cloud projected onto the x-z plane. This figure shows that while there may be a slight preference for nucleation at the negative z-axis pole of the precipitate (since there is a small cluster there), nucleation was also common at other points around the surface. Similarly, there is a lack of data points at the positive z-axis pole, indicating nucleation there is unfavorable. These results imply that our boundary conditions, simulation cell size, and precipitate orientation did not significantly influence the simulation behaviors (i.e., they did not introduce strong preferential sites).
To assess the delamination behavior in the absence of thermal fluctuations, we performed molecular statics simulations of hydrostatic straining. We progressively increased the hydrostatic strain of the box by increasing the volume in 0.003% increments and minimizing the energy of the system after each strain increment. Each minimization step iterated until the change in energy during a minimization step was less than 10−6% or the norm of the global force vector was less than 10−8 eV/Å. The resulting stress-strain curve is shown in Figure 5. We observe that at a hydrostatic stress of around 10 GPa, the particle catastrophically delaminates from the matrix. Hence, 10 GPa can be regarded as the athermal critical stress for void nucleation. The first peak in Figure 5 corresponds to the nucleation of dislocations at the poles of the particle along the z-axis. The subsequent peaks correspond to nucleation of dislocations around the entire circumference of the particle. Hence, it seems that athermal void nucleation is governed by the athermal nucleation of dislocations.
To get information about the crack growth, we estimate the crack volume as V c r a c k ( t ) = V ( t ) V 0 , where V ( t ) is the volume of the simulation cell at time t and V 0 is the volume at the start of the holding phase. In Figure 6 we show a few examples of how the crack volume evolves over time during the load holding phase. In some cases, there appears to be an “incubation period” where the volume does not increase at all, followed by a gradual increase over time indicating the nucleation and growth of a crack. This gradual increase corresponds to the lattice-trapped delamination mode. In other cases, the volume appears to increase from the start of the load holding phase, with no obvious incubation period. In most cases it was difficult to unambiguously identify a clear “nucleation” event which correlated with a local increase in atomic volume at the void’s surface. For this reason, we were unable to analyze any sort of “nucleation” rate directly from the incubation time. Regardless, lattice-trapped delamination was always observed in our simulations. We also mark in Figure 6 the time where the first dislocation nucleated. Upon nucleation of one or more dislocations, the system volume increases precipitously as the crack growth rate accelerates to complete delamination.

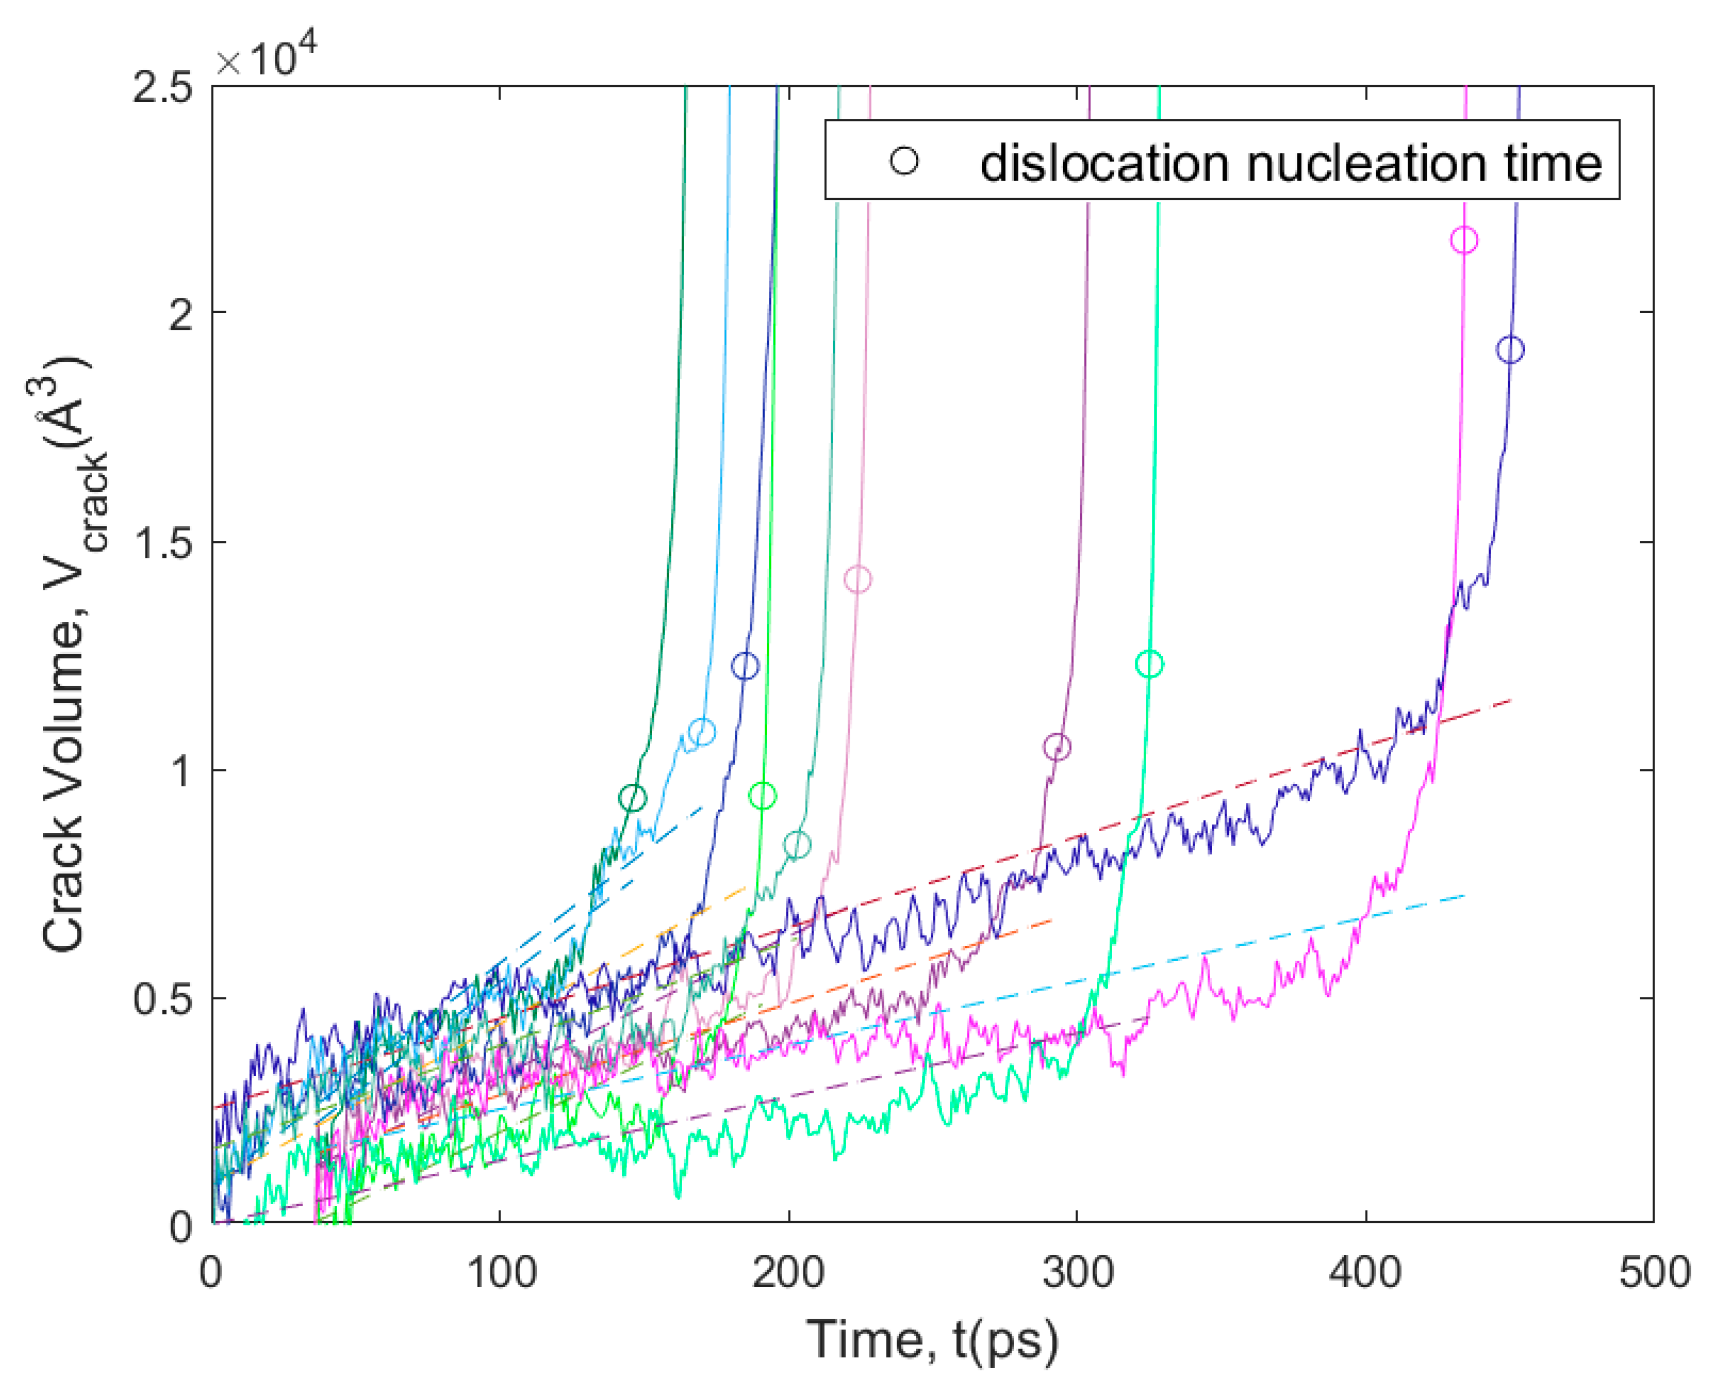
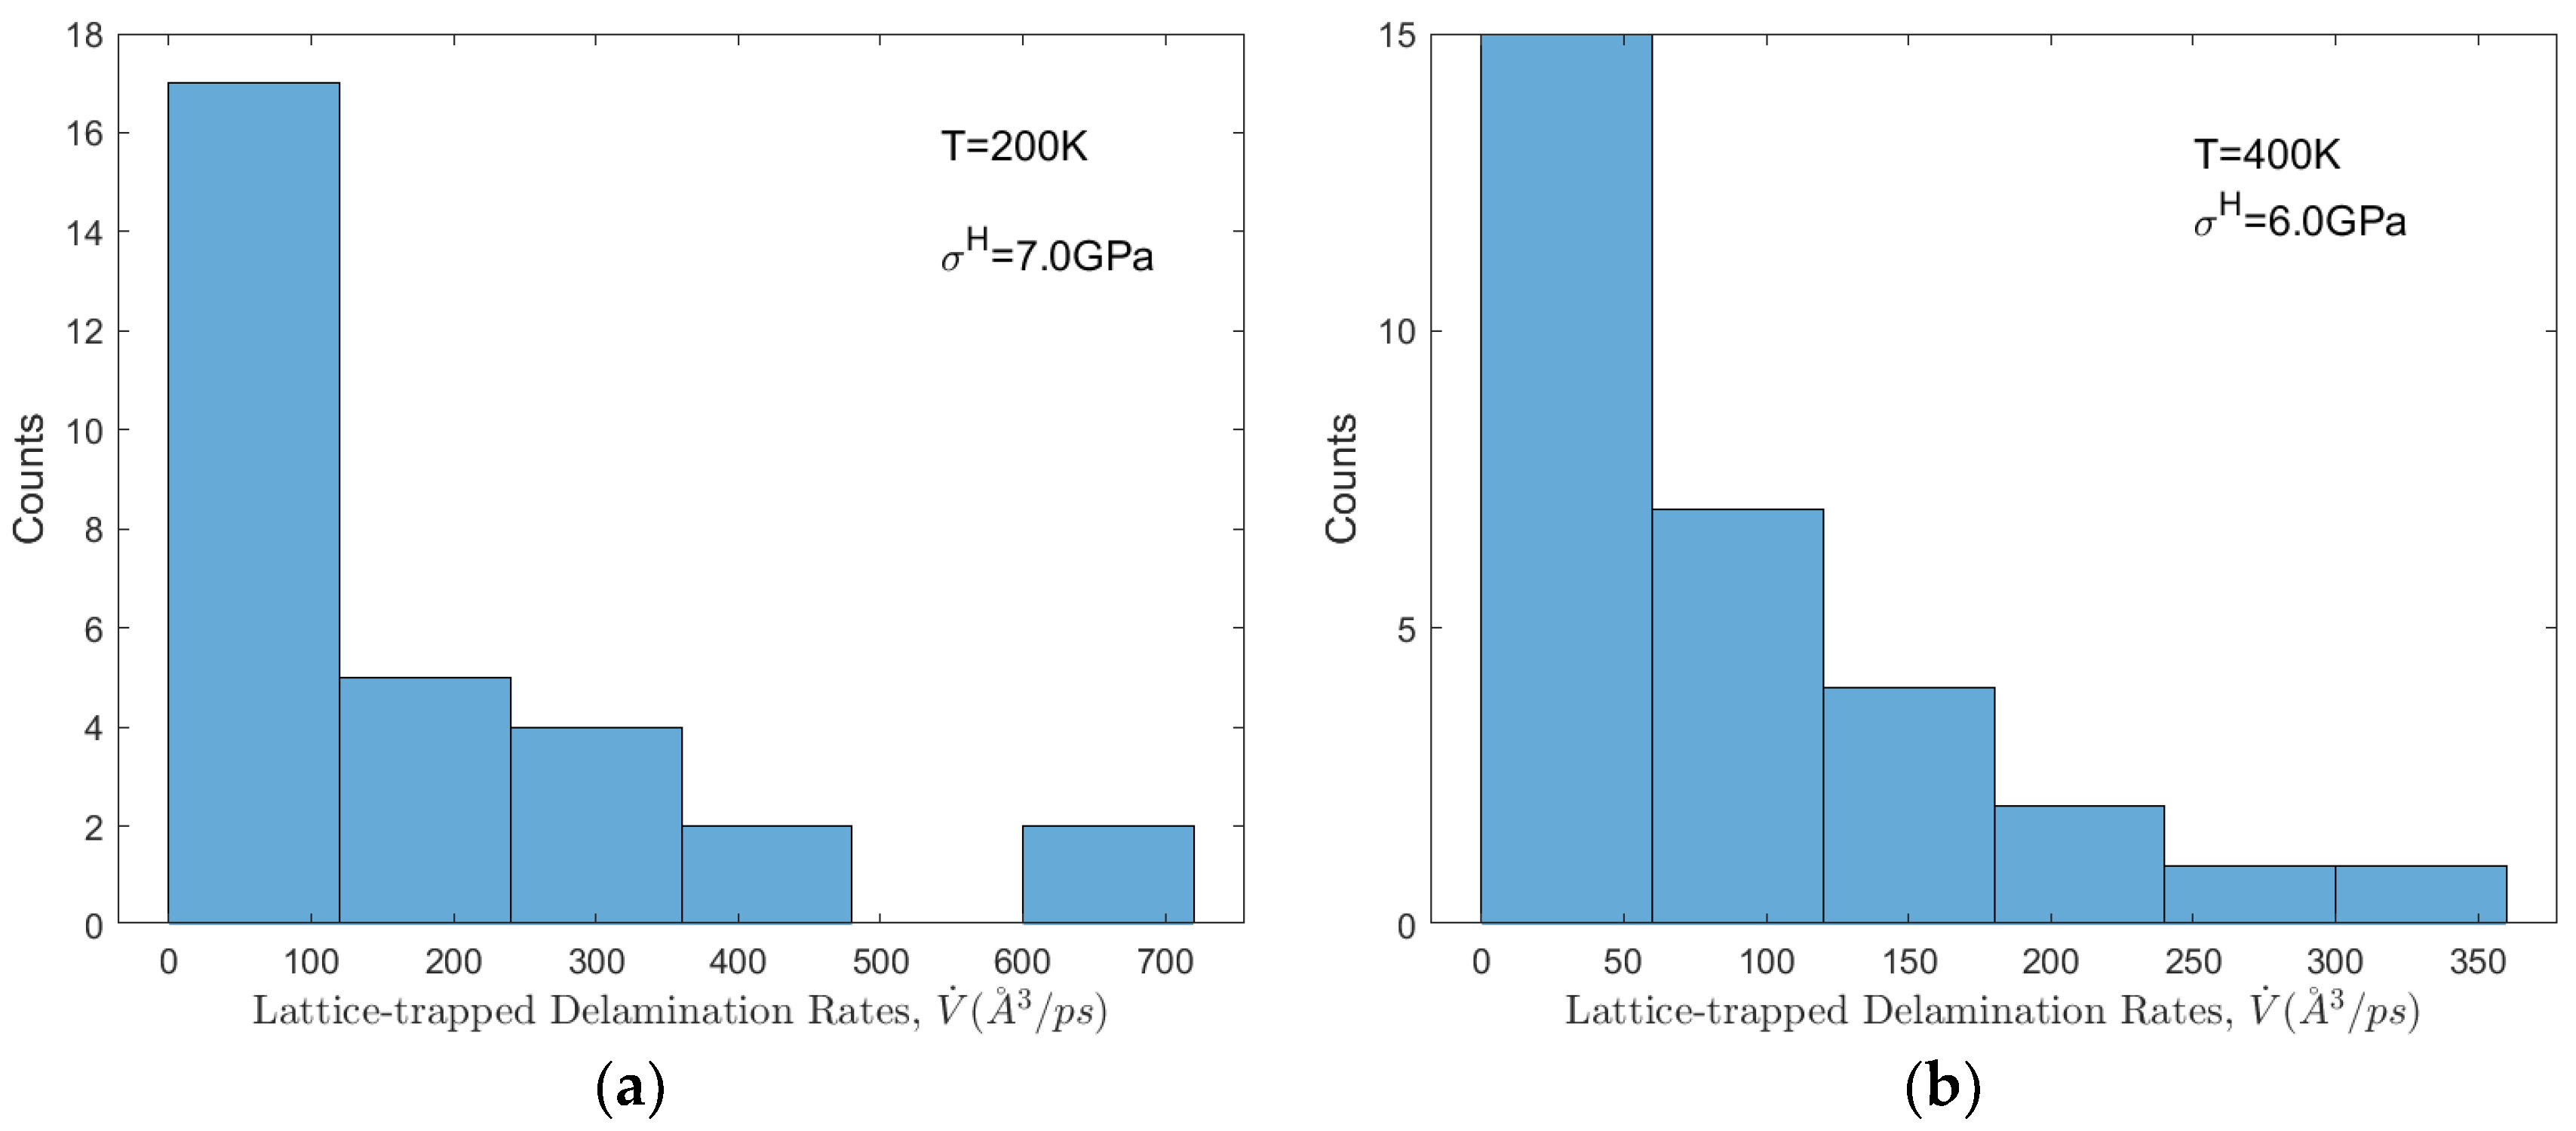
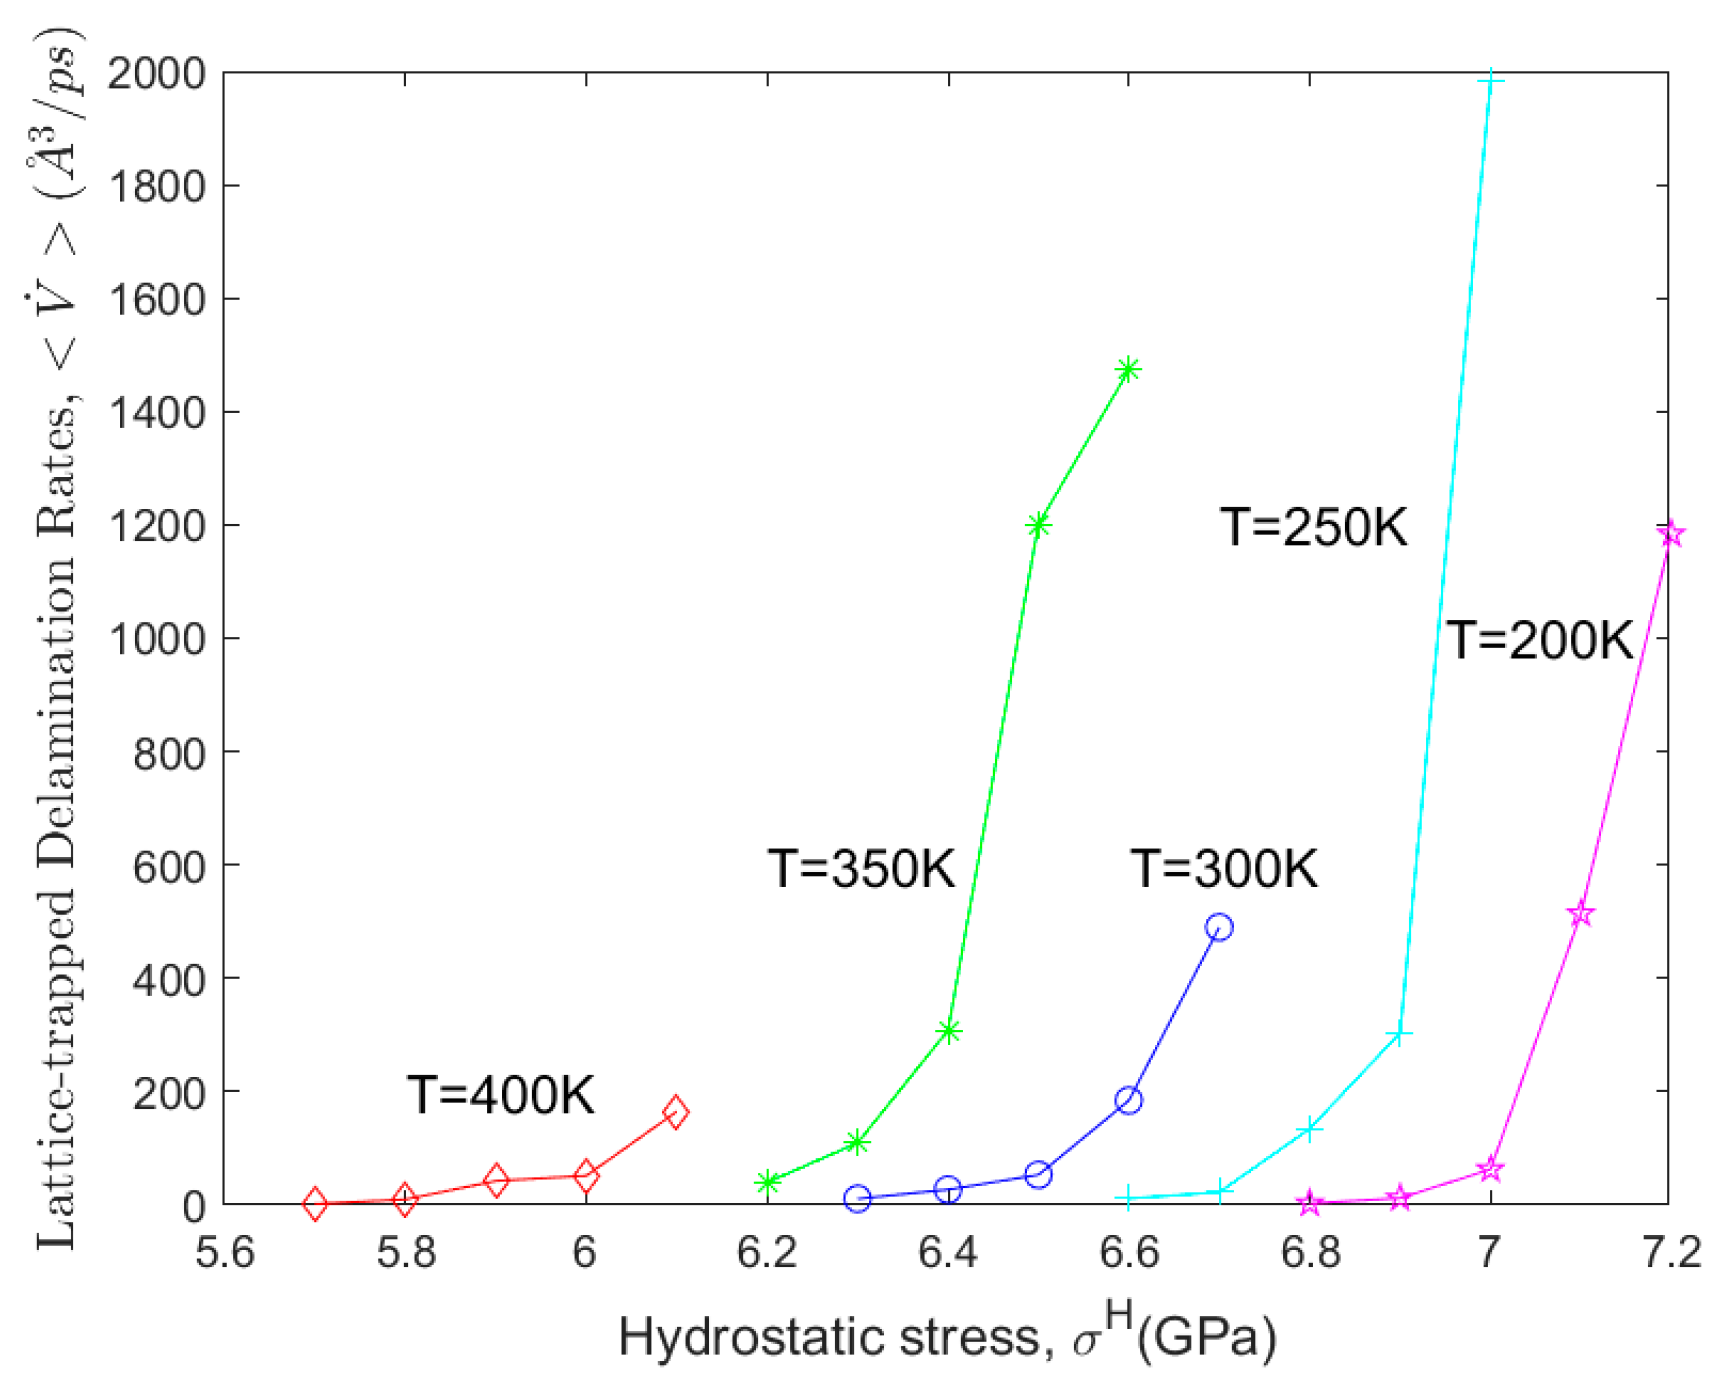
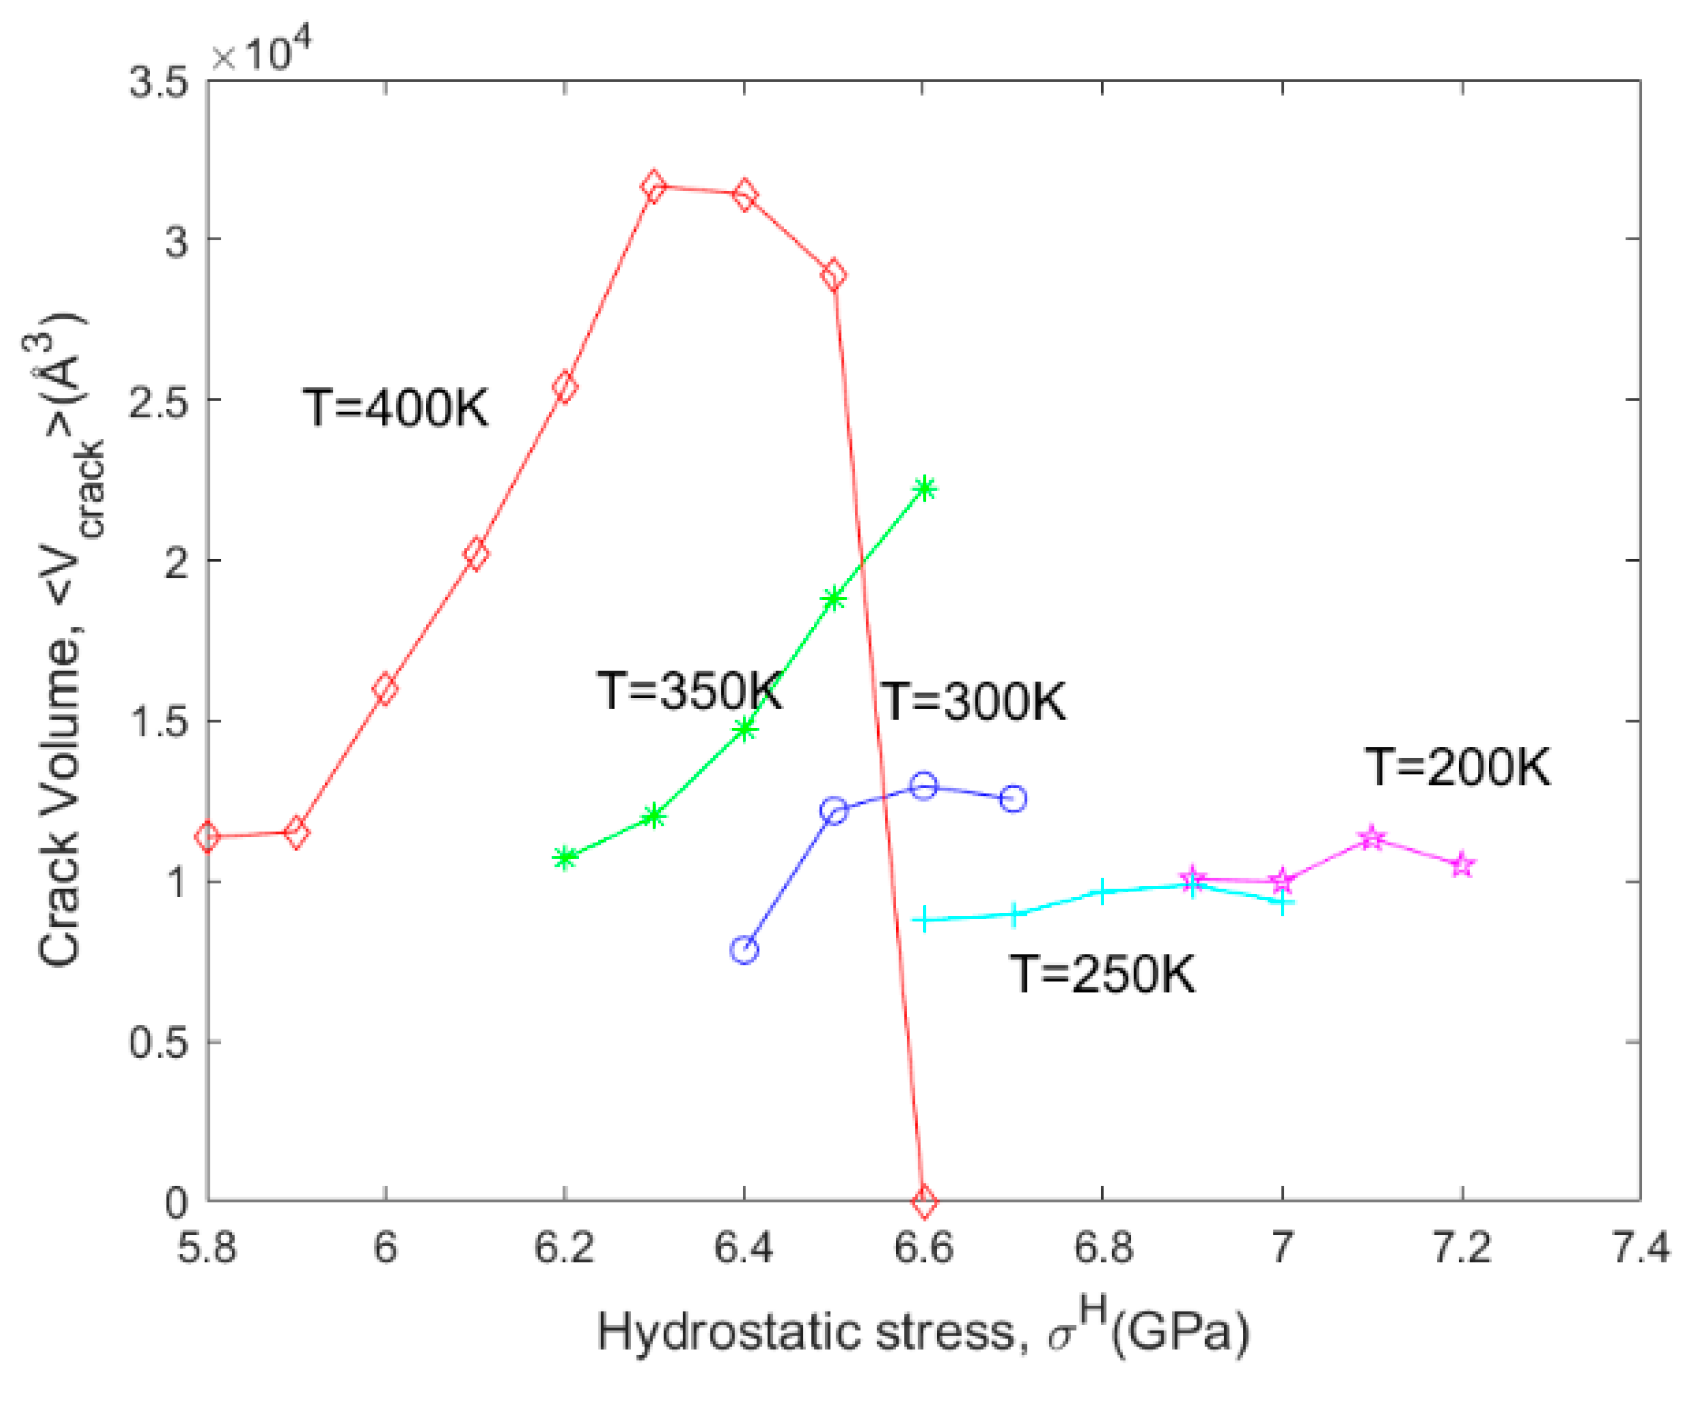
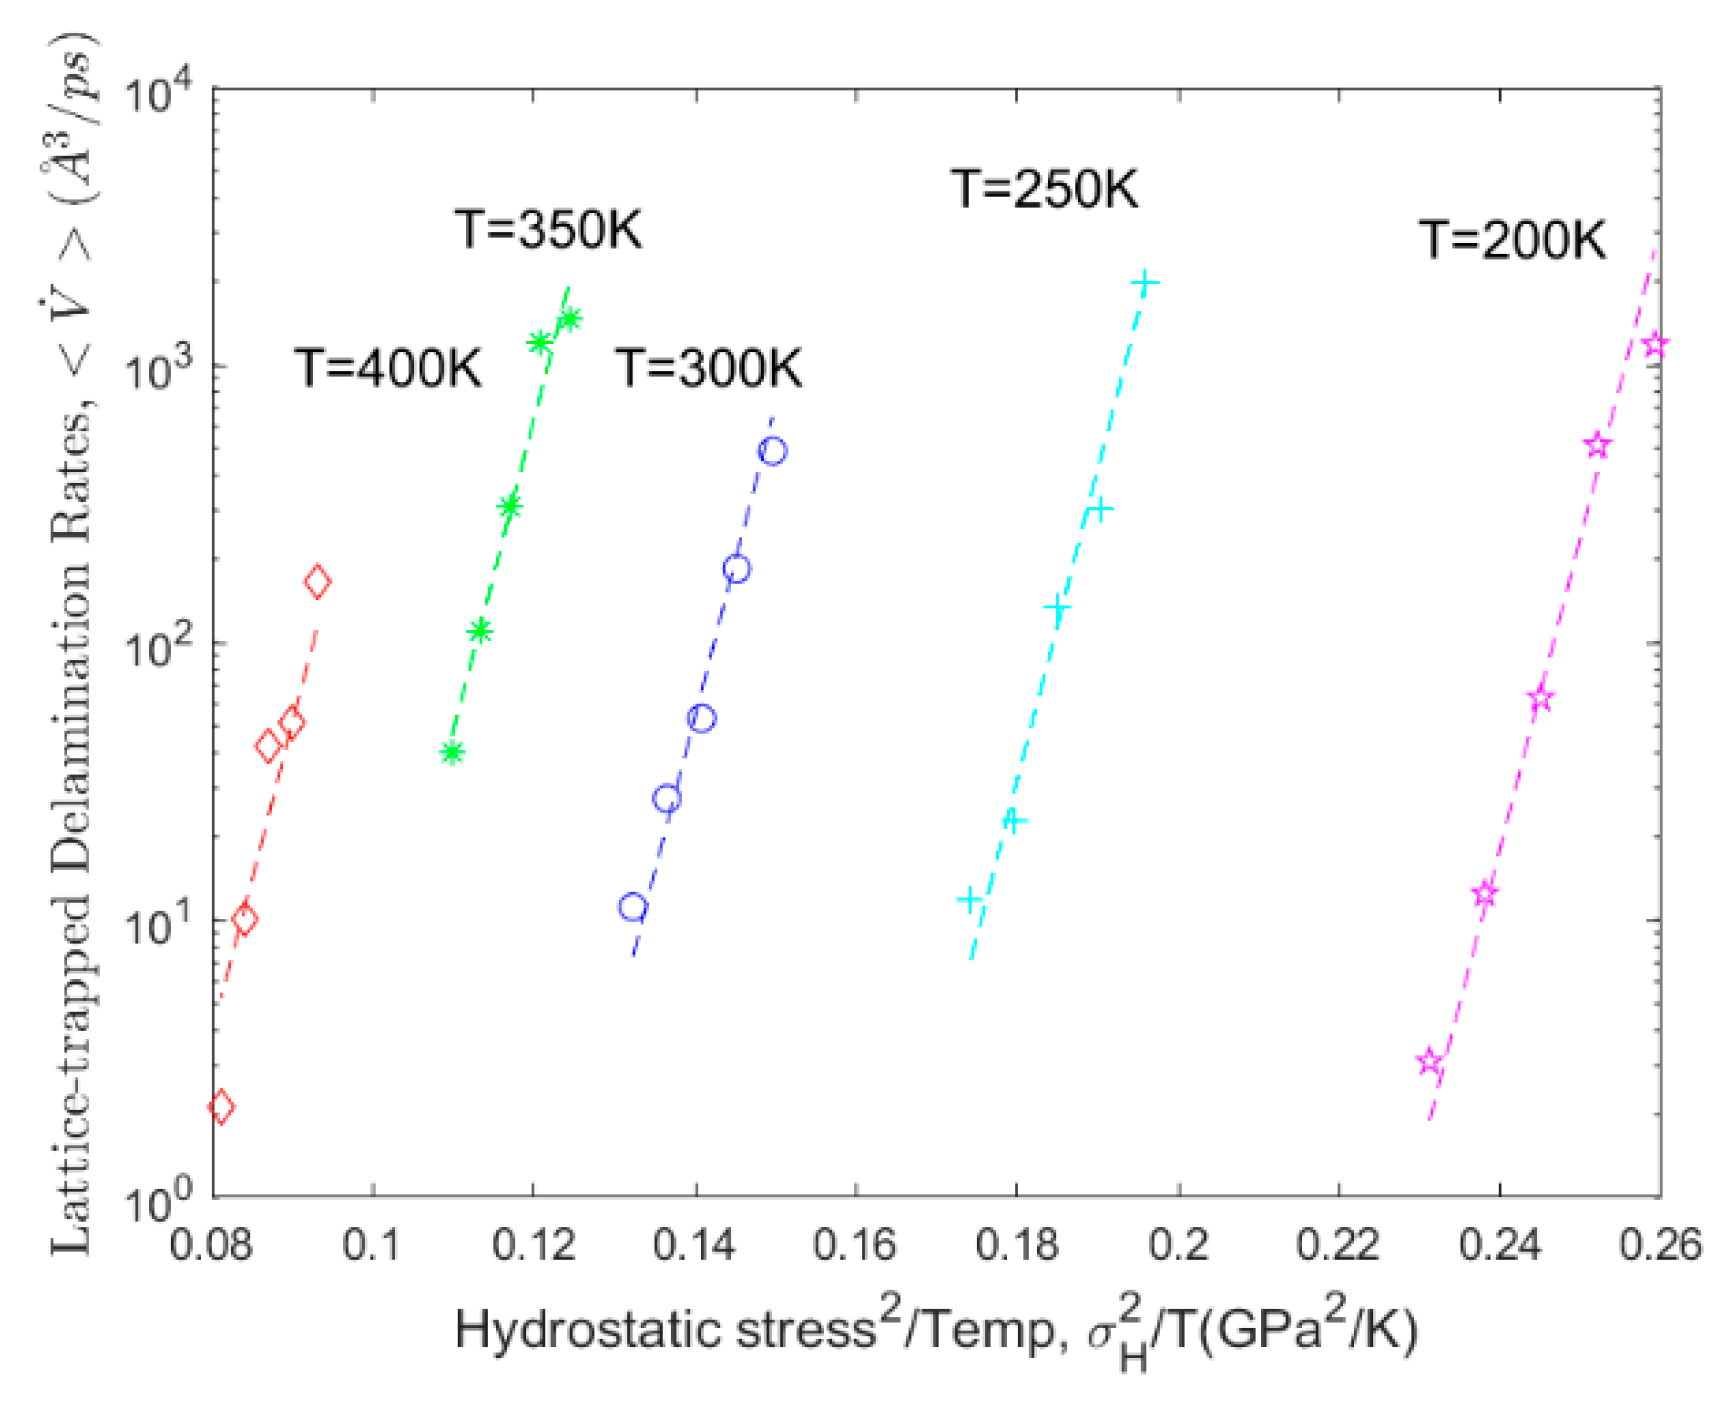
3.2. Kinetics of Lattice-Trapped Delamination

To characterize the kinetics of lattice-trapped delamination, we extracted the crack growth rate in terms of the rate of increase of the crack volume as shown in Figure 6. Since no other defects were present in the simulation cell, it is expected that essentially all increases in volume must be due to growth of interfacial cracks. Visual inspection of simulations and identification of volume “hot spots” where atomic volumes were elevated confirmed this assumption; we never observed significant volume increases in the bulk, only at the interface near cracks. It is more conventional, of course, to characterize a crack in terms of its area or radius. However, since cracks typically adopted complex shapes and morphologies, it was difficult to directly extract their area and/or radius. For these reasons, we use changes in simulation cell volume to quantify the delamination rate.
We determined the lattice-trapped delamination rate by taking a linear regression of the volume vs. time curve from the start of the load holding phase to the time of dislocation nucleation, shown by the dashed lines in Figure 6. We find that under the same nominal conditions (stress and temperature), the delamination rate was sensitive to the initial conditions (e.g., initial random atomic velocities). For this reason, 10 replicate simulations were performed at each condition. Figure 7 shows histograms of the lattice-trapped delamination rate at a few conditions with 30 replica simulations, demonstrating the spread of the data. Interestingly, the delamination rates are systematically biased towards lower rates (rather than being symmetrical about the mean), qualitatively taking the form of exponential distributions. Figure 8 shows the mean delamination rate as a function of σ H at temperatures of 200, 250, 300, 350, and 400 K. There is clearly a strong sensitivity to both stress and temperature. We will further analyze these data in the Discussion.

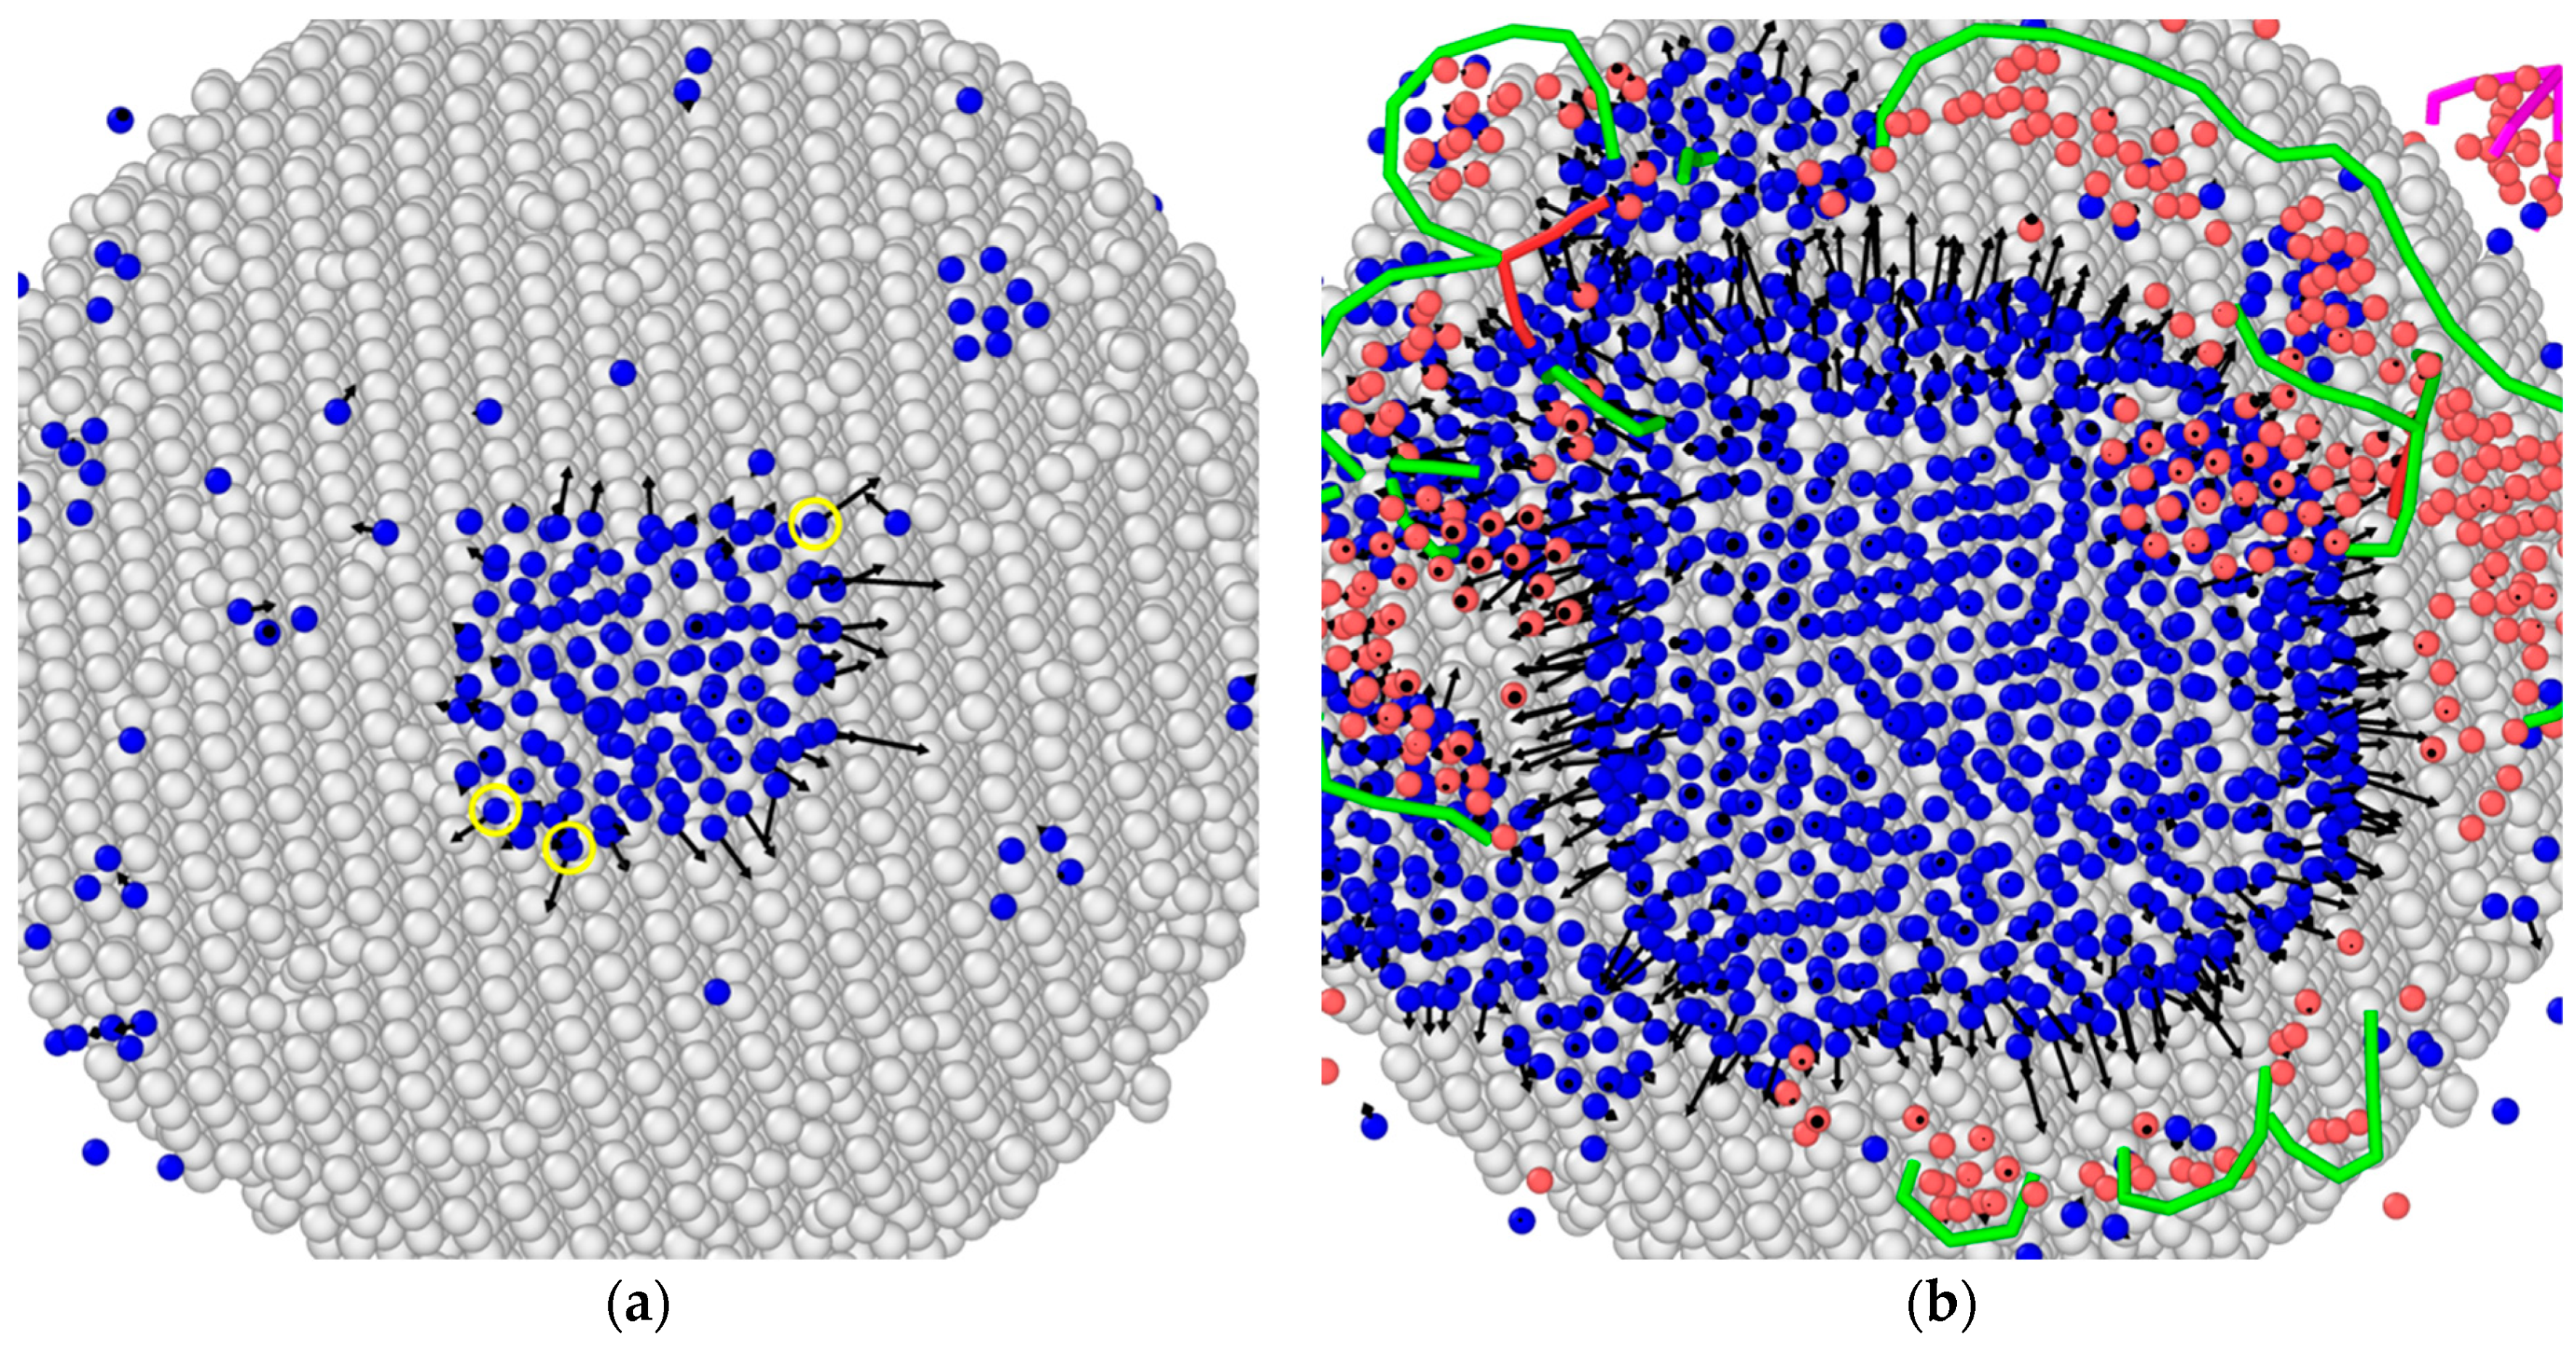
3.3. Analysis of Dislocation-Mediated Delamination

While we always observed lattice-trapped delamination in our simulations, dislocation nucleation was only observed in “high stress” simulations. Furthermore, if the stress was too high then dislocations would nucleate at the beginning of the simulation, much like the behavior observed in our molecular statics simulation. One important question is: what is the interplay between lattice-trapped and dislocation-mediated delamination? What governs the transition from one mode to the other? To gain insight into this question, we extracted the crack volume at the moment of dislocation nucleation from our simulations and present the average values in Figure 9. At lower stresses, the crack volume increases to a peak value and then subsequently decays to zero, indicating immediate nucleation of dislocations. We believe that these trends result from changes in the lattice-trapped delamination and dislocation nucleation rates with stress and temperature, and changes in the driving force for dislocation nucleation as the crack grows. We defer further analysis to the Discussion.
In all simulations, as soon as the first dislocation nucleation event occurred, the delamination rate increased dramatically. The delamination rate was so large that a well-defined rate could not be determined. In some cases, dislocations nucleated from the “crack tip” near the particle interface, but not in all cases. For example, dislocation nucleation in the middle of the crack face in the Al matrix was also observed.

4. Discussion

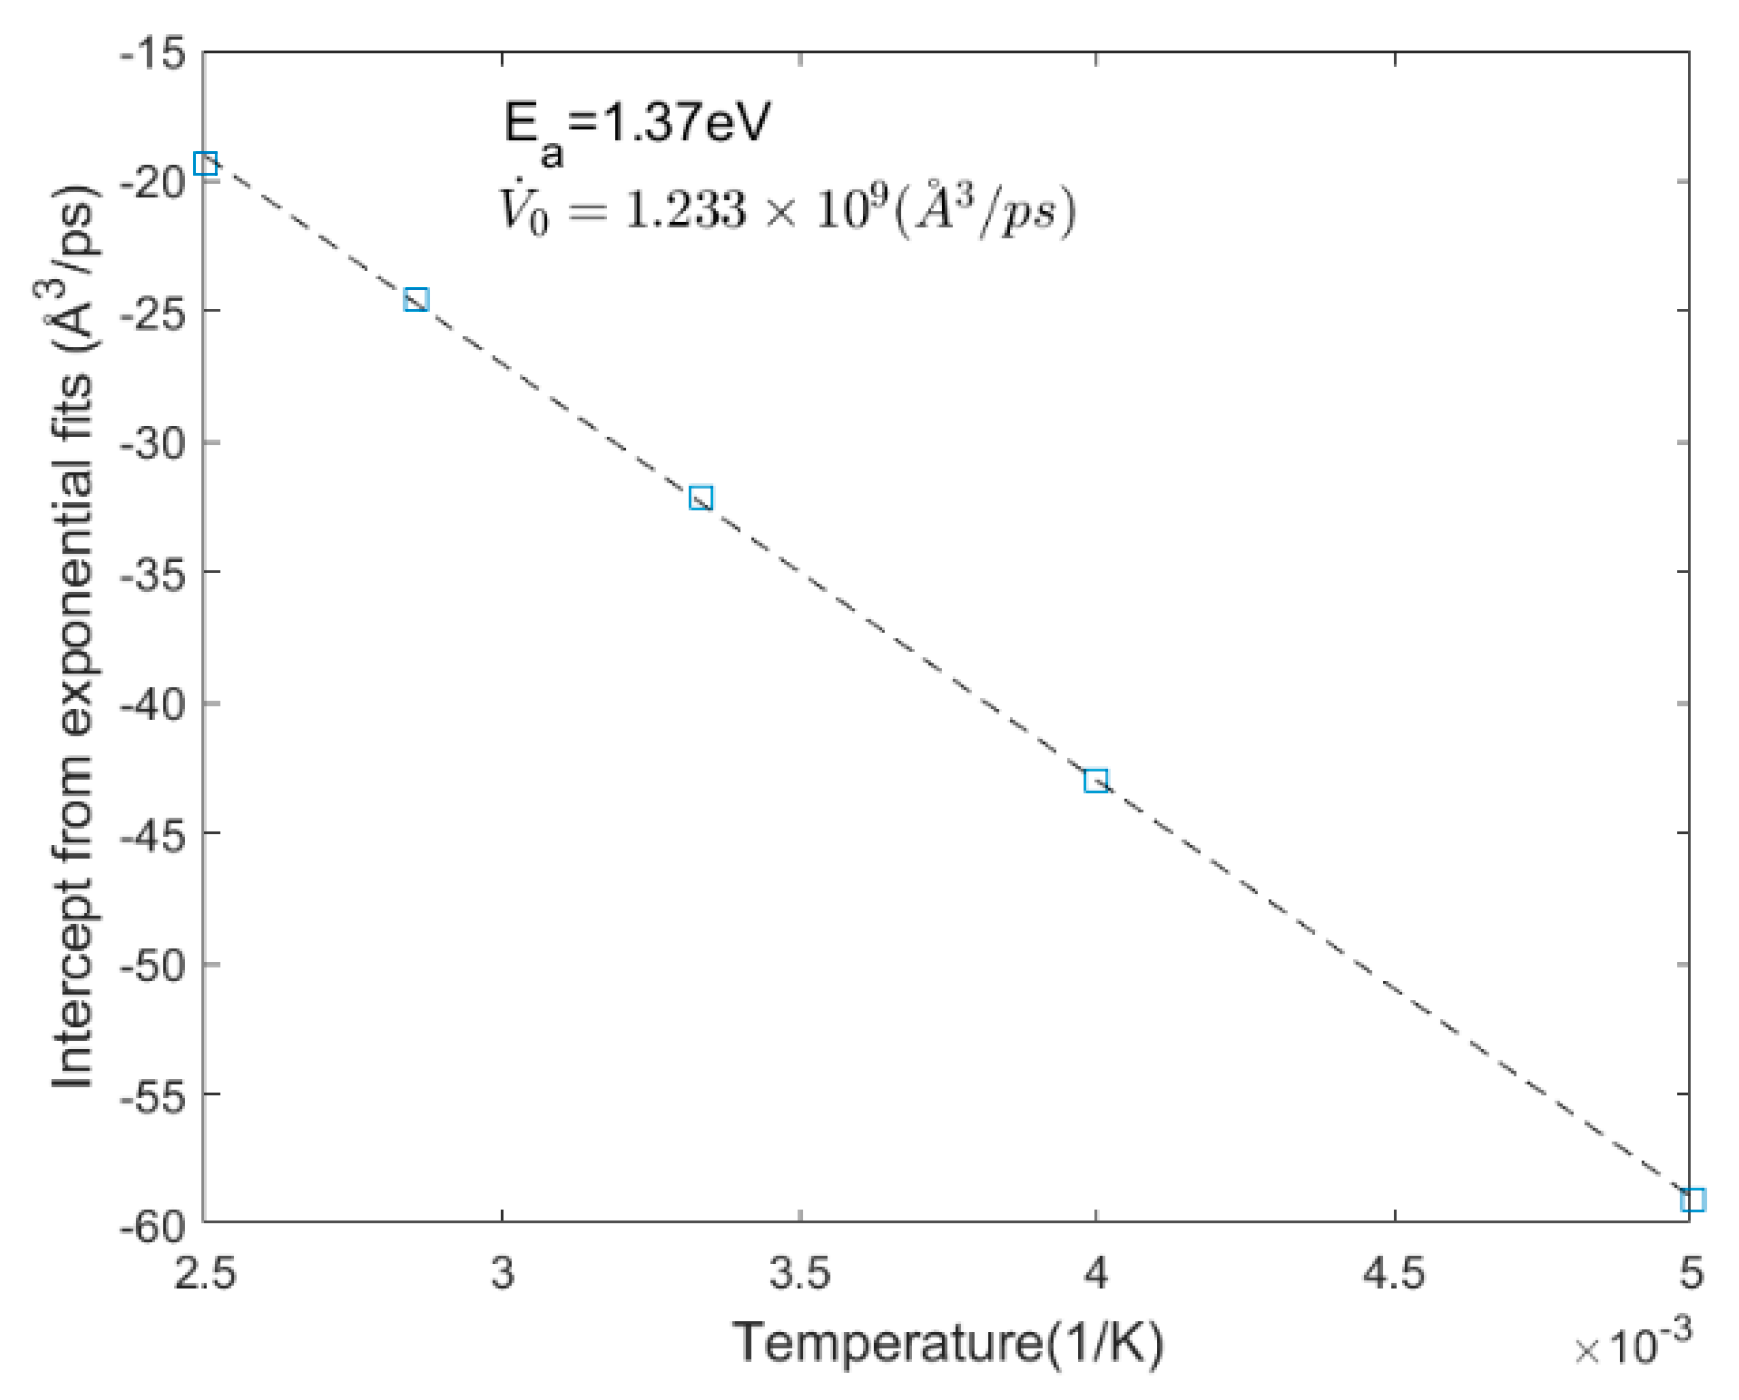
4.1. Thermal Activation Analysis

Here we further analyze the lattice-trapped delamination rate data and demonstrate that lattice-trapped delamination is thermally activated. For a system containing a crack of length a loaded by hydrostatic stress σ H , the theory of thermally activated crack growth says that the growth rate is [43]
a ˙ ( σ H , a ) = a ˙ 0 exp ( E a + A * K ( σ H , a ) 2 / E k B T )
where E a is the activation energy for bond breaking, K is the stress intensity factor, A * is the activation area, E is the modulus of elasticity, a ˙ 0 is the exponential prefactor related to the attempt frequency, T is the absolute temperature, and k B is Boltzmann’s constant. It is important to note that Equation (1) is only valid when K > K c , the critical stress intensity factor. If K < K c , then the free energy of the system increases when the crack grows, violating the second law of thermodynamics [44]. The stress intensity factor can always be written in the form
K = Y σ H π a
where Y is a geometric factor dictated by the geometry of the problem. To relate the crack volume to the crack length, we approximate the crack as an ellipsoid with two axes of radius a and the other of radius a / 2 (consistent with cracks observed in our simulations). The volumetric crack growth rate is then V ˙ = 4 π a 2 a ˙ . In our simulations where lattice-trapped delamination occurs, the crack length does not increase significantly (cracks remain relatively small during lattice-trapped delamination, see Figure 2). Hence, for simplicity, we neglect changes in a and assume that K = K ( σ H , a ¯ ) and V ˙ = 4 π a ¯ 2 a ˙ , where a ¯ is the average crack length during the simulation. With this assumption and using Equation (1), we obtain that the activation enthalpy (numerator in the exponential) is
Δ H a = E a C k B ( σ H ) 2
where C = A * Y 2 π a ¯ / ( E k B ) and simple algebraic manipulation further shows that
ln V ˙ = ln V ˙ 0 E a k B T + C ( σ H ) 2 T
where V ˙ 0 = 4 π a ¯ 2 a ˙ 0 . Hence, if we plot ln V ˙ from our simulations as a function of ( σ H ) 2 / T , the dataset for each temperature should form a straight line with slope C if growth is thermally activated. In Figure 10 we plot the data in this way and see a consistent linear trend across all datasets. Specifically, we find that the same slope fits all datasets, indicating that C = 258 K/GPa2. Next, we extract the y-intercept from each of these linear fits, and Equation (4) indicates that these intercepts should scale with 1 / T . Figure 11 plots the y-intercepts from Figure 10 as a function of 1 / T and once again a linear behavior is recovered as expected. The slope of Figure 10 is E a / k B and the y-intercept is ln V ˙ 0 ; we obtain values of E a = 1.37 eV and V ˙ 0 = 1.23 × 10 9 Å3/ps. The fact that our data so strongly reproduces the behaviors predicted by Equation (4) indicates that the lattice-trapped delamination observed in our MD simulations is indeed thermally activated, and that our neglect of the crack length dependence of K does not introduce any significant errors into our analysis.
The thermally activated delamination mode that we observe is likely governed by the so-called lattice trapping phenomenon [42]. Under lattice trapping, a crack which is loaded supercritically (i.e., with K > K c ) grows in a step-wise manner as atomic bonds at the crack tip are sequentially broken, often by a kink-pair mechanism [43,44,45,46]. As the crack grows, it experiences an oscillating potential energy landscape due to the periodicity of the lattice, and the height of these oscillations dictates the activation energy for growth. To our knowledge this crack growth mode has only been observed in brittle materials like Si [45] and glass [47], but not in ductile materials like Al considered here. This is nonetheless reasonable, since in effect the Al system is acting in a brittle manner in the absence of dislocation activity.
To further analyze our extracted parameters, we need to estimate the stress intensity factor. Tan and Gao [48] numerically determined the stress intensity factor for an axisymmetric interfacial crack on a sphere which forms an angle ϕ from the radial axis, as shown in the inset in Figure 12a, with various modulus ratios E p / E m where m stands for matrix and p for precipitate. We can express their results in the form
K 0 = Y ( ϕ , E p / E m ) σ H π R
where K 0 = K I 2 + K I I 2 is the “overall” stress intensity factor for the mixed-mode loading (the crack is generally mixed mode) and Y ( ϕ , E p / E m ) was determined by Tan and Gao via numerical boundary integral methods. Using Equation (5) enables us to obtain the activation area as
A * = C   k B E ¯ π R Y ( ϕ , E p / E m ) 2
where E ¯ = 2 E m E p / ( E m + E p ) is the bimaterial modulus for interfacial fracture [49]. For approximation purposes, we employ the typical Young’s modulus of untextured polycrystals instead of the anisotropic single crystal elastic constants. Estimating E m = 70 GPa (experimental value for pure Al) and E p 120 GPa [50] gives E ¯ 88 GPa and E p / E m 1.7 . Tan and Gao found that for cracks varying from ϕ = 22.5 to 67.5 degrees with a modulus ratio of E p / E m = 2 , Y ( ϕ , E p / E m ) varied from 1.31 to 1.79. Unfortunately, cracks observed in our simulations typically had angles ϕ < 22.5 ° , so it is difficult to apply Tan and Gao’s solution. Note that according to Equation (5), Y 0 as ϕ 0 since K 0 must go to zero when the crack length is zero (i.e., ϕ = 0 ). Hence, we expect the Y values in our simulations to be less than 1.31. Nonetheless, to gain insight into orders of magnitude for the thermal activation parameters we assume Y 1.31 in the analysis below. Using these parameter values with R = 50 Å in Equation (6) leads to A * 1.17   Å 2 . According to Schoeck [43]
A * = ( 1 + β ) Δ A
where Δ A is the atomistic area of crack advance between the equilibrium and saddle position of the crack front and β is a factor in the range between 0 and 2. Schoeck argued that for crack advance by breaking of individual bonds, Δ A 1   Å 2 ; hence, our A * value gives the correct order of magnitude, further bolstering our conclusion that lattice-trapped delamination is thermally activated.
Finally, we note that an important aspect of thermally activated crack growth is the athermal stress intensity factor, K ath , at which the activation enthalpy goes to zero. At and above this load, the crack growth rate is no longer governed by thermally activated bond breaking. According to Equation (1) and accounting for the modulus mismatch, the athermal stress intensity factor is
K ath = E a E ¯ A * .
Using our estimates for parameters above, we obtain that K ath 1.29 MPa·m1/2. According to Equation (5), K ath is reached when
σ ath H = K ath Y π R
and using the estimates above we obtain σ ath H 7.8 GPa. This value is consistent with our data since we did not observe lattice-trapped delamination above 7.2 GPa (although we did not attempt to obtain a maximum stress where lattice-trapped delamination rates could be obtained).

4.2. Dislocation Nucleation

Delamination and crack growth via dislocation nucleation have been observed by other researchers in the past [30,51]. Similar to the thermally activated lattice-trapped delamination mode discussed above, dislocation nucleation is thermally activated. Above some critical load, the activation barrier for dislocation nucleation goes to zero and spontaneous nucleation occurs [51]. Hence, we have a race between two thermally activated processes—lattice-trapped delamination and dislocation nucleation—each characterized by their own activation enthalpy which varies with the stress intensity factor. This race gives rise to the crack volume trends exhibited in Figure 9. At lower stress, lattice-trapped delamination is slow so that the crack does not grow much before a dislocation is nucleated. As the stress is increased, the lattice-trapped delamination rate increases and there is a time lag before the dislocation nucleates, causing the crack volume at dislocation nucleation to increase. Finally, at very high stresses the athermal load is reached for dislocation nucleation so that a dislocation nucleates immediately during the simulations, causing the crack volume at dislocation nucleation to go to zero. This qualitatively explains the trends observed in Figure 9. A quantitative explanation would require a detailed understanding of the nucleation parameters for a dislocation at the crack tip, which are non-trivial to compute and beyond the scope of this work [51].
Unfortunately, the conditions of the simulations here were such that as soon as a dislocation nucleated, the particle delaminated almost instantaneously. This indicates that our systems were overdriven with the respect to dislocation-mediated delamination. It is possible that quantitatively useful delamination rates could be obtained under dislocation-mediated delamination from simulations at lower stresses if a large enough pre-crack is manually inserted into the system. Here, if our applied stress was too low, the lattice-trapped delamination rate was so small that a crack never became large enough to enable dislocation nucleation. Future work should focus on quantifying the dislocation-mediated delamination rate.

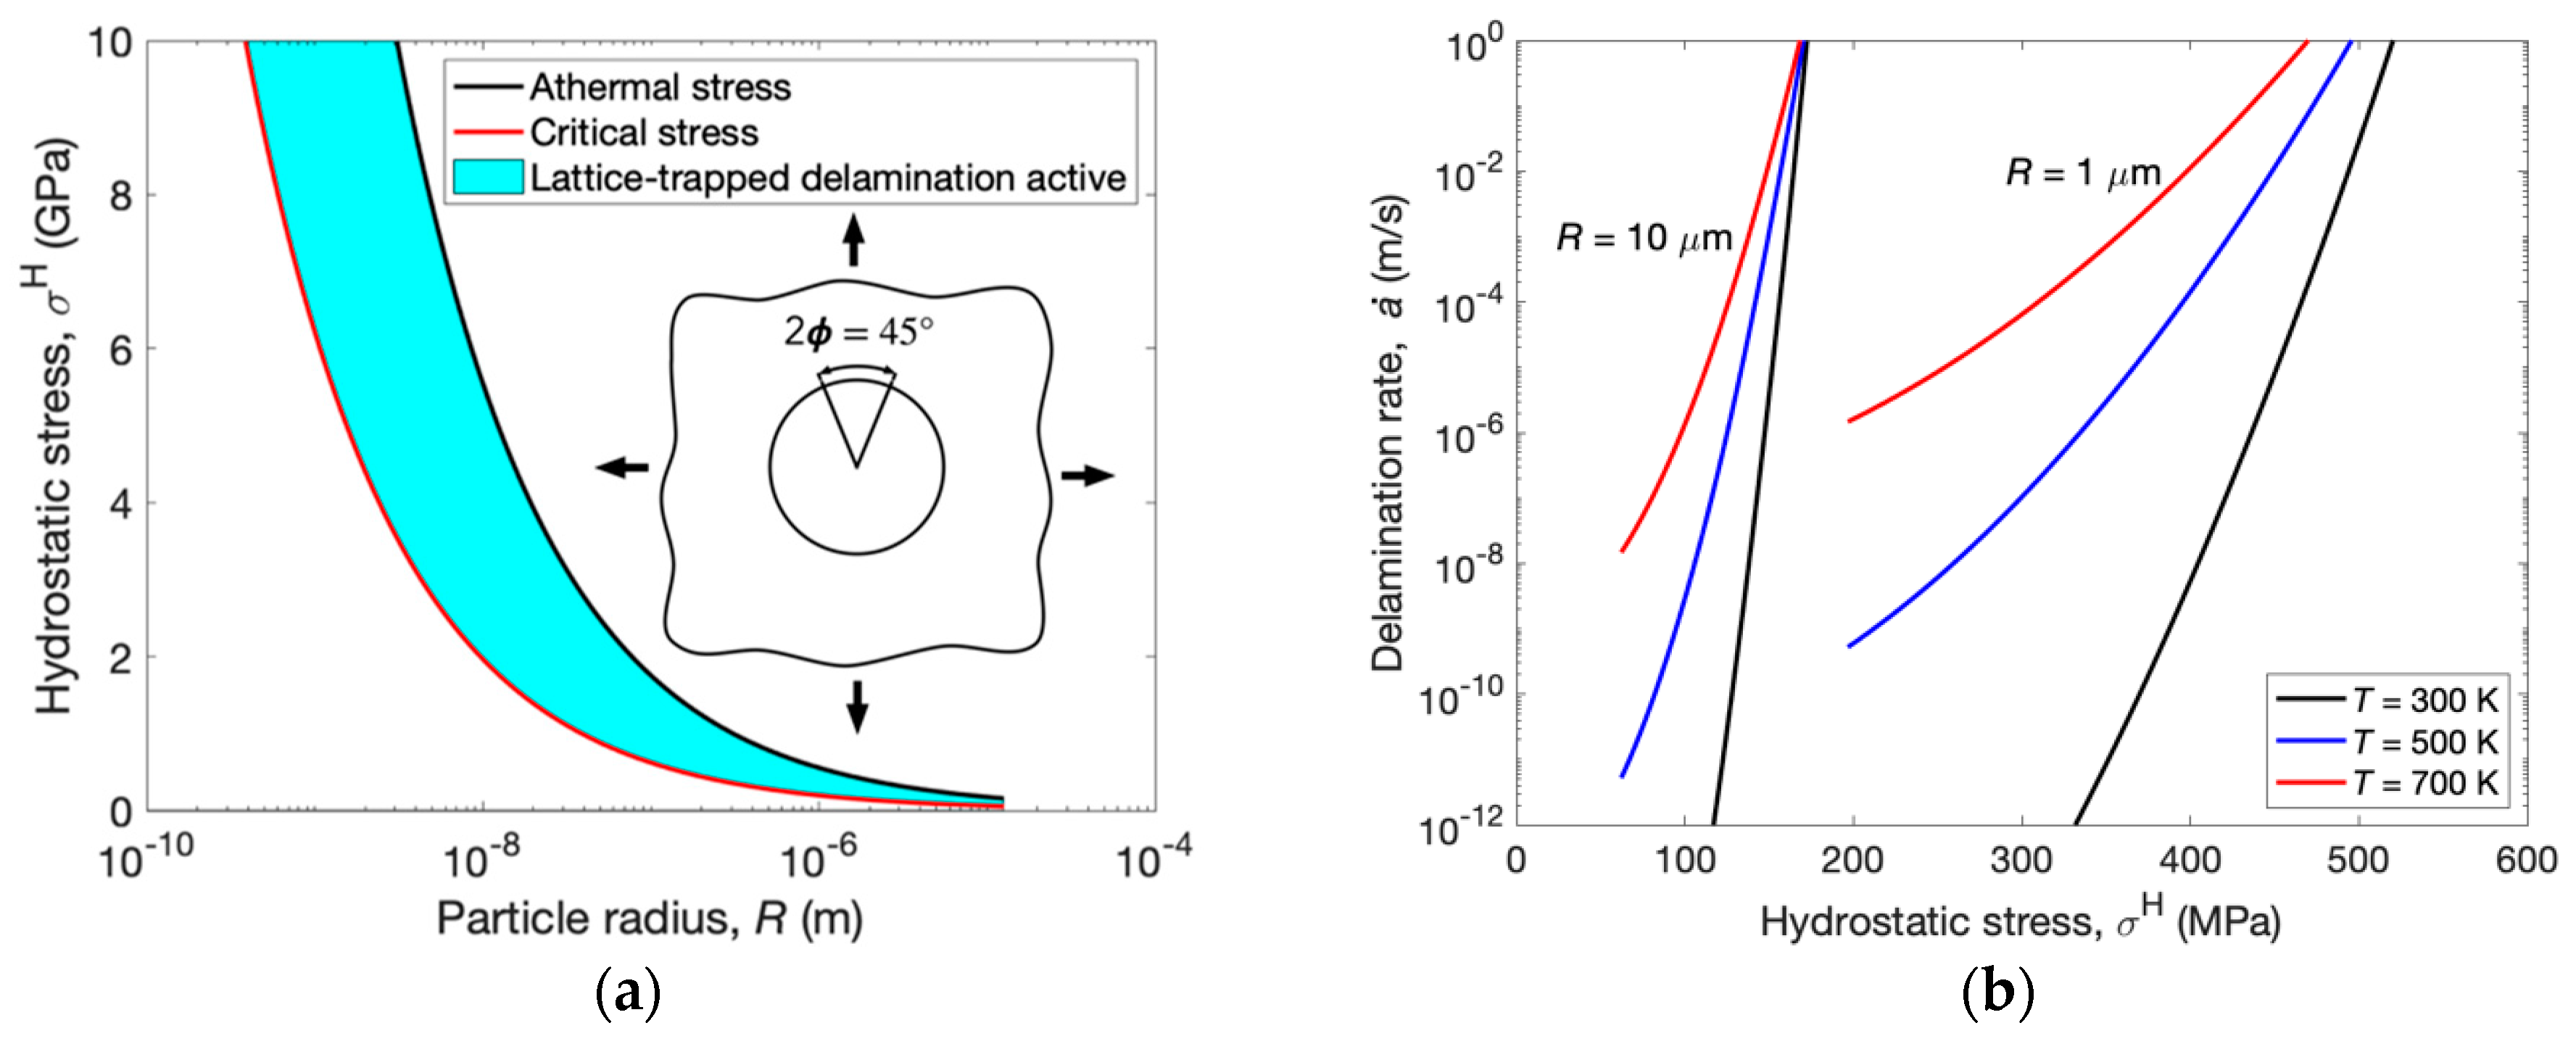
4.3. Implications for Damage and Rupture of Materials

The present simulations bear direct relevance to spall formation under shock loading conditions; for example, spall by microvoid coalescence has been observed in 1100-O aluminum at shock stresses as high as 6 GPa [33]. However, it is reasonable to ask if the present observations also relate to quasi-static ductile rupture of aluminum alloys. The main gaps between our simulation conditions and those of typical experiments are that our applied stresses are much higher (for example, the yield strength of 2xxx series aluminum alloys is in the range of 150–350 MPa depending on alloy and heat treatment) and our particles sizes are smaller.
First, we address dislocation-mediated growth. The reality is that aside from high rate loading scenarios where high stresses are attained [52] and highly localized loading (e.g., under a nano-indenter), dislocation nucleation is typically far too slow to meaningfully impact material behaviors [51,53]. Hence, we do not expect that dislocation-mediated growth, as observed here through nucleation of dislocations, will be relevant under most loading scenarios. Indeed, even within the present spectrum of simulations, the dislocation-mediated growth only occurred at the highest stresses approaching the athermal critical stress. On the other hand, Sills and Boyce recently showed that dislocation-mediated growth processes are greatly accelerated when dislocations are already present in the material, and thus do not require nucleation [54]. Kinematically speaking, it is equivalent to nucleate a dislocation at a crack tip or to adsorb an existing dislocation of opposite sign. We believe that dislocation-mediated growth via adsorption of existing dislocations is likely to play an important role in particle delamination, just as Sills and Boyce argue it does for void growth.
In terms of the relevance of lattice-trapped delamination, we are fortunate to have a fully characterized thermal activation law for the lattice-trapped delamination rate. This means that we can extrapolate the model to quasi-static conditions since the physics of thermal activation is equally valid at lower stresses and larger particle sizes. Importantly, the process of lattice-trapped delamination is bookended by two conditions on the stress intensity factor; namely, K c < K < K at . Below the critical stress intensity factor, K c , delamination is not energetically favorable. And above the athermal stress intensity factor, K at , thermal activation is not operable. Equation (9) provides an estimate for the athermal hydrostatic stress σ ath H at which K at is reached. For brittle fracture, K c = ( γ s m + γ s p ) E ¯ where γ s m and γ s p are the surface energies for the matrix and precipitate, respectively. The surface energy for Al is known experimentally to be γ s m = 0.98 J/m2 [55]. To estimate the surface energy for θ-phase, we use the average value for the interatomic potential used here (computed for (100) and (110) surfaces), giving γ s p = 1.38 J/m2 [38]. These values give a critical stress intensity factor of K c = 0.457 MPa·m1/2. Using these results, we estimate the stress and particle size range where lattice-trapped delamination may operate (i.e., where K c < K < K at ) when ϕ = 22.5 ° in Figure 12a. The plot shows that in the particle size range considered here, stresses must exceed 2.8 GPa for lattice-trapped delamination to operate. On the other hand, for particles with a radius of 1 μm, lattice-trapped delamination can occur in the range of 200 to 550 MPa, which falls within the stress range relevant to quasi-static loading conditions, especially considering that inhomogeneous microstructural stresses can far exceed the homogeneous far-field applied stresses. Using this stress range, we plot the predicted lattice-trapped delamination rate a ˙ as a function of stress for particle radii of 1 and 10 μm at temperatures of 300, 500, and 700 K. Interestingly, the resulting delamination rates are large enough that they may be relevant to applications. For example, full delamination of a 1 μm particle requires ~3 μm of crack growth (half of the circumference), and for this to occur in 1 years’ time would require a delamination rate of just a ˙ 10 13 m/s. We emphasize that because we have made a number of approximations in our analysis, these delamination rates should be interpreted only in terms of their rough order of magnitude. Nonetheless, these results indicate that lattice-trapped delamination via thermally activated brittle crack growth may be broadly relevant to void nucleation.
While we have only considered the influence of hydrostatic loading on the delamination behavior here, shear stresses are also expected to affect delamination. For example, experimental work by Croom et al. [56] and Achouri et al. [57] has demonstrated void nucleation under shear-dominated conditions in pure Cu and particle-containing Al, respectively. In the case of particle-mediated nucleation, in addition to the applied shear stress the non-uniform plastic strain accumulation around the particle provides a driving force for delamination. In the context of lattice-trapped delamination, this driving force is difficult to quantify since it requires an elastic-plastic analysis of deformation with a significant accumulation of plastic strain. None-the-less, lattice-trapped delamination could also be operative under shear-dominated loading, but additional research is necessary to quantify the influence of shear stresses and shear deformation.
Perhaps the most confounding aspect of our simulations is that we set out to study crack nucleation and instead wound-up studying crack growth. One might have expected that the rate controlling step of void nucleation would be the appearance of an interfacial crack, in the sense that a crack spontaneously appeared along the interface. However, this was not the behavior we observed. Instead, we found that excess free volume in the form of vacancy-type defect clusters at the interface appeared quickly and then grew by lattice-trapped delamination. The majority of the simulation time was then spent growing the crack by lattice-trapped delamination until dislocation nucleation occurred. Hence, for our simulations, the rate controlling step for void nucleation was actually lattice-trapped delamination. Once the first dislocations appeared, it is true that the void fully nucleated in a catastrophic manner more consistent with a true nucleation event, but we believe that this may be an artifact of our high stresses; in our lower stress simulations, the dislocation-mediated delamination stage never occurred. We note that additional research is necessary to determine the mechanism for vacancy-type cluster nucleation so that a comprehensive picture for void nucleation can be assembled. While the present observations are directly applicable to the strain-rates associated with shock-induced spallation, extrapolation of the thermally activated process of lattice-trapped delamination suggests that the process is also relevant at quasi-static timescales for micrometer-sized particles.

5. Conclusions

We observed that early stage nanoscale delamination at a particle-matrix interface was a three-stage process: (1) a nuclei of excess free volume is formed at the particle-matrix interface, either immediately upon loading or after a brief delay; (2) subsequently, the nuclei grows in the absence of dislocation activity in a process we term lattice-trapped delamination; (3) when the crack reaches sufficient size and the crack tip stress intensity is sufficient, Shockley partial dislocations are emitted causing a rapid acceleration of crack growth and ultimately complete debonding of the particle-matrix interface. The second stage, lattice-trapped delamination, as described for the first time herein, limits the rate of early-stage growth of the nanocrack, and is not only relevant to shock spallation, but extrapolation of the kinetics of this process suggest that it is also relevant at quasi-static strain rates for micrometer-scale particles.

Author Contributions

Conceptualization, R.B.S.; methodology, R.B.S. and Q.Q.Z.; analysis, R.B.S., Q.Q.Z., and B.L.B.; writing, R.B.S., Q.Q.Z., and B.L.B. All authors have read and agreed to the published version of the manuscript.

Funding

This research received no external funding.

Institutional Review Board Statement

Not applicable.

Informed Consent Statement

Not applicable.

Data Availability Statement

The data presented in this study are openly available through Zenodo at 10.5281/zenodo.4420413.

Acknowledgments

B.L.B. was supported by the Center for Integrated Nanotechnologies funded by the DOE Office of Basic Energy Science. Sandia National Laboratories is a multimission laboratory managed and operated by National Technology and Engineering Solutions of Sandia LLC, a wholly owned subsidiary of Honeywell International Inc. for the U.S. Department of Energy’s National Nuclear Security Administration under contract DE-NA0003525. The views expressed in the article do not necessarily represent the views of the U.S. DOE or the United States Government.

Conflicts of Interest

The authors declare no conflict of interest.

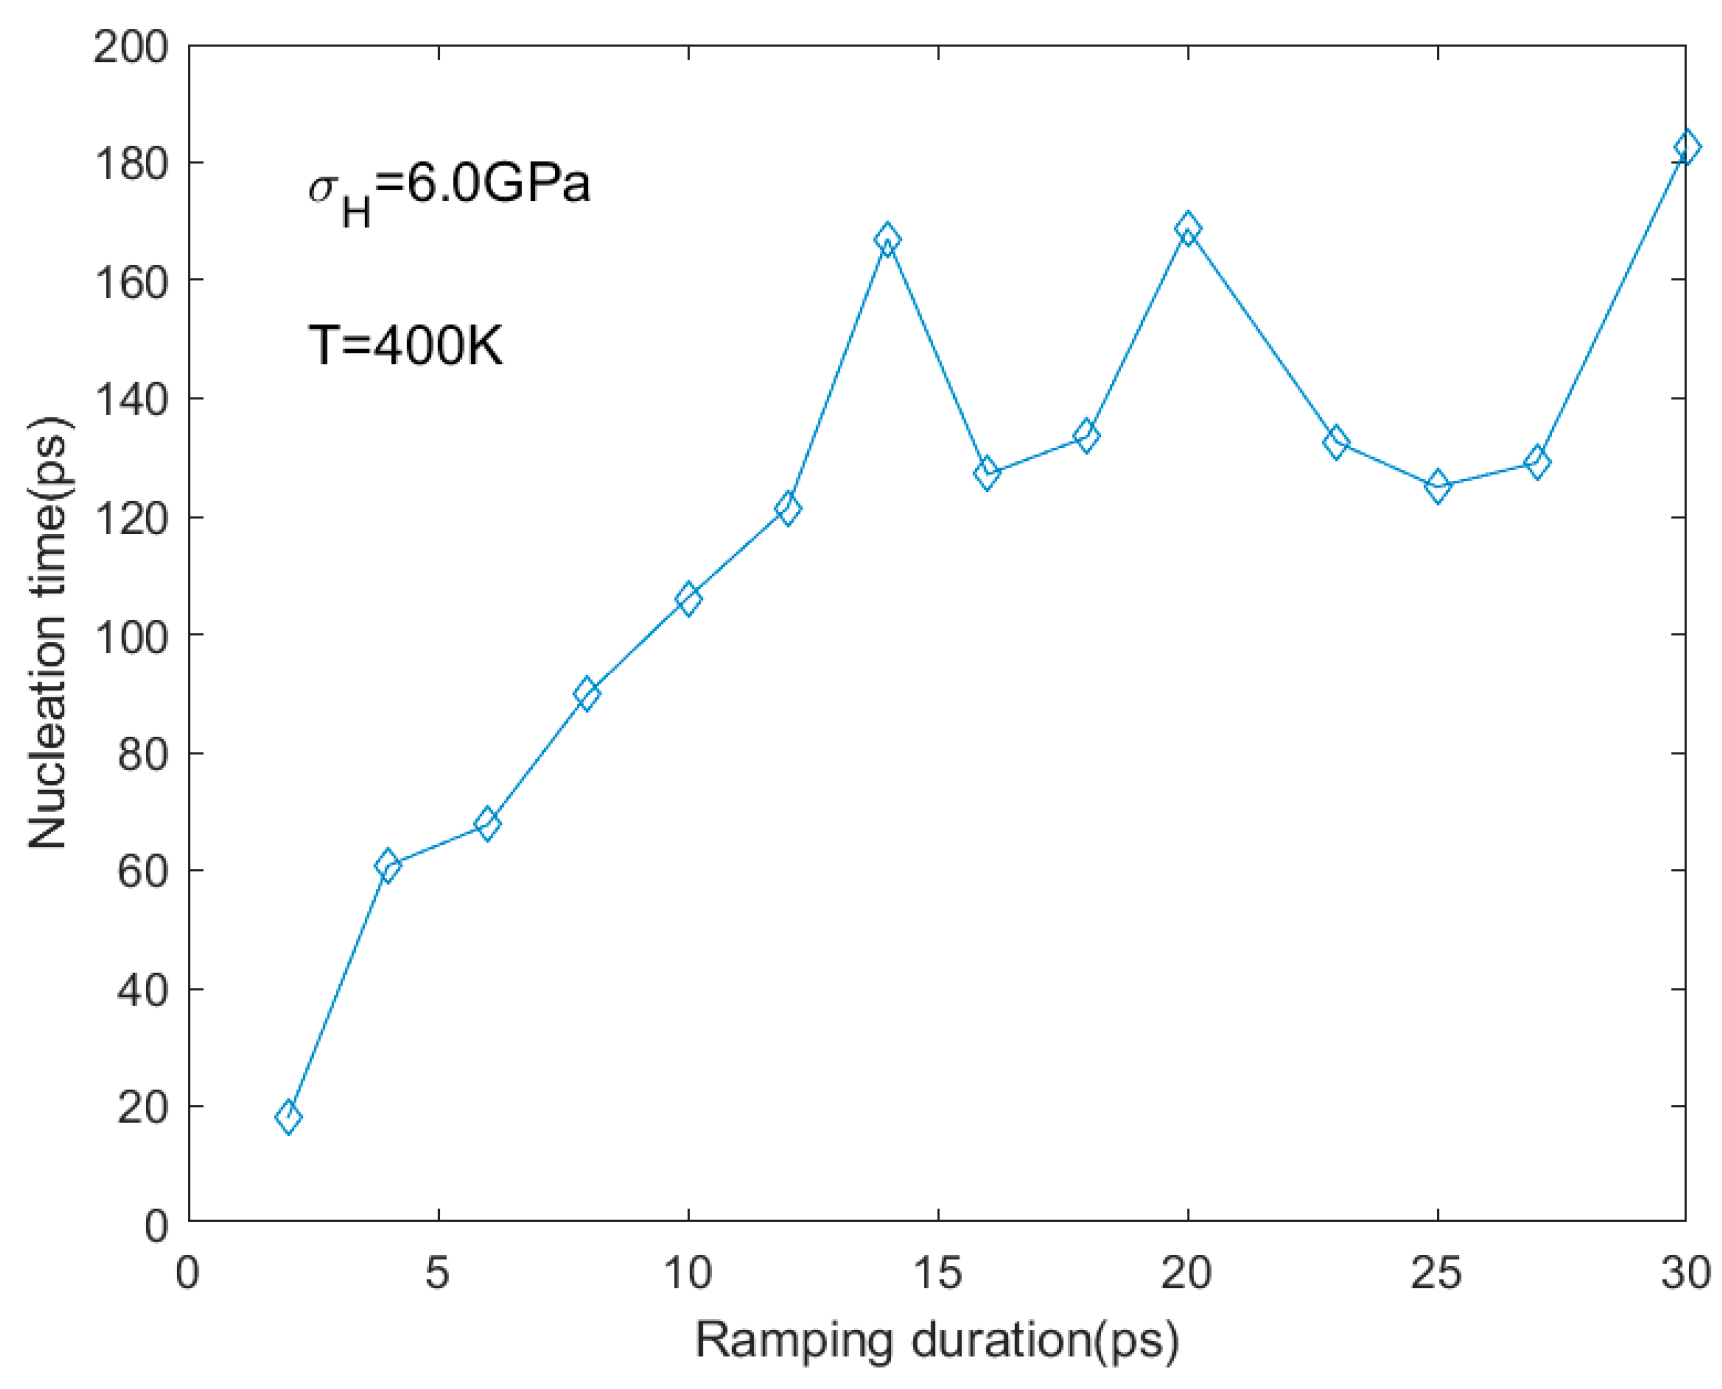
Appendix A. Selection of Ramping Duration

One aspect of these simulations which we found to be challenging was that the hydrostatic stress had to be applied carefully to the atomistic system. Otherwise, artifacts in the form of unwanted and uncontrolled defects would be introduced into the system prior to the holding phase. After trying out several strategies for applying stress to the atomistic system, we found that a simple linear ramp via an NPT ensemble was sufficient as long as the loading duration was sufficiently long. If the ramping duration were too short, we observed that void nucleation would occur prematurely via nucleation of dislocations. Figure A1 shows the time at which a void nucleated relative to the start of the holding phase (indicated by a 10% increase in the simulation cell volume relative to the start of the holding phase). Each data point is an average over five replicas. To ensure that the load ramping does not introduce artifacts, we need to confirm that the nucleation time is insensitive to the ramping duration. Figure A1 shows, within the scatter of the data, that 12 ps is a sufficiently long ramping duration. When ramped over durations less than 12 ps, the nucleation time decreases. We believe that this behavior results from stress waves and spikes introduced into the cell by the NPT barostat during rapid loading, which nucleate defects during ramping.
Figure A1. Void nucleation time, measured as time required for the simulation cell volume to increase by 10% during the holding phase, as a function of ramping duration.
Crystals 11 00045 g0a1

References

  1. Goods, S.H.; Brown, L.M. The Nucleation of Cavities by Plastic Deformation. Acta Met. 1979, 27, 1–15. [Google Scholar] [CrossRef]
  2. Needleman, A. A Continuum Model for Void Nucleation by Inclusion Debonding. J. Appl. Mech. 1987, 54, 525–531. [Google Scholar] [CrossRef]
  3. Shabrov, M.N.; Needleman, A. An analysis of inclusion morphology effects on void nucleation. Model. Simul. Mater. Sci. Eng. 2002, 10, 163–183. [Google Scholar] [CrossRef]
  4. Besson, J. Continuum Models of Ductile Fracture: A Review. Int. J. Damage Mech. 2010, 19, 3–52. [Google Scholar] [CrossRef] [Green Version]
  5. Shakoor, M.; Navas, V.M.T.; Munõz, D.P.; Bernacki, M.; Bouchard, P.-O. Computational Methods for Ductile Fracture Modeling at the Microscale. Arch. Comput. Methods Eng. 2019, 26, 1153–1192. [Google Scholar] [CrossRef]
  6. Bitzek, E.; Kermode, J.R.; Gumbsch, P. Atomistic aspects of fracture. Int. J. Fract. 2015, 191, 13–30. [Google Scholar] [CrossRef]
  7. Tvergaard, V.; Needleman, A. The Modified Gurson Model. In Handbook of Materials Behavior Models; Elsevier: Amsterdam, The Netherlands, 2001; pp. 430–435. [Google Scholar]
  8. Chu, C.C.; Needleman, A. Void Nucleation Effects in Biaxially Stretched Sheets. J. Eng. Mater. Technol. 1980, 102, 249–256. [Google Scholar] [CrossRef]
  9. Tvergaard, V. Material Failure by Void Growth to Coalescence. In Advances in Applied Mechanics; Elsevier: Amsterdam, The Netherlands, 1989; Volume 27, pp. 83–151. [Google Scholar]
  10. Boyce, B.L.; Kramer, S.L.B.; Fang, H.E.; Cordova, T.E.; Neilsen, M.K.; Dion, K.; Kaczmarowski, A.K.; Karasz, E.; Xue, L.; Gross, A.J.; et al. The Sandia Fracture Challenge: Blind round robin predictions of ductile tearing. Int. J. Fract. 2014, 186, 5–68. [Google Scholar] [CrossRef] [Green Version]
  11. Boyce, B.L.; Kramer, S.L.B.; Bosiljevac, T.R.; Corona, E.; Moore, J.A.; Elkhodary, K.; Simha, C.H.M.; Williams, B.W.; Cerrone, A.R.; Nonn, A.; et al. The second Sandia Fracture Challenge: Predictions of ductile failure under quasi-static and moderate-rate dynamic loading. Int. J. Fract. 2016, 198, 5–100. [Google Scholar] [CrossRef]
  12. Kramer, S.L.B.; Jones, A.; Mostafa, A.; Ravaji, B.; Tancogne-Dejean, T.; Roth, C.C.; Bandpay, M.G.; Pack, K.; Foster, J.T.; Behzadinasab, M.; et al. The third Sandia fracture challenge: Predictions of ductile fracture in additively manufactured metal. Int. J. Fract. 2019, 218, 5–61. [Google Scholar] [CrossRef]
  13. Berdichevsky, V.; Le, K.C. On The Microcrack Nucleation In Brittle Solids. Int. J. Fract. 2005, 133, L47–L54. [Google Scholar] [CrossRef]
  14. Dias, C.L.; Kröger, J.; Vernon, D.; Grant, M. Nucleation of cracks in a brittle sheet. Phys. Rev. E 2009, 80, 066109. [Google Scholar] [CrossRef] [PubMed] [Green Version]
  15. Rawat, S.; Raole, P.M. Molecular dynamics investigation of void evolution dynamics in single crystal iron at extreme strain rates. Comput. Mater. Sci. 2018, 154, 393–404. [Google Scholar] [CrossRef]
  16. Yang, X.; Zeng, X.; Wang, J.; Wang, J.; Wang, F.; Ding, J. Atomic-scale modeling of the void nucleation, growth, and coalescence in Al at high strain rates. Mech. Mater. 2019, 135, 98–113. [Google Scholar] [CrossRef]
  17. Agarwal, G.; Dongare, A.M. Defect and damage evolution during spallation of single crystal Al: Comparison between molecular dynamics and quasi-coarse-grained dynamics simulations. Comput. Mater. Sci. 2018, 145, 68–79. [Google Scholar] [CrossRef]
  18. Shao, J.-L.; Wang, P.; He, A.-M.; Zhang, R.; Qin, C.-S. Spall strength of aluminium single crystals under high strain rates: Molecular dynamics study. J. Appl. Phys. 2013, 114, 173501. [Google Scholar] [CrossRef]
  19. Liao, Y.; Xiang, M.; Zeng, X.; Chen, J. Molecular dynamics study of the micro-spallation of single crystal tin. Comput. Mater. Sci. 2014, 95, 89–98. [Google Scholar] [CrossRef]
  20. Rawat, S.; Warrier, M.; Chaturvedi, S.; Chavan, V.M. Temperature sensitivity of void nucleation and growth parameters for single crystal copper: A molecular dynamics study. Model. Simul. Mater. Sci. Eng. 2011, 19, 025007. [Google Scholar] [CrossRef]
  21. Pang, W.-W.; Zhang, P.; Zhang, G.-C.; Xu, A.-G.; Zhao, X.-G. Dislocation creation and void nucleation in FCC ductile metals under tensile loading: A general microscopic picture. Sci. Rep. 2015, 4, 6981. [Google Scholar] [CrossRef] [Green Version]
  22. Mayer, A.E.; Mayer, P.N. Strain rate dependence of spall strength for solid and molten lead and tin. Int. J. Fract. 2020, 222, 171–195. [Google Scholar]
  23. Paul, S.K.; Kumar, S.; Tarafder, S. Effect of loading conditions on nucleation of nano void and failure of nanocrystalline aluminum: An atomistic investigation. Eng. Fract. Mech. 2017, 176, 257–262. [Google Scholar] [CrossRef]
  24. Fensin, S.J.; Cerreta, E.K.; Iii, G.T.G.; Valone, S.M. Why are some Interfaces in Materials Stronger than others? Sci. Rep. 2015, 4, 5461. [Google Scholar] [CrossRef] [Green Version]
  25. Xu, S.; Deng, X. Nanoscale void nucleation and growth and crack tip stress evolution ahead of a growing crack in a single crystal. Nanotechnology 2008, 19, 115705. [Google Scholar] [CrossRef] [PubMed]
  26. Pogorelko, V.V.; Mayer, A.E. Influence of copper inclusions on the strength of aluminum matrix at high-rate tension. Mater. Sci. Eng. A 2015, 642, 351–359. [Google Scholar] [CrossRef]
  27. Pogorelko, V.V.; Mayer, A.E. Influence of titanium and magnesium nanoinclusions on the strength of aluminum at high-rate tension: Molecular dynamics simulations. Mater. Sci. Eng. A 2016, 662, 227–240. [Google Scholar] [CrossRef]
  28. Pogorelko, V.V.; Mayer, A.E. Tensile strength of Fe–Ni and Mg–Al nanocomposites: Molecular dynamic simulations. J. Phys. Conf. Ser. 2018, 946, 012043. [Google Scholar] [CrossRef]
  29. Pogorelko, V.V.; Mayer, A.E. Tensile strength of Al matrix with nanoscale Cu, Ti and Mg inclusions. J. Phys. Conf. Ser. 2016, 774, 012034. [Google Scholar] [CrossRef]
  30. Cui, Y.; Chen, Z. Void initiation from interfacial debonding of spherical silicon particles inside a silicon-copper nanocomposite: A molecular dynamics study. Model. Simul. Mater. Sci. Eng. 2017, 25, 025007. [Google Scholar] [CrossRef]
  31. Coffman, V.R.; Sethna, J.P.; Heber, G.; Liu, M.; Ingraffea, A.; Bailey, N.P.; Barker, E.I. A comparison of finite element and atomistic modelling of fracture. Model. Simul. Mater. Sci. Eng. 2008, 16, 065008. [Google Scholar] [CrossRef] [Green Version]
  32. Ramesh, K.T. High Rates and Impact Experiments. In Springer Handbook of Experimental Solid Mechanics; Sharpe, W.N., Ed.; Springer: Boston, MA, USA, 2008; pp. 929–960. [Google Scholar]
  33. Williams, C.L.; Chen, C.Q.; Ramesh, K.T.; Dandekar, D.P. On the shock stress, substructure evolution, and spall response of commercially pure 1100-O aluminum. Mater. Sci. Eng. A 2014, 618, 596–604. [Google Scholar] [CrossRef]
  34. Nie, J.-F. 20 Physical Metallurgy of Light Alloys. In Physical Metallurgy; Laughlin, D.E., Hono, K., Eds.; Elsevier: Oxford, UK, 2014; pp. 2009–2156. [Google Scholar]
  35. Vaughan, D.; Silcock, J.M. The Orientation and Shape of θ Precipitates Formed in an Al-Cu Alloy. Phys. Status Solidi B 1967, 20, 725–736. [Google Scholar] [CrossRef]
  36. Wisner, B.; Kontsos, A. Investigation of particle fracture during fatigue of aluminum 2024. Int. J. Fatigue 2018, 111, 33–43. [Google Scholar] [CrossRef]
  37. Plimpton, S. Fast Parallel Algorithms for Short-Range Molecular Dynamics. J. Comput. Phys. 1995, 117, 1–19. [Google Scholar] [CrossRef] [Green Version]
  38. Apostol, F.; Mishin, Y. Interatomic potential for the Al-Cu system. Phys. Rev. B 2011, 83, 054116. [Google Scholar] [CrossRef] [Green Version]
  39. Mura, T. Micromechanics of Defects in Solids; Springer: Dordrecht, The Netherlands, 1987; Volume 3. [Google Scholar]
  40. Stukowski, A. Structure identification methods for atomistic simulations of crystalline materials. Model. Simul. Mater. Sci. Eng. 2012, 20, 045021. [Google Scholar] [CrossRef]
  41. Stukowski, A. Visualization and analysis of atomistic simulation data with OVITO–the Open Visualization Tool. Model. Simul. Mater. Sci. Eng. 2010, 18, 015012. [Google Scholar] [CrossRef]
  42. Thomson, R.; Hsieh, C.; Rana, V. Lattice Trapping of Fracture Cracks. J. Appl. Phys. 1971, 42, 3154–3160. [Google Scholar] [CrossRef]
  43. Schoeck, G. Thermally activated crack-propagation in brittle materials. Int. J. Fract. 1990, 44, 1–14. [Google Scholar] [CrossRef]
  44. Argon, A.S. Thermally activated crack growth in brittle solids? Scr. Metall. 1982, 16, 259–264. [Google Scholar] [CrossRef]
  45. Zhu, T.; Li, J.; Yip, S. Atomistic Configurations and Energetics of Crack Extension in Silicon. Phys. Rev. Lett. 2004, 93, 205504. [Google Scholar] [CrossRef] [Green Version]
  46. Zhu, T.; Li, J.; Yip, S. Atomistic characterization of three-dimensional lattice trapping barriers to brittle fracture. Proc. R. Soc. Math. Phys. Eng. Sci. 2006, 462, 1741–1761. [Google Scholar] [CrossRef]
  47. Wiederhorn, S.M.; Johnson, H.; Diness, A.M.; Heuer, A.H. Fracture of Glass in Vacuum. J. Am. Ceram. Soc. 1974, 57, 6. [Google Scholar] [CrossRef]
  48. Tan, C.L.; Gao, Y.L. Stress intensity factors for cracks at spherical inclusions by the boundary integral equation method. J. Strain Anal. Eng. Des. 1990, 25, 197–206. [Google Scholar] [CrossRef]
  49. Rice, J.R. Elastic Fracture Mechanics Concepts for Interfacial Cracks. J. Appl. Mech. 1988, 55, 98–103. [Google Scholar] [CrossRef]
  50. Zhang, J.; Huang, Y.N.; Mao, C.; Peng, P. Structural, elastic and electronic properties of θ (Al2Cu) and S (Al2CuMg) strengthening precipitates in Al–Cu–Mg series alloys: First-principles calculations. Solid State Commun. 2012, 152, 2100–2104. [Google Scholar] [CrossRef]
  51. Zhu, T.; Li, J.; Yip, S. Atomistic Study of Dislocation Loop Emission from a Crack Tip. Phys. Rev. Lett. 2004, 93, 025503. [Google Scholar] [CrossRef] [Green Version]
  52. Gray, G.T., III. High-Strain-Rate Deformation: Mechanical Behavior and Deformation Substructures Induced. Annu. Rev. Mater. Res. 2012, 42, 285–303. [Google Scholar] [CrossRef]
  53. Nguyen, L.D.; Warner, D.H. Improbability of Void Growth in Aluminum via Dislocation Nucleation under Typical Laboratory Conditions. Phys. Rev. Lett. 2012, 108, 035501. [Google Scholar] [CrossRef] [Green Version]
  54. Sills, R.B.; Boyce, B.L. Void growth by dislocation adsorption. Mater. Res. Lett. 2020, 8, 103–109. [Google Scholar] [CrossRef]
  55. Murr, L.E. Interfacial Phenomena in Metals and Alloys; Addison-Wesley: London, UK, 1975. [Google Scholar]
  56. Croom, B.P.; Jin, H.; Noell, P.J.; Boyce, B.L.; Li, X. Collaborative ductile rupture mechanisms of high-purity copper identified by in situ X-ray computed tomography. Acta Mater. 2019, 181, 377–384. [Google Scholar] [CrossRef]
  57. Achouri, M.; Germain, G.; Santo, P.D.; Saidane, D. Experimental characterization and numerical modeling of micromechanical damage under different stress states. Mater. Des. 2013, 50, 207–222. [Google Scholar] [CrossRef] [Green Version]
Figure 1. Simulation details. (a) Snapshot showing periodic simulation cell with a spherical θ-particle loaded hydrostatically; (b) time history of hydrostatic stress from a sample simulation at T = 400 K and σ H = 6.0 GPa with simulation stages marked. When the particle completely delaminates the applied stress can no longer be sustained, causing the precipitous drop at the end.
Crystals 11 00045 g001
Figure 2. Simulation snapshots from a simulation with T = 400 K and σ H = 6.0 GPa. Blue atoms are associated with a crack (have an atomic volume > 30 Å3). (a) Initial appearance of a small crack involving a few atoms at t = 37 ps (relative to the start of the holding stage). (b) Subsequent growth of the crack via lattice-trapped delamination at t = 105 ps. (c) Initial appearance of dislocations at the crack tips at t = 126 ps. (d) Rapid crack growth via dislocation-mediated delamination at t = 139 ps. Green lines are Shockley-Read partial dislocations. Red atoms are associated with stacking faults.
Crystals 11 00045 g002
Figure 3. Snapshots from the same simulation as Figure 2 showing atomic displacements (black arrows) associated with (a) lattice-trapped delamination over an 18 ps time window and (b) dislocation-mediated delamination during a 2 ps time window. Blue atoms are associated with a crack (have an atomic volume > 30 Å3). Green lines are Shockley-Read partial dislocations. Red atoms are associated with stacking faults. Yellow circles denote atoms whose atomic trajectories differ significantly from their immediate neighbors.
Crystals 11 00045 g003
Figure 4. Approximate crack nucleation locations projected onto the x-z plane from 40 simulations with various stresses and temperatures.
Crystals 11 00045 g004
Figure 5. Hydrostatic stress-strain curve from a molecular statics simulation of delamination at T = 0 K. The peak stress is the stress required to delaminate the particle without the aid of thermal fluctuations.
Crystals 11 00045 g005
Figure 6. Crack volume as a function of time for simulations with T = 400 K and σ H = 6.0 GPa, each with a different random seed for atomic velocity initialization. Dashed lines denote the lattice-trapped delamination rates and circles mark the appearance of a dislocation.
Crystals 11 00045 g006
Figure 7. Histograms of lattice-trapped delamination rates from 30 replicas at (a) T = 200 K and σ H = 7.0 GPa and (b) T = 400 K and σ H = 6.0 GPa.
Crystals 11 00045 g007
Figure 8. Average lattice-trapped delamination rate among 10 replicas, V ˙ , as a function of hydrostatic stress over temperatures ranging from 200 to 400 K.
Crystals 11 00045 g008
Figure 9. Average crack volume among 10 replicas at the moment of dislocation nucleation as a function of hydrostatic stress over temperatures ranging from 200 to 400 K.
Crystals 11 00045 g009
Figure 10. Lattice-trapped delamination rate data from Figure 8 plotted based on the theory of thermally activated crack growth. Dashed lines are linear fits with identical slopes.
Crystals 11 00045 g010
Figure 11. Arrhenius plot of ordinate intercepts from linear curve fits in Figure 10, showing Arrhenius behavior consistent with the theory of thermally activated crack growth.
Crystals 11 00045 g011
Figure 12. Predictions of lattice-trapped delamination for a crack with ϕ = 22.5 . (a) Stress range over which lattice-trapped delamination may operate. (b) Lattice-trapped delamination rates for particles of radius R = 1 μm and 10 μm at three temperatures.
Crystals 11 00045 g012
Publisher’s Note: MDPI stays neutral with regard to jurisdictional claims in published maps and institutional affiliations.

