Spectroscopic Investigations, Computational Analysis and Molecular Docking to SAR-Cov-2 Targets Studies of 5,8-Quinolinedione Attached to Betulin Derivatives

 , ,
, ,
Abstract
:1. Introduction
2. Materials and Methods
2.1. Physical Measurements
2.2. Computational Details
2.3. Molecular Docking Study
3. Results and Discussion
3.1. Molecular Geometry
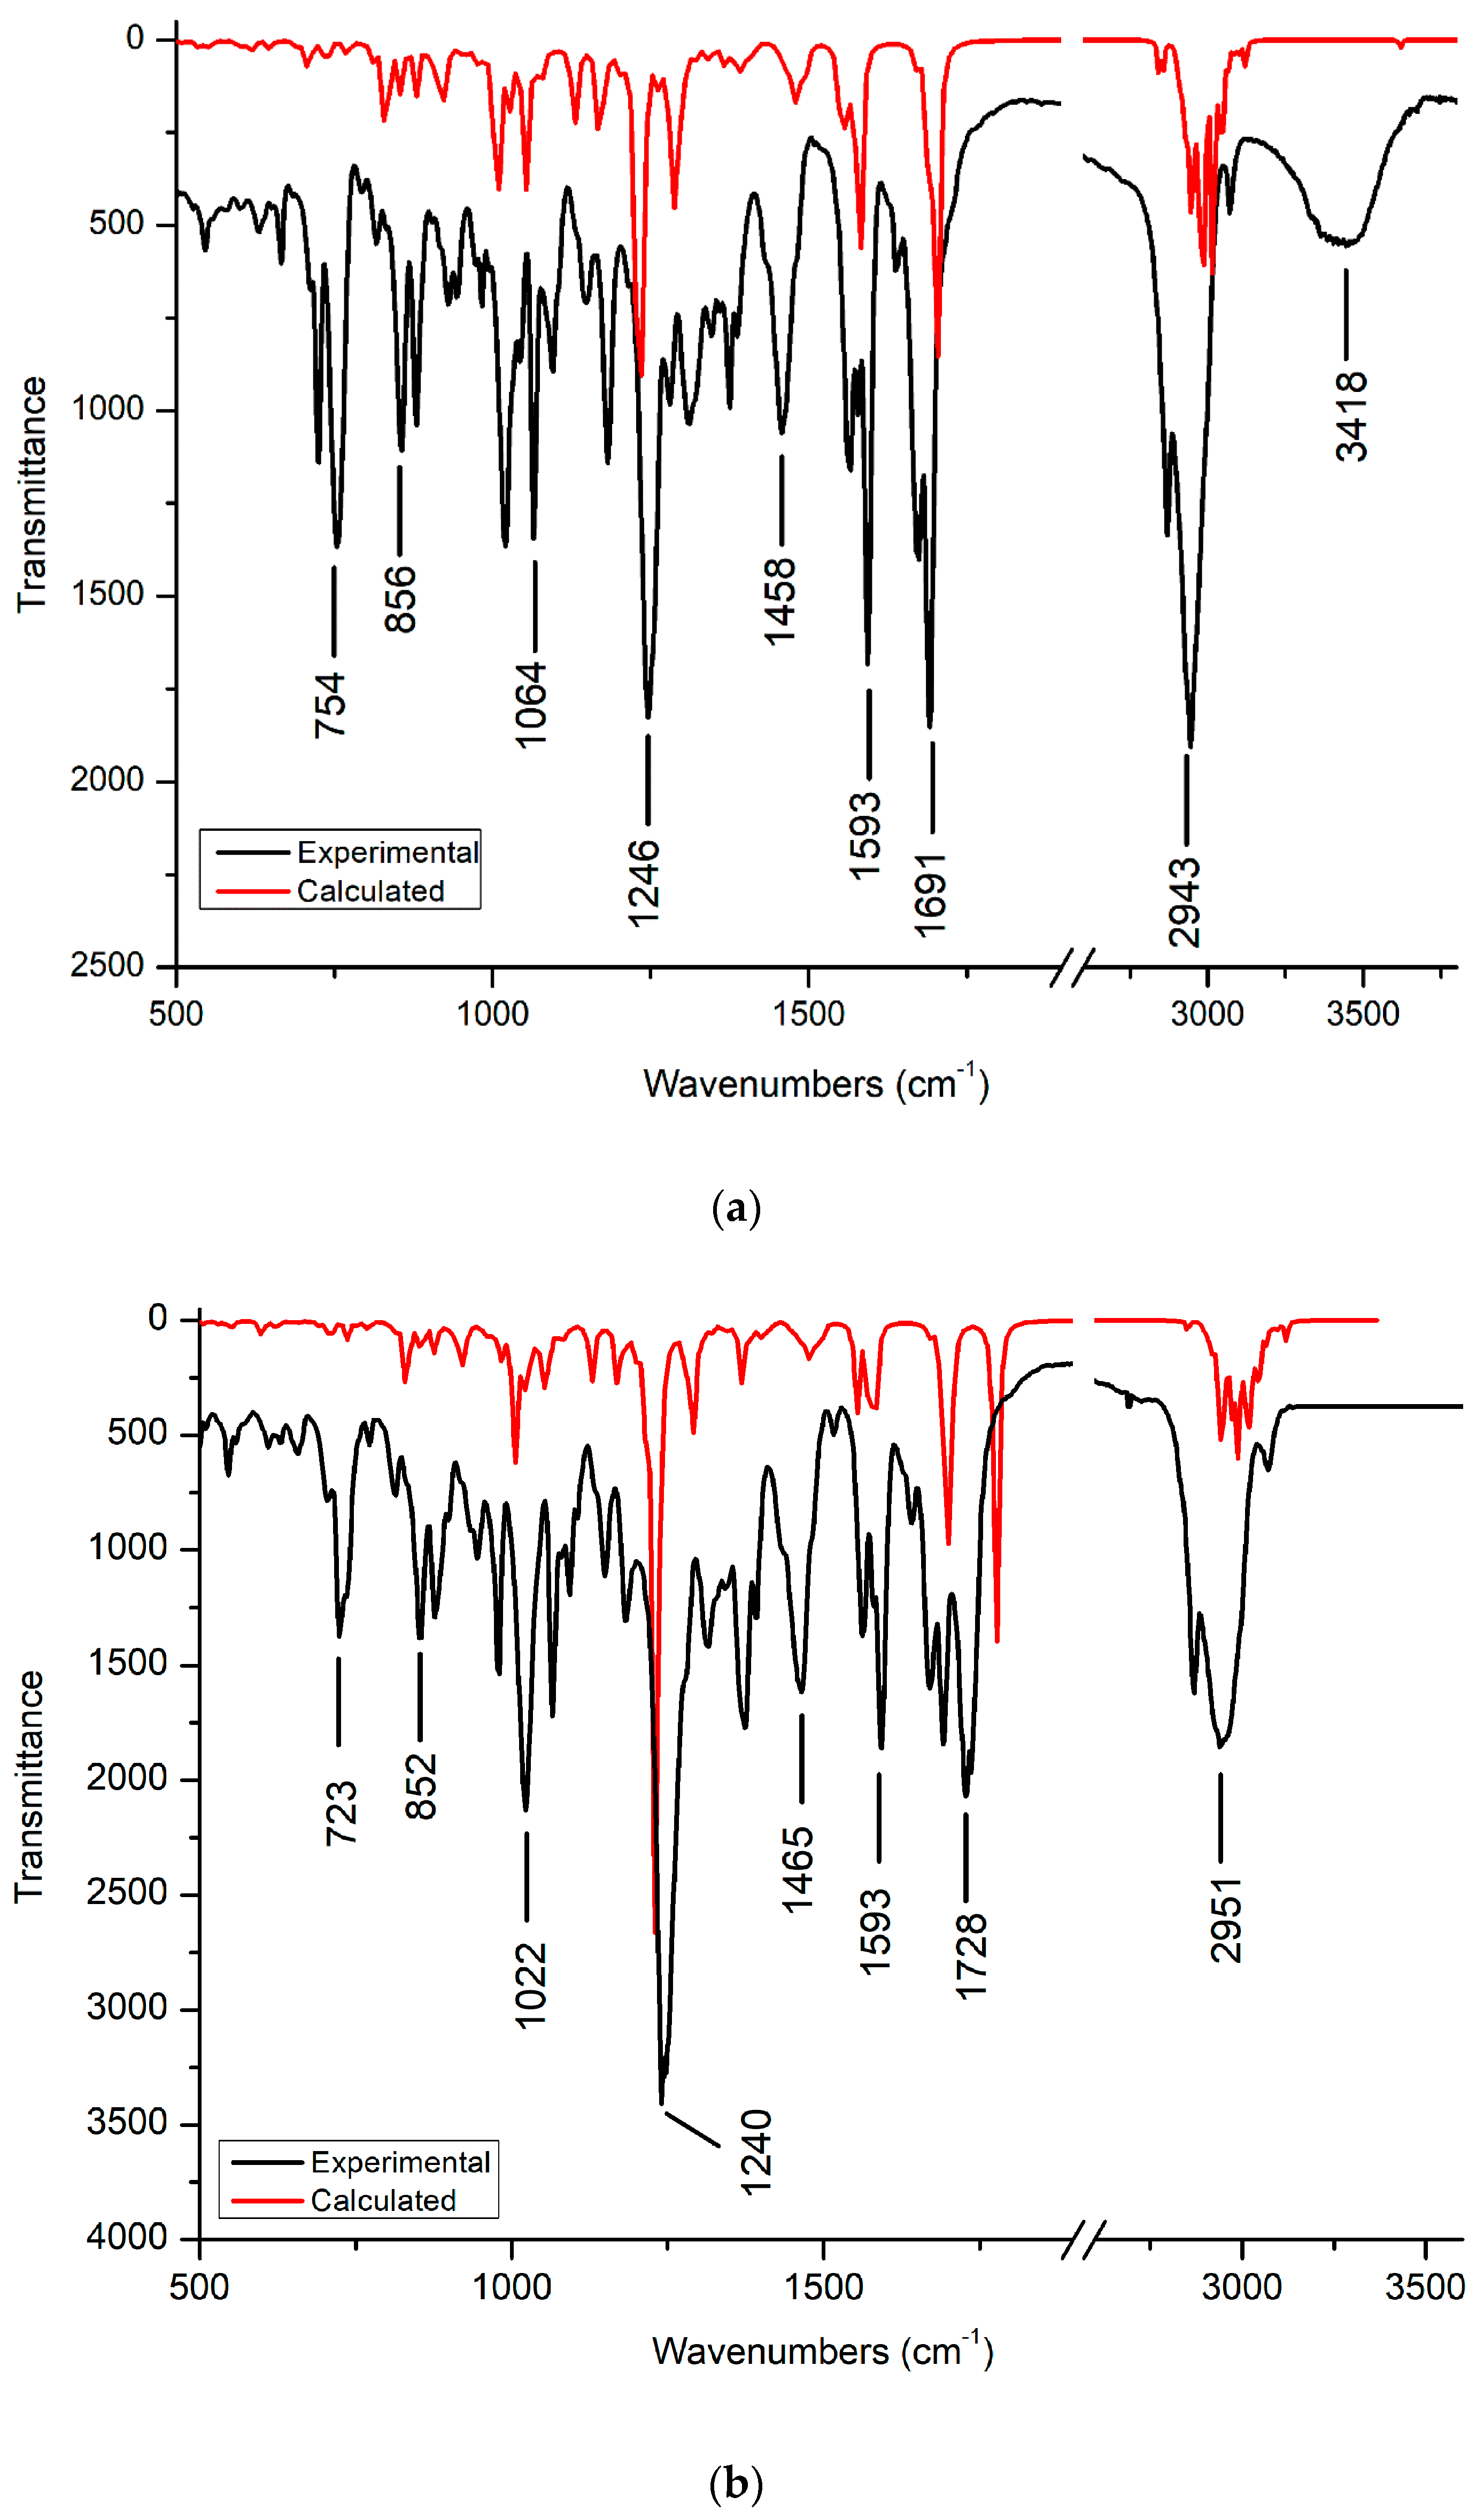
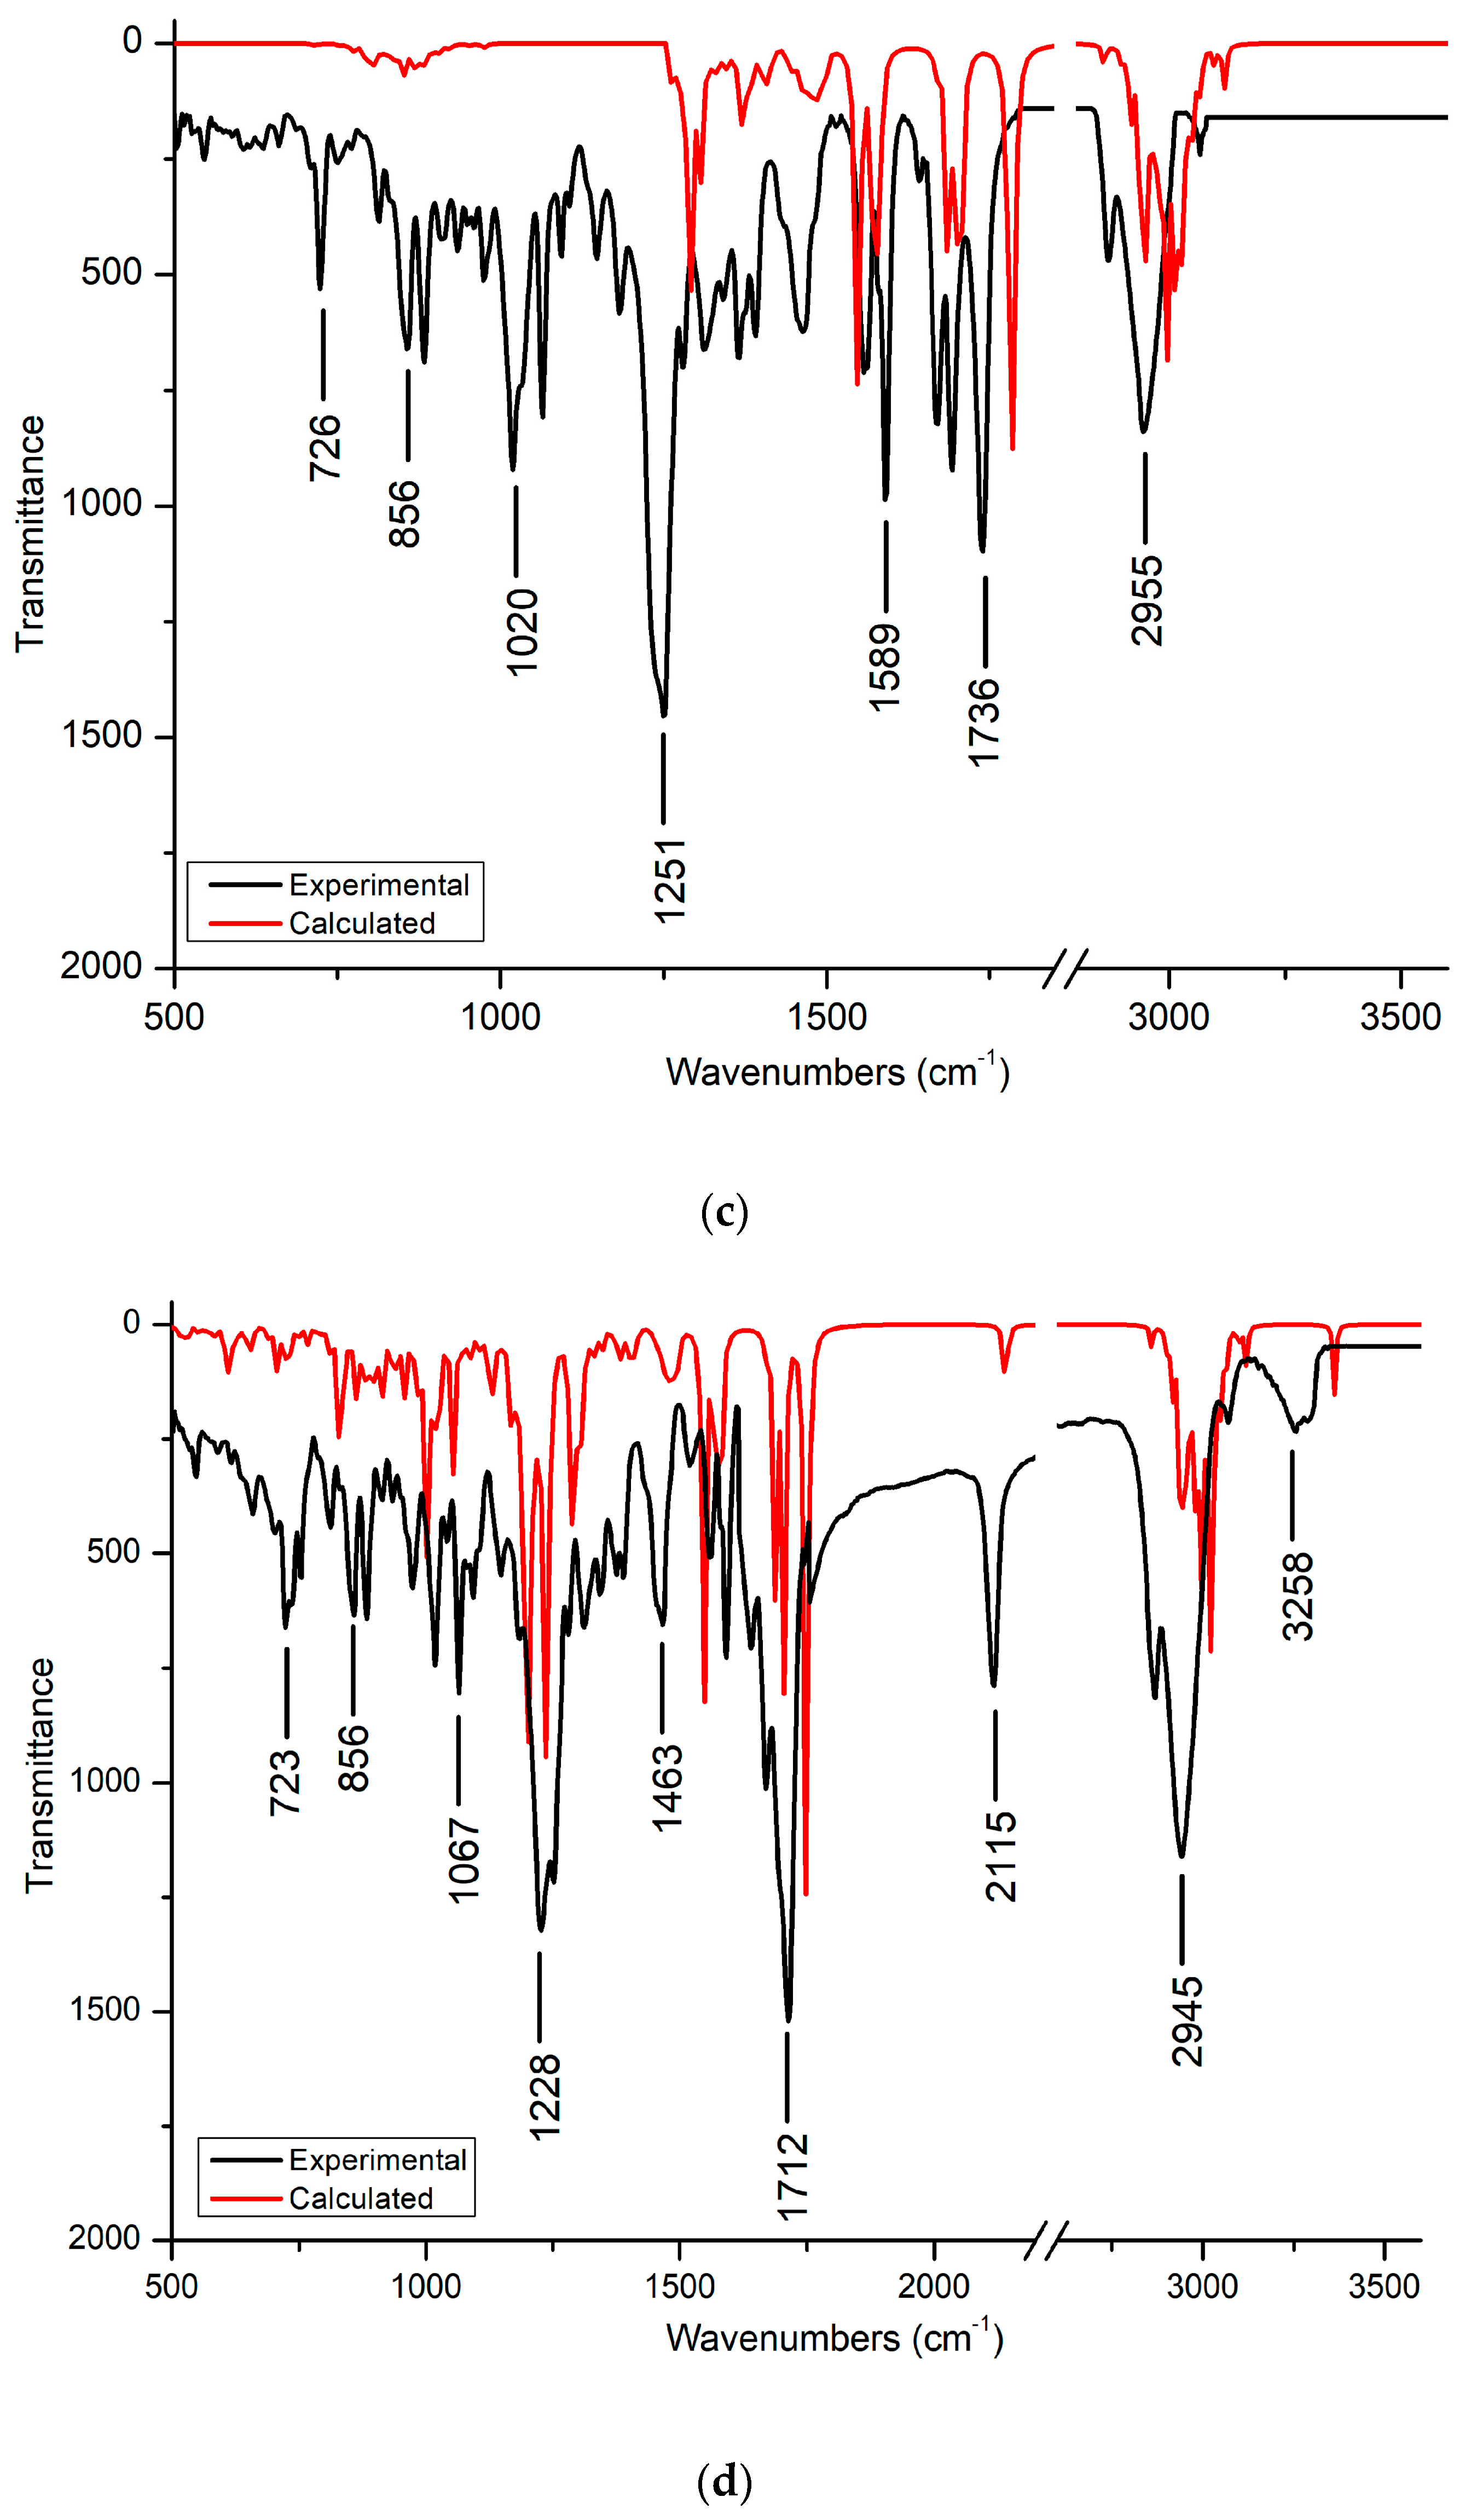
3.2. FT-IR Spectra
3.2.1. C-H and C-C Vibration
3.2.2. C-O and O-H Vibration
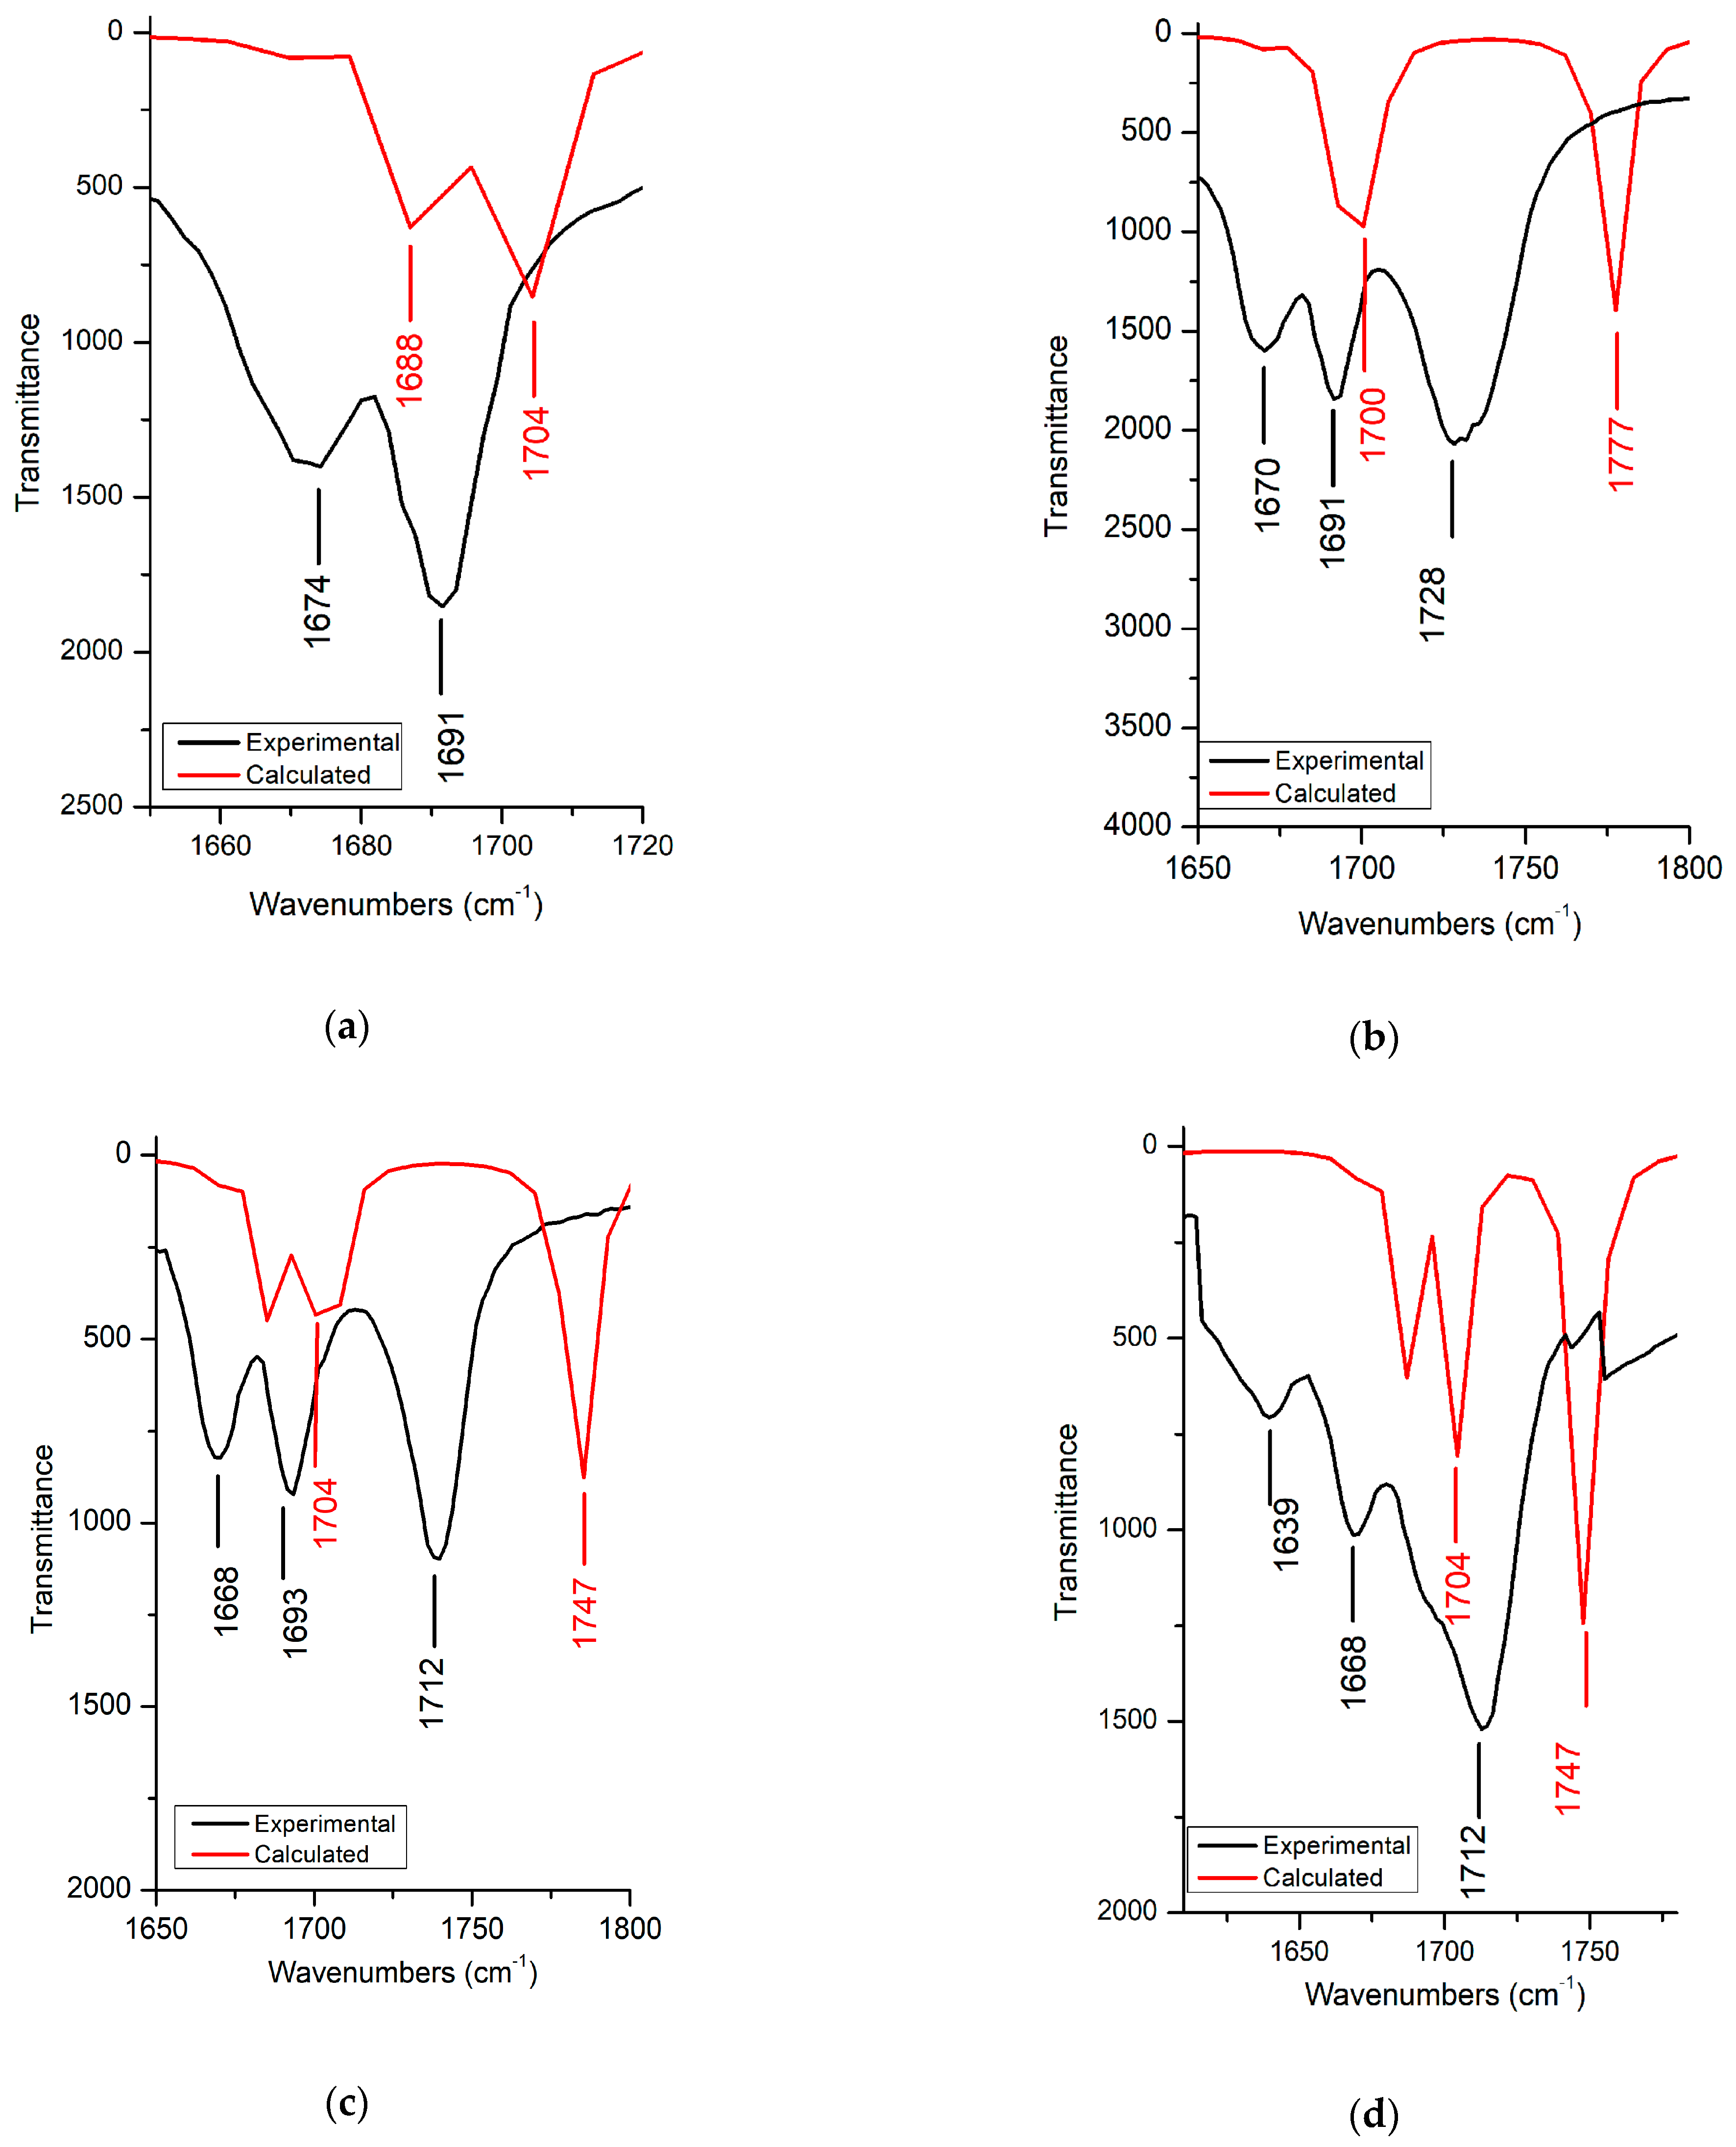
3.2.3. C=O Vibration
3.2.4. C-N Vibration
3.2.5. C-Cl Vibration
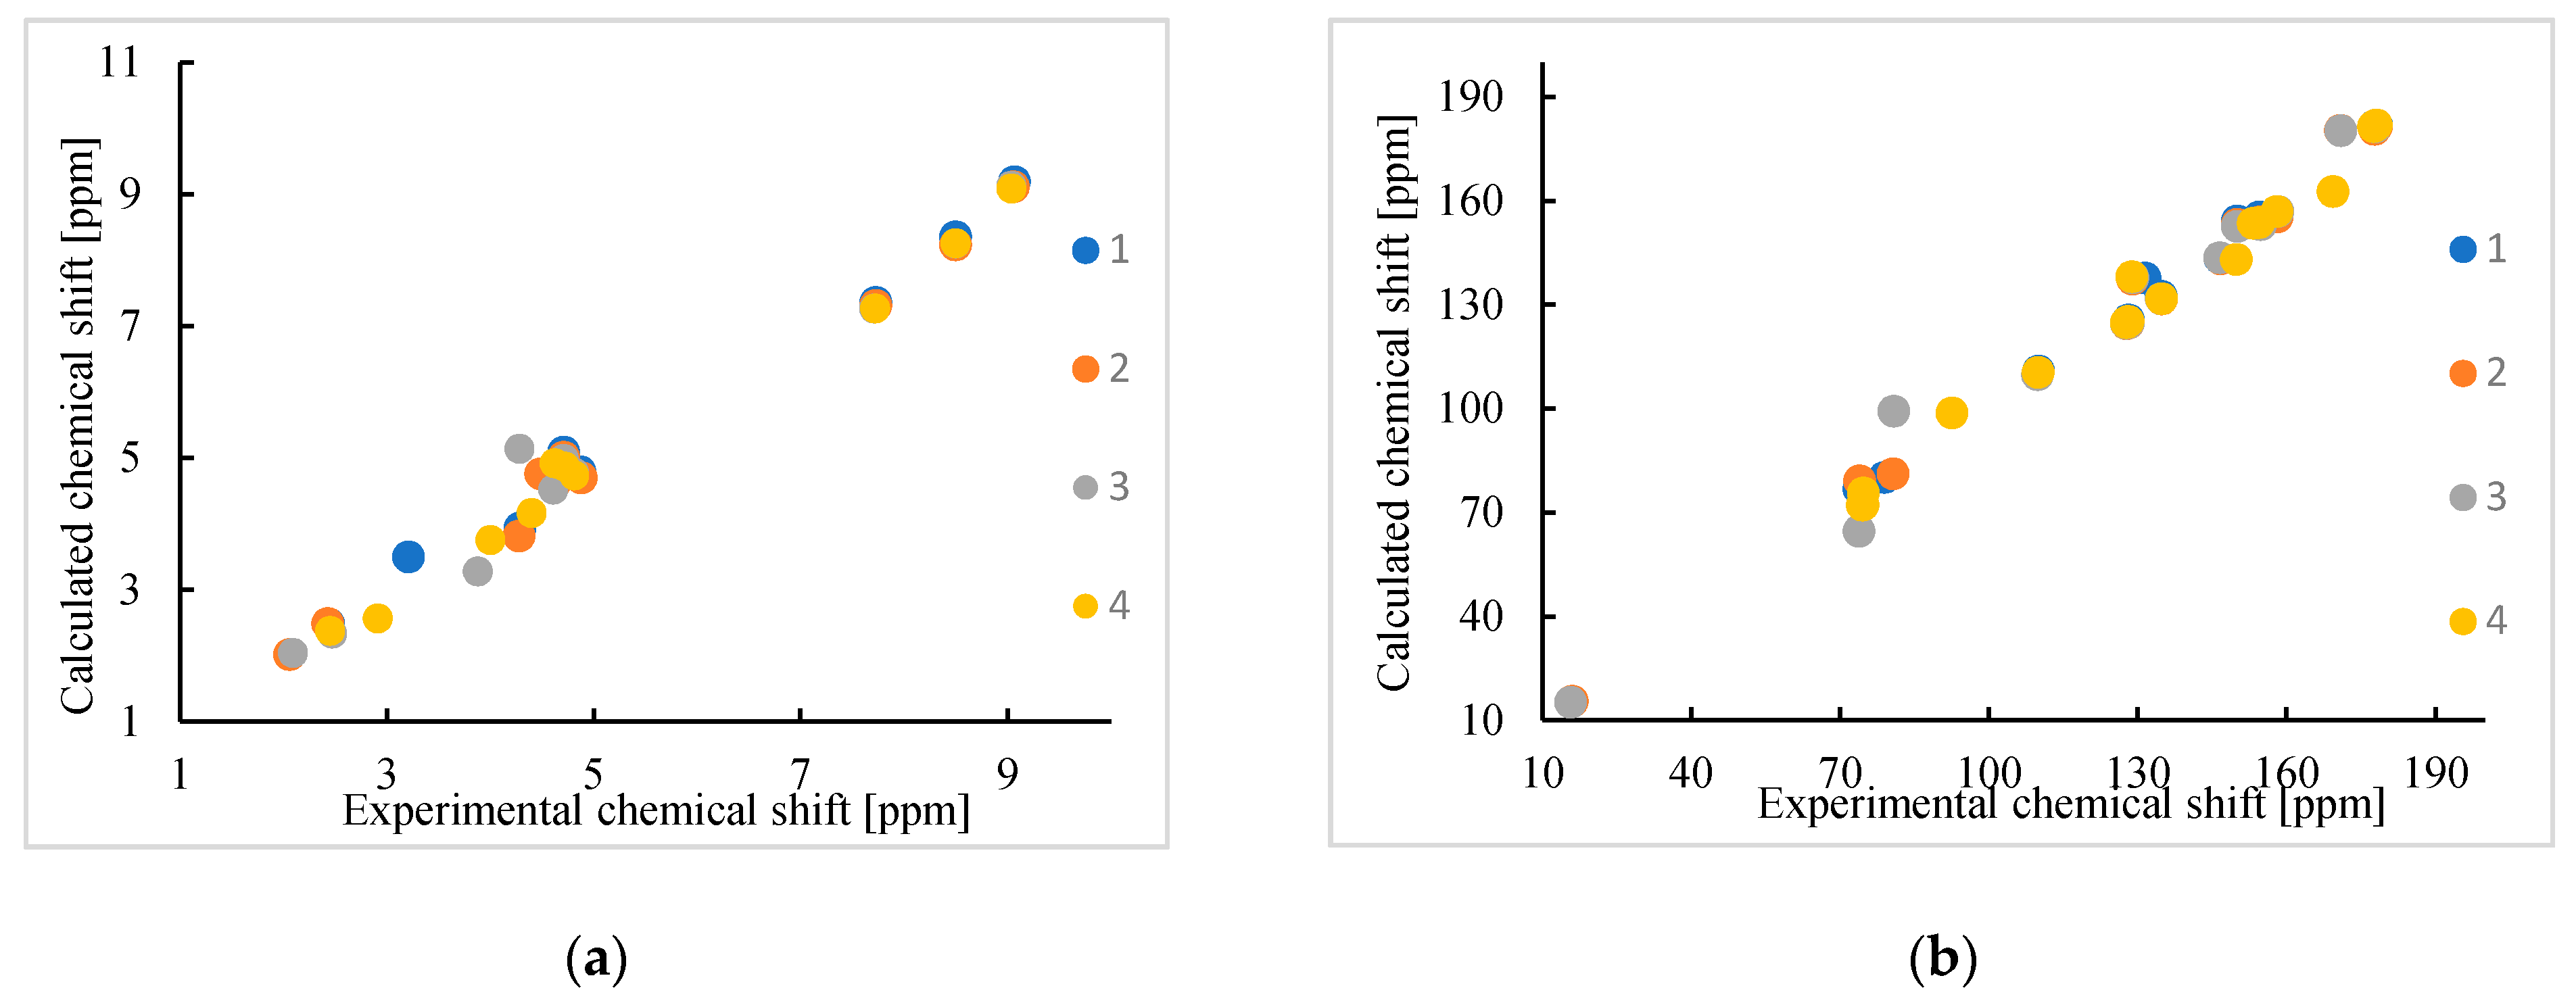
3.3. 1H and 13C NMR Study
3.4. Frontier Molecular Orbitals
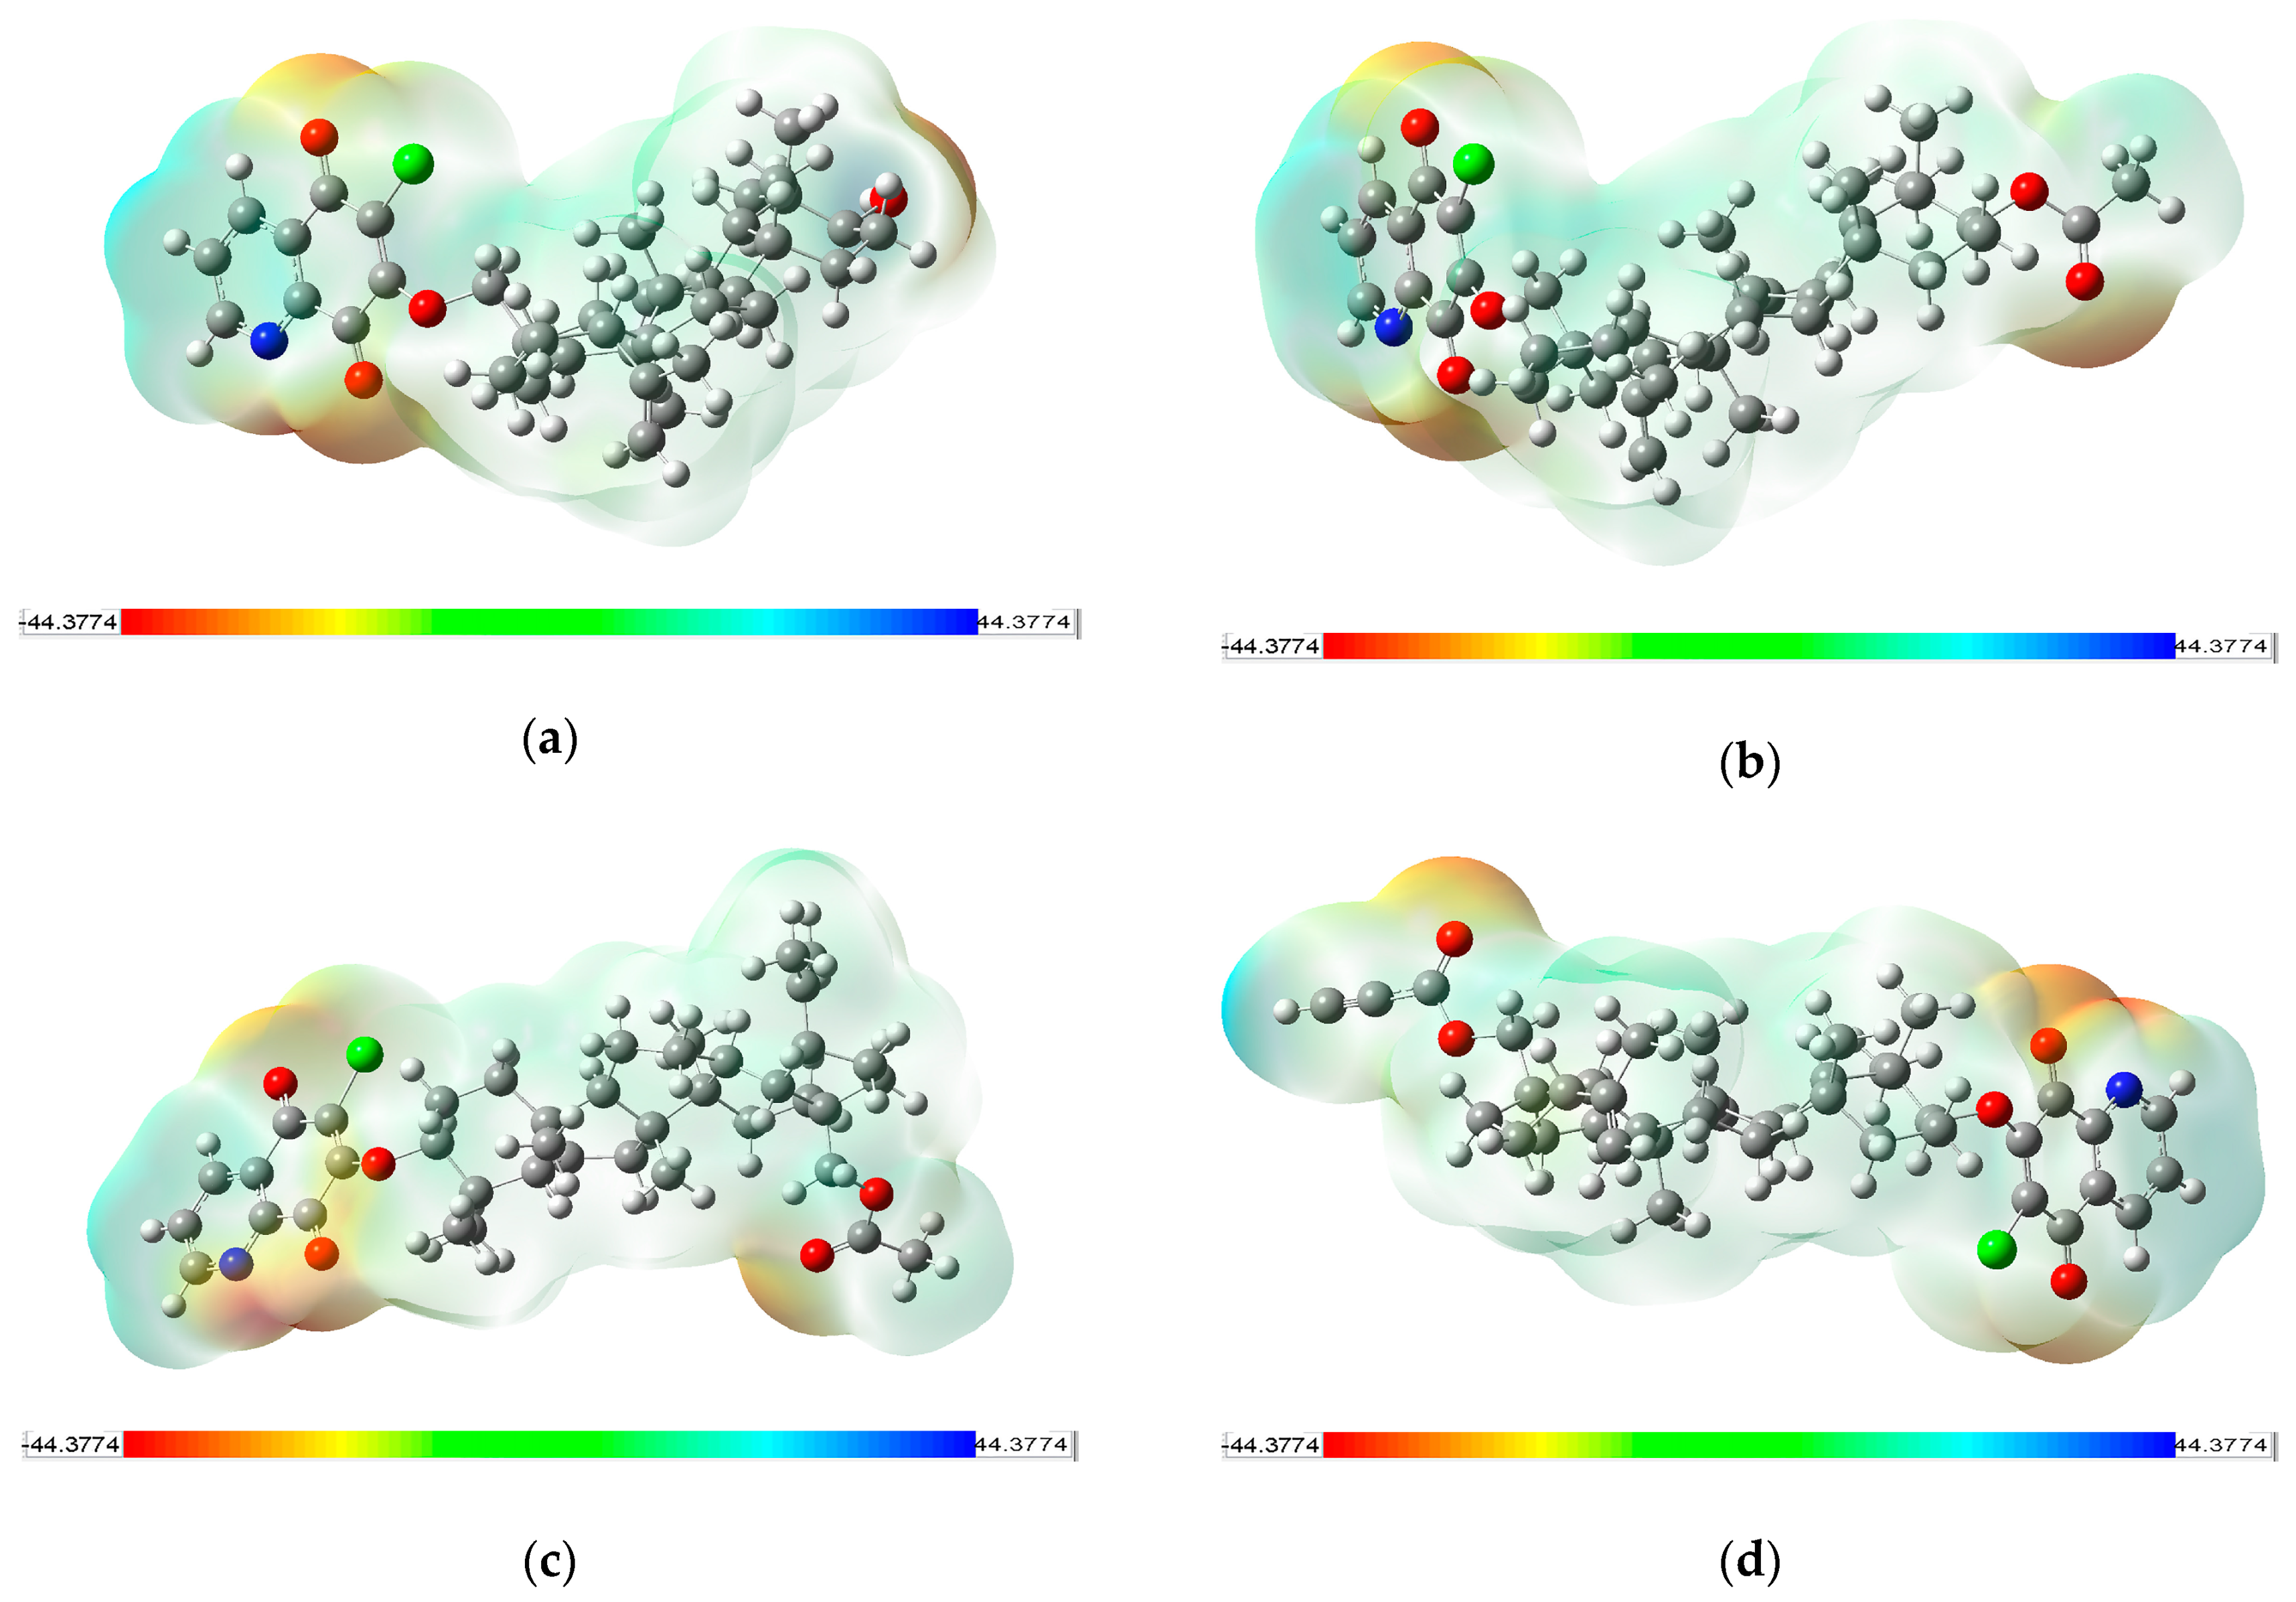
3.5. Molecular Electrostatic Potential
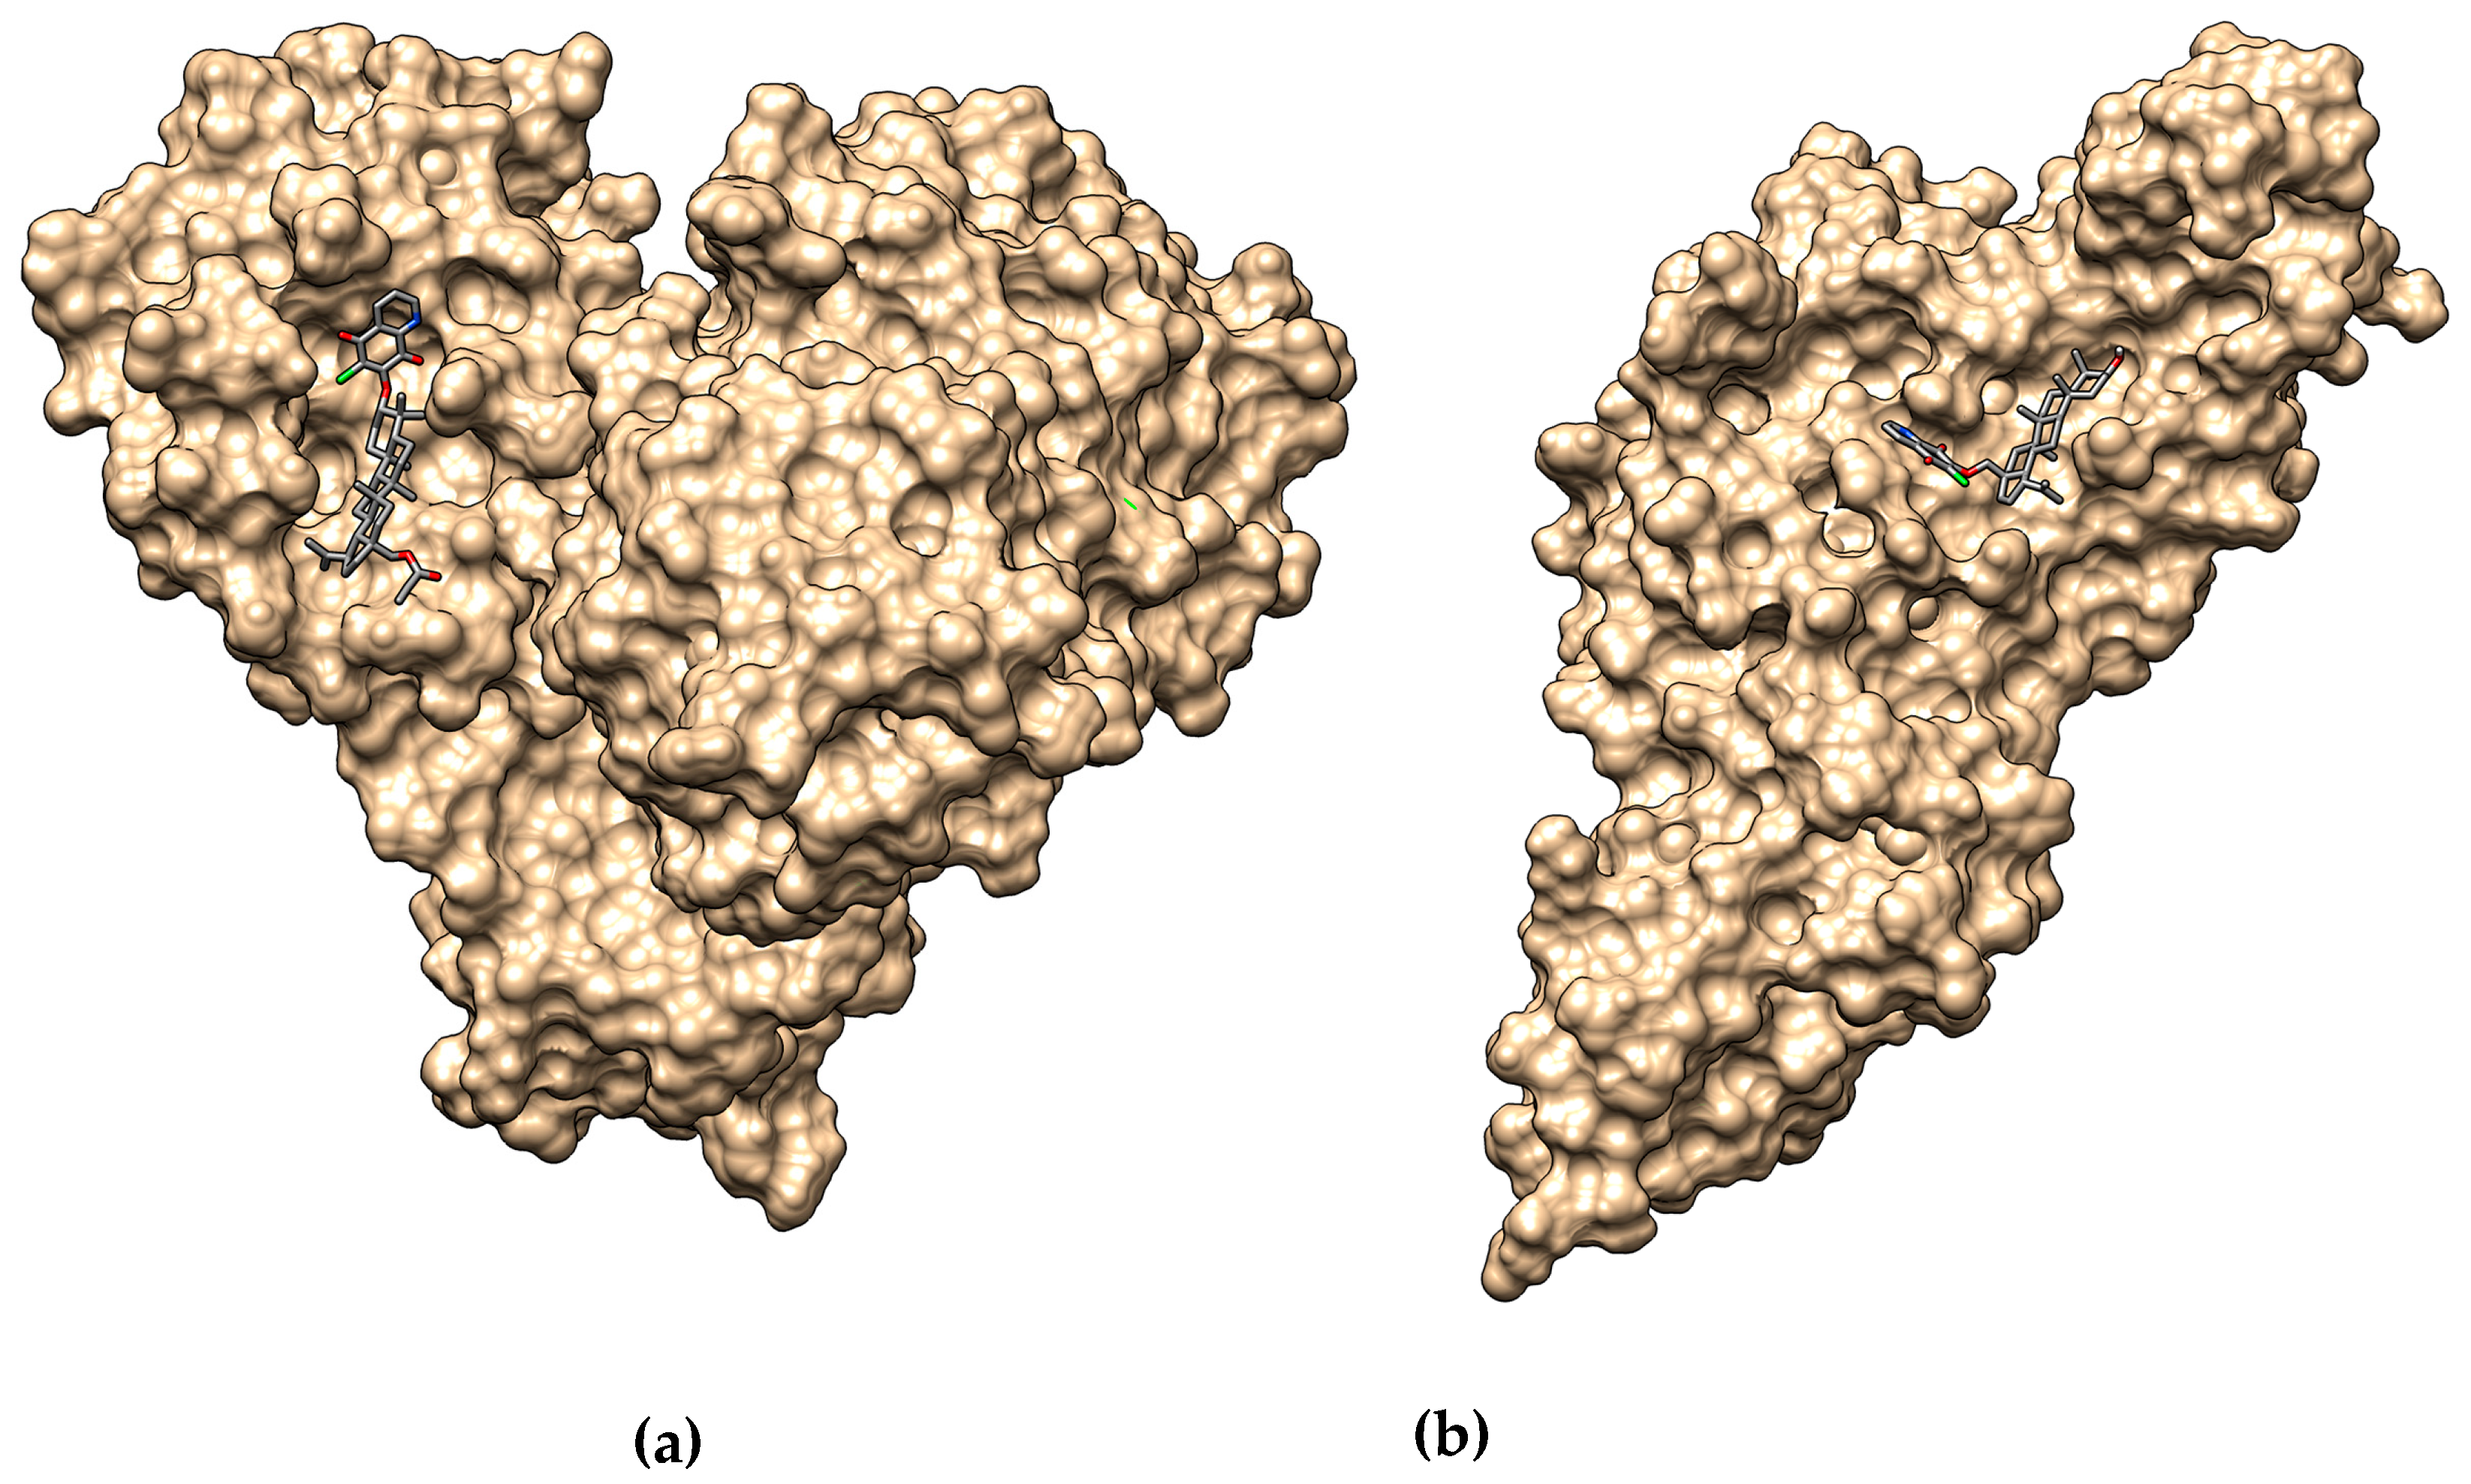
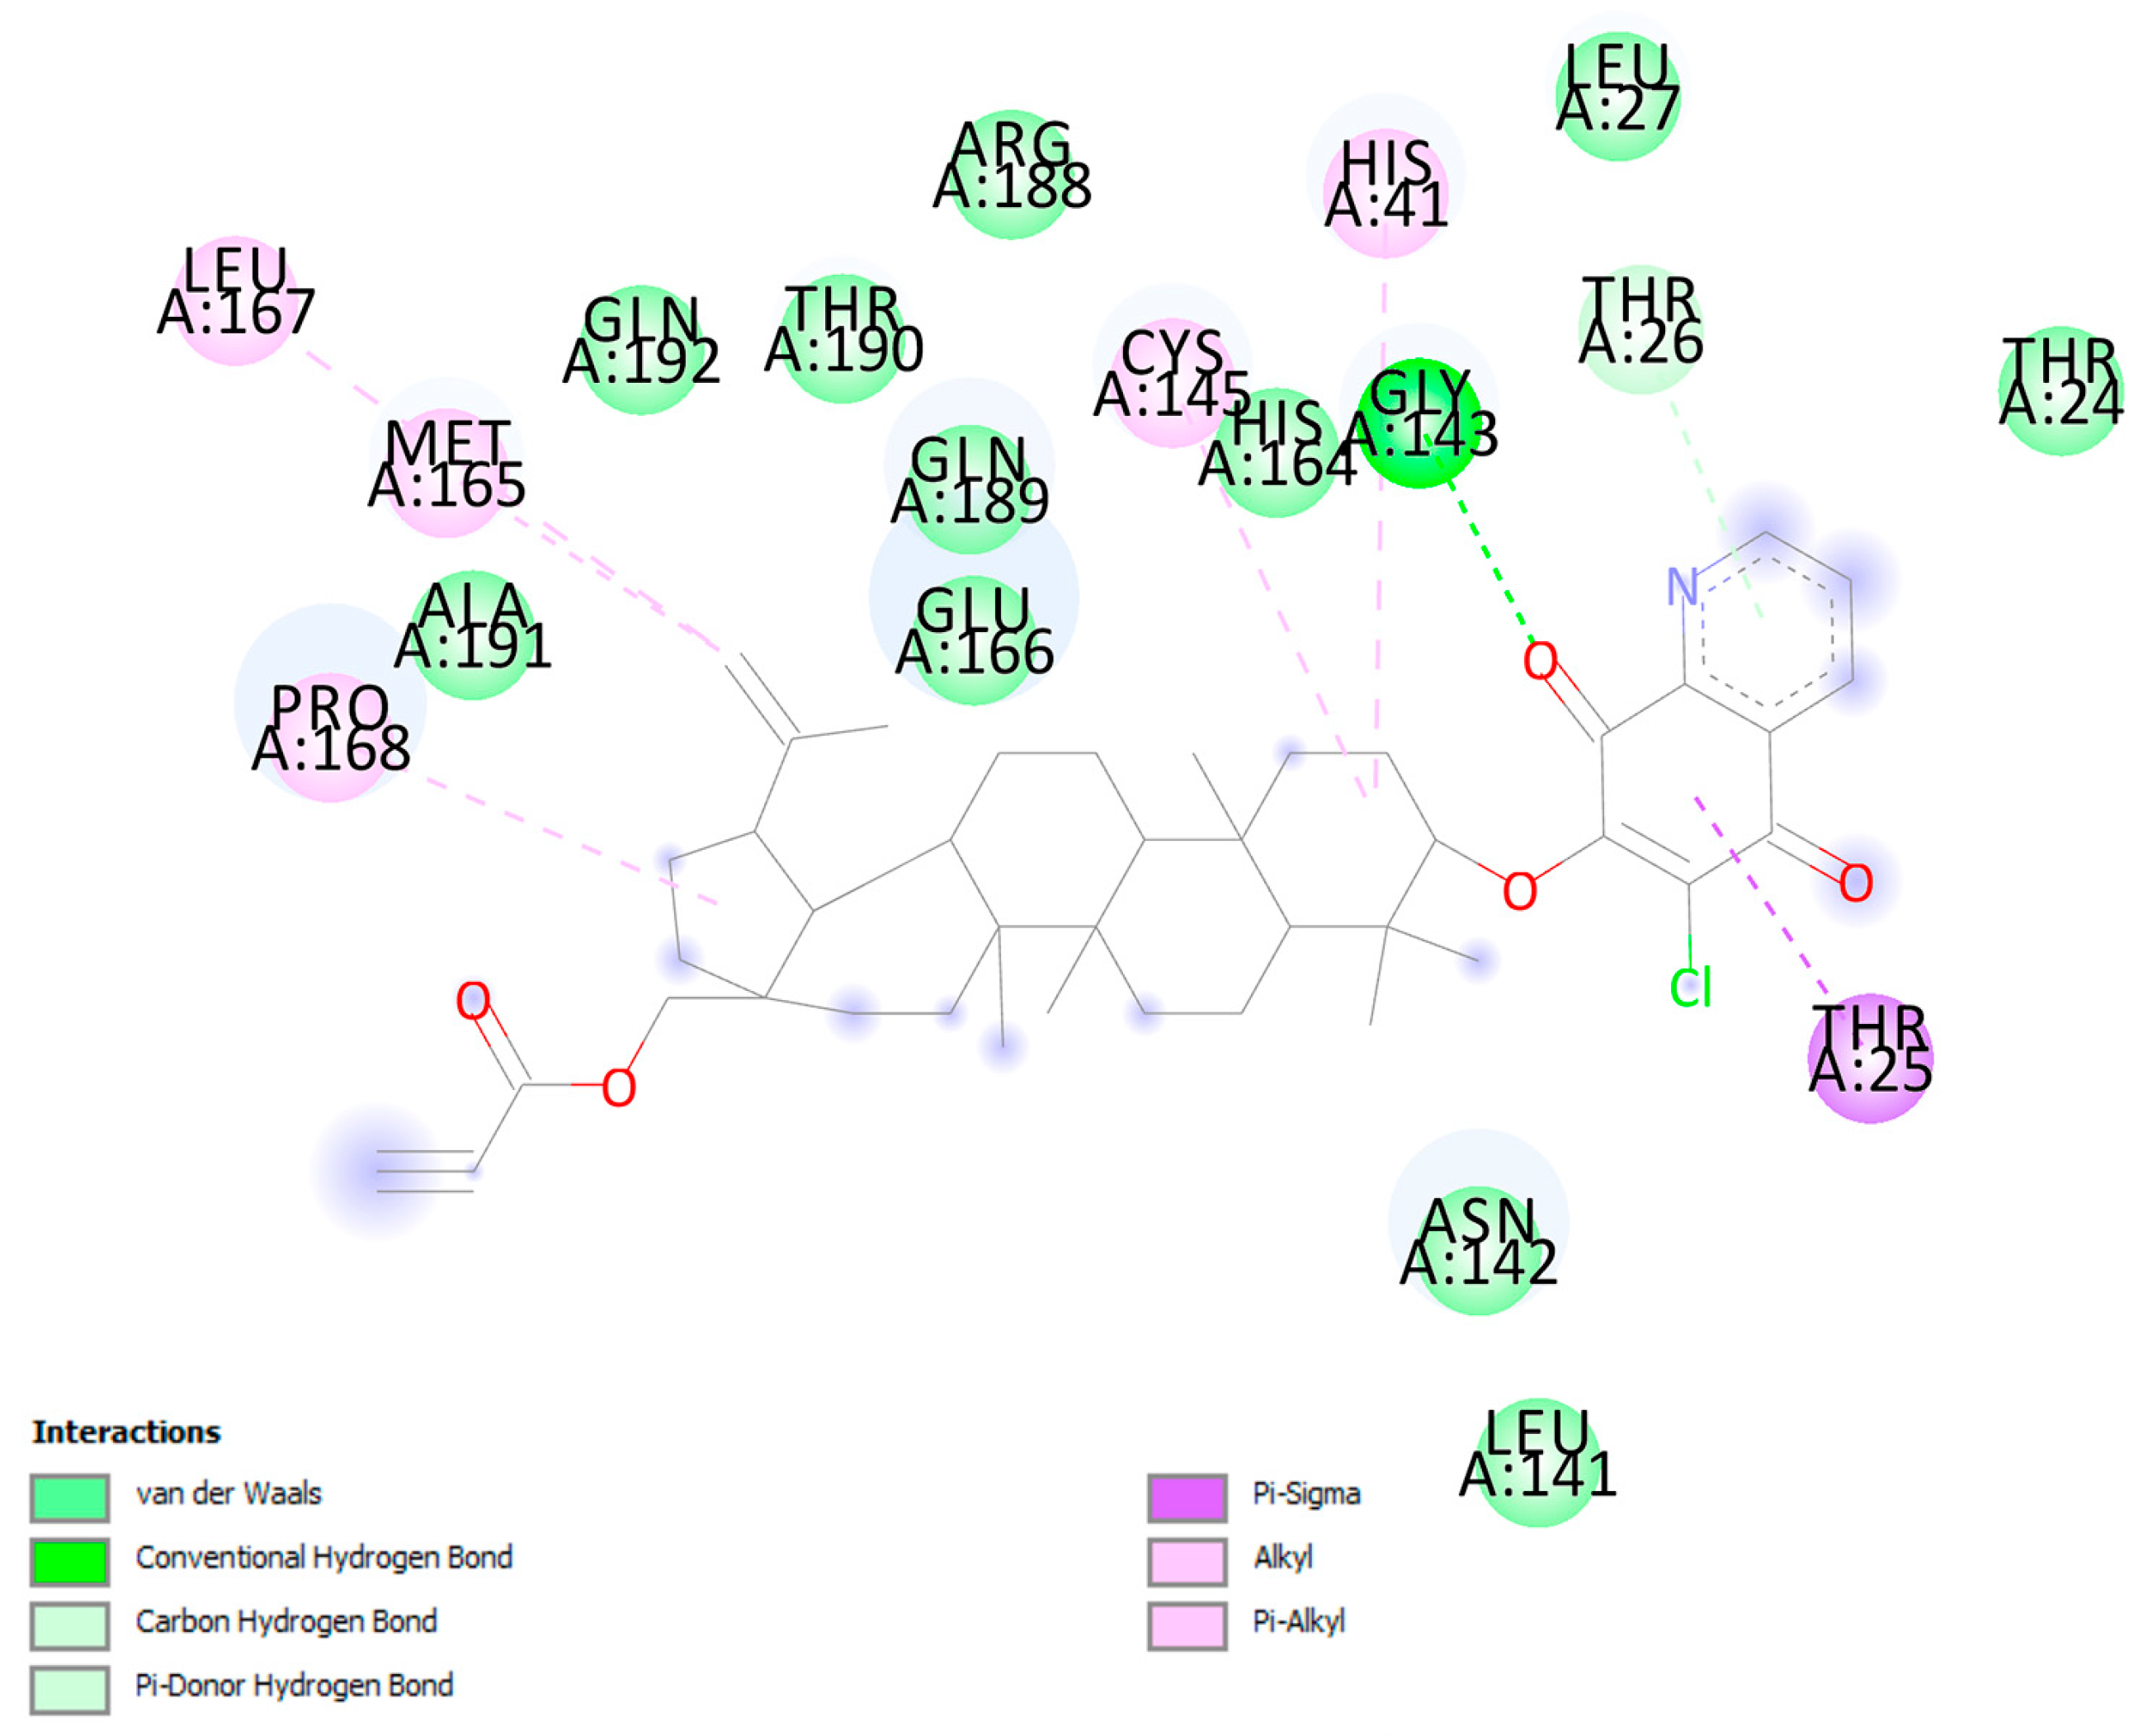
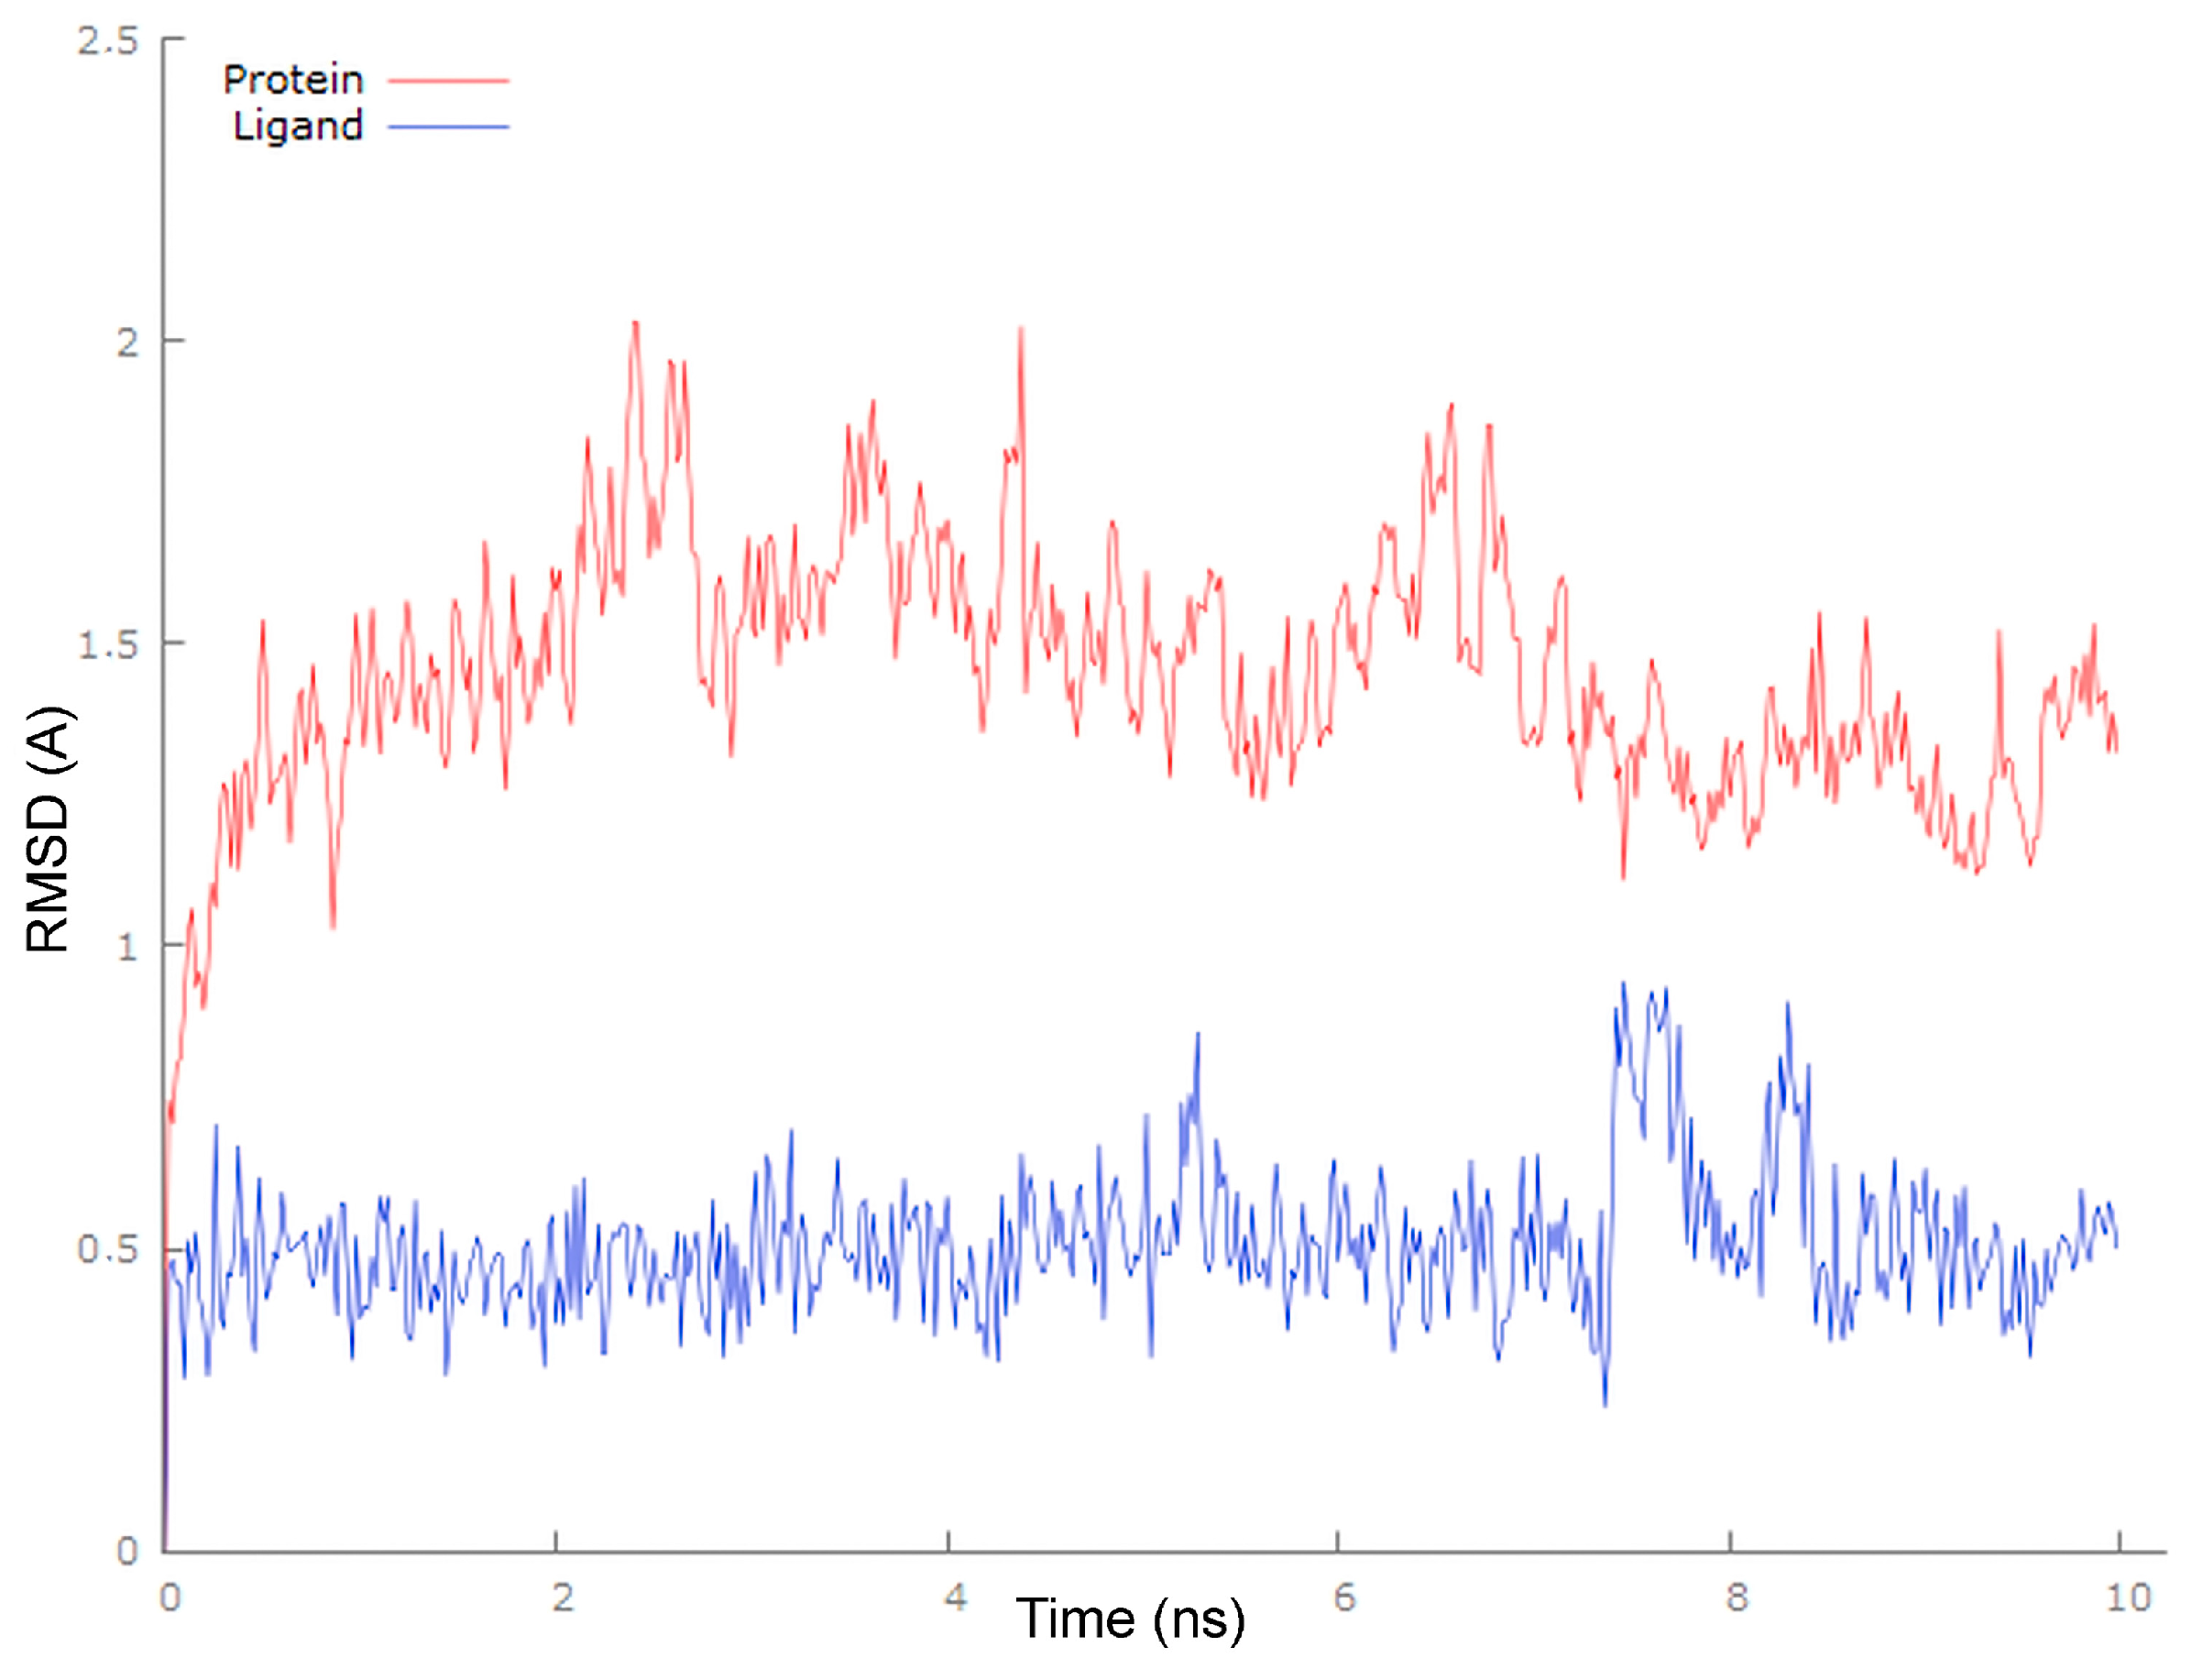
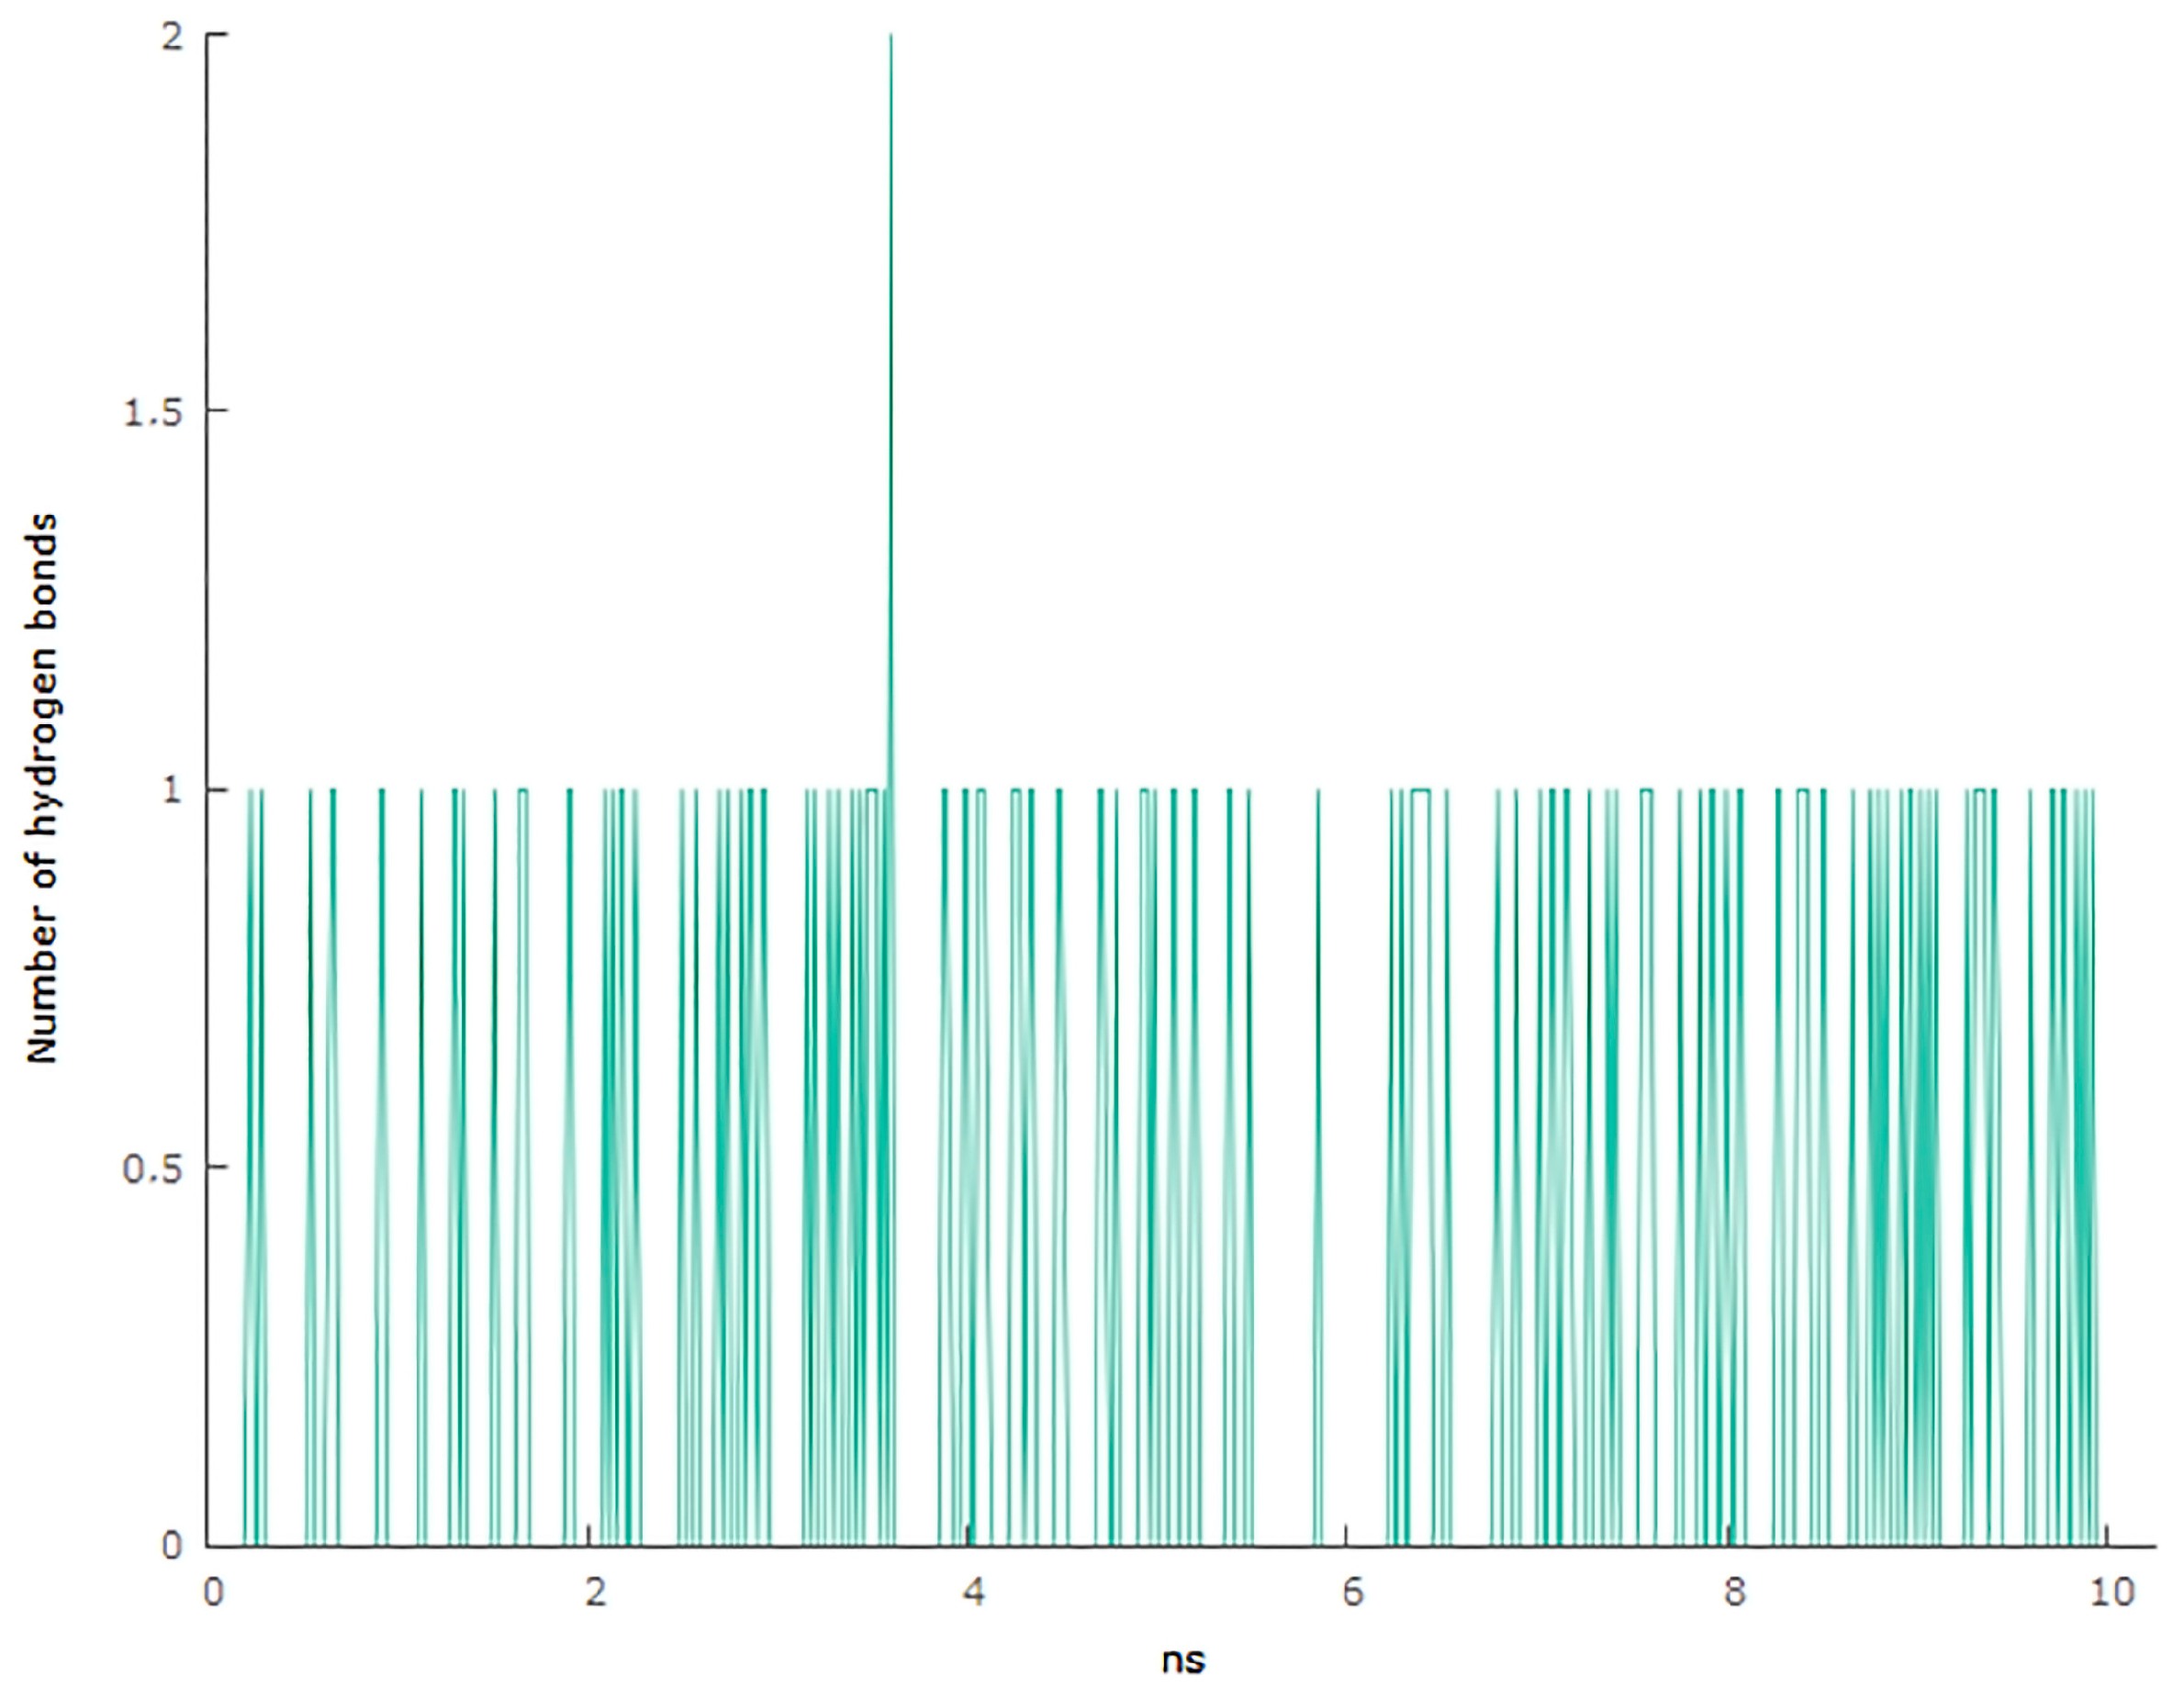
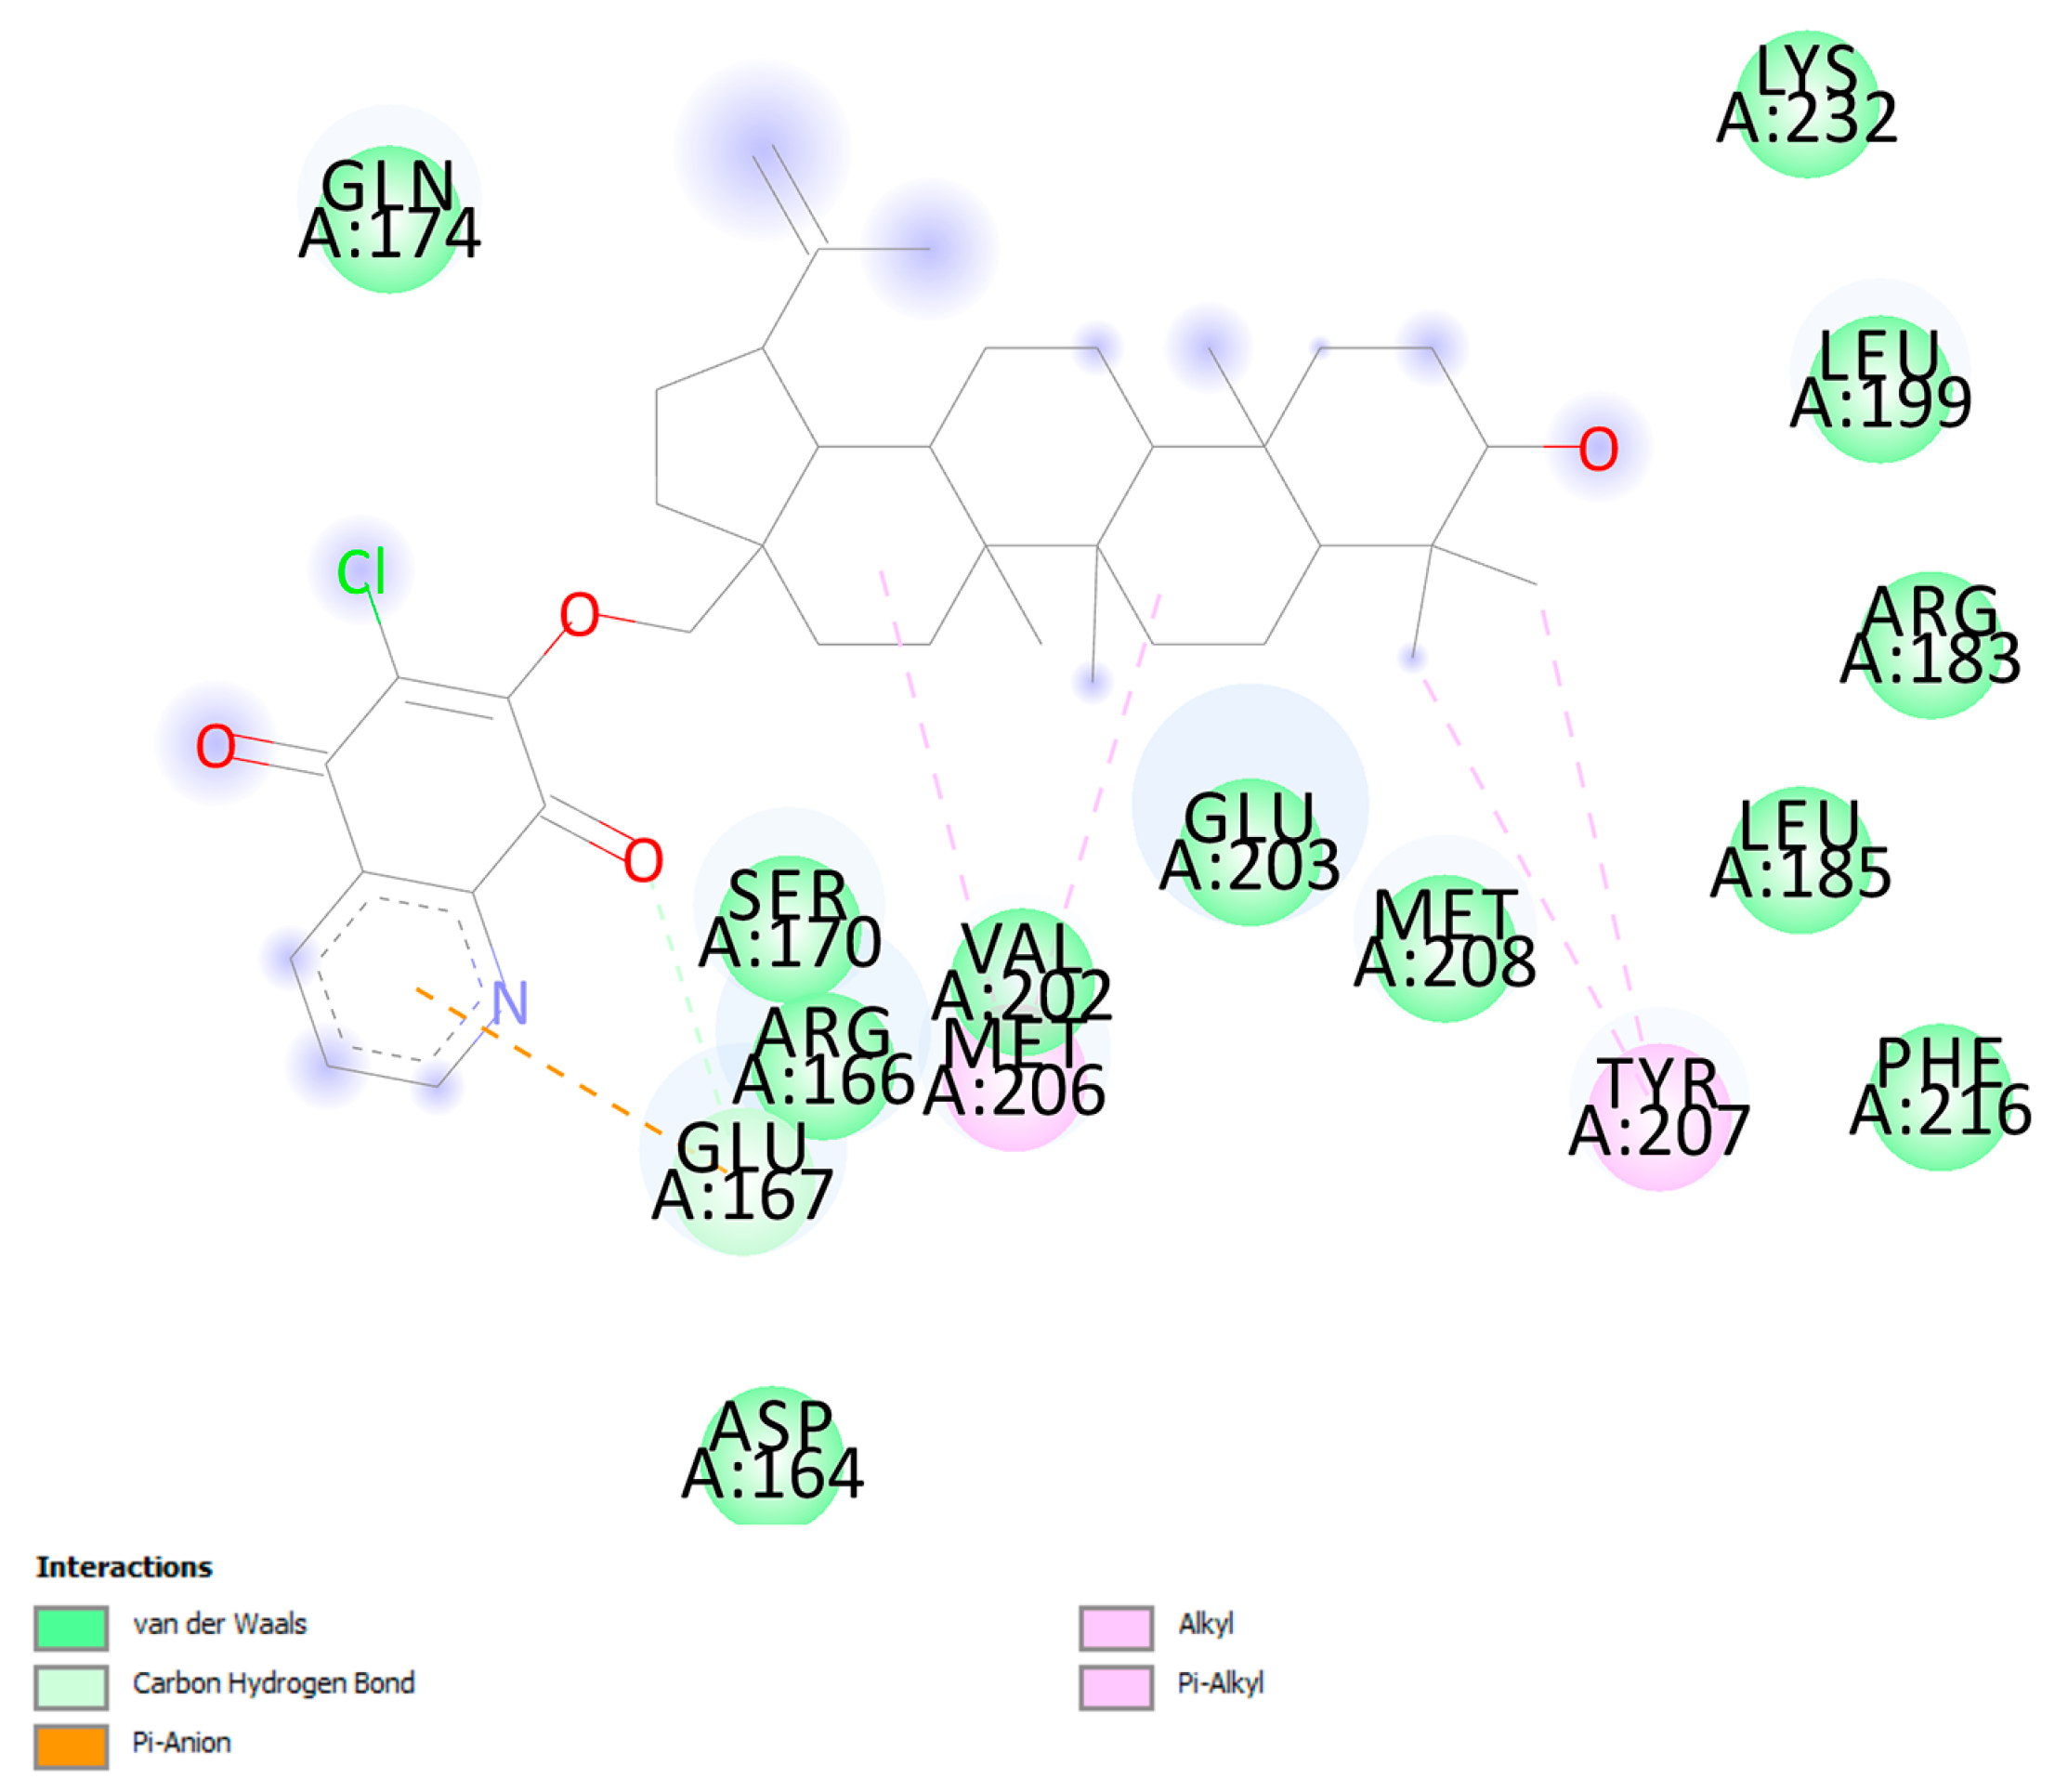
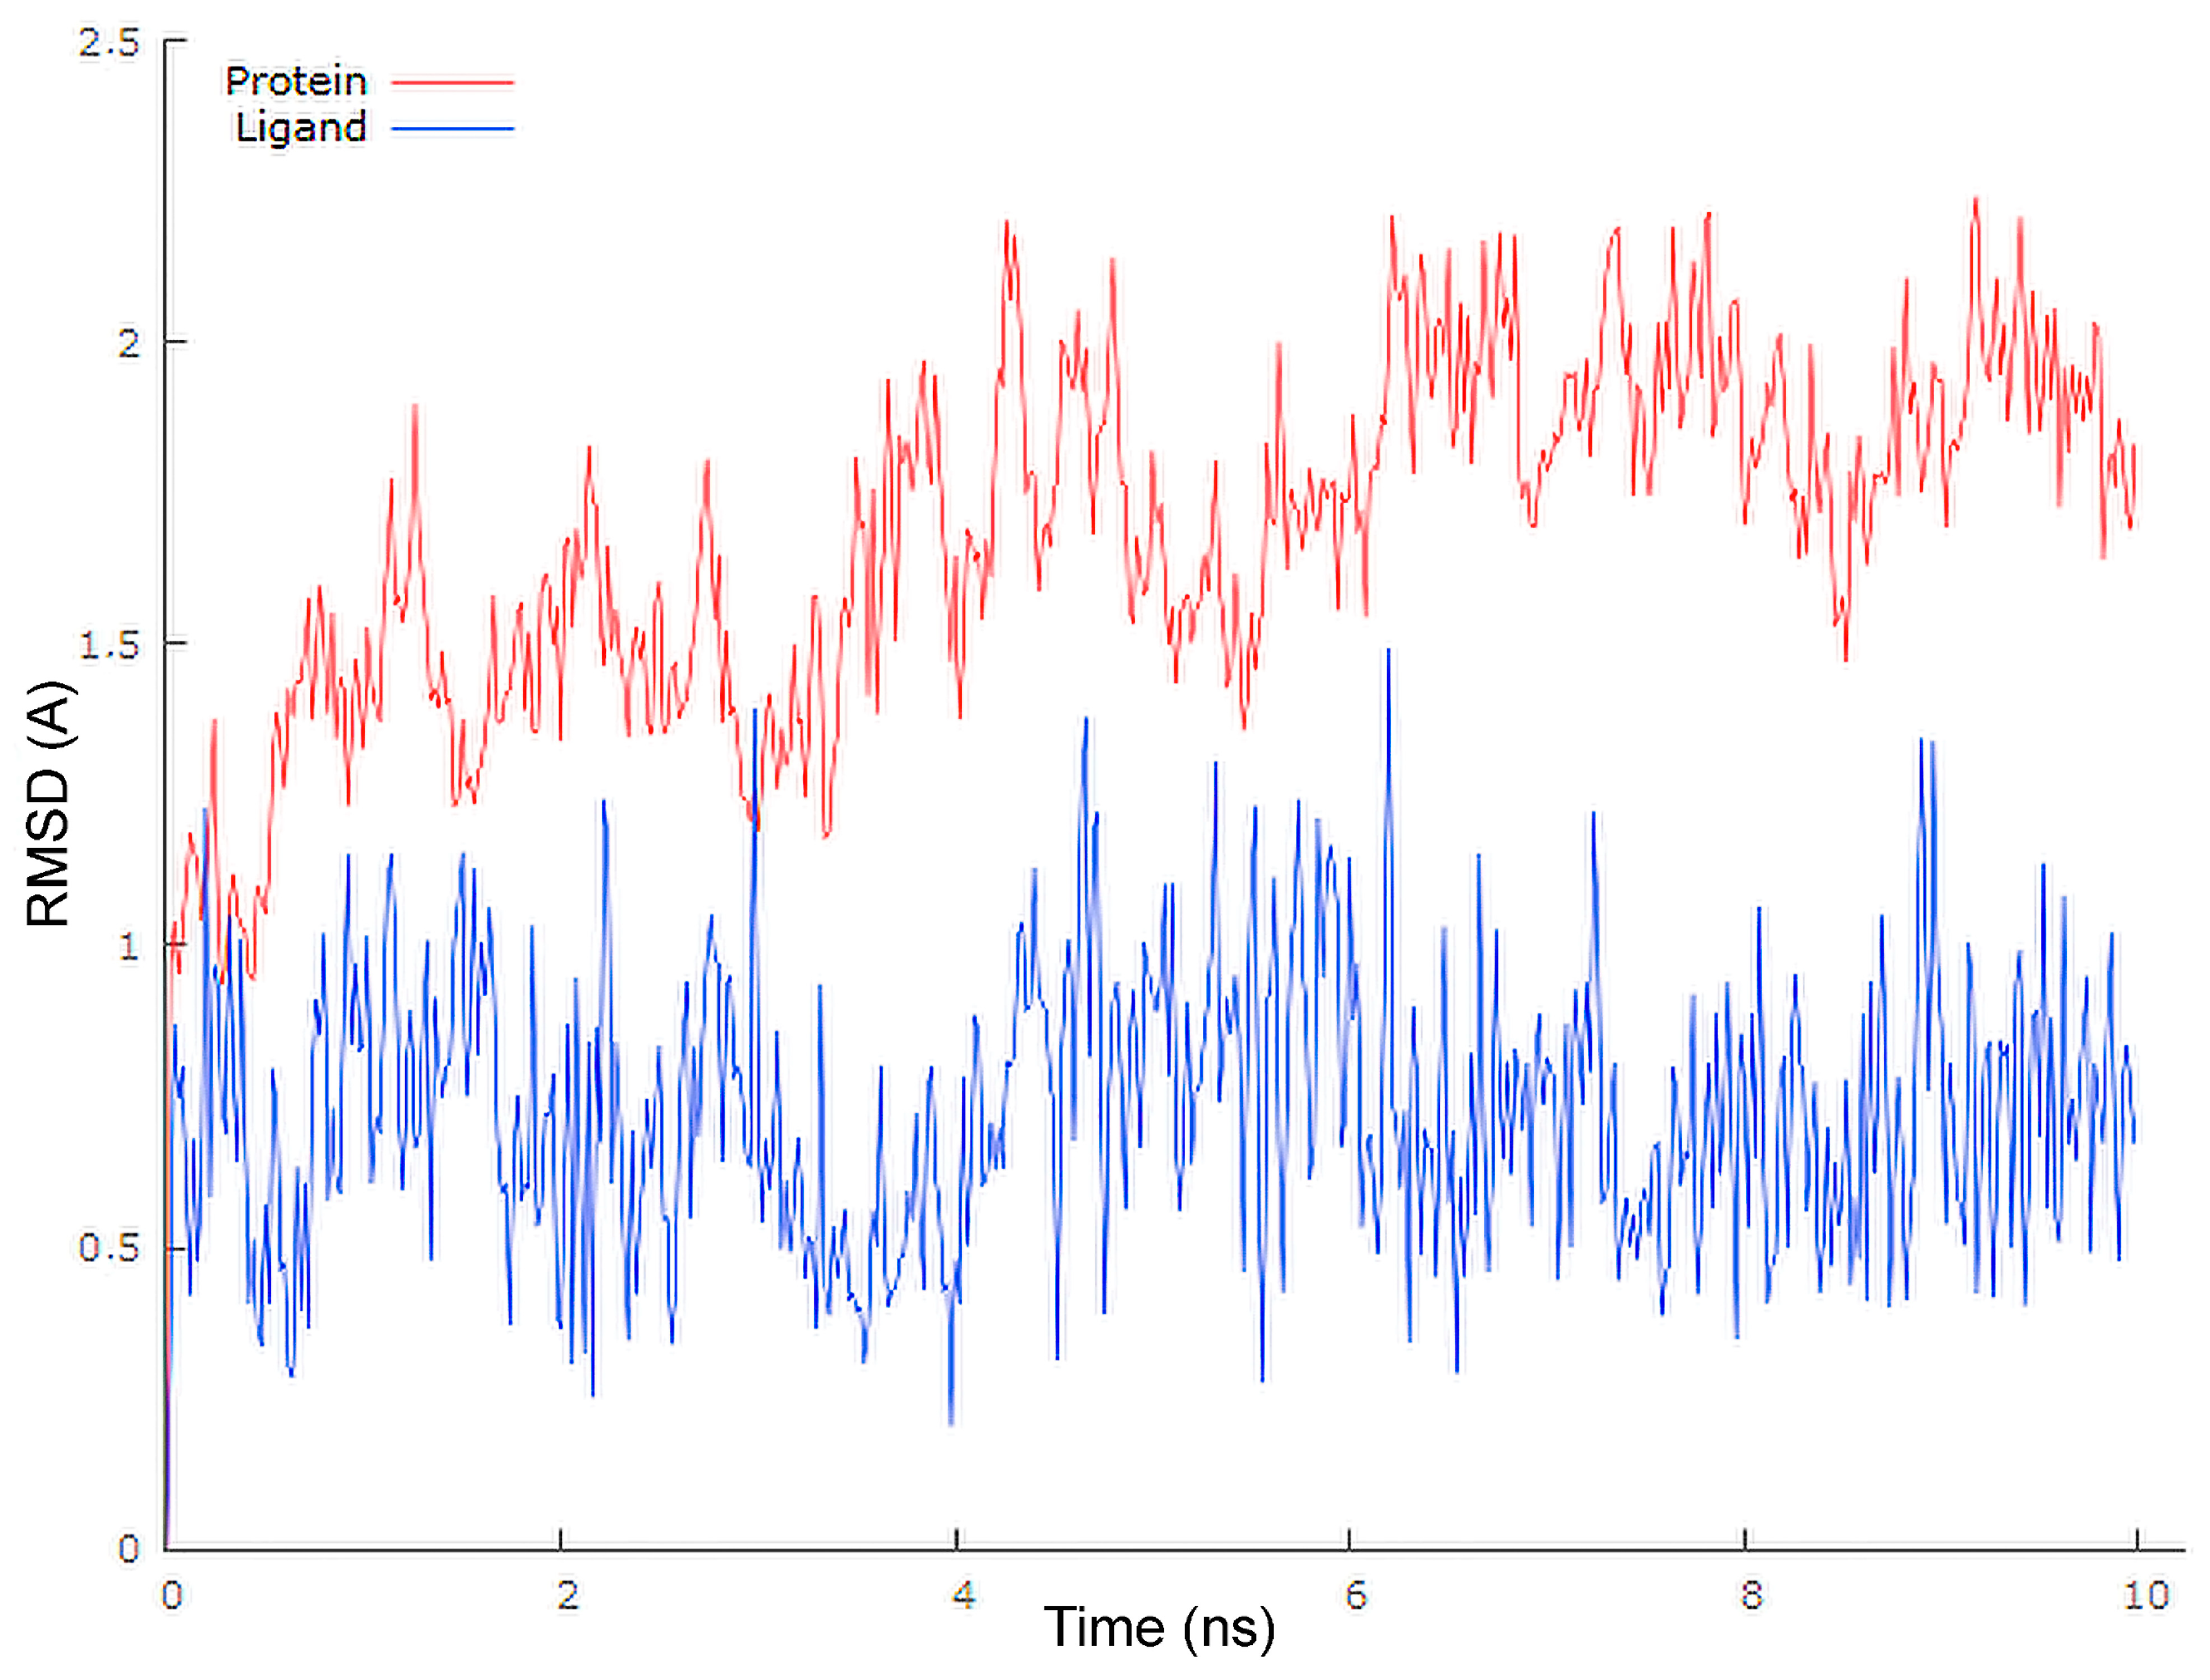
3.6. Molecular Docking
4. Conclusions
Supplementary Materials
Author Contributions
Funding
Institutional Review Board Statement
Informed Consent Statement
Data Availability Statement
Acknowledgments
Conflicts of Interest
References
- Afzal, O.; Kumar, S.; Haider, M.R.; Ali, A.R.; Kumar, R.; Jaggi, M.; Bawa, S. A review on anticancer potential of bioactive heterocycle quinoline. Eur. J. Med. Chem. 2015, 97, 871–910. [Google Scholar] [CrossRef]
- Da Silva Júnior, E.N.; Jardim, G.; Jacob, C.; Dhawa, U.; Ackermann, L.; de Castro, S.L. Synthesis of quinones with highlighted biological applications: A critical update on the strategies towards bioactive compounds with emphasis on lapachones. Eur. J. Med. Chem. 2019, 179, 863–915. [Google Scholar] [CrossRef] [PubMed]
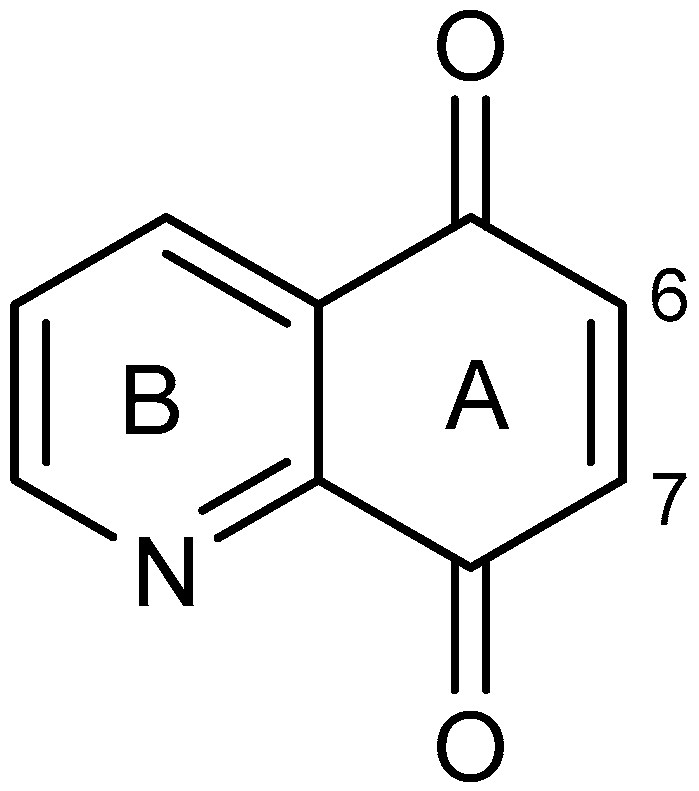
- Kadela-Tomanek, M.; Bębenek, E.; Chrobak, E.; Boryczka, S. 5,8-Quinolinedione scaffold as a promising moiety of bioactive agents. Molecules 2019, 24, 4115. [Google Scholar] [CrossRef] [Green Version]
- Bayrak, N. Novel azanaphtoquinone compounds with aromatic amino moiety:Synthesis, structural characterization, and antimicrobial features. J. Mol. Struct. 2019, 1195, 411–416. [Google Scholar] [CrossRef]
- Bolzán, A.; Bianchi, M. Genotoxicity of streptonigrin: A review. Mutat. Res. 2001, 488, 25–37. [Google Scholar] [CrossRef]
- Boger, D.; Yasuda, M.; Mitscher, L.; Drake, S.; Kitos, P.; Thompson, S. Streptonigrin and lavendamycin partial structures. Probes for the minimum, potent pharmacophore of streptonigrin, lavendamycin, and synthetic quinoline-5,8-diones. J. Med. Chem. 1987, 30, 1918–1928. [Google Scholar] [CrossRef]
- Kadela-Tomanek, M.; Jastrzębska, M.; Bębenek, E.; Chrobak, E.; Latocha, M.; Kusz, J.; Tarnawska, D.; Boryczka, S. New acetylenic amine derivatives of 5,8-quinolinediones: Synthesis, crystal structure and antiproliferative activity. Crystals 2017, 7, 15. [Google Scholar] [CrossRef] [Green Version]
- Kadela-Tomanek, M.; Jastrzebska, M.; Pawełczak, B.; Bębenek, E.; Chrobak, E.; Latocha, M.; Ksiazek, M.; Kusz, J.; Boryczka, S. Alkynyloxy derivatives of 5,8-quinolinedione: Synthesis, in vitro cytotoxicity studies and computational molecular modeling with NAD(P)H:Quinone oxidoreductase 1. Eur. J. Med. Chem. 2017, 126, 969–982. [Google Scholar] [CrossRef]
- Rhee, H.; Park, H.; Lee, S.; Lee, C.; Choo, H. Synthesis, cytotoxicity, and DNA topoisomerase II inhibitory activity of benzofuroquinolinediones. Bioorg. Med. Chem. 2007, 15, 1651–1658. [Google Scholar] [CrossRef] [PubMed]
- Lee, D.; Ko, J.; Lee, K. Cesium carbonate-mediated reaction of dichloronaphthoquinone derivatives with O-nucleofpiles. Monatsh. Chem. 2007, 138, 741–746. [Google Scholar] [CrossRef]
- Yoon, E.; Choi, H.; Shin, K.; Yoo, K.; Chi, D.; Kim, D. The regioselectivity in the reaction of 6,7-dihaloquinoline-5,8-diones with amine nucleophiles in various solvents. Tetrahedron Lett. 2000, 41, 7475–7480. [Google Scholar] [CrossRef]
- Jastrzębska, M.; Boryczka, S.; Kadela, M.; Wrzalik, R.; Kusz, J.; Nowak, M. Synthesis, crystal structure and infrared spectra of new 6- and 7-propylamine-5,8-quinolinedione. J. Mol. Struct. 2014, 1067, 160–168. [Google Scholar] [CrossRef]
- Kadela-Tomanek, M.; Jastrzębska, M.; Chrobak, E.; Bębenek, E.; Latocha, M.; Kusz, J.; Boryczka, S. Structural and spectral characterisation of 2-amino-2H-[1,2,3]triazolo[4,5-g]quinoline-4,9-dione polymorphs. Cytotoxic activity and moleculardocking study with NQO1 enzyme. Spectrochim. Acta A Mol. Biomol. Spectrosc. 2020, 230, 118038–118050. [Google Scholar] [CrossRef]
- Chang, C.; Jeyachandran, S.; Hu, N.J.; Liu, C.; Lin, S.Y.; Wang, Y.; Changd, J.; Hou, M. Structure-based virtual screening and experimental validation of the discovery of inhibitors targeted towards the human coronavirus nucleocapsid protein. Mol. Biosyst. 2016, 12, 59–66. [Google Scholar] [CrossRef]
- Coronavirus Disease 2019 (COVID-19) Situation Report. Available online: https://www.who.int/emergencies/diseases/novel-coronavirus-2019/situation-reports (accessed on 14 November 2020).
- Lee, P.; Hsueh, P. Emerging threats from zoonotic coronaviruses-from SARS and MERS to 2019-nCoV. J. Microbiol. Immunol. Infect. 2020, 53, 365–367. [Google Scholar] [CrossRef] [PubMed]
- Holshue, M.L.; DeBolt, C.; Lindquist, S.; Lofy, K.H.; Wiesman, J.; Bruce, H.; Spitters, C.; Ericson, K.; Wilkerson, S.; The Washington State 2019-nCoV Case Investigation Team; et al. First case of 2019 novel coronavirus in the United States. N. Engl. J. Med. 2020, 382, 929–936. [Google Scholar] [CrossRef]
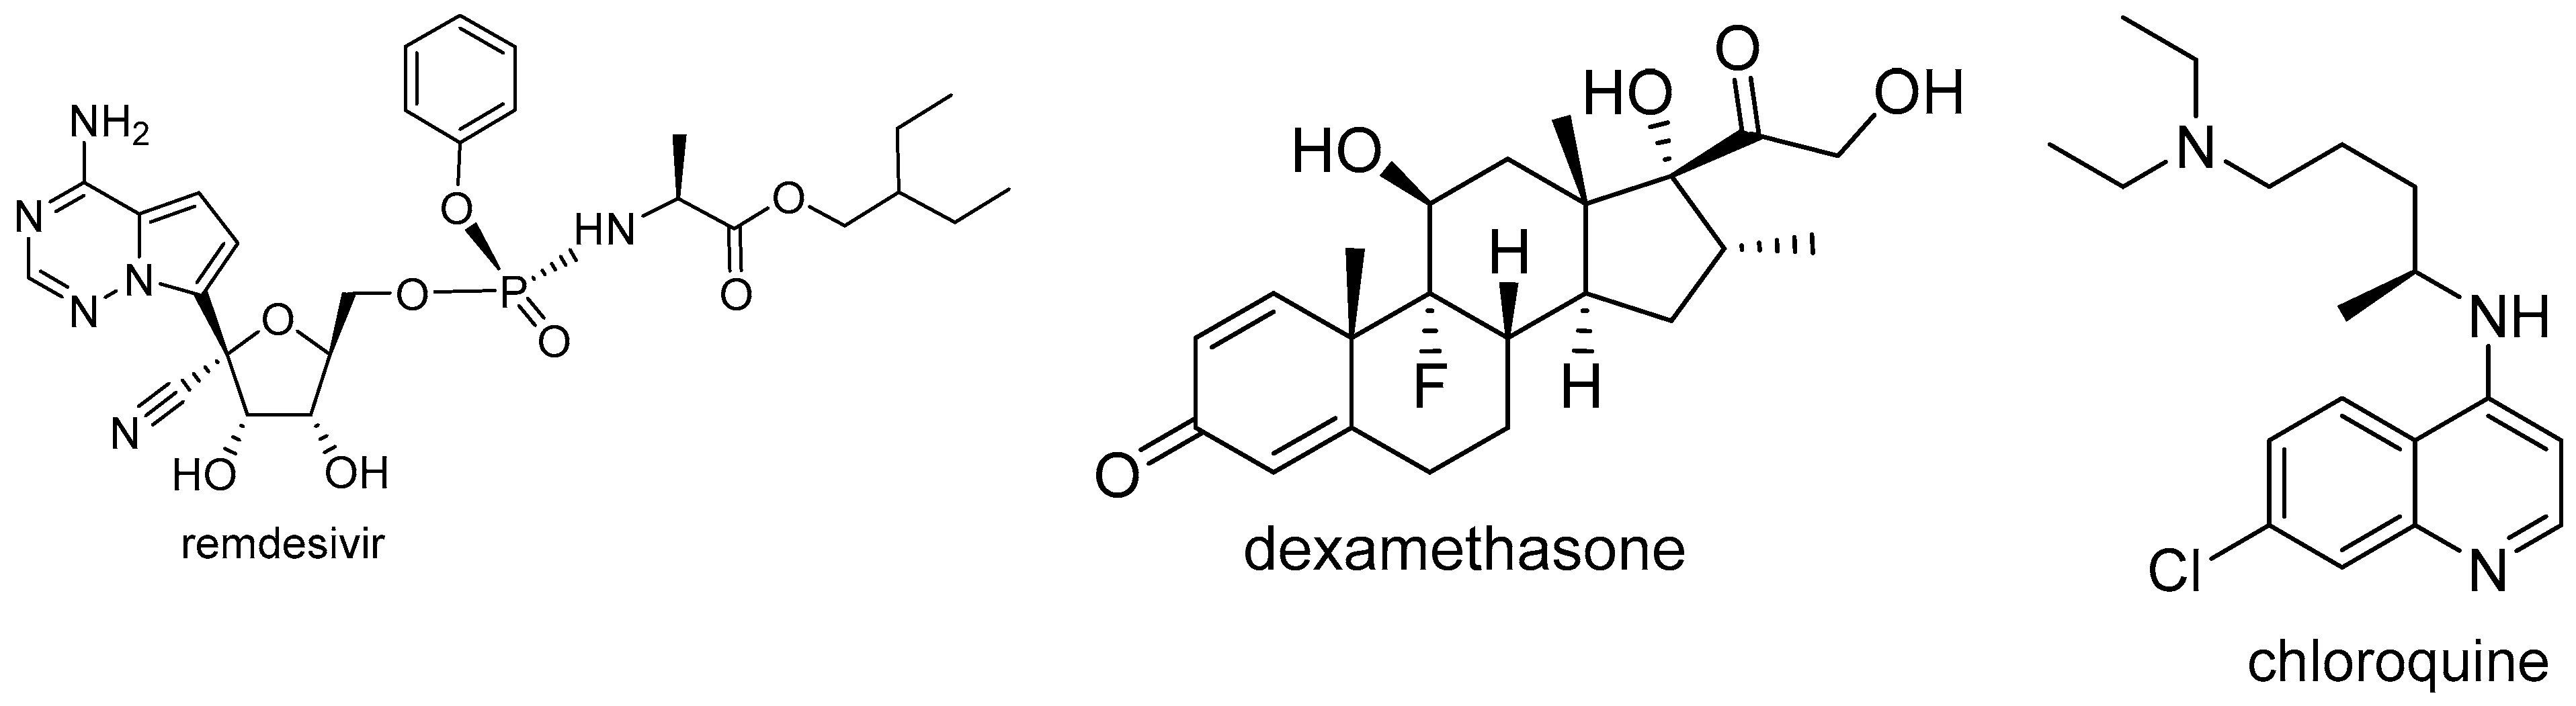
- The RECOVERY Collaborative Group. Dexamethasone in hospitalized patients with Covid-19—Preliminary report. N. Engl. J. Med. 2020, 202, 1436–1447. [Google Scholar] [CrossRef]
- Touret, F.; Lamballerie, X. Of chloroquine and COVID-19. Antiviral Res. 2020, 177, 104762–104763. [Google Scholar] [CrossRef]
- Gao, J.; Tian, Z.; Yang, X. Breakthrough: Chloroquine phosphate has shown apparent efficacy in treatment of COVID-19 associated pneumonia in clinical studies. Biosci. Trends 2020, 14, 72–73. [Google Scholar] [CrossRef] [Green Version]
- Wang, M.; Cao, R.; Zhang, L.; Yang, X.; Liu, J.; Xu, M.; Shi, Z.; Hu, Z.; Zhong, W.; Xiao, G. Remdesivir and chloroquine effectively inhibit the recently emerged novel coronavirus (2019-nCoV) in vitro. Cell. Res. 2020, 30, 269–271. [Google Scholar] [CrossRef]
- Colson, P.; Rolain, J.; Raoult, D. Chloroquine for the 2019 novel coronavirus SARS-CoV-2. Int. J. Antimicrob. Agents 2020, 55, 105923–105924. [Google Scholar] [CrossRef] [PubMed]
- Negi, M.; Chawla, P.; Faruk, A.; Chawla, V. Role of heterocyclic compounds in SARS and SARS CoV-2 pandemic. Bioorg. Chem. 2020, 104, 104315–104327. [Google Scholar] [CrossRef] [PubMed]
- Braz, H.; Silveira, J.; Marinho, A.; de Moraes, M.; Filho, M.; Monteiro, H.; Jorge, R. In silico study of azithromycin, chloroquine and hydroxychloroquine and their potential mechanisms of action against SARS-CoV-2 infection. Int. J. Antimicrob. Agents 2020, 56, 106119–106127. [Google Scholar] [CrossRef] [PubMed]
- Zhang, D.; Wu, K.L.; Zhang, X.; Deng, S.; Peng, B. In silico screening of Chinese herbal medicines with the potential to directly inhibit 2019 novel coronavirus. J. Integr. Med. 2020, 18, 152–158. [Google Scholar] [CrossRef] [PubMed]
- Wen, C.; Kuo, Y.; Jan, J.; Liang, P.; Wang, S.; Liu, H.; Lee, C.; Chang, S.; Kuo, C.; Lee, S.; et al. Specific plant terpenoids and lignoids possess potent antiviral activities against severe acute respiratory syndrome coronavirus. J. Med. Chem. 2007, 50, 4087–4095. [Google Scholar] [CrossRef] [PubMed] [Green Version]
- Kadioglu, O.; Saeed, M.; Johannes, G.; Efferth, T. Identification of novel compounds against three targets of SARS CoV-2 coronavirus by combined virtual screening and supervised machine learning. Bull. World Health Organ. 2020. [Google Scholar] [CrossRef]
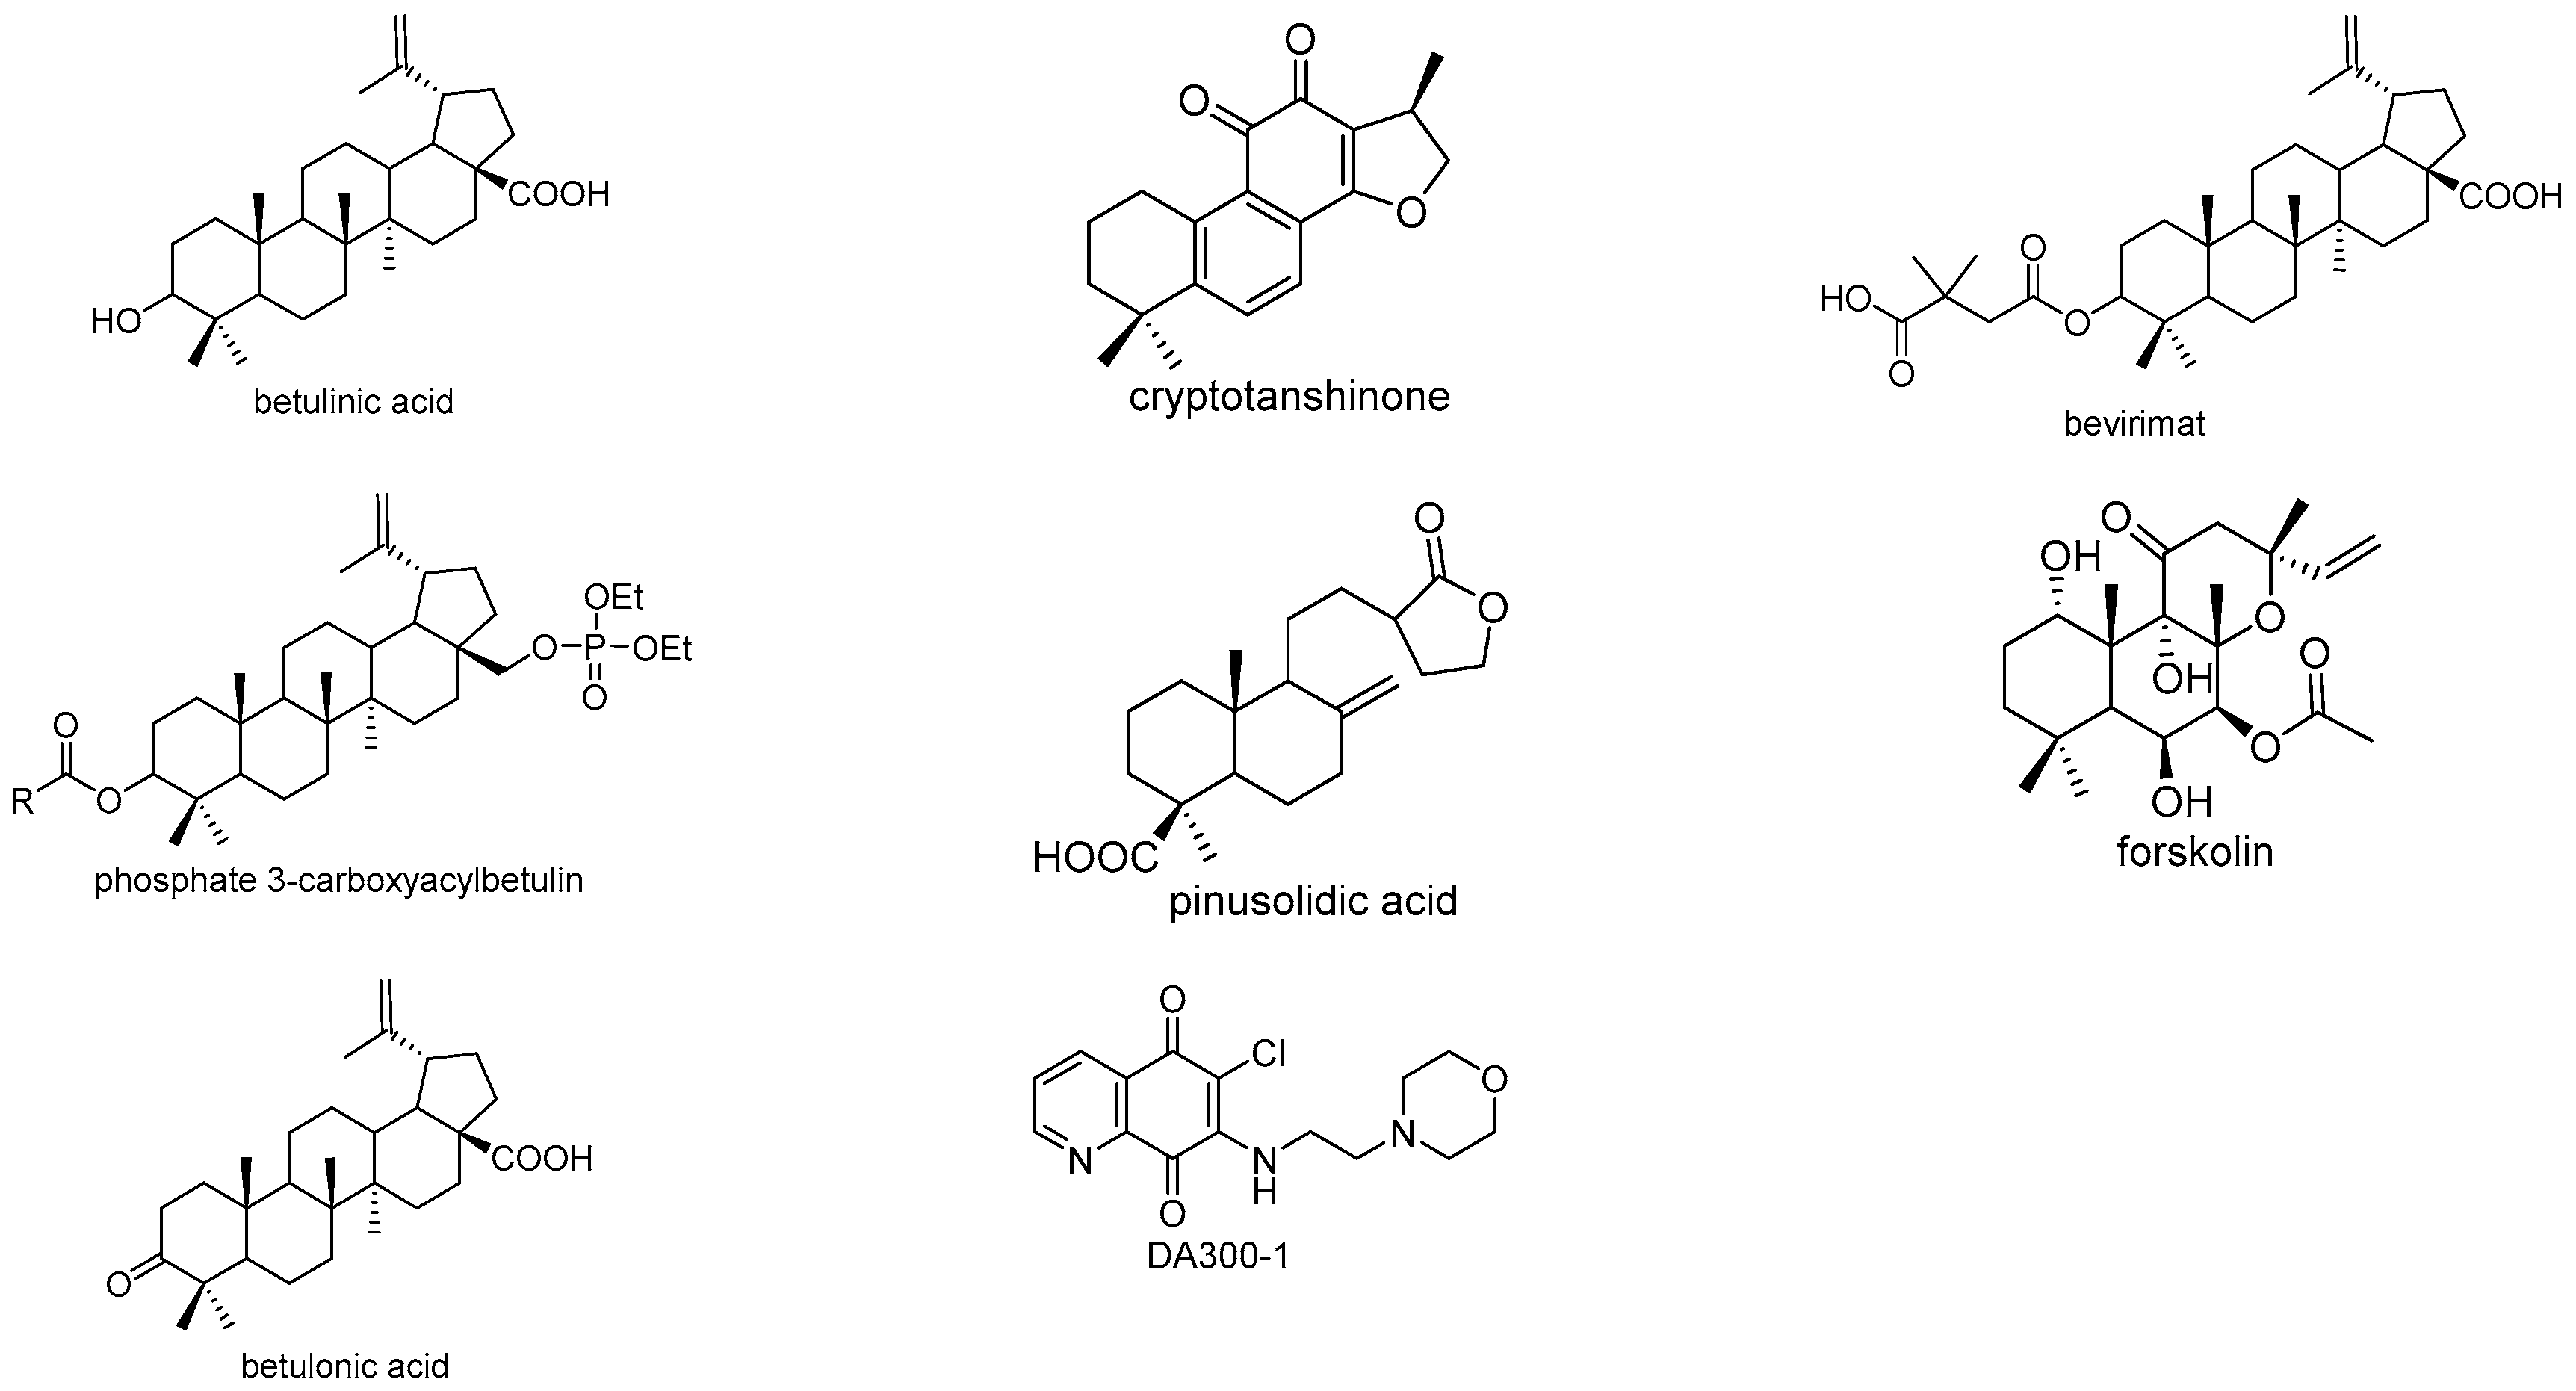
- Marciniec, K.; Chrobak, E.; Dąbrowska, A.; Bębenek, E.; Kadela-Tomanek, M.; Pęcak, P.; Boryczka, S. Phosphate derivatives of 3-carboxyacylbetulin: Synthesis, in vitro anti-HIV and molecular docking study. Biomoleclues 2020, 10, 1148. [Google Scholar] [CrossRef]
- Shahinshavali, S.; Hossain, K.A.; Kumar, A.; Reddy, A.G.; Kolli, D.; Nakhi, A.; Rao, M.; Pal, M. Ultrasound assisted synthesis of 3-alkynyl substituted 2-chloroquinoxaline derivatives: Their in silico assessment as potential ligands for N-protein of SARS-CoV-2. Tetrahedron Lett. 2020, 61, 152336–152344. [Google Scholar] [CrossRef]
- Kadela-Tomanek, M.; Bębenek, E.; Chrobak, E.; Marciniec, K.; Latocha, M.; Kuśmierz, D.; Jastrzębska, M.; Boryczka, S. Betulin-1,4-quinone hybrids: Synthesis, anticancer activity and molecular docking study with NQO1 enzyme. Eur. J. Med. Chem. 2019, 177, 302–315. [Google Scholar] [CrossRef]
- Frisch, M.J.; Trucks, G.W.; Schlegel, H.B.; Scuseria, G.E.; Robb, M.A.; Cheeseman, J.R.; Scalmani, G.; Barone, V.; Mennucci, B.; Petersson, G.A.; et al. Gaussian 16, Revision A. 03; Gaussian, Inc.: Wallingford, CT, USA, 2016. [Google Scholar]
- Foresman, J.B.; Frisch, A.E. Exploring Chemistry with Electronic Structure Methods: A Guide to USING GAUSSIAN, 3rd ed.; Gaussian, Inc.: Wallingford, CT, USA, 2015. [Google Scholar]
- Wolinski, K.; Hinton, J.; Pulay, P. Efficient implementation of the gauge-independent atomic orbital method for NMR chemical shift calculations. J. Am. Chem. Soc. 1990, 112, 8251–8260. [Google Scholar] [CrossRef]
- Politzer, P.; Laurence, P.; Jayasuriya, K. Molecular electrostatic potentials: An effective tool for the elucidation of biochemical phenomena. Environ. Health Perspect. 1985, 61, 191–202. [Google Scholar] [CrossRef] [PubMed]
- Dennington, R.; Keith, T.; Millam, J. GaussView, Version 5. In Shawnee Mission; Semichem Inc.: Belfast, UK, 2009. [Google Scholar]
- Trott, O.; Olson, A. AutoDock Vina: Improving the speed and accuracy of docking with a new scoring function, efficient optimization and multithreading. J. Comput. Chem. 2010, 31, 455–461. [Google Scholar] [CrossRef] [Green Version]
- Dessault Systemes. Available online: https://www.3dsbiovia.com/products/collaborative-science/biovia-discovery-studio/ (accessed on 14 November 2020).
- Phillips, J.C.; Braun, R.; Wang, W.; Gumbart, J.; Tajkhorshid, E.; Villa, E.; Chipot, C.; Skeel, R.D.; Kalé, L.; Schulten, K. Scalable molecular dynamics with NAMD. J. Comput. Chem. 2005, 26, 1781–1802. [Google Scholar] [CrossRef] [PubMed] [Green Version]
- Dallakyan, S.; Olson, A.J. Small-molecule library screening by docking with PyRx. Methods Mol. Biol. 2015, 1263, 243–250. [Google Scholar] [CrossRef] [PubMed]
- Humphrey, W.; Dalke, A.; Schulten, K. VMD: Visual molecular dynamics. J. Mol. Graph. 1996, 14, 27–28. [Google Scholar] [CrossRef]
- Wong, M. Standard Bond Lengths and Bond Angles. Available online: http://hydra.vcp.monash.edu.au/modules/mod2/bondlen.html (accessed on 14 November 2020).
- Socrates, G. Infrared and Raman Characteristic Group Frequencies, 3rd ed.; Wiley-Blackwell: Hoboken, NJ, USA, 2004. [Google Scholar]
- Silverstein, R.; Webster, F.; Kiemle, D.; Bryce, D. Spectrometric Identification of Organic Compounds, 8th ed.; Wiley: New York, NY, USA, 2014. [Google Scholar]
- Steiner, T. The hydrogen bond in the solid state. Angew. Chem. Int. Ed. Engl. 2002, 4, 49–76. [Google Scholar] [CrossRef]
- Kadela-Tomanek, M.; Pawełczak, B.; Jastrzębska, M.; Bębenek, E.; Chrobak, E.; Latocha, M.; Kusz, J.; Książek, M.; Boryczka, S. Structural, vibrational and quantum chemical investigations for 6,7-dichloro-2-methyl-5,8-quinolinedione. Cytotoxic and molecular docking studies. J. Mol. Struct. 2018, 1168, 73–83. [Google Scholar] [CrossRef]
- Yamashita, H.; Matsuzaki, M.; Kurokawa, Y.; Nakane, T.; Goto, M.; Lee, K.; Shibata, T.; Bando, H.; Wada, K. Four New Triterpenoids from the Bark of Euonymus alatus forma ciliato-dentatus. Phytochem. Lett. 2015, 31, 140–145. [Google Scholar] [CrossRef] [PubMed]
- Bębenek, E.; Kadela-Tomanek, M.; Chrobak, E.; Wietrzyk, J.; Sadowska, J.; Boryczka, S. New acetylenic derivatives of betulin and betulone, synthesis and cytotoxic activity. Med. Chem. Res. 2017, 26, 1–8. [Google Scholar] [CrossRef] [Green Version]
- Chrobak, E.; Bębenek, E.; Kadela-Tomanek, M.; Latocha, M.; Jelsch, C.; Wenger, E.; Boryczka, S. Betulin phosphonates; synthesis, structure, and cytotoxic activity. Molecules 2016, 21, 1123. [Google Scholar] [CrossRef] [Green Version]
- Choudhary, V.; Bhatt, A.; Dash, D.; Sharma, N. DFT calculations on molecular structures, HOMO–LUMO study, reactivity descriptors and spectral analyses of newly synthesized diorganotin(IV) 2-chloridophenylacetohydroxamate complexes. J. Comput. Chem. 2019, 40, 2354–2363. [Google Scholar] [CrossRef] [PubMed]
- Rauk, A. Orbital Interaction Theory of Organic Chemistry, 2nd ed.; Wiley & Sons John: New York, NY, USA, 2001. [Google Scholar]
- Kumar, S.; Saini, V.; Maurya, I.; Sindhu, J.; Kumari, M.; Kataria, R.; Kumar, V. Design, synthesis, DFT, docking studies and ADME prediction of some new coumarinyl linked pyrazolylthiazoles: Potential standalone or adjuvant antimicrobial agents. PLoS ONE 2018, 13, e0196016–e0196094. [Google Scholar] [CrossRef] [PubMed] [Green Version]
- Singha, P.; Islama, S.; Ahmada, H.; Prabaharan, A. Spectroscopic investigation (FT-IR, FT-Raman), HOMO-LUMO, NBO, and molecular docking analysis of N-ethyl-N-nitrosourea, a potential anticancer agent. J. Mol. Struct. 2018, 1154, 39–50. [Google Scholar] [CrossRef]
- Govindarajan, M.; Karabacak, M.; Periandy, S.; Tanuja, D. Spectroscopic (FT-IR, FT-Raman, UV and NMR) investigation and NLO, HOMO–LUMO, NBO analysis of organic 2,4,5-trichloroaniline. Spectrochim. Acta A Mol. Biomol. Spectrosc. 2012, 97, 231–245. [Google Scholar] [CrossRef] [PubMed]
- Chandrasekaran, K.; Kumar, R. Structural, spectral, thermodynamical, NLO, HOMO, LUMO and NBO analysis of fluconazole. Spectrochim. Acta A 2015, 150, 974–991. [Google Scholar] [CrossRef]
- Liu, X.; Wang, X.M. Potential inhibitors against 2019-nCoV coronavirus M protease from clinically ap-proved medicine. J. Gent. Genom. 2020, 47, 119–121. [Google Scholar] [CrossRef]
- Fearon, D.; Powell, A.; Douangamath, A.; Owen, C.; Wild, C.; Krojer, T.; Lukacik, P.; Strain-Damerell, C.; Walsh, M.; von Delft, F. PanDDA analysis group deposition—Crystal Structure of SARS-CoV-2 main protease in complex with Z1220452176. RCSB Protein Data Bank 2020. [Google Scholar] [CrossRef]
- Jin, Z.; Du, X.; Xu, Y.; Deng, Y.; Liu, M.; Zhao, Y.; Zhang, B.; Li, X.; Zhang, L.; Peng, C.; et al. Structure of Mpro from SARS-CoV-2 and discovery of its inhibitors. Nature 2020, 582, 289–293. [Google Scholar] [CrossRef] [Green Version]
- Arya, R.; Das, A.; Prashar, V.; Kumar, M. Potential inhibitors against papain-like protease of novel coronavirus (SARS-CoV-2) from FDA approved drugs. ChemRxiv 2020, 1–10. [Google Scholar] [CrossRef]


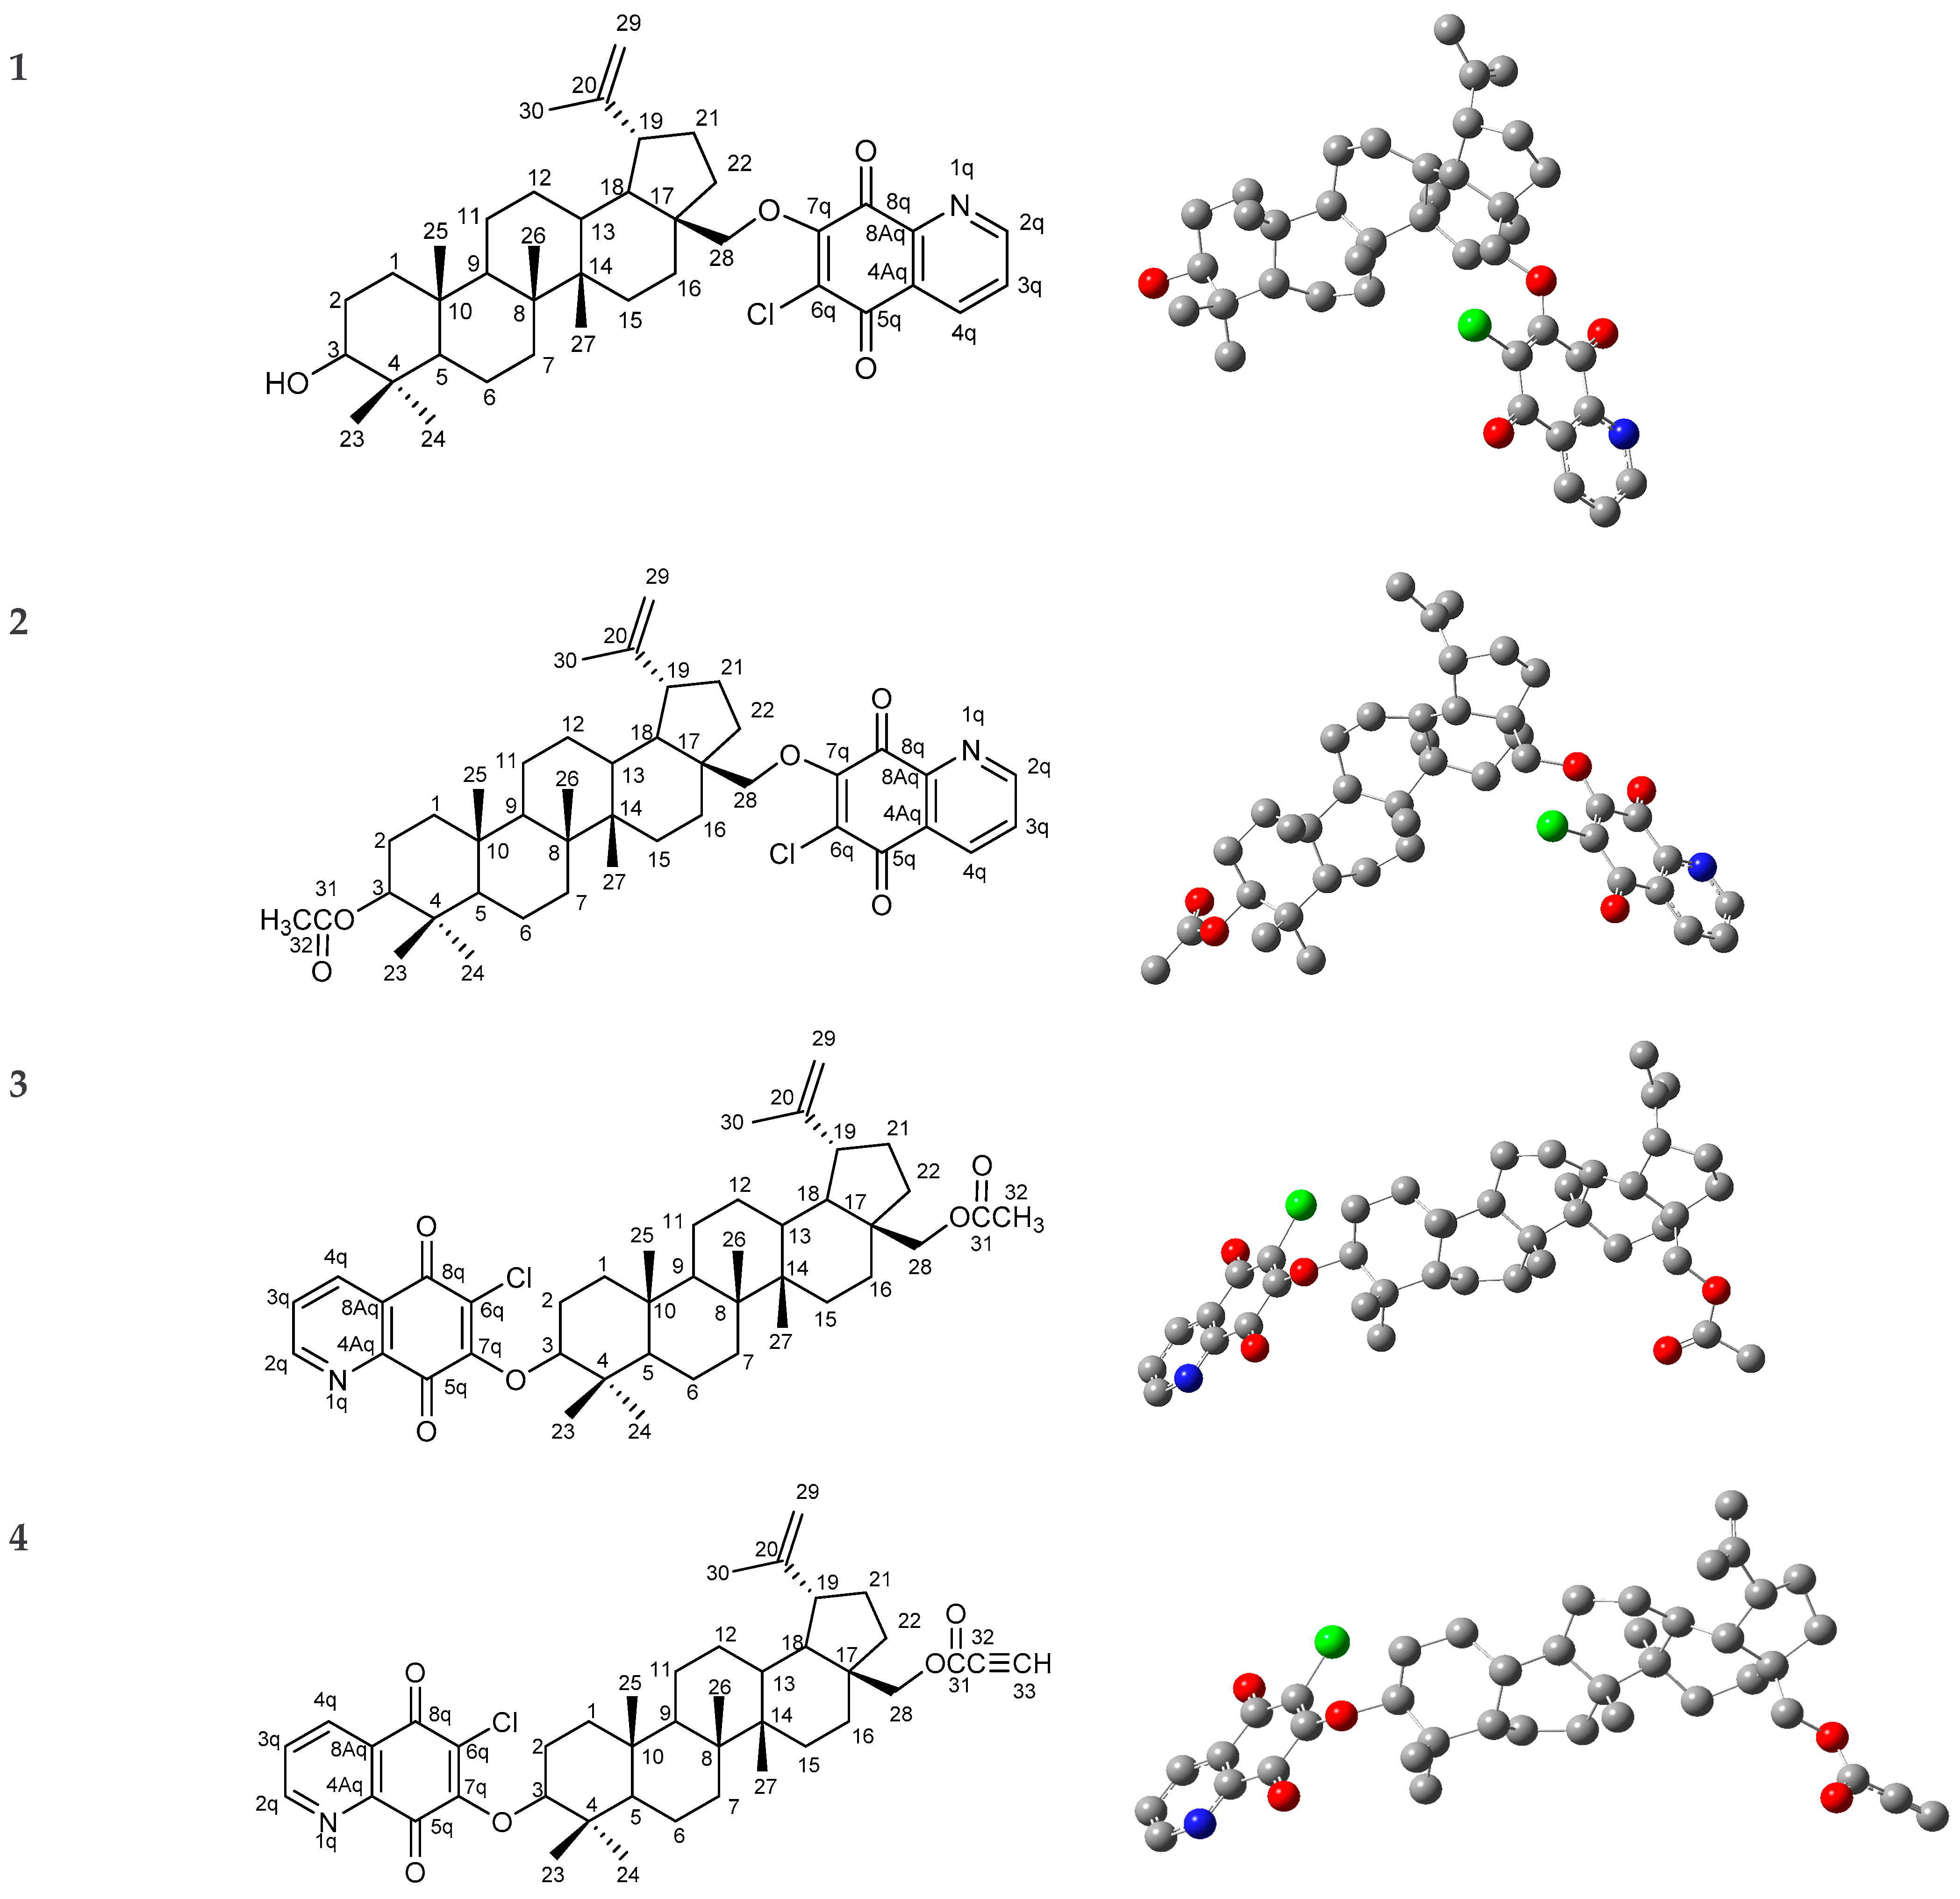
| Assignment | 1 | 2 | 3 | 4 | ||||
|---|---|---|---|---|---|---|---|---|
| Exp | Calc | Exp | Calc | Exp | Calc | Exp | Calc | |
| v C≡C-H | 3330–3258 | 3361 | ||||||
| v OH | 3418 | 3621 | ||||||
| v aliphatic CH3, CH2, CH | 3073–2870 | 3119–2841 | 3070–2872 | 3119–2942 | 3073–2870 | 3120–2856 | 2945–2870 | 3118–2858 |
| v C≡C | 2115 | 2138 | ||||||
| v OC=O | 1728 | 1777 | 1736 | 1785 | 1712 | 1747 | ||
| vas C=O | 1691 | 1704 | 1691 | 1700 | 1693 | 1700 | 1668 | 1704 |
| vs C=O | 1674 | 1688 | 1670 | 1690 | 1668 | 1685 | 1639 | 1687 |
| vs C=C isopropenyl | 1637 | 1670 | 1641 | 1669 | 1641 | 1670 | 1637 | 1666 |
| v aromatic C-C, C-H | 1593–1566 | 1583–1557 | 1593–1562 | 1584–1533 | 1589–1558 | 1577–1546 | 1591–1558 | 1574–1548 |
| σ aliphatic CH3, CH2, CH | 1458 | 1479 | 1465 | 1477 | 1462 | 1448 | 1463 | 1478 |
| ν CH3, CH2 | 1388–1311 | 1392–1288 | 1373–1315 | 1369–1291 | 1369–1314 | 1373–1292 | 1388–1311 | 1409–1288 |
| ν C-N | 1278 | 1288 | 1280 | 1291 | 1278 | 1291 | 1274 | 1288 |
| δ C-C, C-H | 1246 | 1235 | 1251–1240 | 1230 | 1251 | 1238–1222 | 1252–1224 | 1236–1201 |
| ν C-C, C-H | 1182–1149 | 1166–1132 | 1182–1149 | 1168–1130 | 1184–1148 | 1168–1130 | 1182–1148 | 1166–1131 |
| δ C-C, C-H | 1096–1064 | 1053 | 1093–1022 | 1052–1006 | 1064–1035 | 1153–1052 | 1093–1043 | 1056–1029 |
| ν C-O | 1045–1020 | 1027–1010 | 1024 | 1021–1007 | 1033–1020 | 1037–1006 | 1018 | 1018–1001 |
| ν C-O | 945–927 | 923 | 945–933 | 921 | 910 | 916 | 974 | 958 |
| δ C-C, CH3, CH2, CH | 880–856 | 880–854 | 900–852 | 875–852 | 883–856 | 875–862 | 883–856 | 880–862 |
| v C-Cl | 815 | 828 | 813 | 829 | 812 | 829 | 812 | 828 |
| v C-C C-H | 754–725 | 741–706 | 734–704 | 736–705 | 726–690 | 737–705 | 754–723 | 732–706 |
| Atoms | 1 | 2 | 3 | 4 | ||||
|---|---|---|---|---|---|---|---|---|
| Exp | Calc | Exp | Calc | Exp | Calc | Exp | Calc | |
| H-2q | 9.07 | 9.19 | 9.06 | 9.11 | 9.04 | 9.13 | 9.04 | 9.09 |
| H-4q | 8.50 | 8.35 | 8.50 | 8.23 | 8.50 | 8.25 | 8.50 | 8.26 |
| H-3q | 7.73 | 7.36 | 7.73 | 7.31 | 7.71 | 7.27 | 7.72 | 7.27 |
| H-28Abet | 4.87 | 4.79 | 4.88 | 4.70 | 4.28 | 5.14 | 4.40 | 4.17 |
| H-29Abet | 4.71 | 5.09 | 4.71 | 5.01 | 4.71 | 4.99 | 4.72 | 4.87 |
| H-29Bbet | 4.62 | 4.72 | 4.62 | 4.60 | 4.61 | 4.52 | 4.62 | 4.92 |
| H-28Bbet | 4.29 | 3.94 | 4.28 | 3.82 | 3.88 | 3.28 | 4.00 | 3.76 |
| H-3bet | 3.21 | 3.50 | 4.49 | 4.76 | 4.81 | 4.78 | 4.81 | 4.74 |
| H-19bet | 2.44 | 2.48 | 2.43 | 2.49 | 2.47 | 2.34 | 2.45 | 2.38 |
| CH3C(O)O | - | - | 2.06 | 2.02 | 2.09 | 2.05 | - | - |
| CHCC(O)O | - | - | - | - | - | - | 2.91 | 2.57 |
| C-5q | 178.2 | 181.8 | 178.2 | 181.5 | 178.1 | 181.9 | 178.1 | 181.9 |
| C-8q | 177.7 | 181.6 | 177.8 | 180.6 | 177.9 | 181.3 | 177.6 | 181.4 |
| C-7q | 158.1 | 156.1 | 158.2 | 155.3 | 158.3 | 156.9 | 158.1 | 156.9 |
| C-2q | 154.6 | 155.3 | 154.7 | 153.9 | 154.8 | 153.1 | 154.5 | 153.7 |
| C-20bet | 150.1 | 154.2 | 150.1 | 153.2 | 150.1 | 152.6 | 153.3 | 153.5 |
| C-8Aq | 146.6 | 143.4 | 146.8 | 143.2 | 146.6 | 143.5 | 149.9 | 143.0 |
| C-4q | 134.8 | 132.4 | 134.9 | 131.6 | 134.8 | 131.7 | 134.9 | 131.7 |
| C-6q | 131.5 | 137.7 | 129.0 | 137.4 | 129.1 | 137.8 | 128.9 | 138.1 |
| C-4Aq | 128.2 | 125.6 | 128.2 | 124.7 | 128.2 | 124.8 | 128.1 | 125.2 |
| C-3q | 128.1 | 125.1 | 127.8 | 124.5 | 127.8 | 124.6 | 127.8 | 124.8 |
| C-29bet | 110.1 | 110.8 | 109.9 | 109.8 | 109.9 | 109.8 | 110.0 | 110.4 |
| C28bet | 79.0 | 80.1 | 80.8 | 81.2 | 73.9 | 64.6 | 74.6 | 72.1 |
| C-3bet | 73.9 | 76.8 | 74.0 | 79.1 | 80.9 | 99.2 | 92.6 | 98.7 |
| C(O)O | - | - | 170.9 | 180.3 | 171.0 | 180.2 | 169.4 | 162.6 |
| CH3C(O)O | - | - | 16.1 | 15.5 | 15.8 | 15.2 | - | - |
| CHCC(O)O | - | - | - | - | - | - | 74.8 | 75.6 |
| CHCC(O)O | - | - | - | - | - | - | 74.7 | 72.2 |
| Parameters | 6-311G+(d.p) | |||
|---|---|---|---|---|
| 1 | 2 | 3 | 4 | |
| Fourier molecular orbital energies (eV) | ||||
| EHOMO | −6.605 | −6.839 | −6.826 | −6.756 |
| ELUMO | −3.585 | −3.783 | −3.702 | −3.741 |
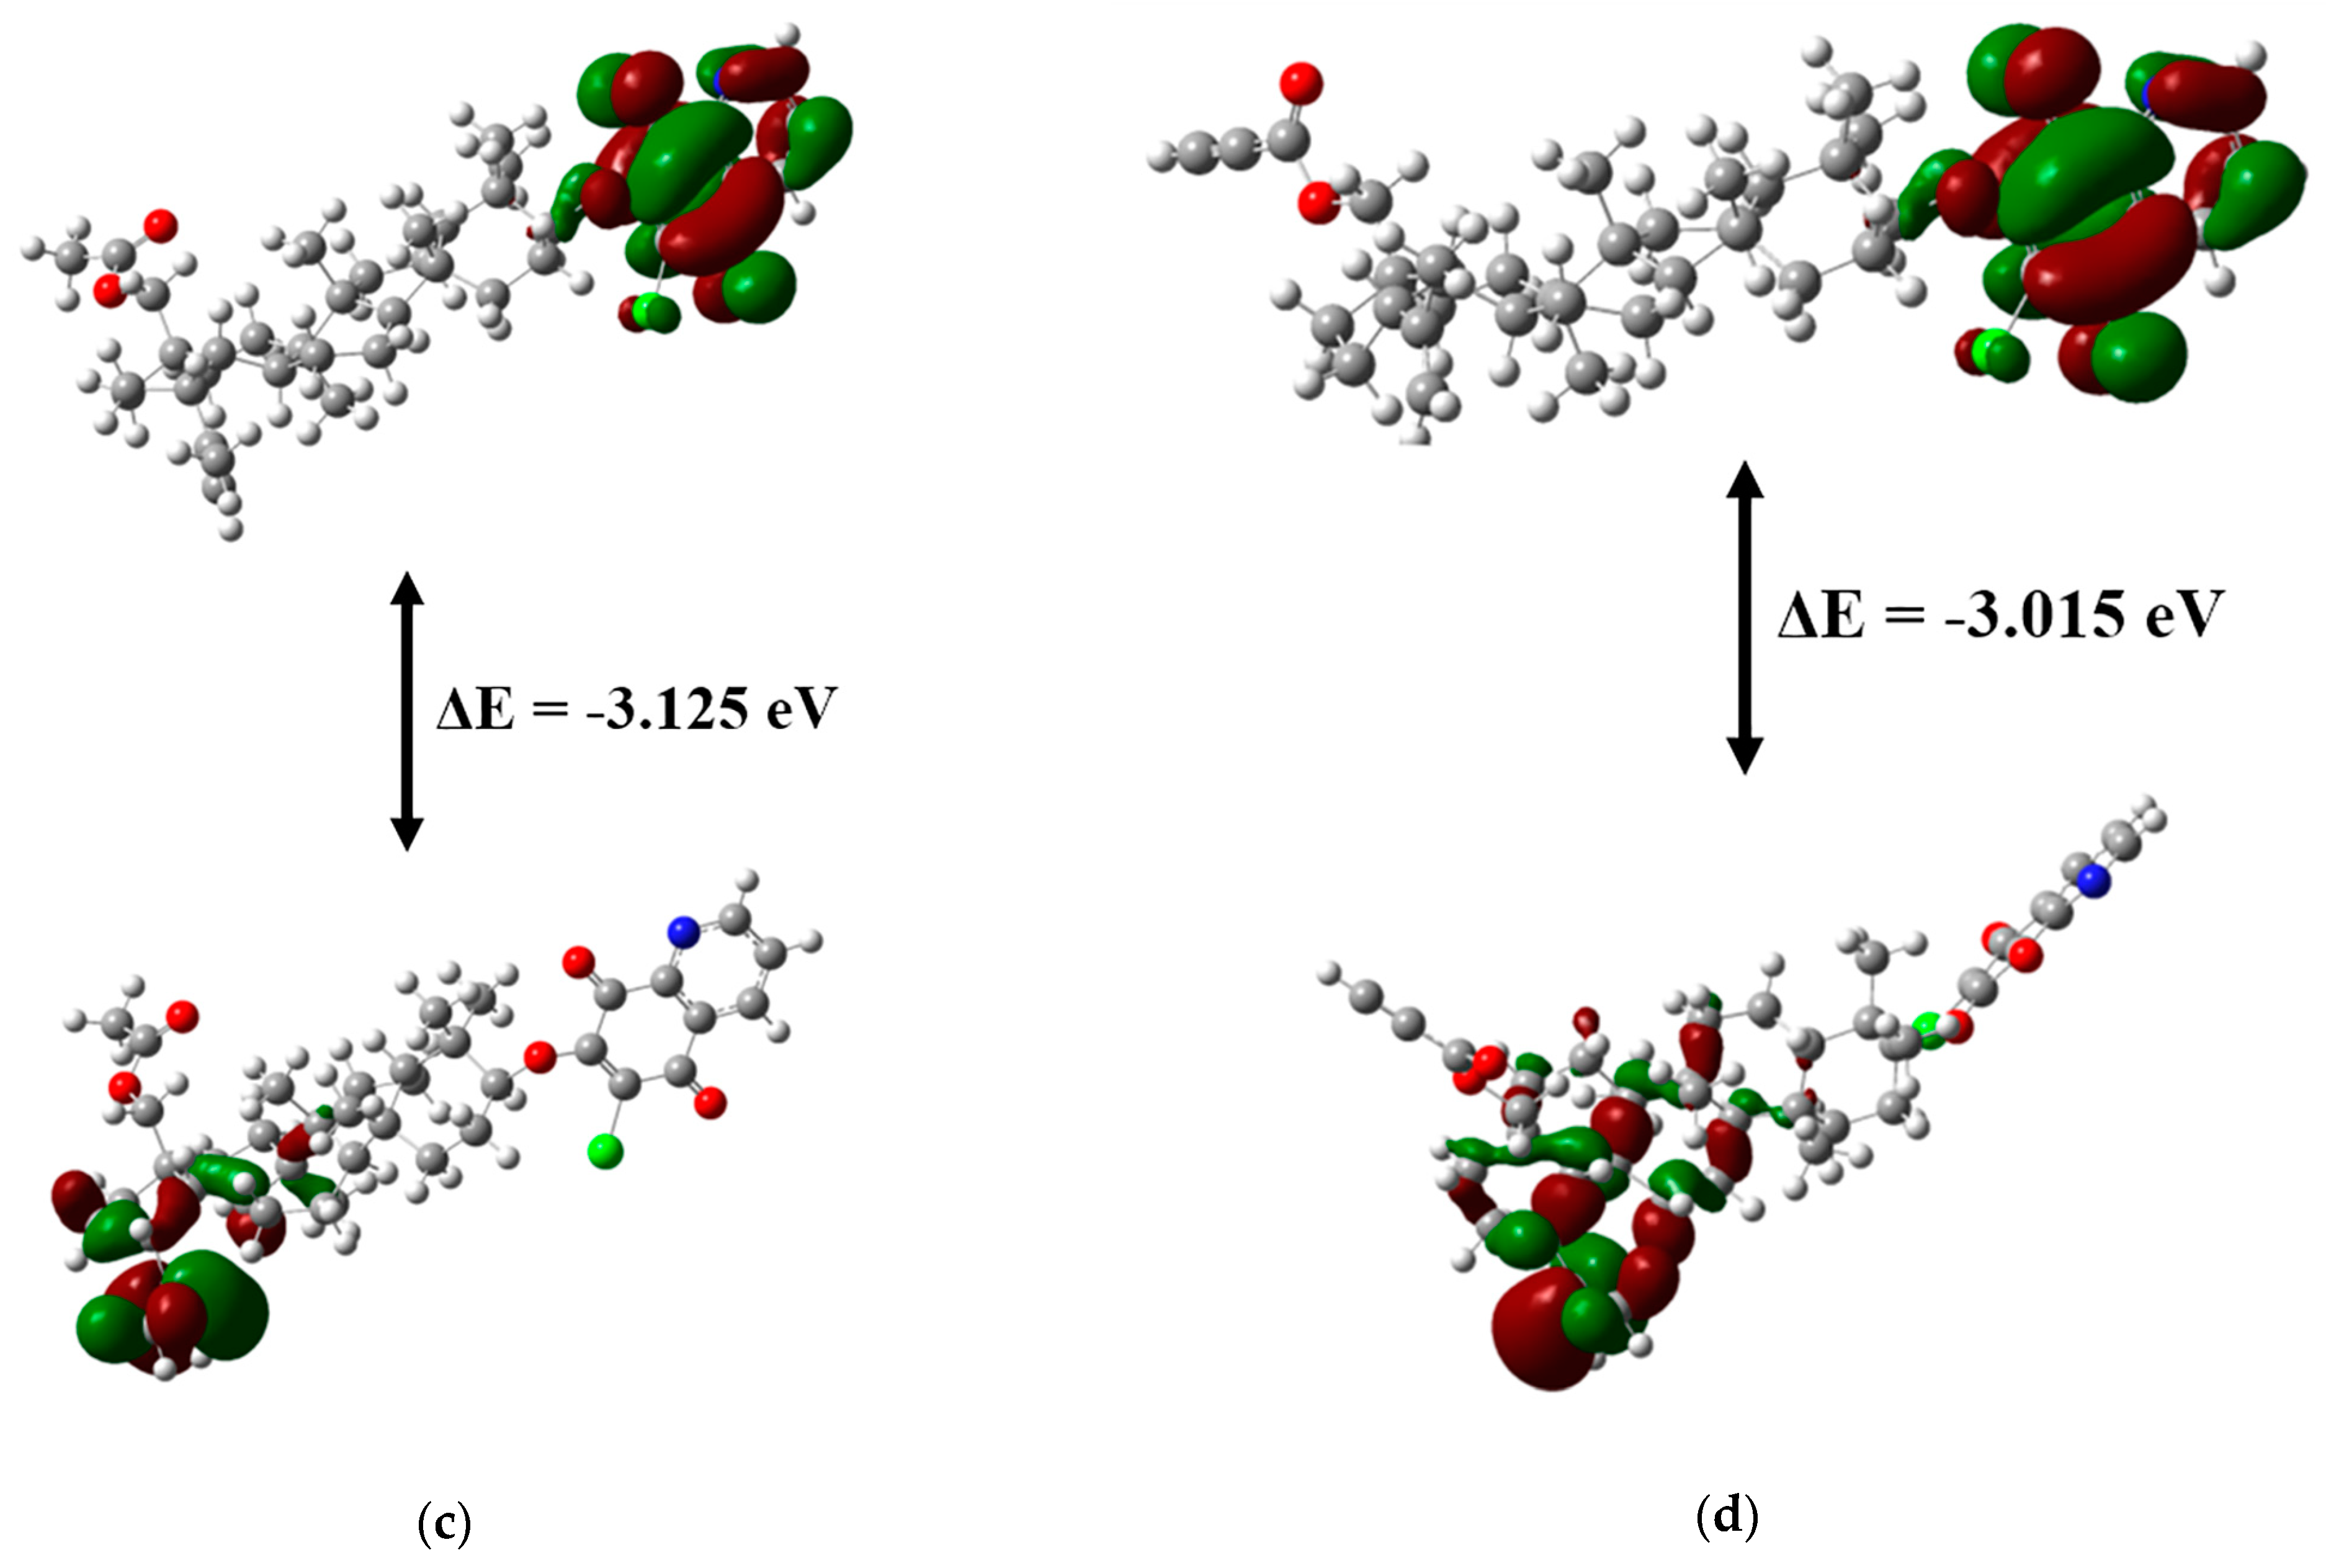
| ΔE = EHOMO − ELUMO | −3.020 | −3.056 | −3.125 | −3.015 |
| Global reactivity descriptors (eV) | ||||
| Ionization potential (I) | 6.605 | 6.839 | 6.826 | 6.756 |
| Electron affinity (A) | 3.585 | 3.783 | 3.702 | 3.741 |
| Hardness (η) | 1.510 | 1.528 | 1.562 | 1.508 |
| Softness (s) | 0.662 | 0.654 | 0.640 | 0.663 |
| Chemical potential (μ) | −5.095 | −5.311 | −5.264 | −5.249 |
| Electronegativity (ϰ) | 5.095 | 5.311 | 5.264 | 5.249 |
| Electrophilicity index (ω) | 8.598 | 9.230 | 8.868 | 9.137 |
| Compound | ΔG [kcal/mol] | |
|---|---|---|
| Mpro | PLpro | |
| 1 | −8.7 | −8.1 |
| 2 | −8.5 | −7.9 |
| 3 | −8.5 | −7.7 |
| 4 | −8.9 | −7.6 |
| Dexamethasone | −7.4 | −6.5 |
| Remdesivir | −7.5 | −7.2 |
| Chloroquine | −5.6 | −5.6 |
| Protein | Ligand | Interaction | |||
|---|---|---|---|---|---|
| Name | Residue | Name | Residue | Type | Distance [Å] |
| Mpro | Gly143 | 4 | carbonyl oxygen at C-8q | conventional hydrogen bond | 2.40 |
| Gly143 | carbonyl oxygen at C-8q | carbon hydrogen bond | 2.85 | ||
| Thr26 | pyridine ring | π-donor | 3.11 | ||
| Thr25 | 1,4-quinone ring | π-sigma | 2.92 | ||
| Cys145 | C-2 | alkyl-alkyl | 4.72 | ||
| Pro168 | cyclopentane ring | alkyl-alkyl | 5.13 | ||
| Cys145 | C-24 | alkyl-alkyl | 4.43 | ||
| Cys145 | C-25 | alkyl-alkyl | 5.20 | ||
| Met49 | 1,4-quinone ring | alkyl-alkyl | 5.13 | ||
| Met165 | C-29 | alkyl-alkyl | 5.10 | ||
| Leu167 | C-29 | alkyl-alkyl | 5.48 | ||
| His41 | C-2 | π-orbitals | 5.36 | ||
| His41 | C-8q | π-orbitals | 4.99 | ||
| PLpro | Glu167 | 1 | carbonyl oxygen at C-8q | carbon hydrogen bond | 2.77 |
| Glu167 | pyridine ring | π-anion | 3.78 | ||
| Met206 | C-7 | alkyl-alkyl | 5.24 | ||
| Met206 | C-16 | alkyl-alkyl | 5.19 | ||
| Val202 | C-27 | alkyl-alkyl | 5.06 | ||
| Tyr207 | C-23 | π-alkyl | 4.74 | ||
| Tyr207 | C-24 | π-alkyl | 4.58 | ||
Publisher’s Note: MDPI stays neutral with regard to jurisdictional claims in published maps and institutional affiliations. |
© 2021 by the authors. Licensee MDPI, Basel, Switzerland. This article is an open access article distributed under the terms and conditions of the Creative Commons Attribution (CC BY) license (http://creativecommons.org/licenses/by/4.0/).
Share and Cite
Kadela-Tomanek, M.; Jastrzębska, M.; Marciniec, K.; Bębenek, E.; Chrobak, E.; Boryczka, S. Spectroscopic Investigations, Computational Analysis and Molecular Docking to SAR-Cov-2 Targets Studies of 5,8-Quinolinedione Attached to Betulin Derivatives. Crystals 2021, 11, 76. https://0-doi-org.brum.beds.ac.uk/10.3390/cryst11010076
Kadela-Tomanek M, Jastrzębska M, Marciniec K, Bębenek E, Chrobak E, Boryczka S. Spectroscopic Investigations, Computational Analysis and Molecular Docking to SAR-Cov-2 Targets Studies of 5,8-Quinolinedione Attached to Betulin Derivatives. Crystals. 2021; 11(1):76. https://0-doi-org.brum.beds.ac.uk/10.3390/cryst11010076
Chicago/Turabian StyleKadela-Tomanek, Monika, Maria Jastrzębska, Krzysztof Marciniec, Ewa Bębenek, Elwira Chrobak, and Stanisław Boryczka. 2021. "Spectroscopic Investigations, Computational Analysis and Molecular Docking to SAR-Cov-2 Targets Studies of 5,8-Quinolinedione Attached to Betulin Derivatives" Crystals 11, no. 1: 76. https://0-doi-org.brum.beds.ac.uk/10.3390/cryst11010076