
Study on Energy Evolution and Damage Constitutive Model of Siltstone


School of Civil Engineering and Architecture, Anhui University of Science and Technology, Huainan 232001, China
*
Author to whom correspondence should be addressed.
Crystals 2021, 11(11), 1271; https://0-doi-org.brum.beds.ac.uk/10.3390/cryst11111271
Submission received: 14 September 2021
/
Revised: 9 October 2021
/
Accepted: 14 October 2021
/
Published: 20 October 2021
(This article belongs to the Special Issue Advances in Sustainable Concrete System)
Abstract
:In order to study the energy evolution characteristics and damage constitutive relationship of siltstone, the conventional triaxial compression tests of siltstone under different confining pressures are performed, and the evolution laws of input energy, elastic strain energy and dissipative energy of siltstone with axial strain and confining pressure are analyzed. According to the test results, the judgment criterion of the rock damage threshold is improved, and an improved three-shear energy yield criterion is proposed., The damage constitutive equation of siltstone is established based on the damage mechanics theory through the principle of minimum energy consumption and by considering the residual strength of rock, and lastly, the rationality of the model is verified by experimental data. The results reveal that (1) both the input energy and dissipative energy gradually increase with the increase of axial strain, and the elastic strain energy first increases and then decreases with the increase of axial strain, and reaches its maximum at the peak. (2) The input energy and dissipation energy increase exponentially with the increase of the confining pressure, and the elastic strain energy increases linearly with the increase of confining pressure. (3) According to the linear relationship between the sum of shear strain energy and hydrostatic pressure, an improved three-shear energy yield criterion is established. (4) The model curve can better describe the strain softening stage and the residual strength characteristics of siltstone. The relative standard deviation between the model results and the test results is only 4.35%, which verifies the rationality and feasibility of the statistical damage constitutive model that is established in this paper.
1. Introduction
During the excavation of coal mine shafts and roadways, the stress of the surrounding rock is redistributed, and the surrounding rock is repeatedly disturbed by construction. Therefore, there are a large number of micro defects such as cracks and cavities in the rock mass, resulting in the nonlinear mechanical characteristics of the rock mass under various stress states [1,2]. The mechanical properties of rocks are particularly important for the stability analysis of surrounding rocks [3,4], so it is necessary to analyze the mechanical properties of rock under different stress states. Establishing the constitutive model of rock, using statistical damage theory, has become one of the important methods to study the nonlinear mechanical properties of rock [5,6,7,8,9].
Experts at home and abroad have produced much research on the statistical damage constitutive model of rock materials. The key to statistical damage theory is the reasonable measurement of rock micro element strength [10]. Tang Chunan [11] proposed to measure the rock micro-element strength through axial strain, which has achieved satisfactory results, but has ignored the influence of the stress state of the rock micro-element on its strength, therefore, this method has some shortcomings. Cao Wengui et al. [12] first proposed a new rock micro element strength measurement method based on Mohr-Coulomb criterion. Mohr-Coulomb criterion can accurately reflect the bearing capacity of rock, but it ignores the influence of intermediate principal stress, so the constitutive model established also has some limitations. Xu Weiya et al. [13] assumed that rock micro-element failure conforms to the Drucker–Plager criterion and established a statistical damage constitutive model of rock based on Weibull distribution. However, the Drucker–Plager criterion is relatively conservative, which limits the rationality of the rock micro-element strength that is determined based on this criterion. In view of the shortcomings of the above yield criterion, the Hoek–Brown criterion proposed by Hoek et al. [14,15] can better reflect the nonlinear failure characteristics of rock and the confining pressure effect of rock strength; Cao Ruilang et al. [16] established a three-dimensional statistical damage constitutive model under the condition that the micro-element failure of rock conforms to the Hoek–Brown criterion, which can reflect the post peak softening characteristics of rock by using the post-peak residual strength of rock to modify the damage variable. Most of the above studies use the mechanical parameters of rock as the basis for establishing the statistical damage constitutive equation, whereas only a few studies introduce the energy evolution characteristics of rock into the constitutive relationship [17]. Gao Wei et al. [18] established the damage constitutive model of granite under uniaxial compression by using the principle of minimum energy consumption. Sun Mengcheng et al. [19] established a new damage constitutive model by introducing the rock unified energy yield criterion as the energy consumption constraint condition, which is based on the principle of minimum energy consumption and continuous damage theory, but did not consider the influence of the post-peak softening stage on the damage constitutive model. It can be seen that, when studying the nonlinear constitutive relationship of rock under complex stress conditions, the minimum energy consumption principle is rarely applied to the establishment of rock damage evolution equation, and the influence of post-peak strain softening stage on the constitutive model is rarely considered in the existing damage constitutive model based on the energy principle.
In summary, much progress has been made in the research on rock damage mechanics, but there are still some problems, specifically the following: (1) there are weaknesses in the definition of the damage variable. Some scholars establish damage variables according to the statistical distribution theory, but the statistical distribution function cannot accurately describe the crack development and deformation in rock materials. Therefore, the rock damage constitutive model based on the statistical distribution theory is not in accordance with the actual situation of rock damage and deformation. (2) There are weaknesses in the establishment of the damage model. Hooke’s law can only describe the elastic stress–strain relationship of rock in the pre-peak stage, but cannot describe the stress–strain relationship in the post-peak strain softening stage. Some studies do not consider the strain softening stage, and therefore there are weaknesses in the damage constitutive model.
In order to avoid the above problems, a constitutive model that can accurately describe the characteristics of rock damage deformation and residual strength is constructed. Based on the principle of minimum energy consumption, this paper introduces the improved three-shear energy yield criterion as the energy consumption constraint, considers the influence of the post-peak strain softening stage and deduces the damage evolution equation of rock. According to the principle of effective stress, the damage constitutive model of rock under a conventional triaxial compression is established. In addition, the conventional triaxial compression tests of siltstone under different confining pressures are carried out, and the model parameters are identified according to the test data. The rationality and feasibility of the model in this paper are verified by comparing the model results with the test results.
2. Conventional Triaxial Compression Test of Siltstone
2.1. Test Process
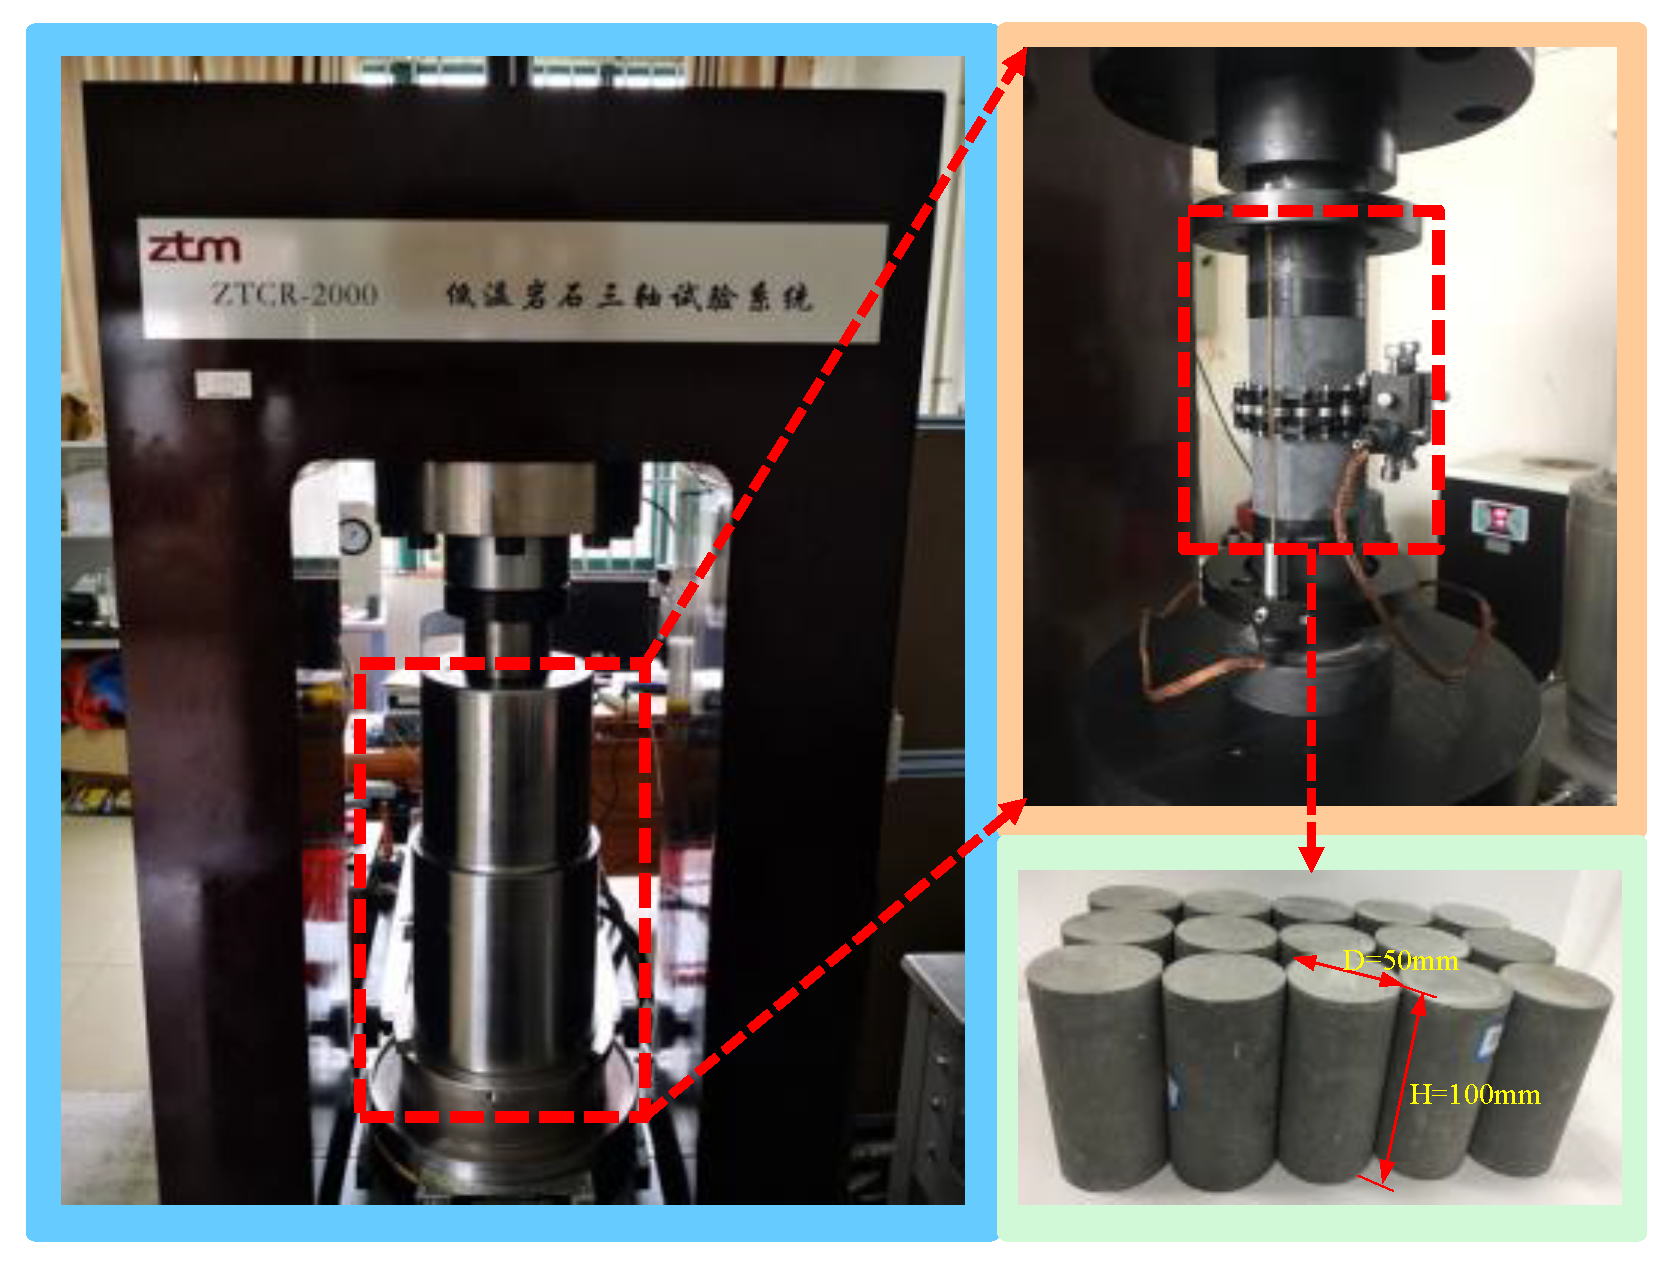
The test material used is Permian upper Shihezi Formation siltstone, which is taken from matoumen—at a 425 m depth of an east air shaft in Yuandian No. 2 mine, Huaibei City, Anhui Province. According to the standards for test methods of engineering rock mass (GBT50266-2013), the sample size is a cylinder with a diameter of 50 mm, a length of 100 mm and a length diameter ratio of 2. 2S-200 using a vertical coring machine, DQ-4 rock cutter and SHM-200 double face grinder to drill, cut and grind the siltstone rock sample. The disparity between the sample is less than 0.05 mm and the diameter error of the sample is no more than 0.3 mm.
The conventional triaxial compression test of siltstone samples is performed using a ZTCR-2000 low temperature rock triaxial system (Figure 1). During the test, the siltstone samples are preloaded to 0.5 MPa, and then the confining pressure is applied to the predetermined value at a loading speed of 50 N/s according to the load control mode. The test confining pressure is set to 0, 5, 10, 15 and 20 MPa. After the confining pressure reaches the predetermined value, it is stabilized for 30 s, and finally the press applies an axial pressure at the loading speed of 0.06 mm/min in the way of displacement control until the siltstone sample is damaged.
2.2. Analysis of Test Results
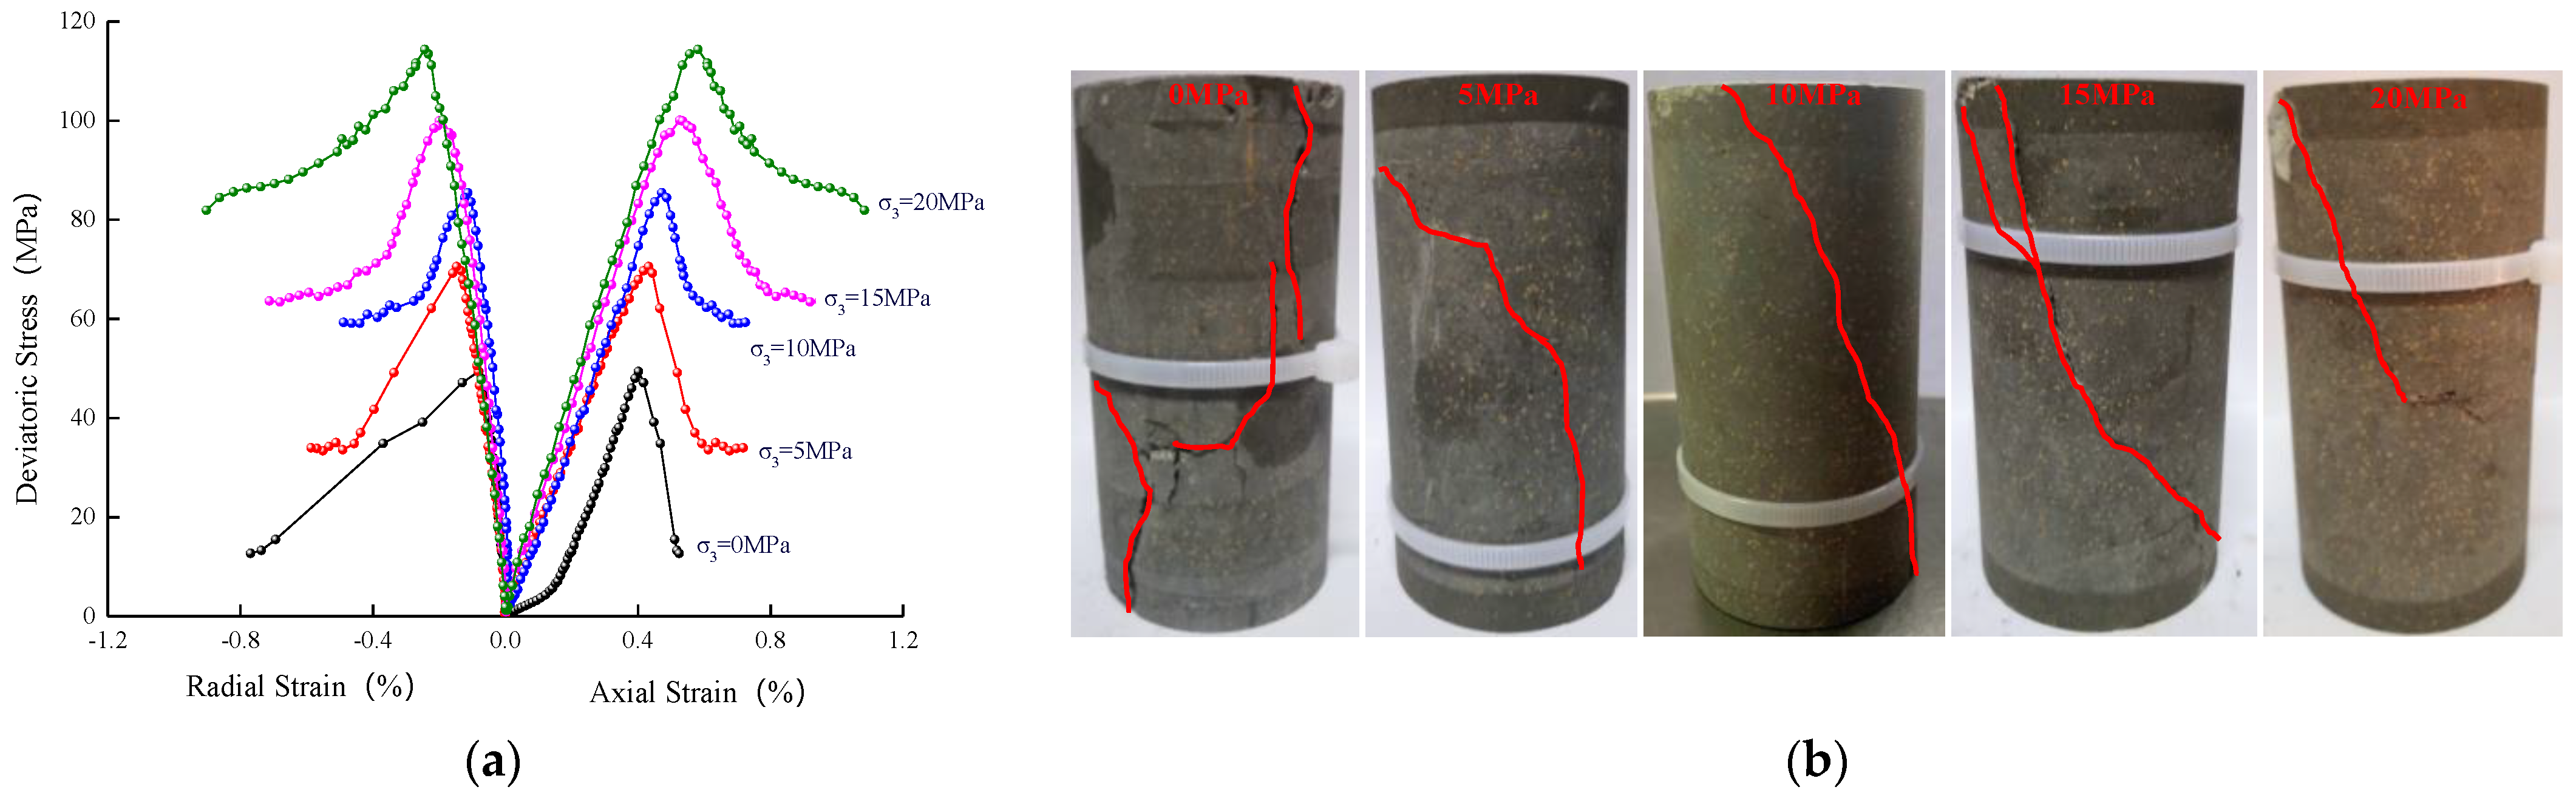
The siltstone samples were divided into three groups with five samples in each group. The tests were repeated three times under the same loading type, and the representative test data were selected for analysis. Figure 2a shows the stress–strain curve of siltstone samples under different confining pressures. It can be seen from Figure 2a that when the confining pressure is at 0 MPa in the pre-peak stage, due to the lack of confining pressure constraints when the loading exceeds the elastic limit of the sample the siltstone sample quickly reaches the failure state, and the pre-peak curve of the sample has no obvious yield stage. After reaching the peak strength, the stress decreases rapidly, and the post-peak curve is steep, displaying an obvious strain softening. When the confining pressure is at 20 MPa, because the confining pressure effectively limits the propagation speed of microcracks in the sample and slows down the damage degree of the sample, the yield stage is obvious in the pre-peak curve. The post-peak curve and stress drop trend tend to be gentle, and the strain softening phenomenon decreases in the post-peak stage. With the increase of the confining pressure, the peak stress and peak strain increase gradually, indicating that the bearing capacity of the siltstone sample increases gradually, and it becomes more difficult for the sample to enter the failure state. The failure characteristics of siltstone samples under different confining pressures are shown in Figure 2b.
The basic mechanical parameters of siltstone are obtained according to the total stress–strain curve. See Table 1.
3. Energy Analysis of Triaxial Compression Process of Siltstone
3.1. Theoretical Analysis of Energy Evolution
Assuming that heat exchange does not occur between the rock system and the external environment, according to the first law of thermodynamics, during the process of rock deformation and failure, the input energy is equal to the elastic strain energy plus the dissipative energy [20,21].
The above-mentioned energy relationship is shown in Formula (1):
The work performed by the axial force and confining pressure during the test is [22]:
where are the axial pressure and confining pressure, respectively, are the axial and radial strain, respectively, are the diameter and height of the siltstone specimen, respectively, is the volume of the siltstone sample and is the input energy density.
In the same way, the elastic strain energy and dissipative energy are as follows:
where are the elastic strain energy density and dissipative energy density, respectively.
According to the elastic theory [22], the elastic strain energy density is:
The three-dimensional constitutive relationship of siltstone is:
where is the elastic strain in the direction of the main stress, () is the main stress, , is the Kronecker tensor, is replaced by the initial elastic modulus and [22], is the Poisson’s ratio.
Equations (4) and (5) can be substituted into Equation (3) to obtain the elastic strain energy :
In the conventional triaxial compression test where , Formula (6) can be simplified to:
Substituting Formula (7) into Formula (1) and combining this with Formula (2) to obtain the dissipative energy results in the following:
3.2. Principle of Minimum Energy Consumption
For dissipative materials such as geotechnical materials, the stress comes from internal variables such as strain and temperature. Therefore, the internal variables reflecting the internal changes of materials need to be considered to truly establish the constitutive relationship of dissipative materials [23].
According to the internal variable theory, for any infinitesimal dissipative micro element, the volume dissipation rate is:
where, is the unit weight of rock, is the energy consumption rate of rock, is the damage variable of material, is the dual variable corresponding to the damage variable, is the corresponding dual variable of .
Without considering heat dissipation, the above formula is simplified as:
It is generally assumed that dissipative materials meet the following energy dissipation constraints in the process of energy dissipation:
According to the principle of minimum energy consumption, Formula (10) takes the stationary value under the condition of Formula (11) and introduces the Lagrange multiplier to obtain:
where, takes respectively.
The Lagrange multiplier is introduced into Equation (10) to obtain:
Assuming is a potential function, we get:
The above formula is the internal variable evolution equation of energy dissipation of dissipative materials derived based on the principle of minimum energy dissipation.
3.3. Relationship between Energy Evolution and Axial Strain
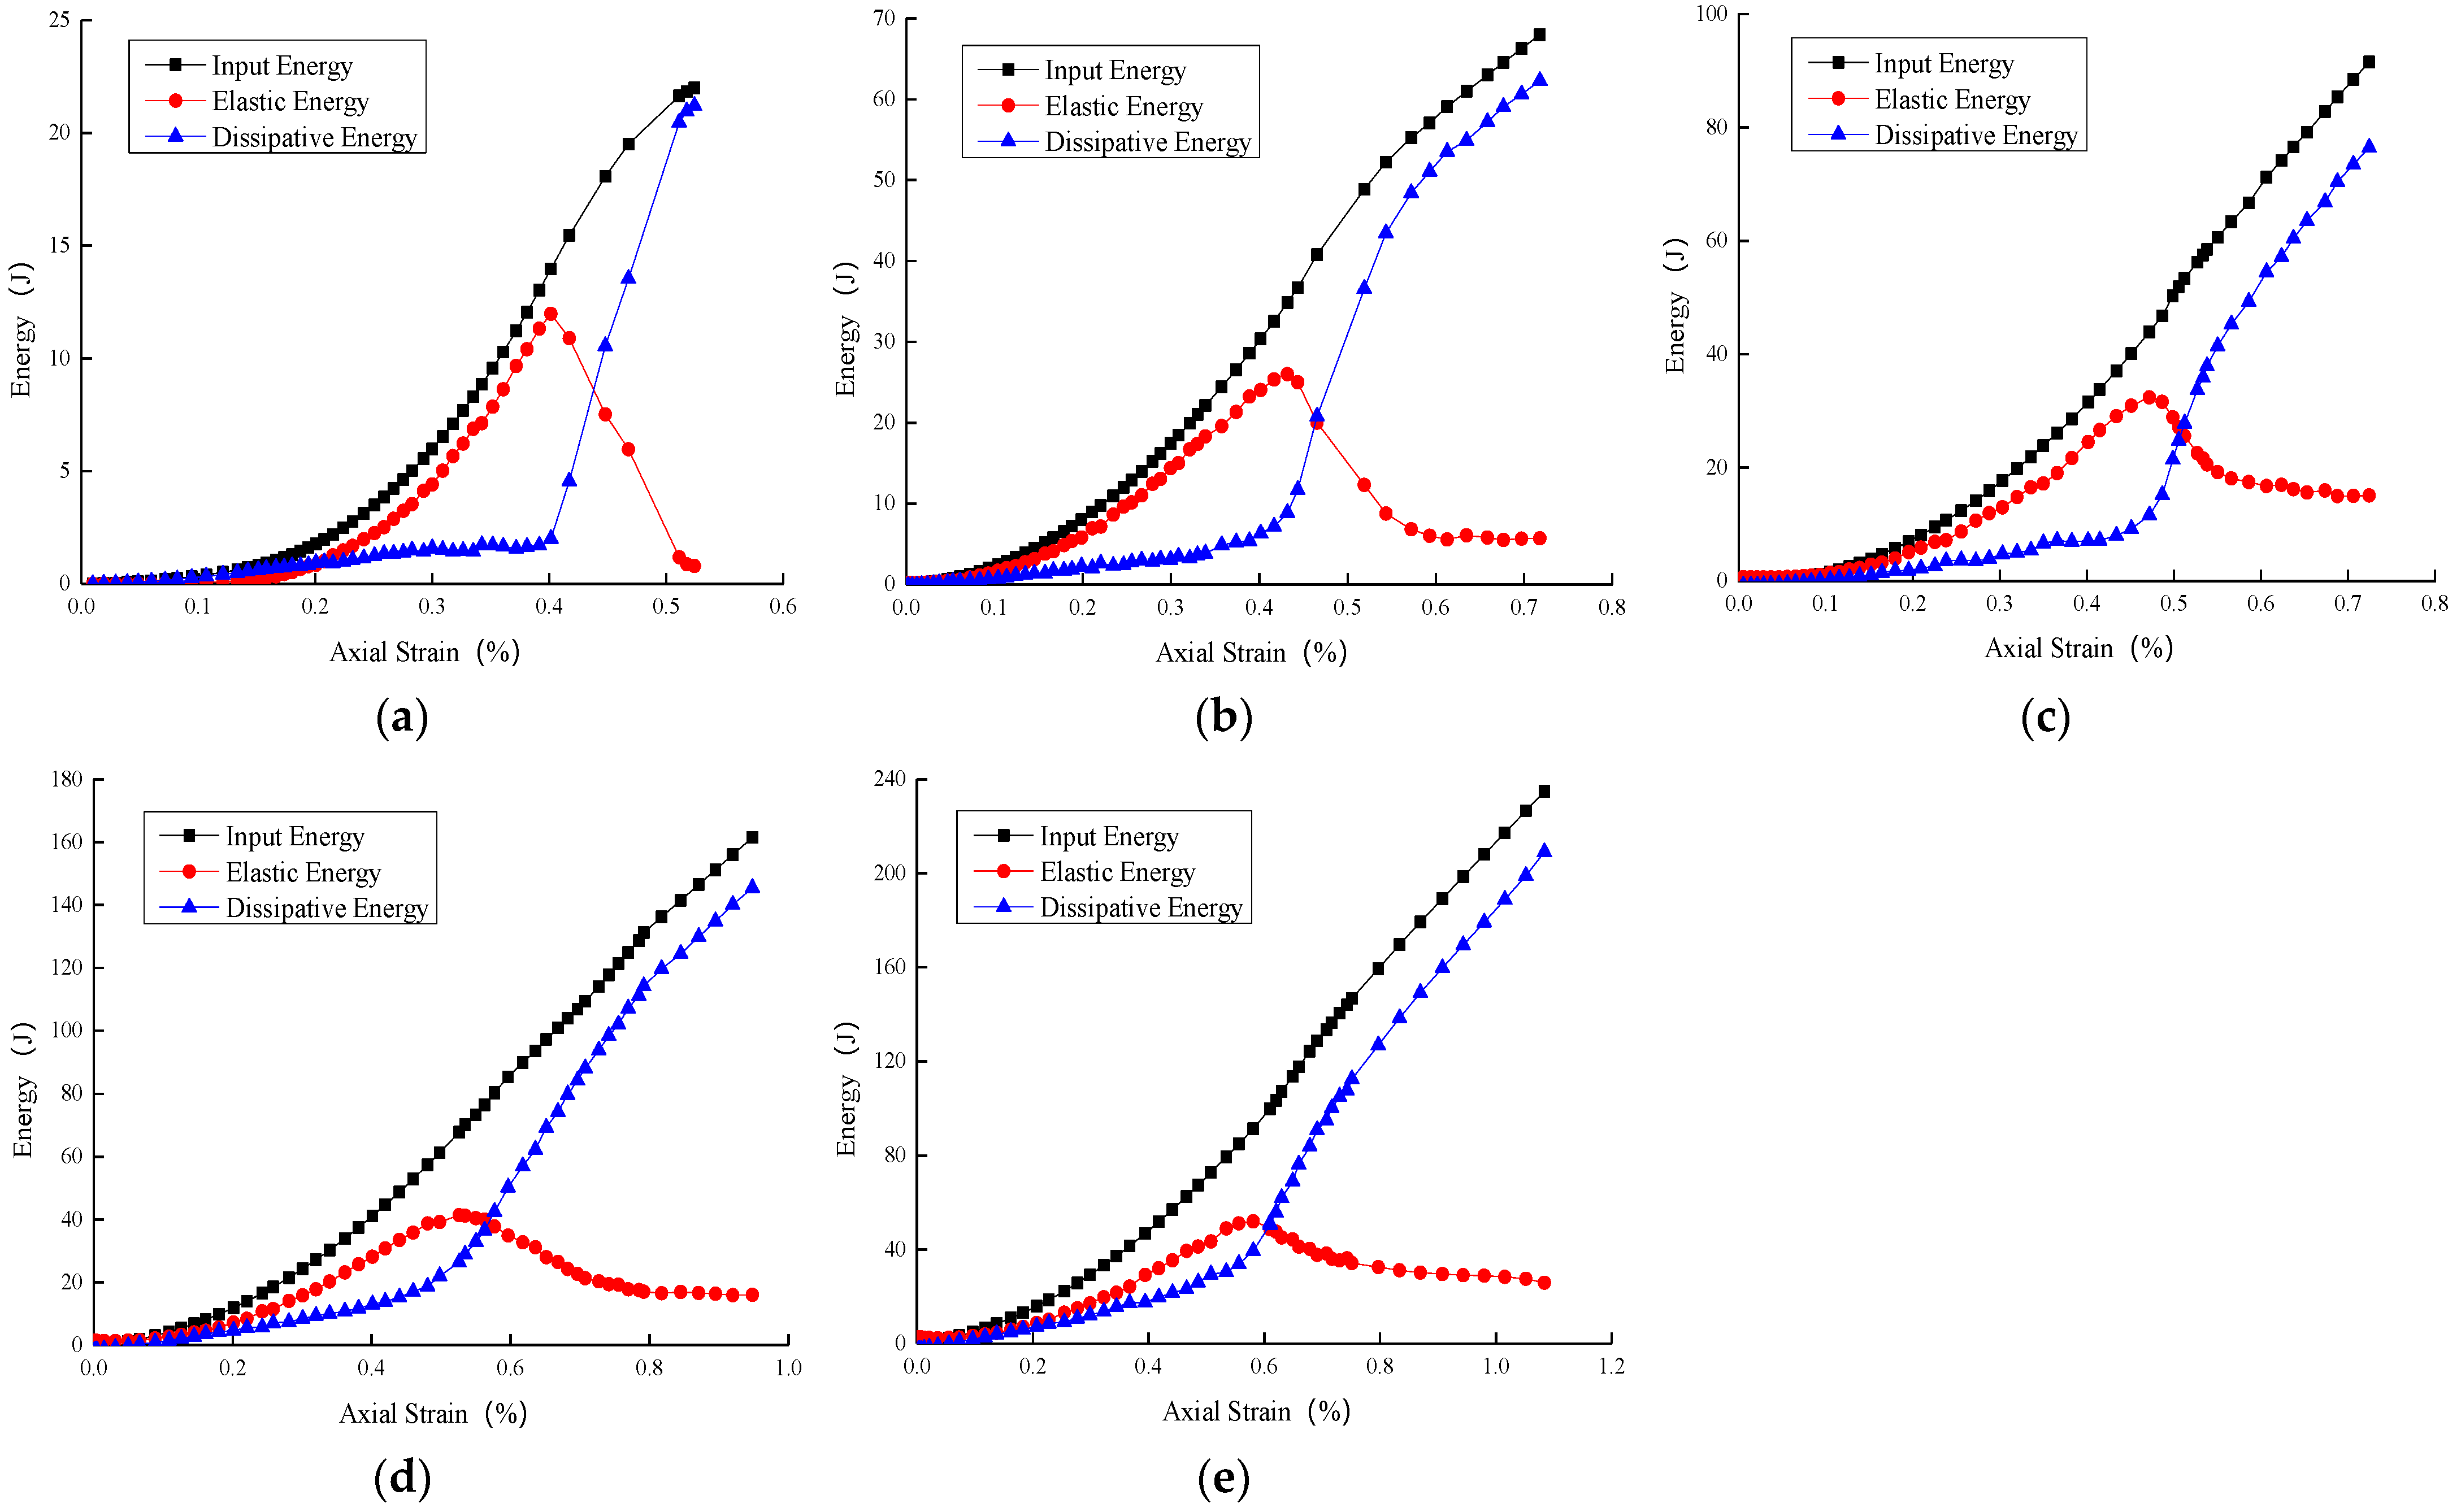
The triaxial compression test results are substituted into Equations (2), (7) and (8) to obtain the evolution curves of the input energy, elastic energy and dissipative energy of siltstone with an axial strain under different confining pressures, as shown in Figure 3.
It can be seen from Figure 3 that under different confining pressures, the input energy and dissipative energy increase with the increase of axial strain, and the elastic strain energy increases at first and then decreases. At the initial stage of sample loading, the initial pores in the rock are gradually closed as a result of the action of the external load, most of the work performed by the external load is transformed into elastic energy and stored in the sample and the elastic strain energy gradually increases with axial strain, the dissipative energy at this stage is very small, and the evolution curves of input energy, elastic energy and dissipative energy concave upward. Alongside the increase of the external load, the siltstone sample enters the linear elastic deformation stage, and the external work is essentially transformed into elastic strain energy, and the slope of the three energy evolution curves reaches the maximum. This stage is the main stage of energy storage in the overall process of rock failure. When the external load reaches the yield limit of rock, new cracks will appear in the sample, and part of the energy is required to be dissipated for its initiation and diffusion. Therefore, the slope of the elastic strain energy curve decreases gradually at this stage. When the external load reaches the peak strength, the elastic strain energy reaches the maximum value, and as a result the siltstone sample is damaged, and the elastic strain energy stored in the pre peak stage is released rapidly. Therefore, the elastic strain energy after the peak decreases gradually with the axial strain, and most of the input energy is dissipated in the process of the mutual penetration of cracks to form a macro-fracture surface. When the sample reaches its peak strength, the elastic strain energy decreases gradually until the sample failure reaches the minimum value, and the dissipative energy increases gradually until the sample failure reaches the maximum value.
3.4. Relationship between Energy Evolution and Confining Pressure
Based on the triaxial compression test data of siltstone under different confining pressures, the characteristic energy results of siltstone are calculated by substituting Equations (2), (7) and (8), as shown in Table 2. It can be seen from Table 2 that when the confining pressure is at 0 MPa, the input energy WF(pre), elastic energy WE(pre) and dissipative energy WD(pre), corresponding to the peak stress of the siltstone sample, are 13.97 J, 11.97 J and 2.00 J, respectively. Most of the input energy before the peak of the sample is transformed into storable elastic energy, and only a small amount of the energy is dissipated in the process of damage deformation and of crack propagation of the sample, indicating that the energy storage capacity of the sample is strong, Therefore, the elastic property is the source power of the specimen failure. When the confining pressure is at 20 MPa, the input energy WF(pre), elastic energy WE(pre) and dissipative energy WD(pre), corresponding to the peak stress of the siltstone sample, are 91.46 J, 52.01 J and 39.45 J respectively. The elastic energy that was stored before the peak accounts for 56.8% of the input energy. The energy dissipated via the damage and deformation of the sample accounts for 43.2% of the input energy, indicating that the energy storage capacity of the sample is weakened at this time. The energy required for specimen failure is involved in the work provided by the external testing machine, and the self-sustaining fracture ability of the specimen is weak.
The evolution law of input energy, elastic strain energy and dissipative energy of the siltstone sample with confining pressure is shown in Figure 4. It can be seen from Figure 4, that with the increase of confining pressure, the three energies increase at different rates, the input energy and dissipative energy are in an exponential function proportional relationship with the confining pressure, the elastic energy is in a linear function proportional relationship with the confining pressure, and the storage rate of elastic strain energy gradually increases, indicating that the confining pressure has an obvious restrictive effect on crack propagation, thus limiting the siltstone sample to the failure state.
4. Criterion for Determining Rock Damage Threshold
The yield criterion of rock materials generally included the following three categories: the yield criterion established from the angle of stress, strain and energy [24]. There are abundant yield criterion that are established from the angle of stress, mainly the Mises criterion, the Drucker-Plager criterion, the Mohr–Coulomb criterion, the Hoek–Brown criterion and the double shear strength criterion. Among them, the Mohr–Coulomb criterion is the most widely used, is applicable to both plastic and brittle rocks, and can reflect the characteristic that the tensile strength of rock is less than the compressive strength. However, the criterion does not consider the influence of the intermediate principal stress on rock yield, and the envelope line of the criterion on the meridional plane is a straight line, indicating that the internal friction angle does not change with hydrostatic pressure; this is inconsistent with the test results of rock mechanics [25,26]. The Drucker–Plager criterion considers the influence of intermediate principal stress on rock yield, but it cannot distinguish the difference between the tensile meridian and compressive meridian of rock, which is inconsistent with the triaxial test results of rock [27]. Double shear strength criterion is only applicable to materials for which the shear, tensile and compressive strength meet a certain relationship [28]. The accuracy of establishing yield criterion from the point of view of stress depends on the description of yield stress, and the expression does not include material parameters, so its application range is limited. The establishment of a yield criterion from the perspective of energy can accurately express the yield state of rock with the assistance of the description of energy evolution. Therefore, the establishment of an energy yield criterion across a wide range of applications is a fundamental method to analyze the yield deformation of rock.
The yield criterion is established from the perspective of energy, mainly by determining the functional relationship between the strain energy during material yield [29]. The mises energy criterion defines the maximum shape change of specific energy as a constant, but this criterion cannot reflect the characteristics of the different tensile and compressive strengths of rock materials. Gao Hong et al. [30] proposed the three-shear energy yield criterion of rock materials based on the maximum strain specific energy, and introduced the expression of shear strain energy by considering the internal friction angle. The criterion is simple and is a generalization of many common yield criteria. However, the three-shear energy yield criterion assumes that the sum of the shear strain energy of a composite sliding surface at the time of the material yield is a constant, and does not consider the influence of hydrostatic pressure on the material yield, which leads to a considerable difference between and the test results of rock materials.
In conclusion, it is highly necessary to establish a yield criterion that can reflect the internal friction characteristics and hydrostatic pressure effects of rock materials. Based on the test results, this paper explores the functional relationship between the sum of the shear strain energy of the three composite sliding surfaces and the hydrostatic pressure during rock yield, and establishes an improved three-shear energy yield criterion.
4.1. Three-Shear Energy Yield Criterion
The three-shear energy yield criterion assumes that the sum of the shear strain energy of the three composite sliding surfaces is constant when the rock material yields. For the rock material with internal friction characteristics, plays a vital role in the rock yield. The following is a simple derivation of . It agrees that the compressive stress is positive in the derivation process.
The limit value of the shear strain energy of the three yield sliding surfaces of rock mass is:
where, G is the shear modulus.
The three-shear energy yield criterion considers that the rock material begins to yield when the sum of the shear strain energy of the three maximum friction angle action surfaces reaches a certain value, as follows:
In the case of uniaxial compression, , the value of is obtained:
where, is the cohesion of rock at yield.
4.2. Improved Three-Shear Energy Yield Criterion
The research results of Hao Tiesheng et al. [31] reveals that the sum of shear strain energy of three composite sliding surfaces during rock yield is not constant, and rock yield has an obvious hydrostatic pressure effect. Therefore, the functional relationship between the sum of the shear strain energy during rock yield and the hydrostatic pressure is established as follows:
where, p is the hydrostatic pressure and Ws is the shear strain energy of rock.
In order to establish the functional relationship between the sum of shear strain energy and hydrostatic pressure, by considering the sum of shear strain energy Ws as the ordinate and hydrostatic pressure p as the abscissa, the variation law of the sum of shear strain energy of the three composite sliding surfaces with hydrostatic pressure during rock yield can be obtained. The two approximate accordance with the first-order functional relationship, so the energy yield criterion of siltstone is as follows [31]:
where, a and b are material parameters, representing the numerical relationship between shear strain energy and hydrostatic pressure and the rock yield, is the internal friction angle when rock yield and G is the shear modulus of rock.
5. Establishment of Damage Constitutive Model of Siltstone
5.1. Damage Constitutive Relationship
Assuming that the rock is an isotropic material, according to J. Lemaitre’s [32] strain equivalence hypothesis, the constitutive relationship of the rock is established as follows:
where, is the nominal stress of the rock micro-element, is the effective stress of the rock micro-element, is the stress on the damaged part of the rock micro-element, and D is the damage variable.
Since the damaged part of the rock is closely associated with the undamaged part of the rock, according to the deformation coordination principle, , the undamaged part of the rock obeys Hooke’s law, and its stress is:
Equation (23) can be written as:
The damage of the rock micro-element can be defined as the result of the reduction of stiffness caused by the change of physical properties of undamaged micro-element. The stress of damaged micro-element and undamaged the micro-element under the external load is related to the stiffness, and is defined as the damage correction coefficient [33]. Based on the rock damage mechanism, the damage models of rock micro-elements in different states can be established.
(1) When the rock is not damaged:
(2) When random damage occurs to rock:
From the stress distribution relationship between damaged micro-elements and undamaged micro-elements, it can be concluded that:
Substituting to formula (26) to obtain:
(3) When the rock is completely damaged:
Substituting Equation (23) into Equation (28) yields:
Equation (30) is the damage constitutive equation of rock. To establish the damage constitutive model of rock, the damage variable must first be determined.
5.2. Damage Evolution Equation of Siltstone
In each stage of rock damage and failure, the thermodynamic change of the system is regarded as a process in which the equilibrium is broken and then reconstructed. When the rock is damaged and deformed, the equilibrium state of the system is broken. When the energy dissipation tends to be stable, the system reaches a new equilibrium state. The energy dissipation process of rock damage and deformation conforms to the minimum energy dissipation principle. According to the minimum energy dissipation principle, all energy dissipation processes occur along the minimum energy dissipation path under corresponding constraints. It illustrates that the instantaneous energy dissipation rate is at the minimum at any time in the energy dissipation process. In the elastic damage model, it is assumed that the irreversible strain caused by damage is the only energy dissipation mechanism in the rock failure process [23]. The energy consumption rate of rock is defined as:
where, is the rock energy consumption rate, is the nominal stress of rock micro element, and is the irreversible strain rate caused by damage.
The three-dimensional constitutive relationship of rock can be obtained from Equation (30) as follows:
where, is the damage variable at t time.
The irreversible strain rate caused by the damage variable is:
By substituting Equation (33) into Equation (31), the energy consumption rate of rock is found as follows:
For a conventional triaxial compression test, , Equation (34) can be written as:
5.3. Establishment of Damage Constitutive Model
The damage evolution equation is derived as follows:
where, , , , , , and C0 are parameters related to material properties.
Under a constant loading rate and loading path, the axial strain of the rock sample is directly proportional to time. Assuming that , the damage evolution equation is simplified as:
5.4. Parameter Identification of Constitutive Model
According to the triaxial compressive stress–strain curve of rock, when the rock is completely damaged (D = 1), Formula (30) is written as:
Two boundary conditions can be determined from the extreme value characteristics of the rock total stress–strain curve. The peak stress of the rock is and the corresponding strain is . The two boundary conditions are as follows:
where , , .
Substitute conditions into Formula (30) to obtain:
In the triaxial compression test, the peak stress and peak strain of rock are not the peak strength and corresponding strain of the rock deviatoric stress–strain curve, because the starting point of the test curve provides that the rock is subjected to deviatoric stress, ignoring the initial strain of the rock under hydrostatic pressure, therefore, the relationship between the theoretical peak value and the test peak value of rock stress–strain curve is as follows:
The initial strain can be obtained from the first equation in formula (24):
The values of and are as follows:
5.5. Verification of Damage Constitutive Model
In order to verify the applicability and rationality of the damage constitutive model that considers the rock residual strength proposed in this paper, the conventional triaxial compression tests of siltstone under different confining pressure conditions (5 MPa, 10 MPa, 15 MPa and 20 MPa) are carried out. The mechanical parameters of the rock samples are as follows: average uniaxial compressive strength , cohesion c = 12.94 MPa, internal friction angle and Poisson’s ratio . The parameters of the improved three-shear energy criterion are obtained by linear regression, , . The calculated parameters of the constitutive model are shown in Table 3. The parameters of the damage statistical model are substituted into the formula, and the theoretical curve is created, which is compared with the test curve of the conventional triaxial compression under four confining pressures, as showed in Figure 5.
Figure 5 presents the comparison results of the theoretical curves and the test curves under different confining pressures. It can be seen from Figure 5 that the damage constitutive equation of siltstone proposed in this paper can better reflect the actual mechanical behavior of rock, and its initial deformation modulus and peak strength are approximately the same as the test results. The consistency between the constitutive model curve and the test curve is high, which overcomes the defect in some constitutive models that cannot describe the residual strength in the post peak stage, improves the accuracy of the model, and illustrates that the constitutive model based on the energy principle is more reasonable than the traditional constitutive model.
In order to further verify the rationality of the damage constitutive model of siltstone that has been established in this paper, the deviation between the conventional triaxial stress–strain curve and the model curve of siltstone under four different confining pressures is analyzed, and the calculation formula is shown in Formula (48).
where, is the standard deviation, is the relative standard deviation, are the test value and theoretical value respectively, is the mean value of the test value and n is the number of samples.
The calculation results show that when the confining pressure is at 5, 10, 15 and 20 MPa, the relative standard deviations between the constitutive model results and the test results are 3.75%, 4.77%, 4.05% and 4.83% respectively, and the average relative standard deviation is 4.35%, indicating that the difference between the constitutive model results and the test results is minute, which further proves the rationality of the constitutive model that has been established in this paper.
The change curve of the damage variable with axial strain is obtained by substituting the model parameters into Equation (39), as shown in Figure 6. It can be seen from Figure 6 that the damage evolution curve is approximately an “S” curve. There is no obvious damage accumulation in the initial stage of the curve, then there is a rapid rise stage, indicating that alongside the gradual axial loading, the internal microcracks rub and squeeze each other, and the damage accumulates and converges continuously. Finally, the curve gradually flattens, indicating that the internal structure of the rock is completely destroyed. Along with the increase of the confining pressure, the development trend of cumulative damage slows, because the confining pressure inhibits the development of damage and improves the stress state of rock.
6. Conclusions
According to the stress–strain curves of siltstone under different confining pressures, the energy evolution characteristics of siltstone samples under conventional triaxial loading are analyzed, the damage constitutive model of siltstone is established, and the rationality of the model established in this paper is verified by using the conventional triaxial test data of siltstone under different confining pressures. The following conclusions are drawn:
Under different confining pressures, the input energy and dissipative energy of siltstone samples increase with the increase of axial strain, and the elastic strain energy increases at first and then decreases. When the specimen reaches the peak strength, the elastic strain energy gradually decreases and the dissipative energy gradually increases until the specimen is damaged and reaches the maximum and minimum values respectively.
Considering the internal friction characteristics and hydrostatic pressure effect of rock materials, based on the test results of siltstone samples, the three-shear energy yield criterion is improved, the functional relationship between the sum of shear strain energy and hydrostatic pressure is established, and the improved three-shear energy yield criterion is obtained.
Based on the continuous damage theory, the damage evolution equation of rock is derived using the minimum energy consumption principle and the improved three-shear energy yield criterion, and the damage constitutive model of siltstone under complex stress state is established. The model overcomes the defect of some existing damage constitutive models that cannot simulate the residual strength. By comparing the model curve with the test curve, it has been found that the margin of error is small, and the relative standard deviation is 4.35%, which verifies the rationality of the model established in this paper.
Author Contributions
Conceptualization, R.Z.; methodology, R.Z.; validation, R.Z. and L.G.; data curation, R.H.; writing—original draft preparation, R.Z.; writing—review and editing, R.Z. All authors have read and agreed to the published version of the manuscript.
Funding
This research received no external funding.
Data Availability Statement
The data used to support the findings of this study are available upon request from the corresponding author.
Conflicts of Interest
The authors declare no conflict of interest.
References
- Cai, M.F. Rock Mechanics and Engineering; Science Press: Beijing, China, 2002; pp. 149–156. (In Chinese) [Google Scholar]
- Wu, Z.J.; Ji, X.K.; Liu, Q.S.; Fan, L.F. Study of microstructure effect on the nonlinear mechanical behavior and failure process of rock using an image-based-FDEM model. Comput. Geotech. 2020, 121, 103480. [Google Scholar] [CrossRef]
- Xie, Z.Z.; Zhang, N.; Feng, X.W.; Liang, D.X.; Wei, Q.; Weng, M.Y. Investigation on the evolution and control of surrounding rock fracture under different supporting conditions in deep roadway during excavation period. Int. J. Rock Mech. Min. Sci. 2019, 123, 104122. [Google Scholar] [CrossRef]
- Zhao, C.X.; Li, Y.M.; Liu, G.; Meng, X.R. Mechanism analysis and control technology of surrounding rock failure in deep soft rock roadway. Eng. Fail. Anal. 2020, 115, 104611. [Google Scholar] [CrossRef]
- Li, X.; Cao, W.G.; Su, Y.H. A statistical damage constitutive model for softening behavior of rocks. Eng. Geol. 2012, 143–144, 1–17. [Google Scholar] [CrossRef]
- Li, H.; Liao, H.; Xiong, G.; Han, B.; Zhao, G. A three-dimensional statistical damage constitutive model for geomaterials. J. Mech. Sci. Technol. 2015, 29, 71–77. [Google Scholar] [CrossRef]
- Zhao, H.; Shi, C.; Zhao, M.; Li, X. Statistical damage constitutive model for rocks considering residual strength. Int. J. Geomech. 2016, 17, 04016033. [Google Scholar] [CrossRef]
- Zhao, H.; Zhang, C.; Cao, W.G.; Zhao, M.H. Statistical meso-damage model for quasi-brittle rocks to account for damage tolerance principle. Environ. Earth Sci. 2016, 75, 862. [Google Scholar] [CrossRef]
- Zhang, L.L.; Cheng, H.; Wang, X.J.; Liu, J.M.; Guo, L.H. Statistical damage constitutive model for high-strength concrete based on dissipation energy density. Crystals 2021, 11, 800. [Google Scholar] [CrossRef]
- Da Rabi, M.K.; Al-Rub, R.; Little, D.N. A continuum damage mechanics framework for modeling micro-damage healing. Int. J. Solids Struct. 2012, 49, 492–513. [Google Scholar] [CrossRef] [Green Version]
- Tang, C.A. Catastrophe in the Process of Rock Fracture; Coal Industry Press: Beijing, China, 1993; pp. 10–30. (In Chinese) [Google Scholar]
- Cao, W.G.; Xiang, L.I.; Zhao, H. Damage constitutive model for strain-softening rock based on normal distribution and its parameter determination. J. Cent. South Univ. Technol. 2007, 14, 719–724. [Google Scholar] [CrossRef]
- Xu, W.Y.; Wei, L.D. Study on statistical constitutive model of rock damage. Chin. J. Rock Mech. Eng. 2002, 21, 787–791. (In Chinese) [Google Scholar]
- Hoek, E. Hoek-Brown failure criterion—2002 edition. Proc. N. Am. Rock Mech. Symp. 2002, 1, 267–273. [Google Scholar]
- Li, H.Z.; Guo, T.; Nan, Y.L.; Han, B. A simplified three-dimensional extension of Hoek-Brown strength criterion. J. Rock Mech. Geotech. Eng. 2021, 13, 568–578. [Google Scholar] [CrossRef]
- Cao, R.L.; He, S.H.; Wei, J.; Wang, F. Study on statistical constitutive model of rock damage softening based on residual strength correction. Rock Soil Mech. 2013, 34, 1652–1660. [Google Scholar]
- Liu, X.S.; Ning, J.G.; Tan, Y.L.; Gu, Q.H. Damage constitutive model based on energy dissipation for intact rock subjected to cyclic loading. Int. J. Rock Mech. Min. Sci. 2016, 85, 27–32. [Google Scholar] [CrossRef]
- Gao, W.; Wang, L.; Yang, D.Y. Study on energy method of rock damage evolution. Chin. J. Rock Mech. Eng. 2011, 30, 4087–4092. (In Chinese) [Google Scholar]
- Sun, M.C.; Xu, W.Y.; Wang, S.S.; Wang, R.B.; Wang, W. Study on rock damage constitutive model based on the principle of minimum energy consumption. J. Cent. South Univ. 2018, 49, 2067–2075. (In Chinese) [Google Scholar]
- Xie, H.P.; Li, L.Y.; Peng, R.D.; Ju, Y. Energy analysis and criteria for structural failure of rocks. J. Rock Mech. Geotech. Eng. 2009, 1, 11–20. [Google Scholar] [CrossRef] [Green Version]
- Zhou, R.H.; Cheng, H.; Li, M.J.; Zhang, L.L.; Hong, R.B. Energy evolution analysis and brittleness evaluation of high-strength concrete considering the whole failure process. Crystals 2020, 10, 1099. [Google Scholar] [CrossRef]
- Wu, J. Elasticity; Higher Education Press: Beijing, China, 2011. (In Chinese) [Google Scholar]
- Zhou, Z.B. Principle of Minimum Energy Consumption and Its Application; Science Press: Beijing, China, 2001. (In Chinese) [Google Scholar]
- Li, Q.M. Strain energy density failure criterion. Int. J. Solids Struct. 2001, 38, 6997–7013. [Google Scholar] [CrossRef]
- Shen, B.T.; Shi, J.Y.; Nick, B. An approximate nonlinear modified Mohr-Coulomb shear strength criterion with critical state for intact rocks. J. Rock Mech. Geotech. Eng. 2018, 10, 37–44. [Google Scholar] [CrossRef]
- Gong, B.; Tang, C.A.; Wang, S.Y.; Bai, H.M.; Li, Y.C. Simulation of the nonlinear mechanical behaviors of jointed rock masses based on the improved discontinuous deformation and displacement method. Int. J. Rock Mech. Min. 2019, 122, 104076. [Google Scholar] [CrossRef]
- Zienkiewicz, O.C. Some useful forms of isotropic yield surfaces for soil and rock mechanics. In Finite Element in Geomechanics; John Wiley: London, UK, 1977; pp. 179–190. [Google Scholar]
- Yu, M.H.; Zan, Y.W.; Zhao, J.; Yoshimine, M. A unified strength criterion for rock material. Int. J. Rock Mech. Min. Sci. 2002, 39, 975–989. [Google Scholar] [CrossRef]
- Xie, H.P.; Li, L.Y.; Ju, Y.; Peng, R.D.; Yang, Y.M. Energy analysis for damage and catastrophic failure of rocks. Sci. China Technol. Sci. 2011, 54, 199–209. [Google Scholar] [CrossRef]
- Gao, H.; Zheng, Y.R.; Feng, X.T. Study on energy yield criterion of geotechnical materials. Chin. J. Rock Mech. Eng. 2007, 26, 2437–2443. (In Chinese) [Google Scholar]
- Hao, T.S.; Liang, W.G.; Zhang, C.T. Stability analysis of underground horizontal salt rock reservoir cavity wall based on three shear energy yield criterion. Chin. J. Rock Mech. Eng. 2014, 33, 1997–2006. (In Chinese) [Google Scholar]
- Lemaitre, J. How to use damage mechanics. Nucl. Eng. Des. 1984, 80, 233–245. [Google Scholar] [CrossRef]
- Li, T.; Lyu, Y.X.; Zhang, S.L.; Sun, J.C. Development and application of a statistical constitutive model of damaged rock affected by the load-bearing capacity of damaged elements. J. Zhejiang Univ. Sci. A (Appl. Phys. Eng.) 2015, 16, 644–655. [Google Scholar] [CrossRef] [Green Version]
Figure 1.
Rock mechanics test system.

Figure 2.
Conventional triaxial test results of siltstone samples: (a) Full stress–strain curves of siltstone under different confining pressures; (b) Failure characteristics of siltstone samples.
Figure 2.
Conventional triaxial test results of siltstone samples: (a) Full stress–strain curves of siltstone under different confining pressures; (b) Failure characteristics of siltstone samples.

Figure 3.
Energy evolution curve of siltstone under different confining pressures: (a) 0 MPa; (b) 5 MPa; (c) 10 MPa; (d) 15 MPa; (e) 20 MPa.
Figure 3.
Energy evolution curve of siltstone under different confining pressures: (a) 0 MPa; (b) 5 MPa; (c) 10 MPa; (d) 15 MPa; (e) 20 MPa.

Figure 4.
Characteristic energy of siltstone under different confining pressures.

Figure 5.
Comparison between model curve and test curve: (a) 5 MPa; (b) 10 MPa; (c) 15 MPa; (d) 20 MPa.
Figure 5.
Comparison between model curve and test curve: (a) 5 MPa; (b) 10 MPa; (c) 15 MPa; (d) 20 MPa.

Figure 6.
Variation curve of damage variable with axial strain.


Table 1.
Mechanical parameters of siltstone under conventional triaxial test.
| E/GPa | ||||||
|---|---|---|---|---|---|---|
| 0 | 49.40 | 4.01 | 12.69 | 5.24 | 17.4 | 0.27 |
| 5 | 75.57 | 4.32 | 34.86 | 5.93 | 17.6 | 0.26 |
| 10 | 95.45 | 4.72 | 61.29 | 6.37 | 20.0 | 0.26 |
| 15 | 115.09 | 5.26 | 64.54 | 8.17 | 21.0 | 0.25 |
| 20 | 134.38 | 5.81 | 86.40 | 9.80 | 21.5 | 0.25 |
Notes: is the confining pressure, is the peak stress, is the peak strain, is the residual stress, is the strain corresponding to the residual stress, is the elastic modulus and is the Poisson’s ratio.
Table 2.
Calculation results of characteristic energy of siltstone sample at peak stress.
| 0 | 13.97 | 11.97 | 2.00 |
| 5 | 34.87 | 26.00 | 8.87 |
| 10 | 43.95 | 32.37 | 11.58 |
| 15 | 67.82 | 41.38 | 26.44 |
| 20 | 91.46 | 52.01 | 39.45 |
Table 3.
Parameter values of constitutive model under different confining pressures.
| A | B | C | H | |||
|---|---|---|---|---|---|---|
| 5 | 3.28 × 10⁻⁵ | −7.10 × 10⁻⁵ | 1.54 × 10⁻⁴ | −1.94 × 10⁻⁸ | 11,250 | −2.28 |
| 10 | 2.89 × 10⁻⁵ | −6.25 × 10⁻⁵ | 1.35 × 10⁻⁴ | −1.71 × 10⁻⁸ | 20,533 | −3.65 |
| 15 | 2.75 × 10⁻⁵ | −5.95 × 10⁻⁵ | 1.29 × 10⁻⁴ | −1.63 × 10⁻⁸ | 10,435 | −2.19 |
| 20 | 2.68 × 10⁻⁵ | −5.81 × 10⁻⁵ | 1.26 × 10⁻⁴ | −1.59 × 10⁻⁸ | 7784 | −1.76 |
Publisher’s Note: MDPI stays neutral with regard to jurisdictional claims in published maps and institutional affiliations. |
© 2021 by the authors. Licensee MDPI, Basel, Switzerland. This article is an open access article distributed under the terms and conditions of the Creative Commons Attribution (CC BY) license (https://creativecommons.org/licenses/by/4.0/).
Share and Cite
MDPI and ACS Style
Zhou, R.; Guo, L.; Hong, R. Study on Energy Evolution and Damage Constitutive Model of Siltstone. Crystals 2021, 11, 1271. https://0-doi-org.brum.beds.ac.uk/10.3390/cryst11111271
AMA Style
Zhou R, Guo L, Hong R. Study on Energy Evolution and Damage Constitutive Model of Siltstone. Crystals. 2021; 11(11):1271. https://0-doi-org.brum.beds.ac.uk/10.3390/cryst11111271
Chicago/Turabian StyleZhou, Ruihe, Longhui Guo, and Rongbao Hong. 2021. "Study on Energy Evolution and Damage Constitutive Model of Siltstone" Crystals 11, no. 11: 1271. https://0-doi-org.brum.beds.ac.uk/10.3390/cryst11111271
Note that from the first issue of 2016, this journal uses article numbers instead of page numbers. See further details here.