Article

Design of Metal-Organic Polymers MIL-53(M3+): Preparation and Characterization of MIL-53(Fe) and Graphene Oxide Composite

by
Quang K. Nguyen
1,*,
Galina M. Kuz’micheva
1,*,
Evgeny V. Khramov
2,
Roman D. Svetogorov
2,
Ratibor G. Chumakov
2 and
Thuy T. Cao
3
1
Physico-Technological Institute, Department of Digital and Additive Technologies, MIREA-Russian Technological University of the Ministry of Education and Science of the Russian Federation, 119454 Moscow, Russia
2
National Research Center «Kurchatov Institute», 123182 Moscow, Russia
3
Department of Vehicle and Energy Engineering, Phenikaa University, Yen Nghia, Ha-Dong District, Hanoi 12116, Vietnam
*
Authors to whom correspondence should be addressed.
Submission received: 3 October 2021 / Revised: 14 October 2021 / Accepted: 18 October 2021 / Published: 22 October 2021
(This article belongs to the Special Issue Frontiers of Applied Crystal Chemistry)

Abstract

:
This article presents a crystal chemical analysis, generalization, and systematization of structural characteristics of metal-organic polymers MIL-53(M3+) with M = Al, Cr, Ga, and Fe. The division of the MIL-53(M3+) structures into a morphotropic series was performed, which made it possible to predict the formation of new compounds or solid solutions with the corresponding composition and structure. The change in the symmetry of MIL-53(M3+) and the causes of polymorphs formation are explained on the basis of crystal chemical rules. The efficiency of the revealed regularities in the structural characteristics of the MIL-53(M3+) phases were experimentally confirmed for MIL-53(Fe) and composite MIL-53(Fe)/GO (GO-graphene oxide) by several methods (powder X-ray, X-ray absorption, and photoelectron spectroscopy). For the first time, different coordination numbers (CN) (CNFe = 4.9 for MIL-53(Fe)—two types of coordination polyhedra with CNFe = 6 and CNFe = 4; CNFe = 4 for MIL-53 (Fe3+)/GO) and the formal charges (FC) of iron ions (variable FC of Fe (2+δ)+ in MIL-53(Fe3+) and Fe2+ in MIL-53(Fe3+)/GO) were found. These experimental data explain the higher photocatalytic activity of MIL-53(Fe3+)/GO in photo-Fenton reactions—RR195 decomposition.

Graphical Abstract

1. Introduction

Metal-organic frameworks (MOFs) represent a relatively new class of hybrid materials consisting of ions or metal clusters connected by organic molecules (linkers) into a one-, two- or three-dimensional frame with cavities (voids) of different sizes. Due to their structure, MOFs are used for gas storage [1], drug delivery [2], in catalysis [3], and the separation and removal of pollutants from the aquatic environment [4]. Much attention is paid to the type of cation and the composition of the organic linker, since their combination realizes the structural diversity of MOFs and their multifunctionality.
Knowledge of the composition and structural characteristics of MOF, which are revealed by structural analysis, allows the a priori selection of one or another compound for specific purposes, in order to model and predict the production of new substances with the required combination of properties and to control them. However, determining the crystal structure of MOFs is a rather time consuming and laborious process that requires specialized skills and appropriate software. The use of crystal-chemical provisions allows us to propose the most probable structure for a given composition, and to combine different compounds according to topological characteristics, or vice versa, to separate compounds. Phases of the same structure make it possible to obtain the necessary structural information in a short time, greatly simplifying the visualization of the crystal structure of compounds of complex compositions, to which MOFs belong, and facilitating many calculations. This was the motivation for this work, which is based on such crystal chemical concepts as structure and superstructure, isostructural and isotypic compounds, isomorphs and polymorphs, and homeotypy and homology [5].
MIL-53 (MIL: Matériaux de l′Institut Lavoisier) belongs to the class of MOFs. MIL-53 is a very porous and flexible material. The MIL-53 structures have attracted a great amount of interest because of their “breathing effect” in which their pore cross-section changes reversibly, resulting in their flexibility and response to external stimuli. MIL-53 is mainly used for adsorption, separation, delivery and photocatalysis. In particular, MIL-53(Fe) should be mentioned. MIL-53(Fe) has a stable skeleton, strong coordination bonds, Fe-O clusters and a narrow band gap that makes them easily excited by visible light. Due to its relatively high chemical and water stability, non-toxicity and light sensitivity, MIL-53(Fe) can act as an alternative photocatalyst for the efficient degradation of toxic organic compounds. In this article, the well-known metal-organic structures of MIL-53(M3+) with M = Al, Cr, Ga, Fe (linker BDC—terephthalic acid, or benzenedicarboxylic-1,4 acid, or 1,4-dicarboxybenzene), differing in composition and symmetry, the features of MIL-53(Fe) and the composite MIL-53(Fe)/GO with graphene oxide (GO) are explained and experimentally confirmed, using the programs Diamond, Mercury and new software [6].
Crystallochemical analysis MIL-53(M3+) with M3+ = Al3+, Cr3+, Ga3+, Fe3+
Based on findings in the literature, Table 1 shows the results of systematization of the synthesis and crystallographic characteristics of samples with a functional basis MIL-53(M3+). According to the methods (conditions) of preparation, composition, unit cell parameters and symmetry, all samples are divided into six groups of isostructural phases (commonly designated as MIL-53as (as: as-synthesized, with the inclusion of terephthalic acid), MIL-53ht (ht: high temperature, the solid obtained after removing the free acid from MIL-53as by calcination at high temperature), MIL-53lt (lt: low temperature, the solid obtained due to MIL-53ht adsorbed by atmospheric water of at low temperature), associated with the conditions of receipt):
-
M(OH)(BDC)2− x(H2BDC)≡MIL-53(M3+) (as) c M=Al, Cr—structure (phase) I;
-
M(OH)(BDC)2− ≡ MIL-53(M3+) (ht) c M=Al, Cr—structure (phase) II;
-
M(OH)(BDC)2− xH2O≡MIL-53(M3+) (lt) c M=Al, Cr—structure (phase) III;
-
M(OH)(BDC)2−≡MIL-53(M3+) (ht) c M=Ga, Fe—structure (phase) IV;
-
M(OH)(BDC)2− x(H2O)≡MIL-53(M3+) (lt) c M=Ga, Fe—structure (phase) V (superstructure to structure III).
-
M(OH)(BDC)2− ≡ MIL-53(M3+) (int) c M=Fe—structure (phase) VI.
H2BDC—terephthalic acid, or benzenedicarboxylic-1,4 acid
Crystals 11 01281 i001
(BDC)2−—anion (C8H4O4)2−, combined with M3+ cations in the MIL-53(M3+) structure
Crystals 11 01281 i002
The isostructural nature of the phases and their combination within the framework of I-VI is confirmed by the similarity of the theoretical diffraction patterns (Figure 1, Figure 2, Figure 3, Figure 4, Figure 5, Figure 6). According to the definition of “isostructural phases (compounds)” [11], the phases IV and V with M = Ga, Fe are not isostructural (a group of compounds is described by one structural model up to similarity), but are isotypic (the similarity of structures is not observed) [5]. This crystallochemical feature indicates a small, but nevertheless apparent, difference between the structures with M = Ga and Fe, which affects the shape of the diffraction patterns (Figure 5).
Morphotropy (structural change in a regular series of compounds of the same composition) is associated with isostructurality [5]: MIL-53(M3+) (ht) and MIL-53(M3+) (lt) phases (Table 1) form morphotropic series:
M=Al, Cr (ht) (sp.gr. Imcm; phase II) (Figure 2)→M=Ga, Fe (ht) (sp.gr. C 2/c; phase IV) (Figure 4);
M=Al, Cr (lt) (sp.gr. C 1 c 1; phase III) (Figure 3)→M=Ga, Fe (lt) (sp.gr. P 1 21/c 1; phase V (Figure 5).
The morphotropic series is also expected for phase I (MIL-53)(M3+; as).
The cause of the morphotropic [5] MIL-53(M3+) with M3+=Al3+, Cr3+, Ga3+, Fe3+ non-dimensional factor (rAlVI = 0.535Å, rCrVI = 0.615Å ≈ rGaVI = 0.620Å), rFeVI ~ 0.68Å, where rMVI, Å—ion radius M3+ c KЧ = 6 according to system [12] is as might be expected, and the polarization χAl = 1.61 and χCr = 1.65, χGa = 1.76 and χFe = 1.80 (χ, rel. units—“spectroscopic” electronegativity according to Allen). Knowing the magnitude of electronegativity and the size of the M ions makes it possible to search for new compounds with a specific composition and structure or to explain the unreality of their preparation, including the conversion of MIL-53(M3+) into another type of MOF or the production of non-single-phase samples subject to the synthesis conditions (Table 1). Thus, phases with M3+ = V (rVVI = 0.64Å, χV = 1.53) [13], Sc (rScVI = 0.745Å, χSc = 1.19) [14], and In (rInVI = 0.8Å, χIn = 1.66) [15], and are obtained by the hydrothermal method under different conditions (temperature, duration of the process) and synthesis than those presented in Table 1 which crystallize in other types of structures.
Wide isomorphism (substitutional solid solutions with large regions of homogeneity) is realized at close values of ionic radii, with values of electronegativity for phases with the same or derivative structures [8]. Mixed-metal (cation) MIL-53 materials with wide areas of solid solutions can be expected within one morphotropic series. If solid solutions are formed by phases from different morphotropic series, then limited solid solutions should be formed or even a lack of solubility in the direct synthesis of components may result. In any case, the homogeneity region is wider on the side of the cation with a larger ionic radius (polarity rule). Thus, solid solutions with the MIL-53(M3+) structure are obtained by the combination (BDC)2− with ions M = M1 + M2. Many groups have reported MIL-53 bimetallic materials with trivalent metal combinations: Fe/V, Fe/Cr, Al/Fe, Al/Cr, Al/Ga, Al/V, …, [16,17,18,19,20,21]. In addition, MIL-53(M3+) mixed linker (anionic) materials are known, and the structure of which contains different linkers with different ratios has the same crystallographic positions. In this case, the structure (symmetry) of the phases can either change [22,23], or the range of sizes of M3+ ions and the region of solid solutions within the framework of one type of structure can significantly expand (assistance rule).
Phases I and III can be defined as “pseudopolymorphs” with a generalized formula M(OH)(BDC)−2 xG, where G—guest molecule (BDC ≡C8H6O4 ≡ H2BDC) or H2O, i.e., respectively, solvate and hydrate of MIL-53(M3+) phase with structure II. The same applies to the phases IV and V: phase V is a pseudopolymorphs (hydrate) of phase IV. Removal of G molecules from the composition of phases I (Figure 1) at ~300 °C with the formation of phases II (Figure 2) increases the symmetry from the P cell to the I cell Bravais cell with orthorhombic symmetry, and the hydration of phases II (Table 1, Figure 2) lowers the symmetry from orthorhombic with sp. gr. Imcm to monoclinic with sp. gr. Cc or C2/c (Table 1). An increase in symmetry from the P to C cell is observed upon dehydration of phase V with G = H2O (sp.gr. P 1 21/c 1), with transformation into phase IV (sp.gr. C 1 2/c 1) (Figure 5). At the same time, the form of theoretical diffractograms of phases I-III (Figure 1, Figure 2, Figure 3) and IV and V (Figure 4 and Figure 5) are visually the same. Hence, it follows that the absence of G molecules in the framework of the structures of MIL-53(M3+) (ht) phases, with a simplified composition, decreases the number of crystallographic positions occupied by the phase components and increases the symmetry (Groot’s rule).
MIL-53(Fe) (ht) (Table 1, Figure 4) and MIL-53(Fe) (int) (Table 1, Figure 6) are polymorphs (the same composition, but with different crystal structures depending on intense external influences) [5]: the transformation of a phase with structure IV (sp.gr. C 1 2/c 1) into structure VI (sp.gr. P ̅1̅) occurs with decreasing temperature (Table 1). This is consistent with the rule of crystal chemistry: the transition from a low-symmetry to a more symmetrical polymorphic phase is facilitated by an increase in temperature [11,24]
Structure V (Table 1, Figure 5) can be described as a superstructure to structure III (Table 1, Figure 3), with a doubled cell parameter b, which is confirmed by comparing the theoretical diffraction patterns of phases III and V. In this case, we are talking about the order-disorder transition with a change in the cell parameters and symmetry [5], which occurs within phases of the same composition and refers to kinetic phase transformations [25,26].
Despite the phase separation of MIL-53(M3+), according to crystallochemical characteristics, all structures I-VI are topologically identical. By its structure, MIL-53(M3+) refers to framework structures: MO6 octahedra (more precisely, MO4(OH)2), linked by oxygen atoms with (BDC)2− ((C8H4O4)2−) form channels along <001> (Figure 1, Figure 2, Figure 3, Figure 4, Figure 5, Figure 6), which can contain water molecules or BDC (C8H6O4). Diffraction peaks with symbols hh0 (Figure 1a, Figure 2a, Figure 3a, Figure 4a, Figure 5a, Figure 6a) are responsible for the composition of the framework of the structure (Figure 1b, Figure 2b, Figure 3b, Figure 4b, Figure 5b).
Depending on M3+, the type and content of G, the parameters a and b of the unit cell and its volume change (Figure S1) and, hence, so too the diameters of the voids, which were estimated according to the program [6].
It should be noted (Figure 7) that the largest size of voids is in phases I and III with M = Al, Cr, and in phases VI and V with M = Ga, Fe. There are two types of voids with different sizes, which emphasizes the difference in the superstructure V to structure III from structure III (Table 1, Figure 3 and Figure 5).
On the other hand, the crystal structures of MIL-53(M3+) can be represented as chain structures: MO6 octahedra are connected by vertices, and form endless chains along <001>, which are combined with each other by terephthalic acid ions (BDC)2− ((C8H4O4)2−). Diffraction reflections h00 (Figure 1a, Figure 2a, Figure 3a, Figure 4a, Figure 5a, Figure 6a) are related to the composition of the octahedron chains (Figure 1b, Figure 2b, Figure 3b, Figure 4b, Figure 5b, Figure 6b). This description of the MIL-53(M) structures explains the almost identical cell parameters for them with ~6.6–6.9Å, which is determined by the size of the M3+ (c~4 (rM + RO), where rM and RO - are the metal and oxygen radii, respectively) (Figure 8), and makes it possible to judge the composition of the chains, in particular, the composition of the M position in the case of solid solutions or other coordination of the M ion, including the formal charge (FC) M.
Analyzing the diffraction patterns together with the projections of the structures (Figure 1, Figure 2, Figure 3, Figure 4, Figure 5, Figure 6), one can distinguish the most intense peaks at 200 and 110 (Figure 1, Figure 2, Figure 3 and Figure 4), 200 and 120 (Figure 5), 010, 100 and 120 (Figure 6), which are responsible for the local environment of the iron and the configuration of the framework. Any change in the intensity of these strong reflections, shift or spreading, can be indicative of a change in composition and structure (frame shape).
Summing up the results of the crystallochemical consideration of MIL-53(M3+) phases with M=Al, Cr, Ga, Fe, it can be concluded that the MIL-53(Fe) phases differ significantly from the other phases. This is why the phase with MIL-53(Fe) was chosen for further study.

2. Materials and Methods

2.1. Materials

Fe(NO3)3.9H2O (ACS reagent, ≥98%), terephthalic acid (H2BDC, Aldrich 98%), N,N’-dimethylformamide (DMF, ACS reagent, 99.8%), and other reagents were purchased from Sigma-Aldrich, (St. Louis, MI, USA). All reagents were used as received and without any further purification.

2.2. Synthesis of MIL-53 (Fe) and MIL-53 (Fe)/GO

MIL-53(Fe) (Q8) and MIL-53(Fe)/GO (GO-graphene oxide) were prepared by the one-step hydrothermal method, according to the previous procedures presented in [27,28], respectively. Graphene oxide (GO) was obtained by chemical oxidation of graphite by the modified Hammers method [29].
Typically, MIL-53(Fe)/GO composite (Q1) was synthesized by the directly growing MOFs on GO layers as follows. Firstly, 4.11 g of Fe(NO3)3 9H2O and 3.39 g of terephthalic acid were dissolved in 150 mL of DMF. Subsequently, 0.5 g of GO was added to the mixture under vigorously stirring. The mixture was then transferred into a Teflon-lined autoclave and heated at 150 °C for 16 h. The black solid was extracted with water and acetone, followed by twice washing with 95% methanol, and then dried at 80 °C for 12 h. The product was stored in a desiccator. Similarly, MIL-53(Fe) was prepared via a similar procedure for MIL-53(Fe)/GO composite without the GO adding. The as-prepared MIL-53(Fe) was yellow.

2.3. Material Characterization

The resulting MIL-53(Fe) and MIL-53(Fe)/GO samples were characterized by X-ray diffraction (XRD), X-ray absorption (XAS) and photoelectron (XPS) spectroscopy.

2.3.1. X-ray Powder Diffraction (XRD)

X-ray photography of the samples was carried out on an HZG-4 diffractometer (graphite monochromator): CuKα radiation, 5 s pulse acquisition time, 0.05° step size, and scattering angle (2θ) of 2–50°. Qualitative analysis was performed using the PDF4+ database. The samples were also characterized by high-resolution powder diffraction at the XSA beamline of the Kurchatov synchrotron radiation source (λ = 0.74 Å, Si monochromator) [30]. Measurements were carried out using a Rayonix SX165 CCD detector, and the sample-detector distance was 150 mm, with a 29.5° tilt angle, which made it possible to significantly improve the angular resolution while maintaining a sufficient angular range. The diffraction patterns were transformed to the standard form I (2θ) by the azimuthal integration, using Dionis software [Svetogorov R.D. “Dionis—Diffraction Open Integration Software”, certificate of registration № 2018660965], and full-profile analysis was carried out using the Jana2020 software [31].

2.3.2. X-ray Absorption Spectroscopy (XAS)

The samples were measured by X-ray absorption spectroscopy (EXAFS/XANES) at the Structural Materials Science (STM) station of the Kurchatov synchrotron radiation source [32]. Energy scanning was performed using a single-crystal monochromator with a cutout Si (111), providing an energy resolution of ~1 eV. The K-edge spectra of Fe standards (iron foil and iron oxide powders) were recorded in the transmission mode using two air ionization chambers, the spectra of the samples—in the fluorescence mode with an Amptek X-123 SDD semiconductor detector. The primary processing of the spectra was performed using the IFEFFIT software package [33]. The Fourier transforms of the normalized EXAFS function with the weight coefficient k2 were extracted in the range k = 2—12 Å−1.

2.3.3. X-ray Photoelectron Spectra (XPS)

X-ray photoelectron spectra (XPS) were collected on an ESCA unit of the NanoPES synchrotron station (Kurchatov synchrotron radiation source, National Research Center Kurchatov Institute) equipped with high-resolution SPECS Phoibos 150 hemispherical electron energy analyzer with monochromatic Al X-ray source (excitation energy 1486.61 eV, ∆E = 0.2 eV). All samples were pressed into carbon tape and placed in the vacuum chamber of the spectrometer with a base pressure of 1 × 10⁻⁹ mbar for measurements in constant transmission energy mode with pass energies of 120 and 40 eV for the survey and the fine structure of individual lines, respectively. The acquired spectra were analyzed in CasaXPS [34] software. The NIST laboratory database [35] was used to identify the position of the peaks.

2.4. Testing of Photocatalytic Properties

Azo acid dyes RR195 are commonly used in scientific laboratories, textiles and other industries and can enter wastewater (about 10–15%), which requires their removal from water systems. The photo-Fenton reaction was evaluated using model decomposition reactions of reactive red 195 (RR195; Reactive Red 195) with azo groups (-N = N-) that are linked to an aromatic moiety.
The initial concentration (CO, mg/L) of RR195 in aqueous solution is 100 mg/L, the concentration of photocatalyst is 0.3 g/L and H2O2 concentration is 136 mg/L. The photo-Fenton reaction was carried out in a double-wall cylindrical glass reactor (water was passed between the walls of the reactor to maintain a constant temperature of 25 °C). The photoreaction mixture was stirred on a magnetic stirrer at a constant rotation speed. The simulated sunlight irradiation was applied by using UV-A range lamps (four lamps, with power of 15 W for each lamp) which were located at 5 cm distance from the reactor. The emission spectrum was between 400 nm and 800 nm. The concentration of organic pollutants in solution was measured every 10 min using a Lambda 35 UV–vis spectrophotometer. The band intensity for calibration was chosen at 542 nm.
The reaction kinetics of the photocatalytic decomposition of RR195 in aqueous medium in the presence of a photocatalyst can be described by the pseudo-first-order kinetic equation:
−ln(C/Co) = kτ
where CO is the RR195 concentration at zero time taking into account adsorption; C is the RR195 concentration after UV irradiation for τ time; τ is the duration of UV irradiation; and k is the effective rate constant of photocatalytic decomposition of RR195 molecules.

3. Results and Discussion

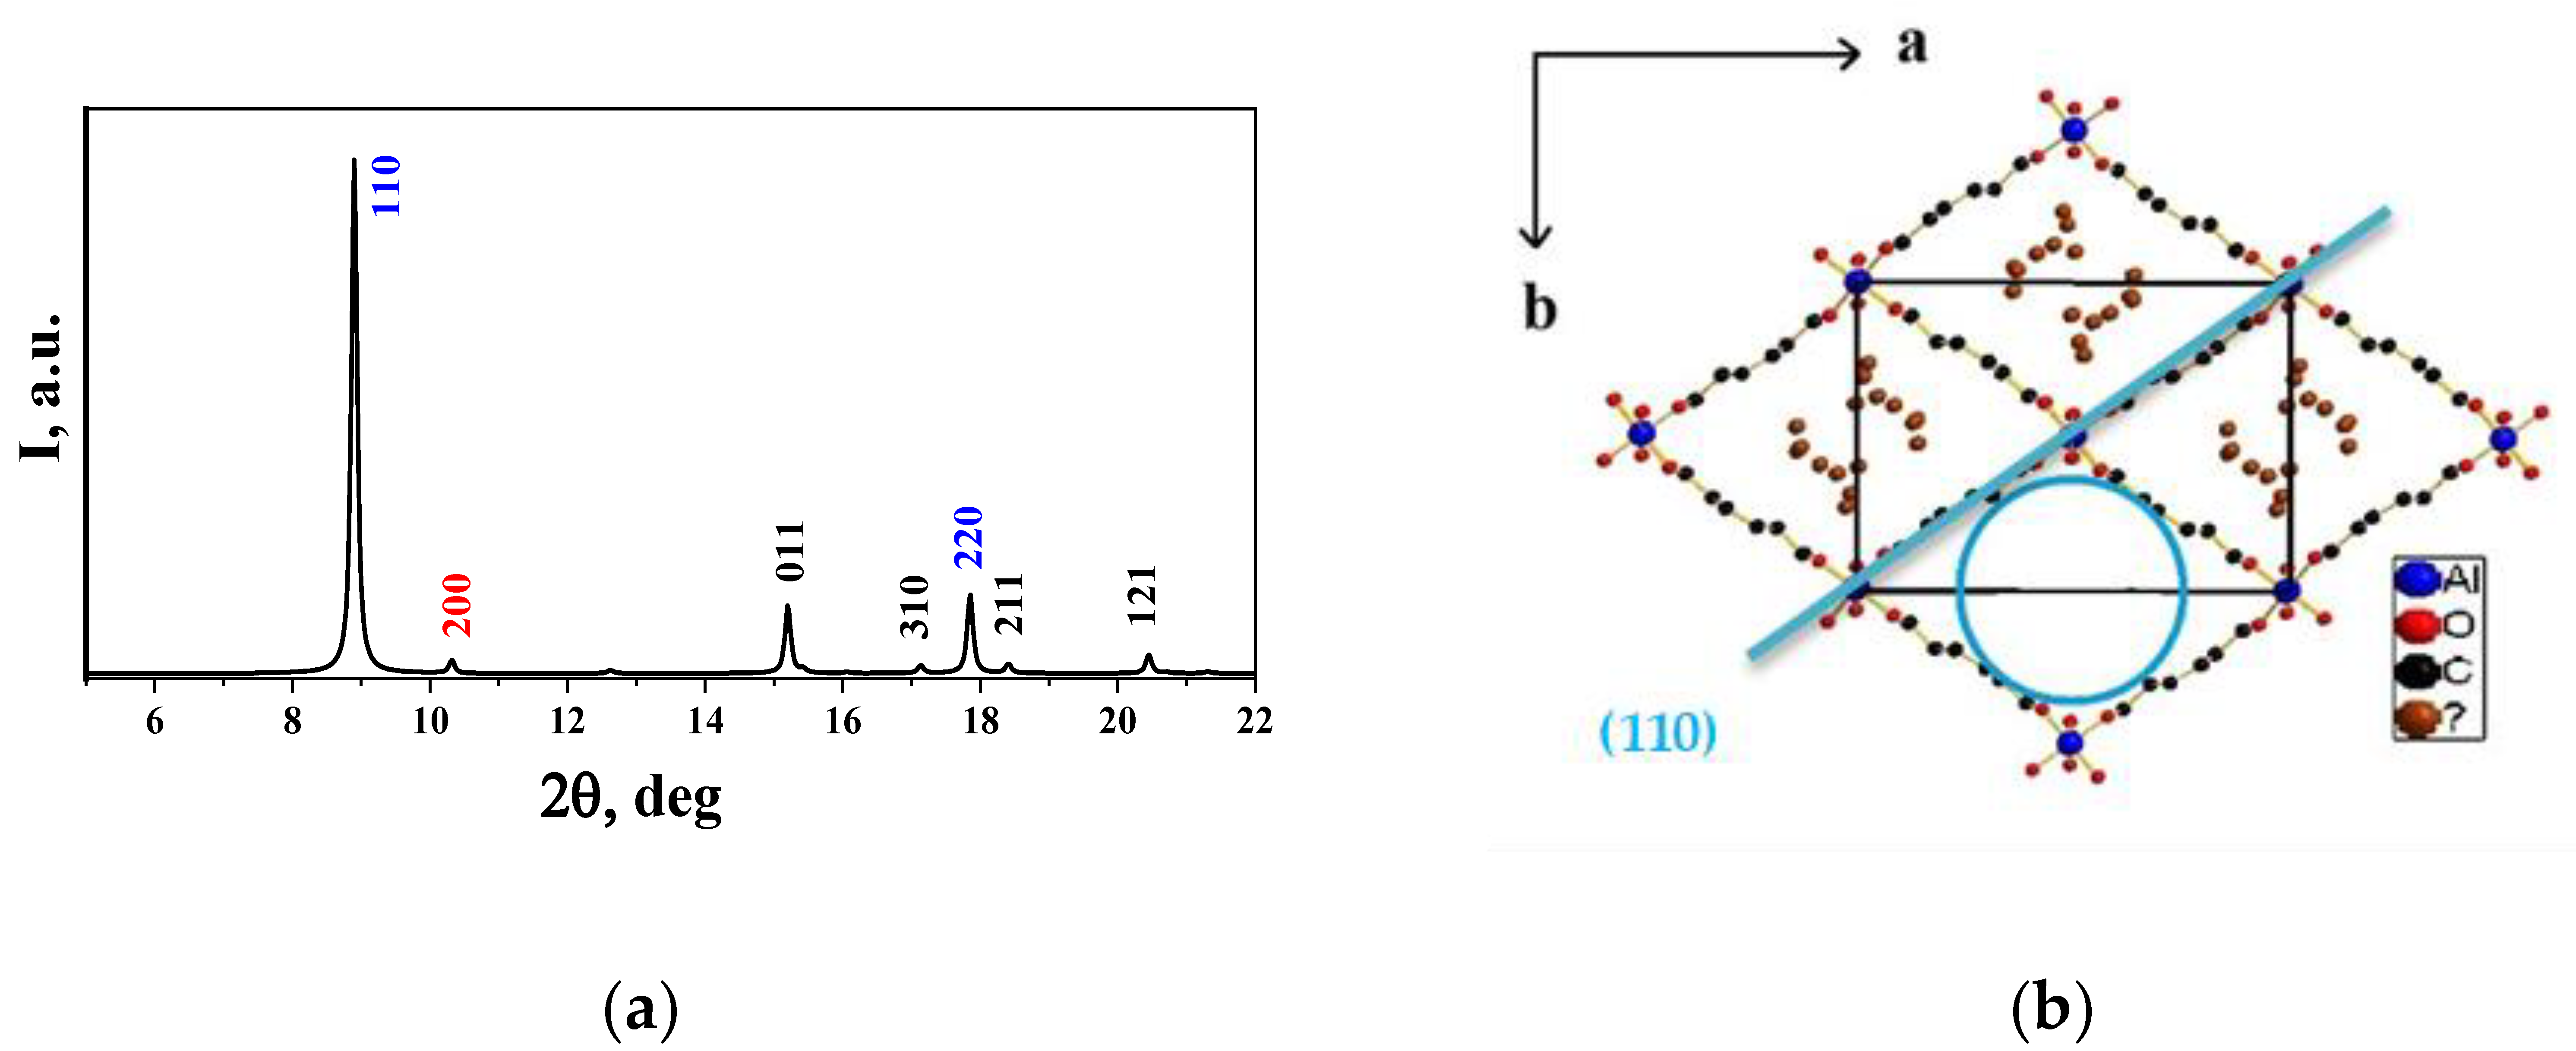
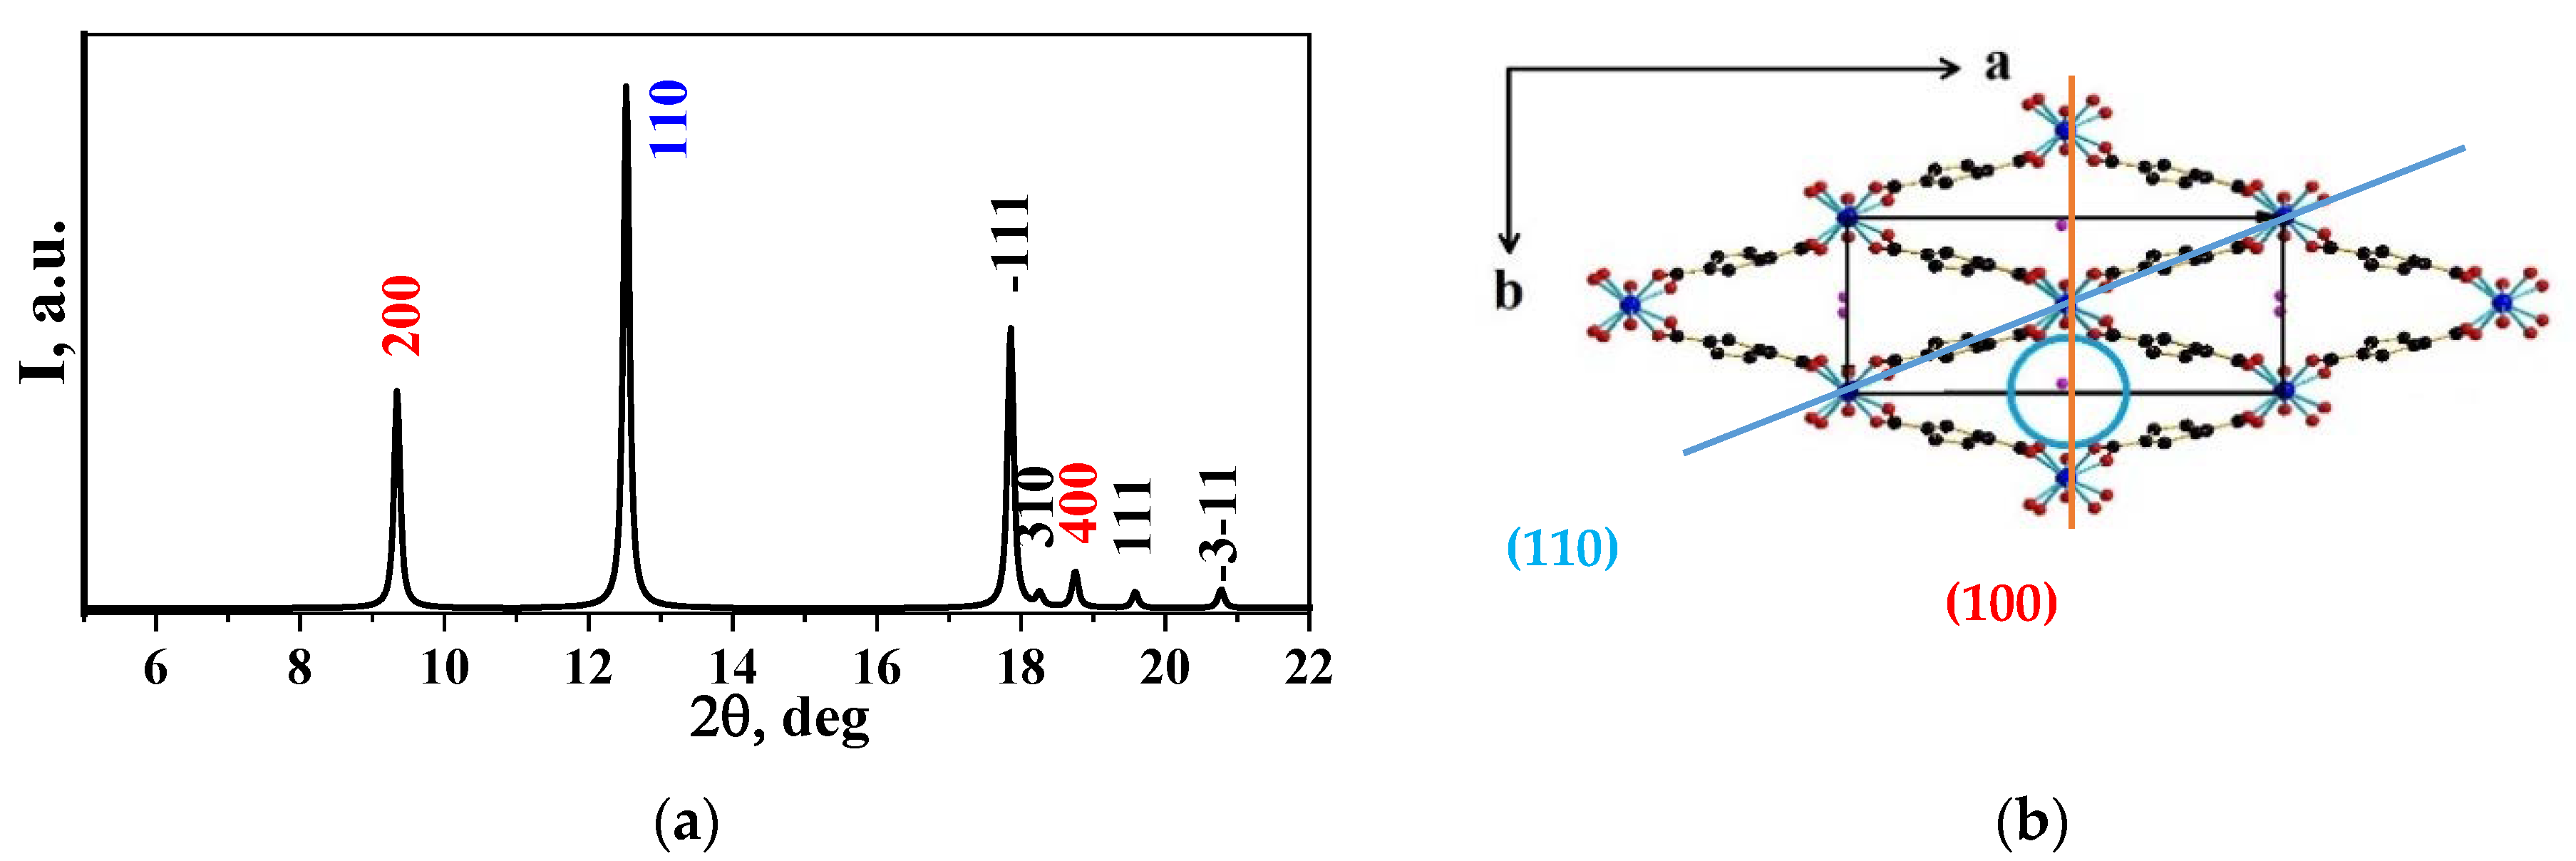
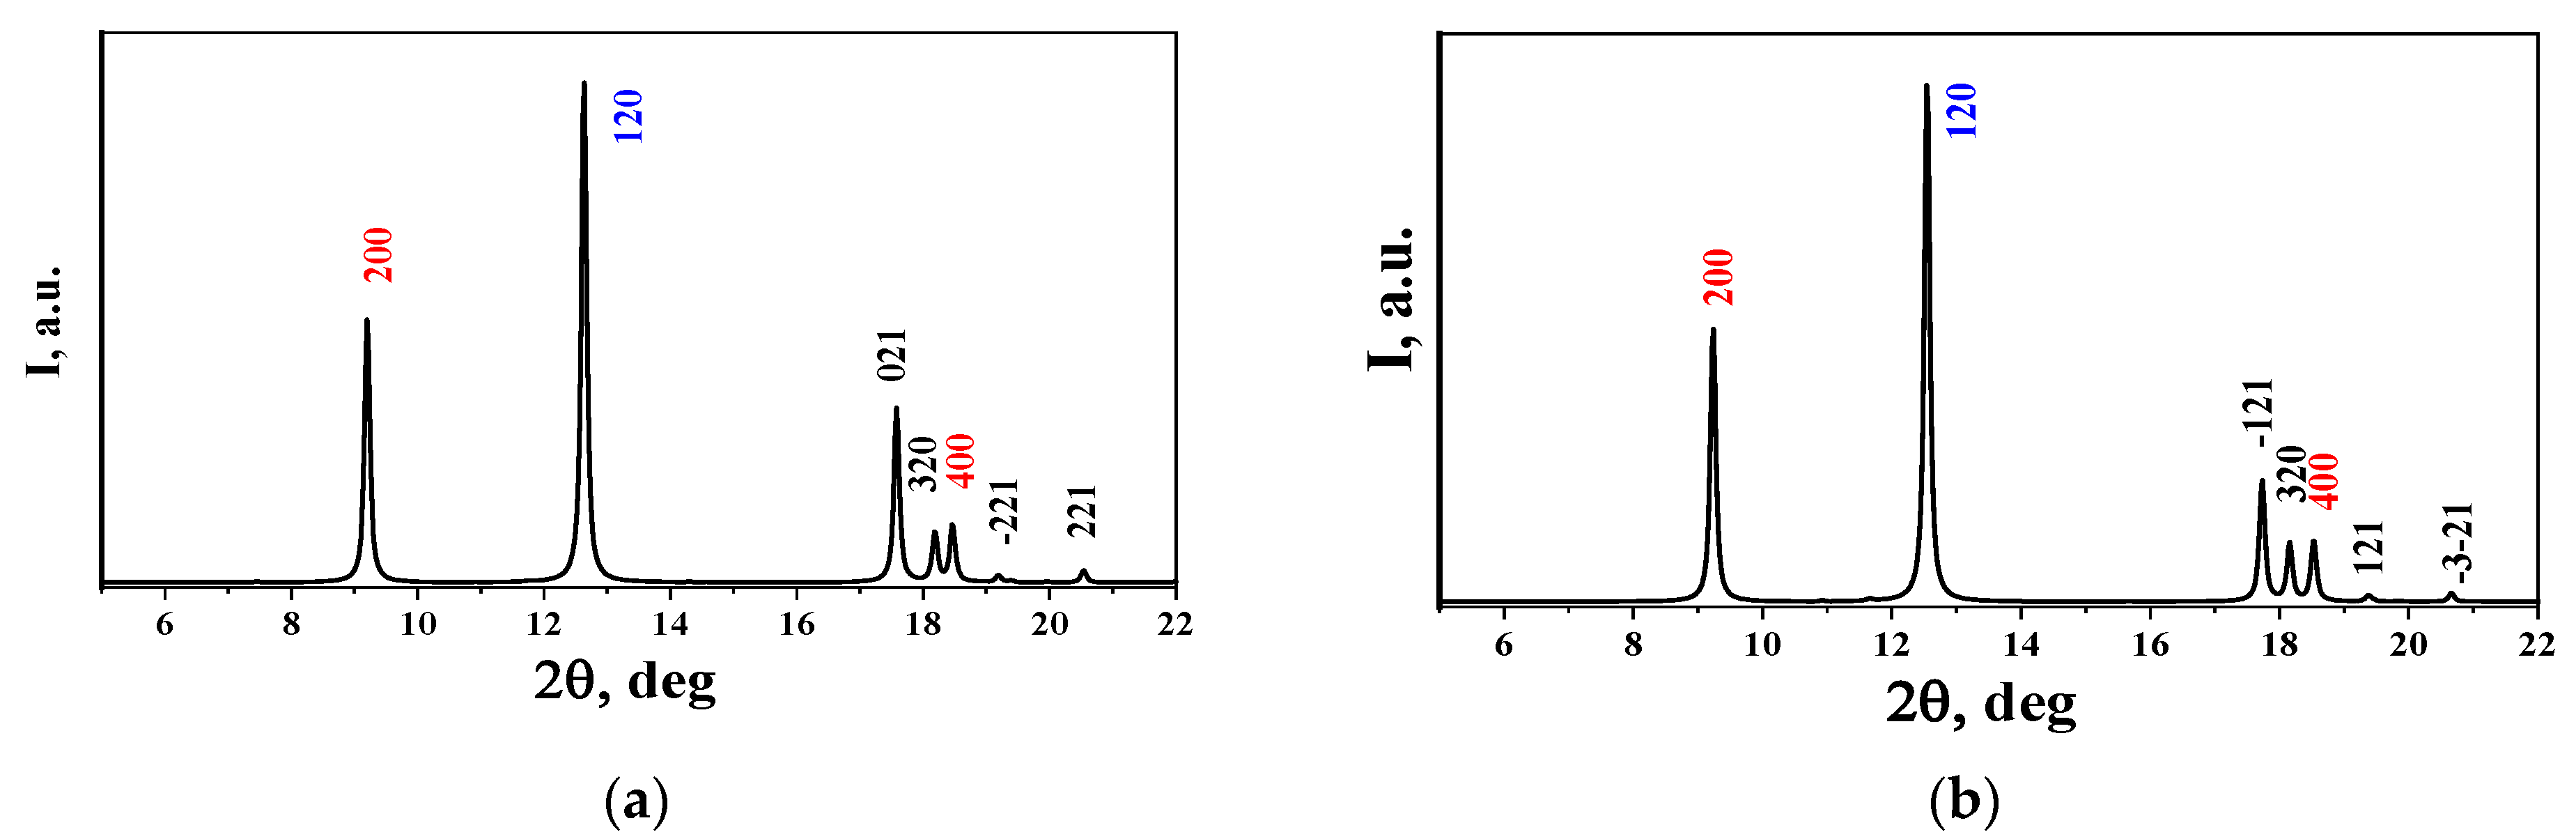
3.1. X-ray Diffraction (XRD)

XRD was used to characterize the crystallographic structure of the MIL-53(Fe)/GO composite compared to MIL-53(Fe), as shown in Figure 9. As indicated in Figure 9, the XRD pattern of the MIL-53(Fe) is consistent with those previous reported, demonstrating the successful preparation of MIL-53(Fe). The MIL-53(Fe)/GO displays the same diffraction pattern as the MIL-53(Fe) sample, with little decrease in intensity.
The MIL-53(Fe) phase, judging by the diffractogram, refers to MIL-53(M3+) (lt)—Fe (OH) (BDC)2− xH2O) with structure V (Figure 9b) and crystallized in monoclinic syngony (sp. gr. P21/c, Z = 8) with unit cell parameter of a = 19.225, b = 14.907, c = 6.812Å, β = 96.6°, V = 1952.23 Å3, determined in the range of diffraction angles 2θ = 5–22°. Compare to those of MIL-53(Fe) from the literature [9], the MIL-53(Fe) sample indicated reduced value, which may be due to the lower coordination number (CN) of Fe3+ ions in MIL-53(Fe), possibly due to a change in the formal charge (FC) of iron ions. This is confirmed by a greater reflection intensity ratio of I120/I200 in the experimental diffractogram compared to the theoretical one. The sizes of the voids in MIL-53(Fe), estimated from the obtained data for a and c, were ~4.90Å and ~5.30Å, respectively, which was comparable with the data in the literature [9].
GO peaks were not found on the diffraction pattern of the MIL-53(Fe)/GO composite which might be attributed to the formation of the “sandwich” structure that MIL-53(Fe) “molecules” were located between the GO layers with an inter-plane spacing beyond the diffraction pattern detection limitation. In addition, GO with the layered structure includes, aside from the carbon, various surface functional groups, such as epoxides (C-O-C), phenolic hydroxyl (-OH), carboxyl (-COOH), and carbonyl groups (C=O), leading to its hydrophilicity, the polar surface properties of GO [36], and easy delamination of the nanoscale GO layers in aqueous media to facilitate for the entry of iron cations into the space between these layers. Therefore, iron cations in the MIL-53(Fe) structure combined with ions of oxygen-containing functional groups either at the “edges” of the GO layer or between the layers in order to form the MIL-53(Fe)/GO composite [37].
As presented in Figure 9, the peak is noteworthy at 2θ = 9.25° (d = 9.5Å), and is assigned as reflections from the (200) plane in the diffractogram of MIL-53 (Fe) that split into two peaks (to be precise, into three peaks, if we take into account the peak with 2θ~9.63° with low intensity) at 2θ = 8.93° (d = 9.9Å) and 9.25° (d = 9.5Å) in the diffraction pattern of MIL-53(Fe)/GO. This character of “splitting” in the region of the near-angle 2θ can be caused by the presence of isostructural MIL-53(Fe) phases with cell parameters a = 19.97, b = 14.94, c = 6.848Å, β = 97.78° (V = 2024.3 Å3) and a = 19.221, b = 15.001, c = 6.824Å, and β = 96.1° (V = 1956.4 Å3). Based on the cell parameters estimated from the peaks in the interval 2θ = 5-22, these phases may differ in terms of the content of water molecules (molecule size ~3Å) in the voids of the MIL-53(Fe)/GO framework, which is accompanied by altered sizes of the voids (~4.90 and ~5.30Å, ~4.85 and ~5.25Å), and hence the difference in the frame fragment. It is known [10,13] that the MIL-53(M3+) framework is capable of dynamic structural transformations due to the “breathing effect”, in which a breathing transition is experienced in the presence of guest molecules. This transformation will lead to a change in the inter-planar spaces, which is observed in the MIL-53(Fe)/GO diffractogram.
The structural parameters of the studied samples, obtained on the basis of synchrotron data, are shown in Table 2.
MIL-53(Fe)/GO displayed the decrease in the crystal lattice parameters, in which a slight increase occurs in the monoclinic angle β, leading to a significant decrease in the unit cell volume from 1975.75 Å3 to 1970.7 Å3.
The results of the full-profile analysis of the samples are presented in Figure 10.
These data indicate a decrease in the coordination number of iron ions in the MIL-53(Fe) structure as compared to the MIL-53(Fe)/GO structure, which leads to a decrease in the unit cell volume of MIL-53 (Fe)/GO. It is clearly seen that the diffractogram of MIL-53(Fe)/GO contains the peaks at 2θ = 8.89°, 9.58°, 14.01°, and 15.85°. The peaks at 2θ = 14.01° and 15.85° (corresponding to the peak indicated by an arrow in Figure 9) in the diffractogram of MIL-53(Fe)/GO (Figure 10), most likely belong to an impurity phase, although this could not be reliably established. The peaks at 2θ = 8.89° and 9.514° refer to the splitting peaks assigned as the (200) reflection, similar to those of Figure 9.
The main significant difference between the diffraction patterns is the intensity ratio of the main peaks I200/I120, in which a ratio is 0.763 for the MIL-53(Fe)/GO sample (the value for model MIL-53 structure is 0.528), and 0.950 for MIL-53(Fe). Taking into account the fact that during the analysis of two-dimensional diffraction patterns no signs of significant preferred orientation were observed, it can be concluded that these changes are caused by the structural transformation. The MIL-53(Fe) structure was more ordered compared to the MIL-53(Fe)/GO structure.

3.2. X-ray Absorption Spectroscopy (XAS)

The XANES spectra of MIL-53(Fe)/GO and MIL-53(Fe) samples are shown in Figure 11a. It can be seen that the XANES spectra of both samples are similar.
The shape of the near-edge oscillations and the position of the absorption edge are the same as those for the α-Fe2O3 standard. On this basis, it can be assumed that iron ions in both samples have a formal charge (FC) of +3. At the same time, the absorption edge for both samples is shifted toward lower relative energies to the edge for α-Fe2O3, and the shift is stronger for MIL-53(Fe)/GO. Therefore, based on the XANES data, it is possible that the state of iron in both samples is mixed (+2, +3), with the prevailing of Fe2+ ions in MIL-53(Fe)/GO, and Fe3+ ions in MIL-53(Fe).
The Fourier transformations of the EXAFS spectra of samples MIL-53(Fe)/GO and MIL-53(Fe) are also similar (Figure 11b). For both samples, a strong peak was observed relative to the nearest environment of the iron ion. Thus, based on the XANES data, it is not excluded that the iron state in both samples is mixed FC = 2+ and 3+. Table 3 shows the structural parameters obtained by the Fourier transform the EXAFS fitting in the 1–2 Å range using a simple model from a single Fe-O scattering path.
The CN (CN-coordination number) Fe = 4.9 of MIL-53(Fe) sample indicates that two types of oxygen polyhedra can exist, i.e., CN Fe = 6 (octahedron)—Fe[O4(OH)2] and CN Fe = 4 (tetrahedron)—FeO4. These confirmed the assumptions about the mixed-valence state of Fe in MIL-53(Fe) based on the XANES data. In the MIL-53(Fe)/GO structure, CN Fe = 4 and the coordination polyhedron are tetrahedrons, which is possible only at the FC Fe = 2+. This means EXAFS does not confirm the assumption of the mixed state of Fe in the sample MIL-53(Fe)/GO. The XAS results are in complete agreement with the full-profile analysis data.
Thus, the structures of MIL-53(Fe 2+δ)+) and MIL-53(Fe2+) in MIL-53(Fe2+)/GO differ from the structure of MIL-53(Fe3+) presented in [9], which was stated as a result of the crystallochemical analysis of MIL-53(M3+) phases. These differences lead to a mismatch between the experimental diffraction pattern and the one calculated from the data [9] (Figure 11b).

3.3. X-ray Photoelectron Spectra (XPS)

The composition and valence states of MIL-53(Fe)/GO and MIL-53(Fe) samples are further confirmed by XPS data as shown in Table 4 and Figure 12. The deconvolution spectra for Fe, C, and O are displayed below.
The surface of the MIL-53(Fe) sample contained 12% Fe2+ and 88% Fe3+, whereas the MIL-53(Fe)/GO sample contained 33% Fe2+ and 67% Fe3+. In addition, the amount of iron atoms presented in MIL-53(Fe) sample according to theoretical calculation was 2.7 times higher than in the analyzed data.
The results indicate the presence of Fe3+ and Fe2+ ions, with more Fe3+ ions than Fe2+ ions for both MIL-53(Fe)/GO and MIL-53(Fe) samples.
In the XPS spectra of the C1s carbon of the MIL-53(Fe) and MIL-53(Fe)/GO samples (Figure 12b) it is possible to distinguish carbon phases related to sp2 hybridized carbon at the binding energy of 284.8 eV (graphene), sp3 hybridized carbon (binding energy of 285.1–285.5 eV), C-C-H bonding (binding energy of about 286.5 eV), C-O and C=O bonds (peaks at binding energy of 287.8 eV and 289 eV respectively). The π-π* shake-up satellite peak which is presented in most organic compounds possessing aromatic rings, was also revealed. It should be noted that in the sample MIL-53(Fe) there are no states corresponding to the sp2 hybridized carbon related to graphene. In the sample MIL-53(Fe)/GO, in addition to the C sp2 peak, the growth of the C sp3 and C-C-H peaks is noticeable, which indicates the modification of graphene and the appearance of new bonds.
In the XPS spectra of the O1s (Figure 12c), it is possible to distinguish the components belonging to iron oxide (a peak at a binding energy of 531 eV), C = O and C-O bonds, C-OH bonds, and adsorbed water (a binding energy of about 535.2 eV). It should be noted that the presence of water molecules in the sample can be due to the framework (structural) water that adsorbed on the surface of the samples. It is probable that the appearance of Fe2+ ions in the samples is caused by the sample synthesis taking place at an elevated temperature and pressure in an autoclave, leading to the destruction of some functional groups to form CO (Table 4). Furthermore, some of the Fe3+ ions are reduced to Fe2+ according to reaction:
Fe3+ + CO → Fe2+ + CO2

3.4. Photocatalytic Properties

The Fenton reaction was first reported by H.J. Fenton (1894) and described as the enhanced oxidative potential of H2O2 using an iron (Fe)-based catalyst under acidic conditions. The Fenton process is a very promising Advanced Oxidation Process, due to the high mineralization promoted under atmospheric conditions, and is very effective in destroying the refractory and toxic organic pollutants that are present in wastewater. Fenton’s process involves the reactions (Haber and Willstätter, 1931) [38]:
Fe2+ + H2O2 → Fe3+ + OH + •OH
•OH + H2O2 → HOO• + H2O
Fe2+ + •OH → Fe3+ + OH
Fe3+ + HOO• → Fe2+ + H+ + O2
•OH + •OH → H2O2
Organic pollutant + •OH → Degraded products
In the dark, the reaction rate is slowed down after completely converting Fe2+ to Fe3+. In order to accelerate the decomposition of organic matter, it was found that the illumination to Fe2+, Fe3+, and H2O2 systems increased the decomposition rate of organic substances. The positive effect of irradiation on the decomposition rate is due to the photochemical reaction of Fe3+ to Fe2+ generating new OH radicals with H2O2, or according to the following mechanism:
Fe3+ + H2O + hv → Fe2+ + •OH + H+
H2O2 + hv → 2•OH
The presence of GO in the MIL-53(Fe)/GO system could improve the charge transfer efficiency and prevent the recombination, which contributes to the increase in catalytic activity [39]. This was confirmed in our experiment: the MIL-53(Fe)/GO composite showed greater photocatalytic activity (96%) compared to MIL-53(Fe) (83%) in the decomposition of RR195 (Figure 13).
The efficiency of the RR195 decomposition reaction is increased due to the increase in the Fe2+ ion concentration in MIL-53(Fe)/GO compared to MIL-53(Fe) (XAS, RFES). The results might be attributed to the electronic interaction on the GO surface, resulting in the reduction of Fe3+ to Fe2+ during synthesis process of MIL-53(Fe)/GO composite.

4. Conclusions

A detailed crystallochemical description of MIL-53(M3+) metal-organic framework with M3+ = Al3+, Cr3+, Ga3+, Fe3+ using concepts, categories, rules, and regulations allowed us to find their structural similarities (M=Al, Cr) or differences (M=Ga, Fe), which was more so the case with M=Fe, and to provide explanations. In contrast to the existing data in the literature on the formal charge of iron 3+ ions in MIL-53(M3+) and their octahedral coordination, the crystallochemical indicated this. This was confirmed by experimental study of MIL-53(Fe): lack of similarity between theoretical (according to the literature structural data) and experimental diffraction patterns, the presence of mixed valence state of iron ions, and superpositions of tetrahedral and octahedral environments. These structural properties of MIL-53 (Fe) showed themselves in MIL-53(Fe) in the composition MIL-53(Fe)/GO. In turn, GO also influenced the structure of MIL-53(Fe) in MIL-53(Fe)/GO: the increase in the proportion of Fe2+ ions with a decrease in coordination to tetrahedral. All of this contributed to the enhancement of the photocatalytic properties, which can be considered in relation to the example of the photo-Fenton reaction.
The results of the work showed that the method and conditions have a significant influence on the crystal structure of MIL-53(M3+) and, hence, on their catalytic properties [40]. References to crystallography make it possible to anticipate possible changes in the structural features and even structural parameters. This makes it possible to obtain the coordinated metal-organic polymers with desired properties.

5. Patents

Kravchenko, G.V.; Podbelsky, V.V.; Kuz’micheva, G.M. The program is determining the size of voids in the frame structures. Certificate of State Registration of Computer Software No. 2020667596: Moscow, Russia. (in Russian).

Supplementary Materials

The following are available online at https://0-www-mdpi-com.brum.beds.ac.uk/article/10.3390/cryst11111281/s1, Figure S1 Unit cell parameters а, Å (а), b, Å (b) and cell volume V, Å3 (с) of phases I-VI (Table 1).

Author Contributions

Conceptualization, G.M.K.; Methodology, G.M.K., Q.K.N., E.V.K., R.D.S. and R.G.C.; Validation, G.M.K. and Q.K.N.; Formal Analysis, G.M.K., Q.K.N., E.V.K., R.D.S. and R.G.C.; Investigation, G.M.K.,Q.K.N., E.V.K. and R.D.S.; Resources, G.M.K. and Q.K.N.; Data Curation, G.M.K., Q.K.N., E.V.K., R.D.S. and R.G.C.; Writing—Original Draft Preparation, Q.K.N., T.T.C.; Writing—Review & Editing, G.M.K., E.V.K., R.D.S. and R.G.C.; Visualization, Q.K.N., G.M.K. and R.G.C.; Supervision, G.M.K. and Q.K.N.; Project Administration, Q.K.N. All authors obtained and discussed the results. All authors have read and agreed to the published version of the manuscript.

Funding

This research was funded by Ministry of Science and Higher Education of the Russian Federation, grant number 0706-2020-0026.

Institutional Review Board Statement

Not applicable.

Informed Consent Statement

Not applicable.

Data Availability Statement

Not applicable.

Conflicts of Interest

The authors declare no conflict of interest.

References

  1. Qasem, N.A.A.; Ben-Mansour, R.; Habib, M.A. An efficient CO2 adsorptive storage using MOF-5 and MOF-177. Appl. Energy 2018, 210, 317–326. [Google Scholar] [CrossRef]
  2. Almáši, M.; Zeleňák, V.; Palotai, P.; Beňová, E.; Zeleňáková, A. Metal-organic framework MOF-76(Nd): Synthesis, characterization, and study of hydrogen storage and humidity sensing. Inorg. Chem. Commun. 2018, 93, 115–120. [Google Scholar] [CrossRef]
  3. Wang, C.C.; Du, X.D.; Li, J.; Guo, X.X.; Wang, P.; Zhang, J. Photocatalytic Cr(VI) reduction in metal-organic frameworks: A mini-review. Appl. Catal. B Environ. 2016, 193, 198–216. [Google Scholar] [CrossRef]
  4. Dhaka, S.; Kumar, R.; Deep, A.; Kurade, M.B.; Ji, S.W.; Jeon, B.H. Performance of metal–organic frameworks for the adsorptive removal of potentially toxic elements in a water system: A critical review. Coord. Chem. Rev. 2019, 380, 330–352. [Google Scholar] [CrossRef]
  5. Kuzmicheva, G.M. Some Aspects of the Applied Crystallochemistry; MIREA: Moscow, Russia, 2016; p. 286. [Google Scholar]
  6. Kravchenko, G.V.; Podbelsky, V.V.; Kuz’micheva, G.M. Certificate of State Registration of Computer Software. Russia No. 2020667596, August 2020. [Google Scholar]
  7. Serre, C.; Millange, F.; Thouvenot, C.; Noguè, M.; Marsolier, G.; Louër, D.; Férey, G. Very large breathing effect in the first nanoporous chromium(III)-based solids: MIL-53 or CrIII(OH)·{O2C−C6H4−CO2}·{HO2C−C6H4−CO2H}x·H2Oy. J. Am. Chem. Soc. 2002, 124, 13519–13526. [Google Scholar] [CrossRef]
  8. Loiseau, T.; Serre, C.; Huguenard, C.; Fink, G.; Taulelle, F.; Henry, M.; Bataille, T.; Férey, G. A rationale for the large breathing of the porous aluminum terephthalate (MIL-53) upon hydration. Chem. Eur. J. 2004, 10, 1373–1382. [Google Scholar] [CrossRef]
  9. Millange, F.; Guillou, N.; Walton, R.I.; Grenèche, J.M.; Margiolaki, I.; Férey, G. Effect of the nature of the metal on the breathing steps in MOFs with dynamic frameworks. Chem. Commun. 2008, 39, 4732. [Google Scholar] [CrossRef]
  10. Volkringer, C.; Loiseau, T.; Guillou, N.; Férey, G.; Elkaïm, E.; Vimont, A. XRD and IR structural investigations of a particular breathing effect in the MOF-type gallium terephthalate MIL-53(Ga). Dalton Trans. 2009, 12, 2241. [Google Scholar] [CrossRef]
  11. Урусoв, В.С. Теoретическая Кристаллoхимия М; МГУ: Ulitsa Kolmogorova, Moscow, Russia, 1987; p. 272. [Google Scholar]
  12. Shannon, R.D. Revised effective ionic radii and systematic studies of interatomic distances in halides and chalcogenides. Acta Crystallogr. Sect. A Cryst. Phys. Diffr. Theor. Gen. Crystallogr. 1976, 32, 751–767. [Google Scholar] [CrossRef]
  13. Leclerc, H.; Devic, T.; Devautour-Vinot, S.; Bazin, P.; Audebrand, N.; Férey, G.; Daturi, M.; Vimont, A.; Clet, G. Influence of the oxidation state of the metal center on the flexibility and adsorption properties of a porous metal organic framework: MIL-47(V). J. Phys. Chem. C 2011, 115, 19828–19840. [Google Scholar] [CrossRef]
  14. Mowat, J.P.S.; Miller, S.R.; Slawin, A.M.Z.; Seymour, V.R.; Ashbrook, S.E.; Wright, P.A. Isoreticular chemistry of scandium analogues of the multicomponent metal–organic framework MIL-142. CrystEngComm 2011, 142, 322–333. [Google Scholar] [CrossRef]
  15. Wu, L.; Chaplais, G.; Xue, M.; Qiu, S.; Patarin, J.; Simon-Masseron, A.; Chen, H. New functionalized MIL-53(In) solids: Syntheses, characterization, sorption, and structural flexibility. RSC Adv. 2019, 9, 1918–1928. [Google Scholar] [CrossRef] [Green Version]
  16. Breeze, M.I.; Clet, G.; Campo, B.C.; Vimont, A.; Daturi, M.; Grenèche, J.-M.; Dent, A.J.; Millange, F.; Walton, R.I. Isomorphous substitution in a flexible metal–organic framework: Mixed-metal, mixed-valent MIL-53 type materials. Inorg. Chem. 2013, 52, 8171–8182. [Google Scholar] [CrossRef]
  17. Nouar, F.; Devic, T.; Chevreau, H.; Guillou, N.; Gibson, E.; Clet, G.; Daturi, M.; Vimont, A.; Grenèche, J.M.; Breeze, M.I.; et al. Tuning the breathing behaviour of MIL-53 by cation mixing. Chem. Commun. 2012, 48, 10237. [Google Scholar] [CrossRef]
  18. Mendt, M.; Jee, B.; Stock, N.; Ahnfeldt, T.; Hartmann, M.; Himsl, D.; Pöppl, A. Structural phase transitions and thermal hysteresis in the metal−organic framework compound MIL-53 as studied by electron spin resonance spectroscopy. J. Phys. Chem. C 2010, 114, 19443–19451. [Google Scholar] [CrossRef]
  19. Osadchii, D.Y.; Olivos-Suarez, A.I.; Szécsényi, Á.; Li, G.; Nasalevich, M.A.; Dugulan, I.A.; Crespo, P.S.; Hensen, E.J.M.; Veber, S.L.; Fedin, M.V.; et al. Isolated fe sites in metal organic frameworks catalyze the direct conversion of methane to methanol. ACS Catal. 2018, 8, 5542–5548. [Google Scholar] [CrossRef] [Green Version]
  20. Bignami, G.P.M.; Davis, Z.H.; Dawson, D.M.; Morris, S.A.; Russell, S.E.; McKay, D.; Parke, R.E.; Iuga, D.; Morris, R.E.; Ashbrook, S.E. Cost-effective 17O enrichment and NMR spectroscopy of mixed-metal terephthalate metal–organic frameworks. Chem. Sci. 2018, 9, 850–859. [Google Scholar] [CrossRef] [Green Version]
  21. Kozachuk, O.; Meilikhov, M.; Yusenko, K.; Schneemann, A.; Jee, B.; Kuttatheyil, A.V.; Bertmer, M.; Sternemann, C.; Pöppl, A.; Fischer, R.A. A solid-solution approach to mixed-metal metal–organic frameworks–detailed characterization of local structures, defects and breathing behaviour of Al/V frameworks. Eur. J. Inorg. Chem. 2013, 26, 4546–4557. [Google Scholar] [CrossRef]
  22. Isaeva, V.I.; Vedenyapina, M.; Kulayshin, S.; Lobova, A.; Chernyshev, V.V.; Kapustin, G.I.; Tkachenko, O.P.; Vergun, V.V.; Arkhipov, D.A.; Nissenbaum, V.D.; et al. Adsorption of 2,4-dichlorophenoxyacetic acid in an aqueous medium on nanoscale MIL-53(Al) type materials. Dalton Trans. 2019, 48, 15091–15104. [Google Scholar] [CrossRef]
  23. Lescouet, T.; Kockrick, E.; Bergeret, G.; Pera-Titus, M.; Aguado, S.; Farrusseng, D. Homogeneity of flexible metal–organic frameworks containing mixed linkers. J. Mater. Chem. 2012, 22, 10287. [Google Scholar] [CrossRef]
  24. Bubnova, R.S.; Filatov, S.K. High-Temperature borate crystal chemistry. Z. Für Krist. 2013, 228, 395–428. [Google Scholar] [CrossRef]
  25. Chernov, A.A. Growth of copolymer chains and mixed crystals: Statistics of trials and errors. Usp. Fiz. Nauk. 1970, 13, 111–162. [Google Scholar] [CrossRef]
  26. Shtukenberg, A.G.; Punin, Y.O.; Frank-Kamenetskaya, O.V. The kinetic ordering and growth dissymmetrisation in crystalline solid solutions. Russ. Chem. Rev. 2016, 75, 1083–1106. [Google Scholar] [CrossRef]
  27. Vu, T.A.; Le, G.H.; Dao, C.D.; Dang, L.Q.; Nguyen, K.T.; Nguyen, Q.K.; Lee, G.D. Arsenic removal from aqueous solutions by adsorption using novel MIL-53(Fe) as a highly efficient adsorbent. RSC Adv. 2015, 5, 5261–5268. [Google Scholar] [CrossRef]
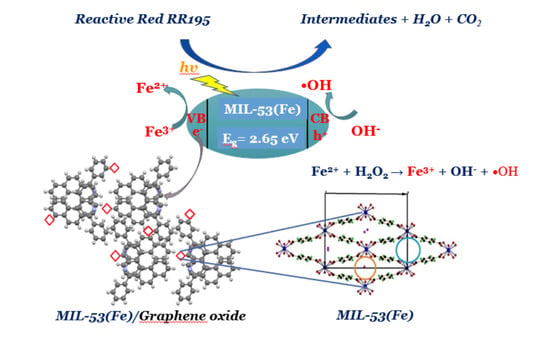
  28. Hoa, T.V.; Linh, T.T.; Giang, H.L.; Quang, K.N.; Tan, M.V.; Tuan, A.V. Synthesis and application of novel Fe-MIL-53/GO nanocomposite for photocatalytic degradation of reactive dye from aqueous solution. Vietnam. J. Chem. 2019, 57, 681–685. [Google Scholar] [CrossRef]
  29. Le, G.H.; Ngo, Q.T.; Nguyen, T.T.; Nguyen, Q.K.; Quan, T.T.T.; Vu, L.D.; Vu, T.A. High catalytic activity of phenol photodegradation from aqueous solution with Novel Fe-Fe3O4-GO nanocomposite. J. Mater. Eng. Perform. 2018, 27, 4225–4234. [Google Scholar] [CrossRef]
  30. Svetogorov, R.D.; Dorovatovskii, P.V.; Lazarenko, V.A. Belok/XSA Diffraction beamline for studying crystalline samples at kurchatov synchrotron radiation source. Cryst. Res. Technol. 2020, 55, 1900184. [Google Scholar] [CrossRef]
  31. Petříček, V.; Dušek, M.; Palatinus, L. Crystallographic computing system JANA2006: General features. Z. Kristallogr 2014, 229, 345–352. [Google Scholar] [CrossRef]
  32. Chernyshov, A.A.; Veligzhanin, A.A.; Zubavichus, Y.V. X-ray structural studies of the Pd–In–Ru system using synchrotron radiation. Nucl. Instrum. Methods Phys. Res. 2009, 603, 95–98. [Google Scholar] [CrossRef]
  33. Ravel, B.; Newville, M. Data analysis for X-ray absorption spectroscopy using IFEFFIT. J. Synchrotron Radiat. 2005, 12, 537–541. [Google Scholar] [CrossRef] [Green Version]
  34. Walton, J.; Wincott, P.; Fairley, N.; Carrick, A. Peak Fitting with CasaXPS: A Casa Pocket Book; Accolyte Science: Knutsford, UK, 2010. [Google Scholar]
  35. Naumkin, A.V.; Kraut-Vass, A.; Powell, C.J.; Gaarenstroom, S.W. NIST X-ray Photoelectron Spectroscopy Database; The National Institute of Standards and Technology NIST: Gaithersburg, MD, USA, 2012.
  36. Nasrollahzadeh, M.; Babaei, F.; Fakhri, P.; Jaleh, B. Synthesis, characterization, structural, optical properties and catalytic activity of reduced graphene oxide/copper nanocomposites. RSC Adv. 2015, 5, 10782–10789. [Google Scholar] [CrossRef]
  37. Kharisov, B.I.; Kharissova, O.V.; Vázquez Dimas, A.; Gómez De La Fuente, I.; Peña Méndez, Y. Review: Graphene-supported coordination complexes and organometallics: Properties and applications. J. Coord. Chem. 2016, 69, 1125–1151. [Google Scholar] [CrossRef]
  38. Ameta, R.; Chohadia, A.K.; Jain, A.; Punjabi, P.B. Fenton and photo-Fenton processes. Adv. Oxid. Process. Waste Water Treat. 2018, 49–87. [Google Scholar] [CrossRef]
  39. Qiong, W.; Yining, L.; Haochuan, J.; Hongbin, Y.; Ying, L.; Mingxin, H.; Hongliang, H. Peculiar synergetic effect of γ-Fe2O3 nanoparticles and graphene oxide on MIL-53 (Fe) for boosting photocatalysis. Chem. Eng. Sci. 2020, 390, 124615. [Google Scholar] [CrossRef]
  40. Stock, N.; Biswas, S. Synthesis of metal-organic frameworks (MOFs): Routes to various MOF topologies, morphologies, and composites. Chem. Rev. 2011, 112, 933–969. [Google Scholar] [CrossRef]
Figure 1. Structure I (sp.gr. Pnam, z = 4): theoretical diffraction pattern (a), structure projected onto the (b) XY plane.
Crystals 11 01281 g001
Figure 2. Structure II (sp.gr. I mcm, z = 4): theoretical diffraction pattern (a), structure projected onto the (b) XY plane.
Crystals 11 01281 g002
Figure 3. Structure III (sp.gr. C 1 c 1 or C 1 2/c 1; z = 4): theoretical diffraction pattern (a), structure projected onto the (b) XY plane.
Crystals 11 01281 g003
Figure 4. Structure IV (sp.gr. C 1 2/c 1; z = 4): theoretical diffraction pattern (a), structure projected onto the (b) XY plane.
Crystals 11 01281 g004
Figure 5. Structure V (sp.gr. P 1 21/c 1; z = 8) or superstructure to structure III (sp.gr. C 1 c 1 or C 1 2/c 1; z = 4): theoretical diffraction patterns MIL-53 (Fe) (a) and MIL-53 (Ga) (b), structure projected onto the (c) XY plane.
Crystals 11 01281 g005aCrystals 11 01281 g005b
Figure 6. Structure VI (sp.gr. P ̅1̅; z = 8): theoretical diffraction pattern (a), structure projected onto the (b) XY plane.
Crystals 11 01281 g006
Figure 7. Diameters of voids in the framework of phases I–VI (Table 1). The asterisk denotes the MIL-53(Fe)/GO sample: Q1a is MIL-53(Fe) in MIL-53(Fe)/GO with 200 at peak 2θ= 8.93° and Q1b is MIL-53(Fe) with 200 at peak 2θ = 9.25°. The star symbol denotes the MIL-53(Fe) sample (Q8) obtained.
Crystals 11 01281 g007
Figure 8. Unit cell parameter c, Å of phases I—VI (Table 1). The star symbol denotes the MIL-53(Fe) sample (Q8) obtained.
Crystals 11 01281 g008
Figure 9. (a) Diffraction patterns of samples: MIL-53(Fe), MIL-53(Fe)/GO and theoretical diffractogram (programs Diamond, Mercury); (b) model structure V of MIL-53 (M3+) (lt)-Fe(OH)(BDC)2− xH2O.
Crystals 11 01281 g009
Figure 10. Observed, calculated and differential powder patterns of MIL-53(Fe)/GO (a) and MIL-53(Fe) (b) samples after full-profile analysis. Angular scale was recalculated to Cu Kα radiation.
Crystals 11 01281 g010
Figure 11. XANES (a) and EXAFS (b) on the Fe K-edge data for MIL-53(Fe)/GO and MIL-53(Fe) samples along with data for iron foil and iron oxides standards.
Crystals 11 01281 g011
Figure 12. XPS spectra of MIL-53(Fe)/GO and MIL-53(Fe): (a) Spectra and decomposition of Fe2p3/2, (b) Spectra and decomposition of C1s, (c) Spectra and decomposition of O1s.
Crystals 11 01281 g012
Figure 13. Results of the reaction with red reactive195 (RR195) in aqueous medium compared with UV irradiation time in the presence of MIL-53(Fe) and MIL-53 (Fe)/GO.
Crystals 11 01281 g013
Table 1. Conditions for obtaining MIL-53(M3+) and their structural characteristics [7,8,9,10].
Heating a mixture of M (NO3)3 × 9H2O c C8H6O4 (H2BDC) and water in a teflon-coated steel autoclave
t = 220 °C, τ = 72 ht = 200 °C, τ = 36 h-
M (OH) (BDC)2− × (BDC)≡MIL-53(M) (as)
AlCrGaFe
Structure I (sp.gr. Pnma, z = 4)-
a = 17.129, b = 12.182, c = 6.628a = 17.340, b = 12.178, c = 6.822
heating in air MIL-53(M)—as
t = 330 °C, τ = 72 h400° < t > 300 °Ct = 280 °C, τ = 24 h-
M (OH) (BDC)2−≡MIL-53(M) (ht)
AlCrGaFe
Structure II (sp.gr. Imcm, z = 4)Structure IV (sp.gr. C 1 2/c 1; z = 4)
a = 16.675, b = 12.812, c = 6.608 a = 16.733, b = 13.038, c = 6.812 a = 19.8330, b = 6.8556,
c = 6.7143, β = 103.88°
a = 21.2693, b = 6.7589, c = 6.8838, β = 114.625°
Cooling MIL-53 (M)—ht
to room temperatureto 150–40 °C
M (OH) (BDC)2− × (H2O)≡MIL-53(M) (lt)MIL-53(Fe) (int)
AlCrGaFeFe
Structure IIIStructure V—Superstructure to structure III
(sp.gr. P 1 21/c 1; z = 8)
Structure VI
(sp.gr. P ̅1̅ z = 8)
Sp.gr. C 1 c 1; z = 4;
a = 19.513, b = 7.612,
c = 6.576, β = 104.24°
Sp.gr. C 1 2/c 1; z = 4;
a = 19.685, b = 7.849,
c = 6.782, β = 104.90°
a = 19.7053, b = 15.1642,
c = 6.6812, β = 103.79°
a = 19.7053, b = 7.582 × 2,
c = 6.6812, β = 103.79°
a = 19.3197, b = 15.0362, c = 6.8351, β = 96.31°
a = 19.3197, b = 7.518 × 2,
c = 6.8351, β = 96.305°
a = 10.557, b = 13.4662,
c = 6.8865, α = 88.058°,
β = 103.967°,
γ = 109.856°
Table 2. Structural parameters of studied samples based on synchrotron powder diffraction data.
SampleMIL-53(Fe)MIL-53(Fe)/GO
Space groupP21/c (#14)P21/c (#14)
a, Å19.3284 (6)19.313 (2)
b, Å15.0417 (5)15.0190 (18)
c, Å6.8369 (2)6.8378 (7)
β, deg96.285 (5)96.487 (11)
Volume, Å31975.75 (11)1970.7 (4)
Sherrer size, nm66.3296.5
Microstrains, %0.210.10
Table 3. Results of single-sphere EXAFS simulations at the K-edge of Fe for samples MIL-53(Fe)/GO and MIL-53(Fe). Here, RFe-O is the Fe-O interatomic distance, NO is the coordination number, σ2—is the Debye-Waller factor, Rf is the quadratic incoherence. Fourier transform range k = 2–12–Å-1, modeling range R = 1–2 Å.
SampleNORFe-O, Åσ2, Å2Rf, %
MIL-53(Fe)/GO4.0 ± 0.42.01 ± 0.010.00620.5
MIL-53(Fe)4.9 ± 0.32.00 ± 0.0060.00670.2
Table 4. XPS results of the MIL-53(Fe)/GO and MIL-53(Fe) samples.
Elements and ComponentsPeak Position, eVConcentration, atm. %
MIL-53(Fe)MIL-53(Fe)/GO
C 1sC sp2284.8-17.858
C sp3285.1–285.59.71713.010
C-C-H~286.515.53123.729
C-O~287.820.97913.172
C = O~28919.1877.706
π-π* satellite291–2927.8735.408
O 1sO-Fe~5310.7870.444
C = O~5320.3800.903
C-O~532.83.7892.553
C-OH~533.82.8844.335
H2O~535.217.5748.399
Fe 2p3/2Fe2+7120.1610.158
Fe3+~715.41.1380.324
Publisher’s Note: MDPI stays neutral with regard to jurisdictional claims in published maps and institutional affiliations.

