Article

Influences of Curing Period and Sulfate Concentration on the Dynamic Properties and Energy Absorption Characteristics of Cement Soil

1
Research Center of Mine Underground Engineering, Ministry of Education, Anhui University of Science and Technology, Huainan 232001, China
2
School of Civil Engineering and Architecture, Anhui University of Science and Technology, Huainan 232001, China
*
Author to whom correspondence should be addressed.
Submission received: 9 September 2021 / Revised: 20 October 2021 / Accepted: 22 October 2021 / Published: 25 October 2021

Abstract

:
To study the influences of curing period and sulfate concentration on the dynamic mechanical properties of cement soil, this study used a split Hopkinson pressure bar device. Impact tests were conducted on cement soil specimens with different curing periods and different sulfate concentrations. The relationships between the dynamic stress–strain, dynamic compressive strength, and absorption energy of these cement soil specimens were analyzed. The test results show that with continuous loading, cement soil specimens mainly experience an elastic stage, plastic stage, and failure stage; with increasing curing period and sulfate concentration, the dynamic compressive strength and absorption energy of cement soil specimens follow a trend of first increasing and then decreasing. The dynamic compressive strength and absorption energy of cement soil specimens reached maximum values at a curing period of 14 d and a Na2SO4 solution concentration of 9.0 g/L. Increasing the dynamic compressive strength and absorption energy can effectively improve the ability of cement soil specimens to resist damage. This paper provides a practical reference for the application of cement soil in dynamic environments.

1. Introduction

Cement soil, which is widely used in engineering construction applications, is a composite material with a certain strength formed by uniformly mixing a specific proportion of soil, cement, and water [1,2]. Because of the complexity of the site environment in actual engineering, scholars have carried out considerable research on the mechanical properties of cement soil under different environments [3,4,5,6,7,8,9,10,11]. Chen et al. [12] studied the mechanical properties of cement soil subjected to dry–wet cycles. The results showed that with increasing numbers of dry–wet cycles, both the compressive strength and tensile strength of specimens increased first and then decreased; moreover, mechanical strength could be effectively improved by adding a specific amount of basalt fibers to specimens. Guo et al. [13,14] conducted unconfined compression tests and fatigue tests on cement soil specimens that had undergone freeze–thaw cycles. The results showed that adding the appropriate amount of basalt fibers improves the compressive, frost-resistance, and fatigue-resistance properties of cement soil. Guo et al. also fitted the relationship between stress level and fatigue life, the results of which provide a reference for real-world engineering applications. Han et al. [15] studied the influence of Na2SO4 solution on the strength and pore structure of cement soil. They concluded that during the curing process of cement soil, Na2SO4 actively participates in the hydration reaction and promotes the generation of products (C–S–H gel and Ca(OH)2). This results in the formation of a strong granular-inlaid-colloidal structure of cement soil, thereby improving its strength. The strength of this type of cement soil reached the maximum at a Na2SO4 solution concentration of 9.0 g/L. The above studies provide a theoretical basis for the practical application of cement soil; however, most research on cement soil has focused on static properties. In real-life engineering applications, cement soil not only bears static loads, but often also dynamic loads. Examples are the impact of repeated crushing of the roadbed by cars, the impact of landing aircraft on airport runways [16], and the impact of blasting construction on the surrounding foundation. Therefore, further research needs to focus on the dynamic mechanical properties of cement soil [17,18,19].
Previous research showed that the addition of basalt fibers to cement soil can effectively improve the mechanical properties of the resulting cement soil. Fly ash, as a kind of industrial waste residue, has been used by many scholars as an admixture of cement soil because of its corrosion resistance. Adding the appropriate amount of fly ash can effectively improve the performance of cement soil, which has good application prospects [20,21,22,23,24]. Therefore, in this paper, the authors explored the suitable admixture of basalt fiber and fly ash by preliminary tests. Based on the results, impact tests were conducted on the cement soil specimens by using Φ 50 mm variable section split Hopkinson pressure bar test equipment. The effects of curing period and Na2SO4 solution concentration on the dynamic properties of the cement soil were studied. The dynamic stress–strain, dynamic compressive strength, and absorption energy characteristics of the cement soil were analyzed. The microstructure and mineral composition of the cement soil specimens were also analyzed by scanning electron microscope tests and X-ray diffraction tests to study the effects of the changes in the internal substance composition of the specimens on their dynamic mechanical properties after sulfate erosion.

2. Specimen Preparation and Test Plan
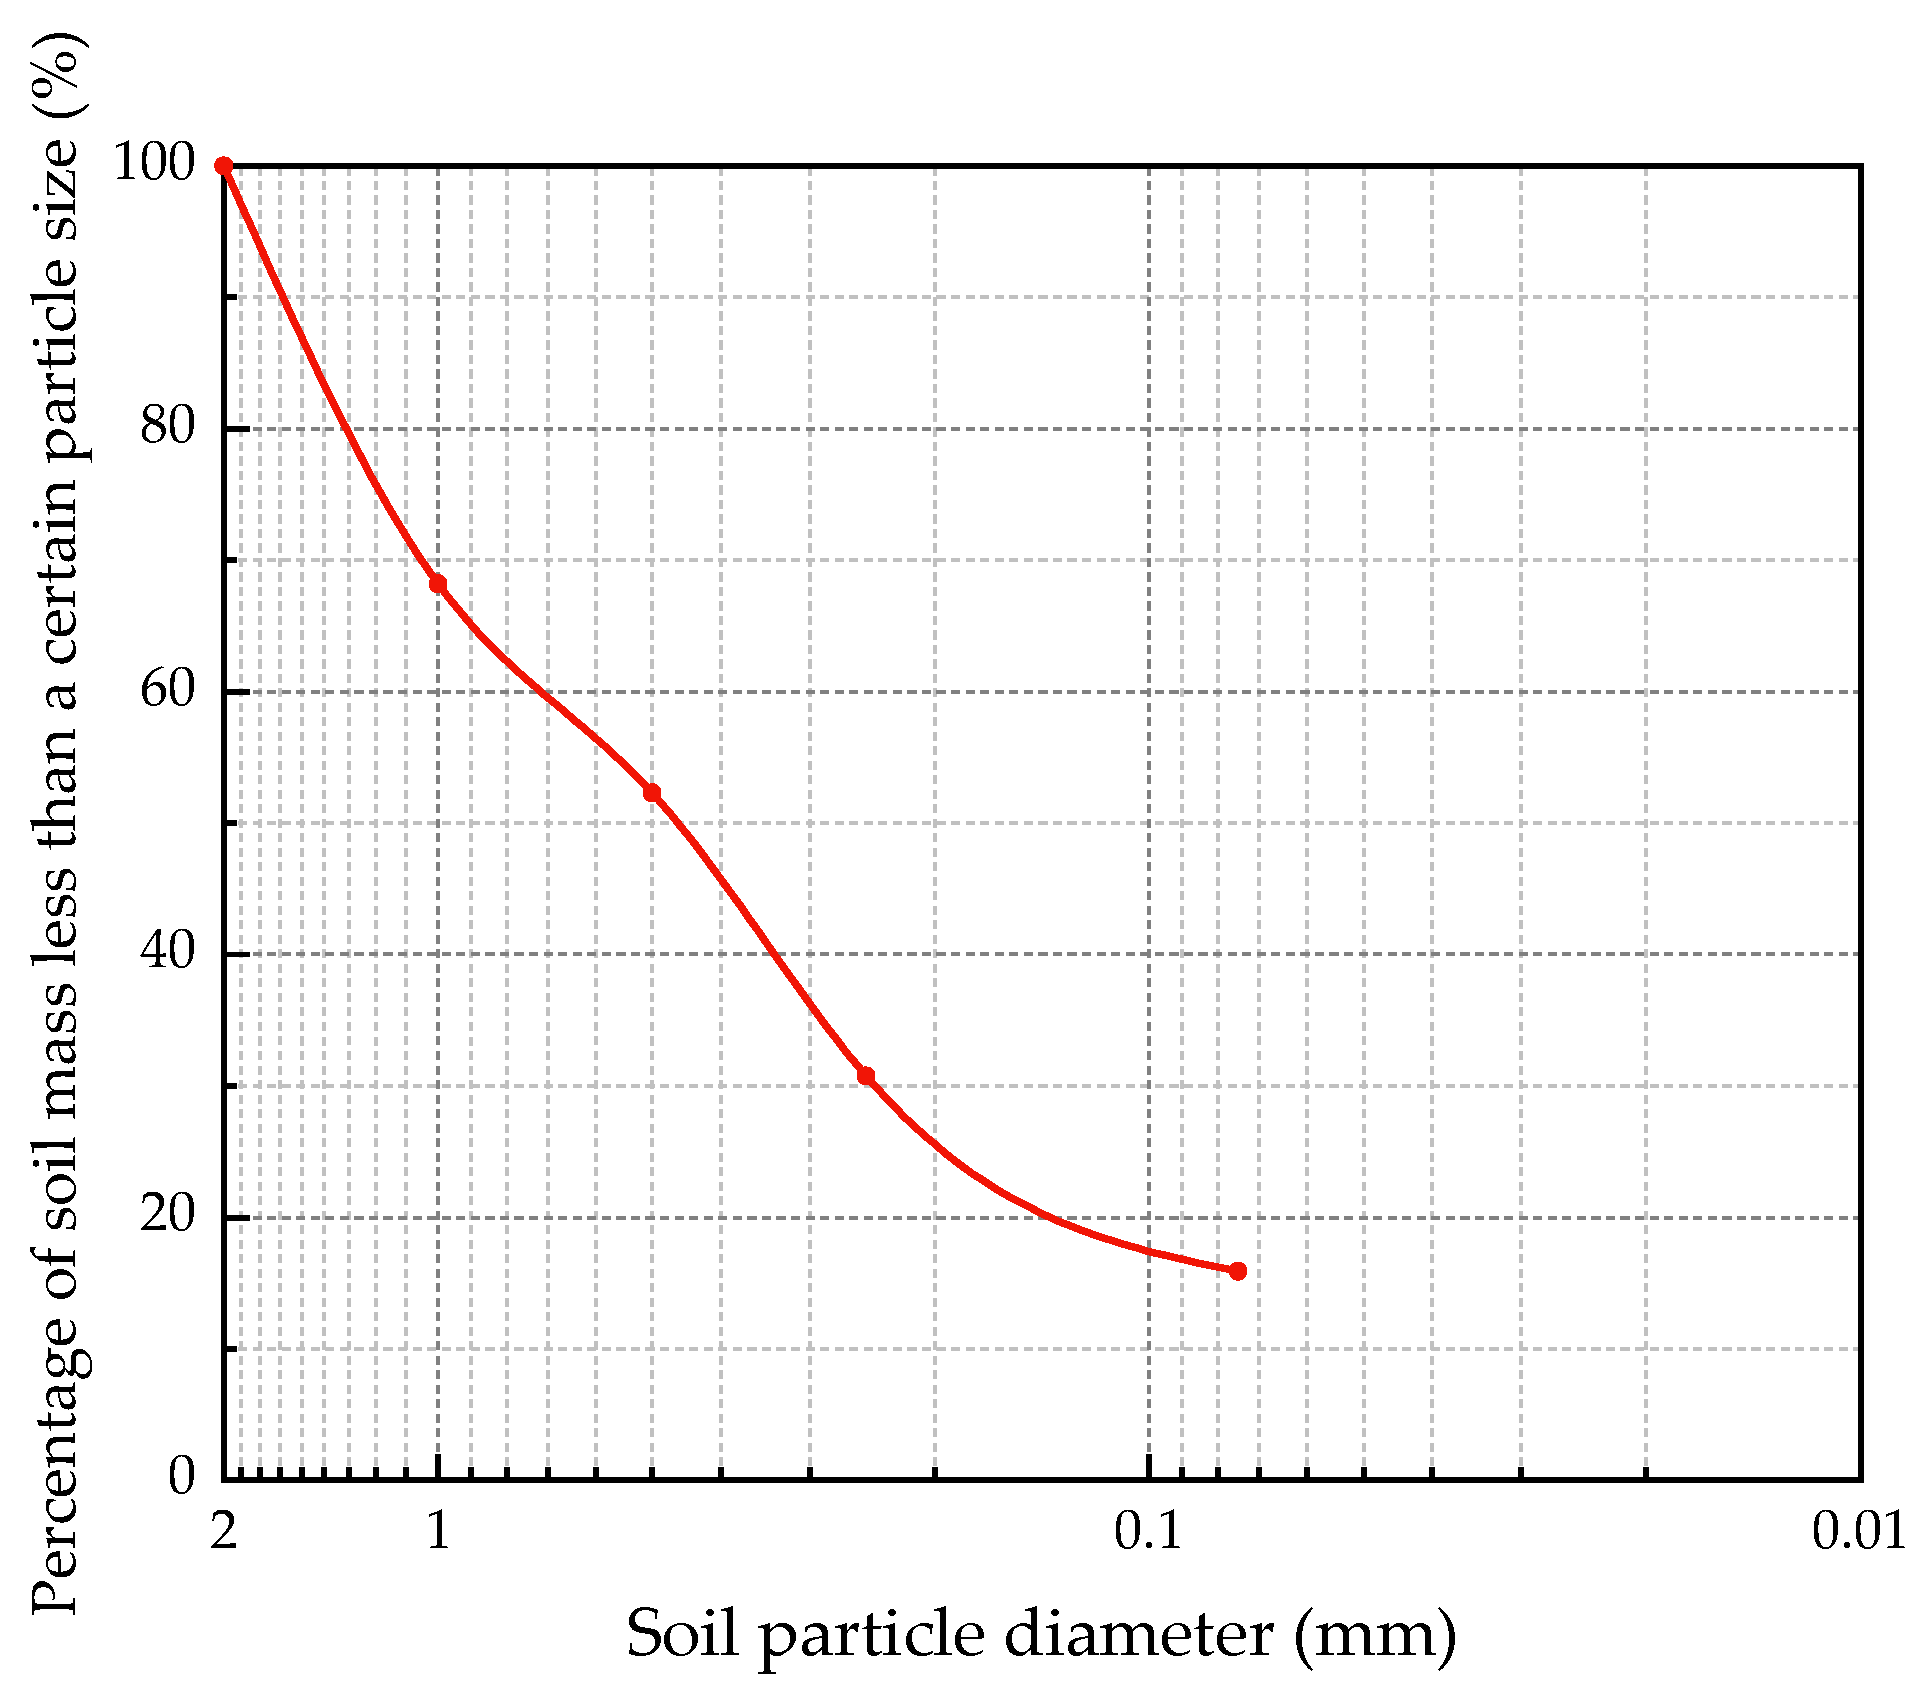
2.1. Test Materials

The soil sample employed in the test was taken from a 5–10 m foundation pit in Huainan City, China. The basic physical properties and particle gradation are shown in Table 1 and Figure 1, respectively. The cement used in this research was P·O 42.5 ordinary Portland cement; the physical and mechanical properties are shown in Table 2. The fly ash used in this research was grade II, with a main chemical composition of SiO2, Al2O3, and Fe2O3; the physical index is shown in Table 3. In addition, 6 mm short-cut basalt fibers were used, the physical index of which is shown in Table 4.

2.2. Specimen Preparation

This experiment used a water–cement ratio of 0.5. Cement, fly ash, and basalt fiber contents were 15%, 12%, and 1.0% of the dry soil mass, respectively, and the size of the cement soil specimen was Φ 50 mm × H 25 mm. According to the “Standard for Geotechnical Test Methods” (GB/T 50123-1999), specimens were made with the following steps. Firstly, the retrieved undisturbed soil was dried, crushed, passed through a 2 mm sieve, and prepared into soil samples according to the optimum moisture content; then, samples were left to settle for 24 h. After settling, the cement, fly ash, and basalt fiber were mixed (in order), and the mixture was loaded into a Φ 50 mm × H 25 mm mold in three layers. The contact surface of each layer was treated to ensure that soil samples are tightly connected at the boundaries between layers. After demolding, specimens were placed in a standard curing room with a humidity of 95% and a temperature of 20 ± 2 °C for 28 d.

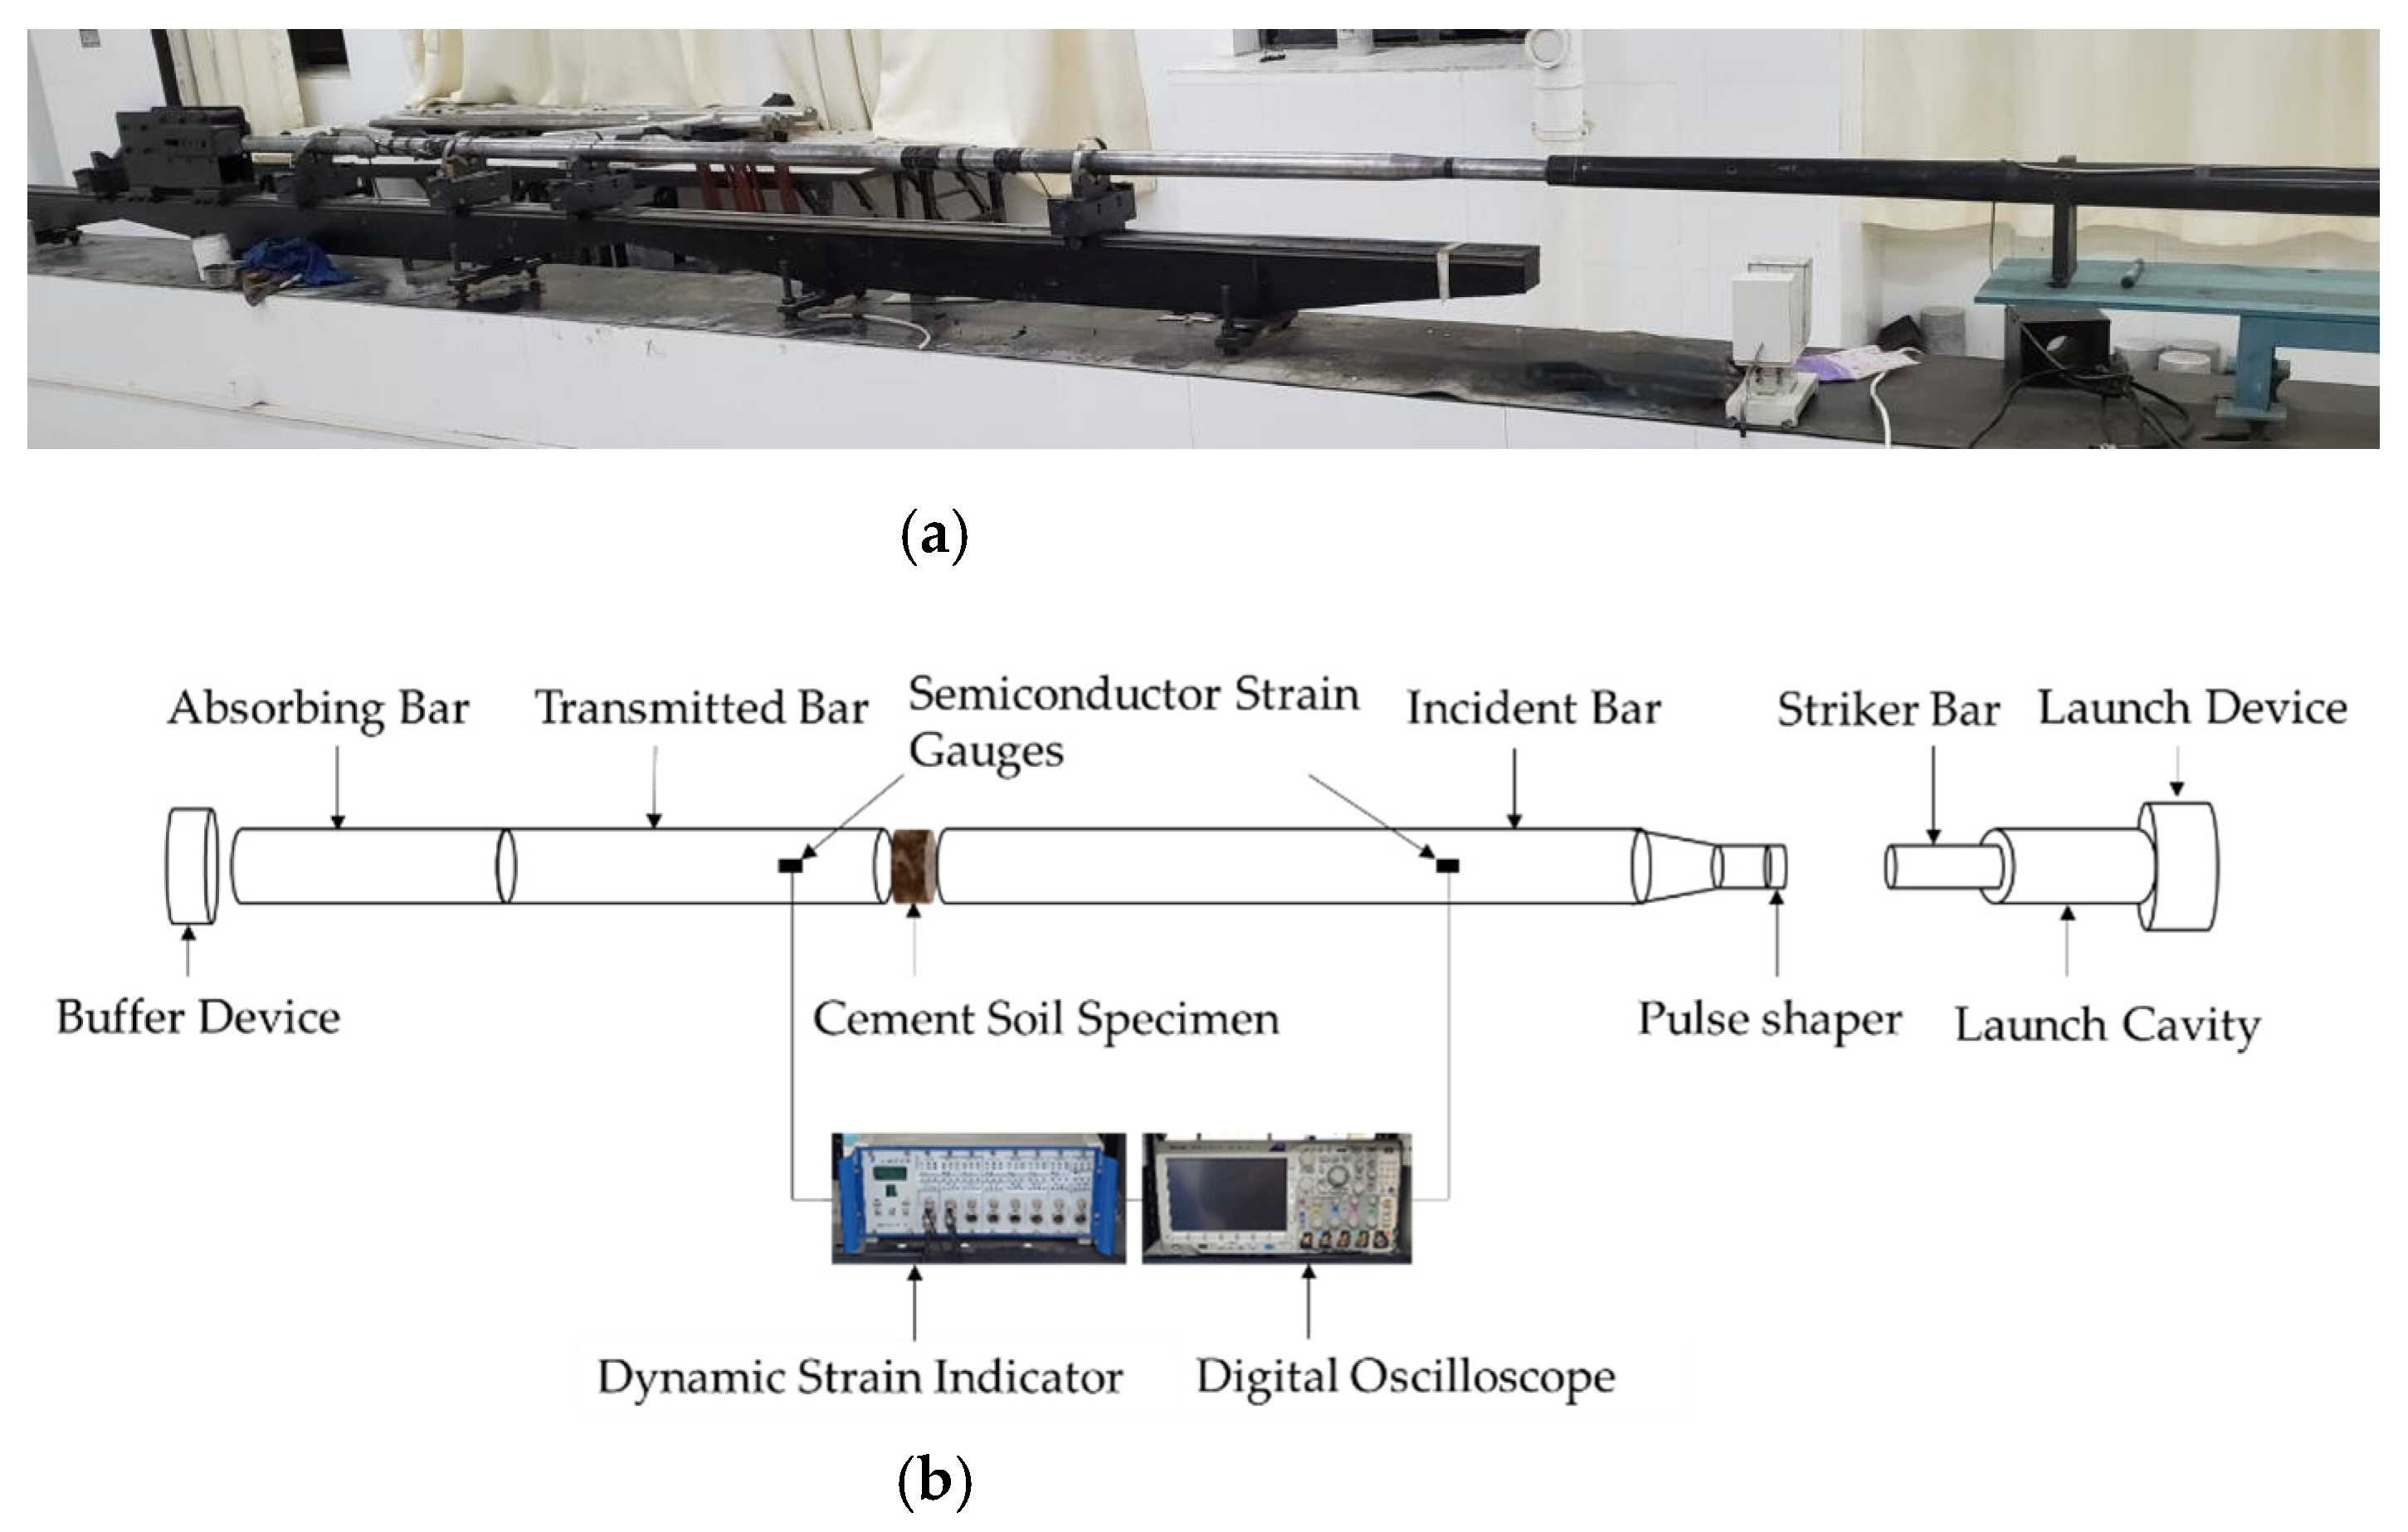
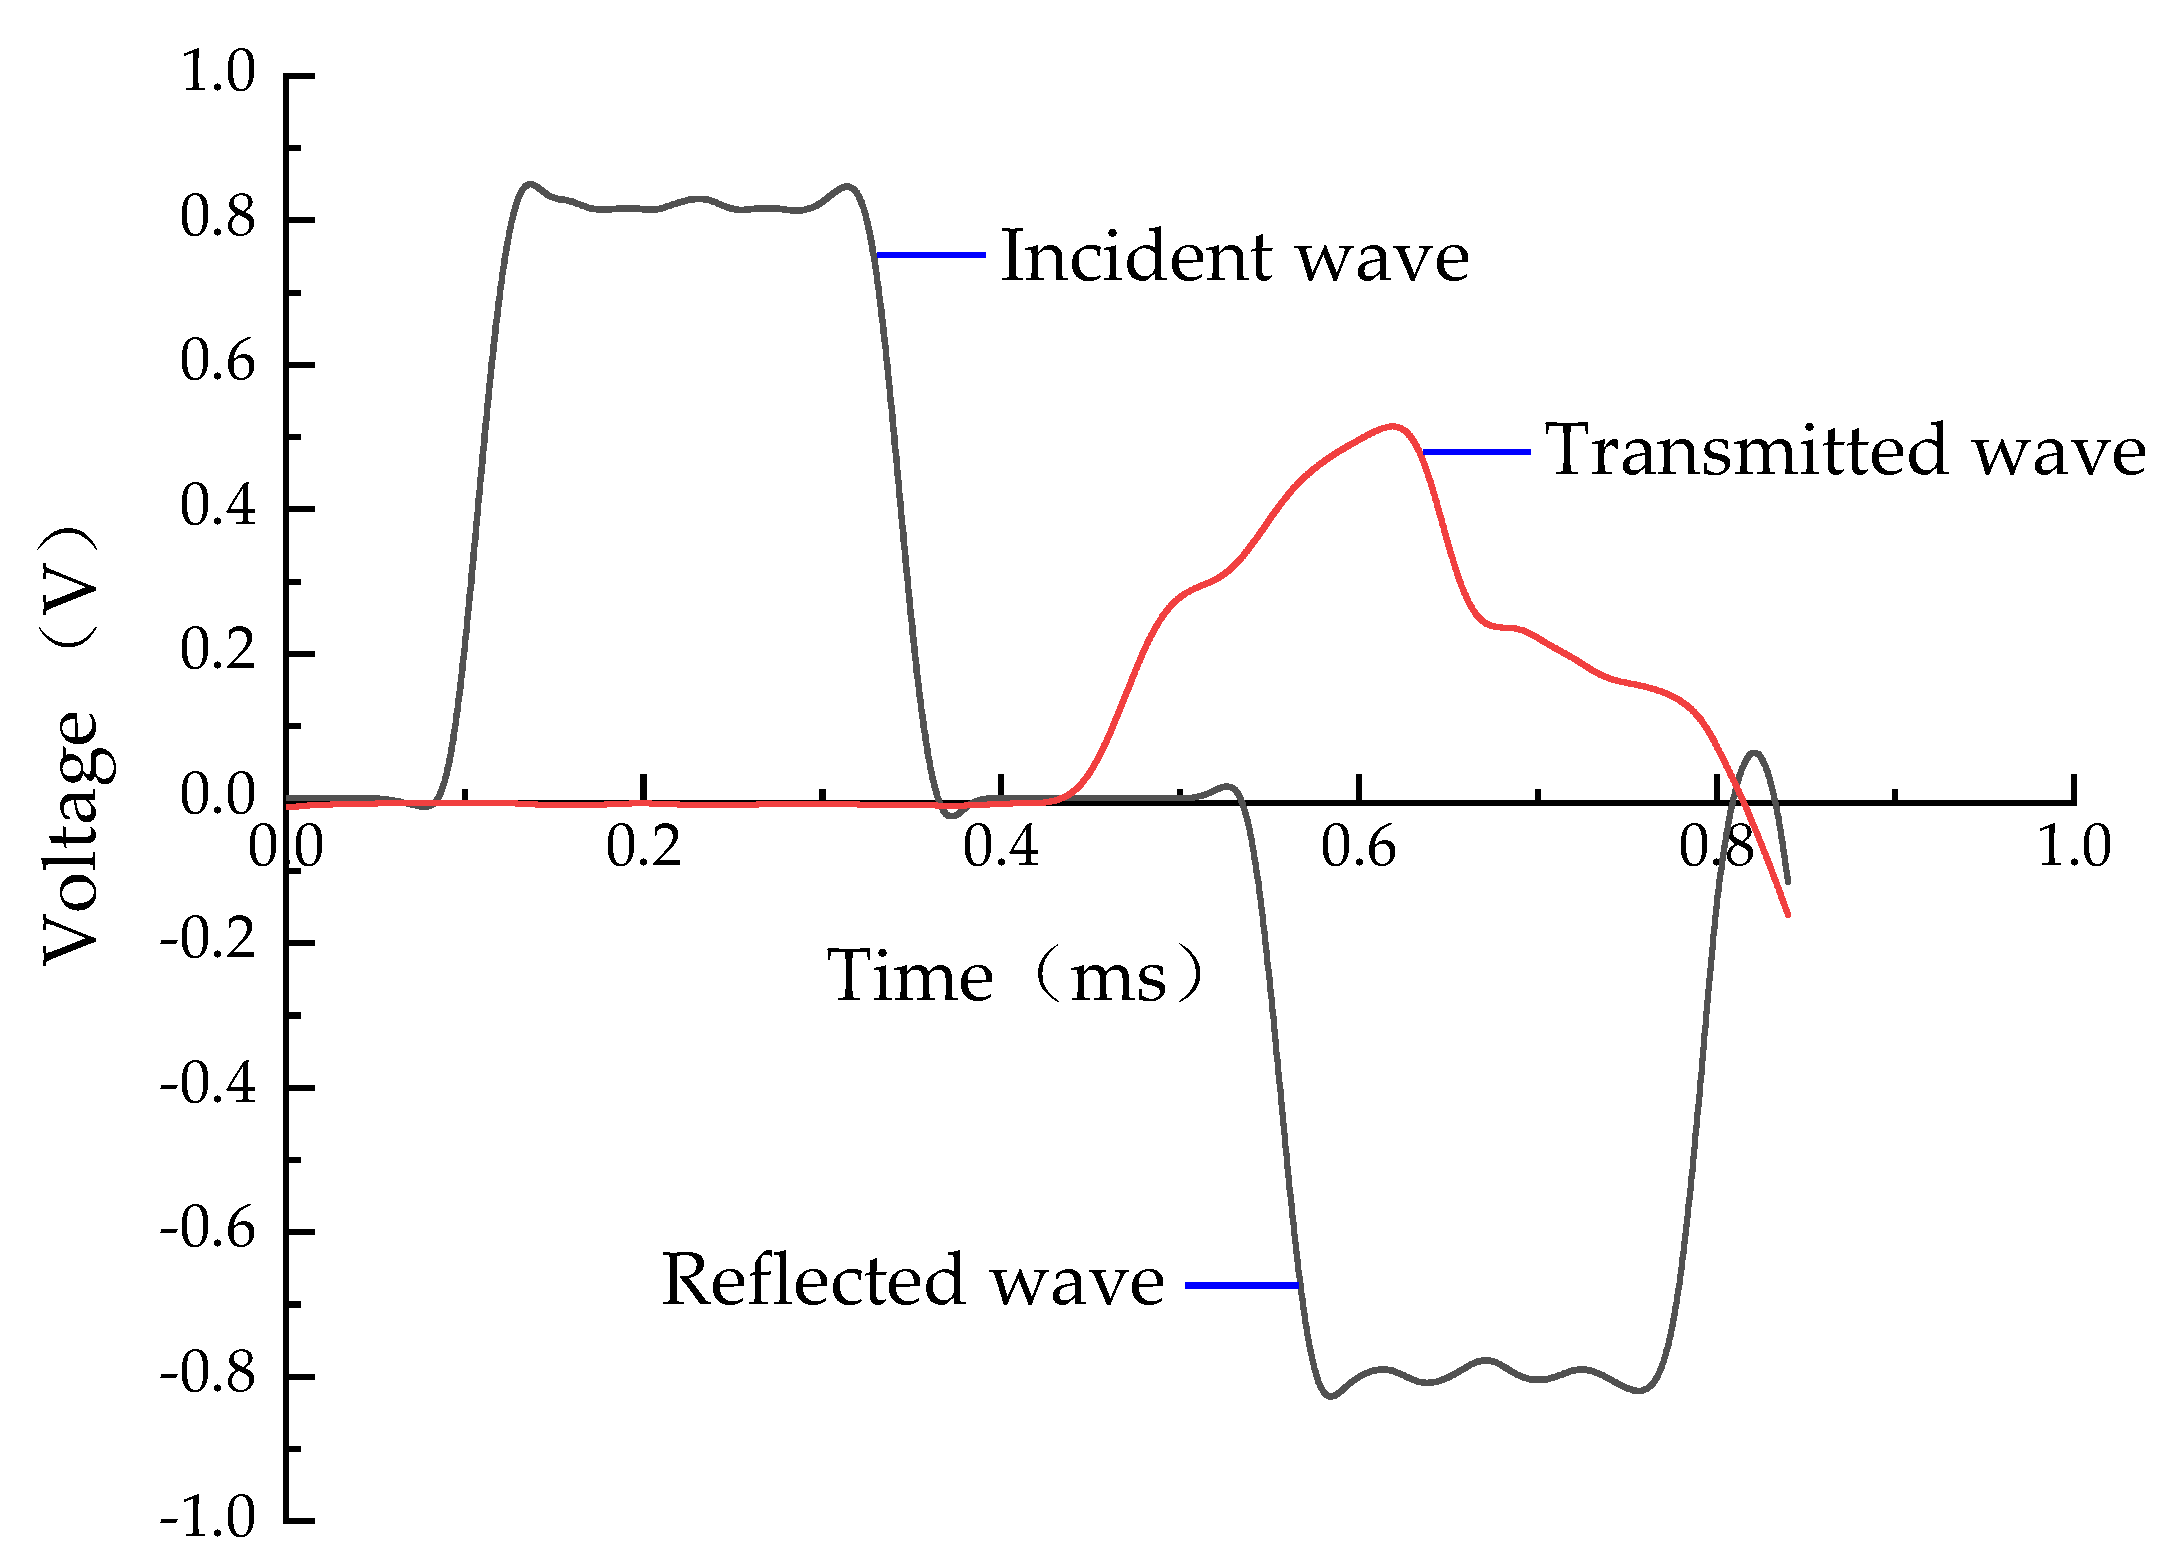
2.3. Test Plan and Equipment

The fabricated specimens were immersed in water and different concentrations of Na2SO4 solution (1.5, 4.5, 9.0, and 18.0 g/L) for the erosion test. An excess solution of 3 mm above the top surface of the specimen was always ensured during the test, and erosion times of 3, 7, 14, and 28 d were tested. Impact tests were carried out using the Φ 50 mm variable section of the split Hopkinson pressure bar test equipment of Anhui University of Science and Technology (as shown in Figure 2). The impact bar, incident bar, and transmission bar all consisted of alloy steel with lengths of 0.6, 2.4, and 1.2 m, respectively. The density was 7.8 g/cm3, the elastic modulus was 210 GPa, and the longitudinal wave velocity was 5190 m/s. The impact air pressure was set to 0.35 MPa. To ensure that the loading speed of each impact was identical, and to reduce the test error, the impact bar was placed at the same position before each impact test, and a pulse shaper was added to the front of the incidence bar.
To gain a clearer understanding of the changes in the internal structure and material composition of cement soil specimens exposed to different environments, samples of cement soil specimens were separately soaked in water and sulfate solution. Samples were then assessed via X-ray phase analysis and scanning electron microscopy. Equipment for the morphological and microstructural characterizations is shown in Figure 3.

3. Analysis of Test Results

Figure 4 shows the original waveform obtained from the test. The simplified three-wave method [25] was used to process the test data with the following equations:
σ ( t ) = A 0 E A s ε ( t )
ε ( t ) = C 0 L s [ ε I ( t ) ε R ( t ) ε T ( t ) ]
ε ( t ) = C 0 L s 0 t [ ε I ( t ) ε R ( t ) ε T ( t ) ] d t
where σ ( t ) , ε ( t ) , and ε ( t ) represent the stress, strain rate, and strain of specimens, respectively; ε I ( t ) , ε R ( t ) , and ε T ( t ) represent the incident strain, reflected strain, and transmission strain, respectively; and A0, As, E, C0, and Ls represent the cross-sectional area of the bar, the cross-sectional area of the specimen, the elastic modulus, the elastic compression wave velocity, and the length of the test piece, respectively.

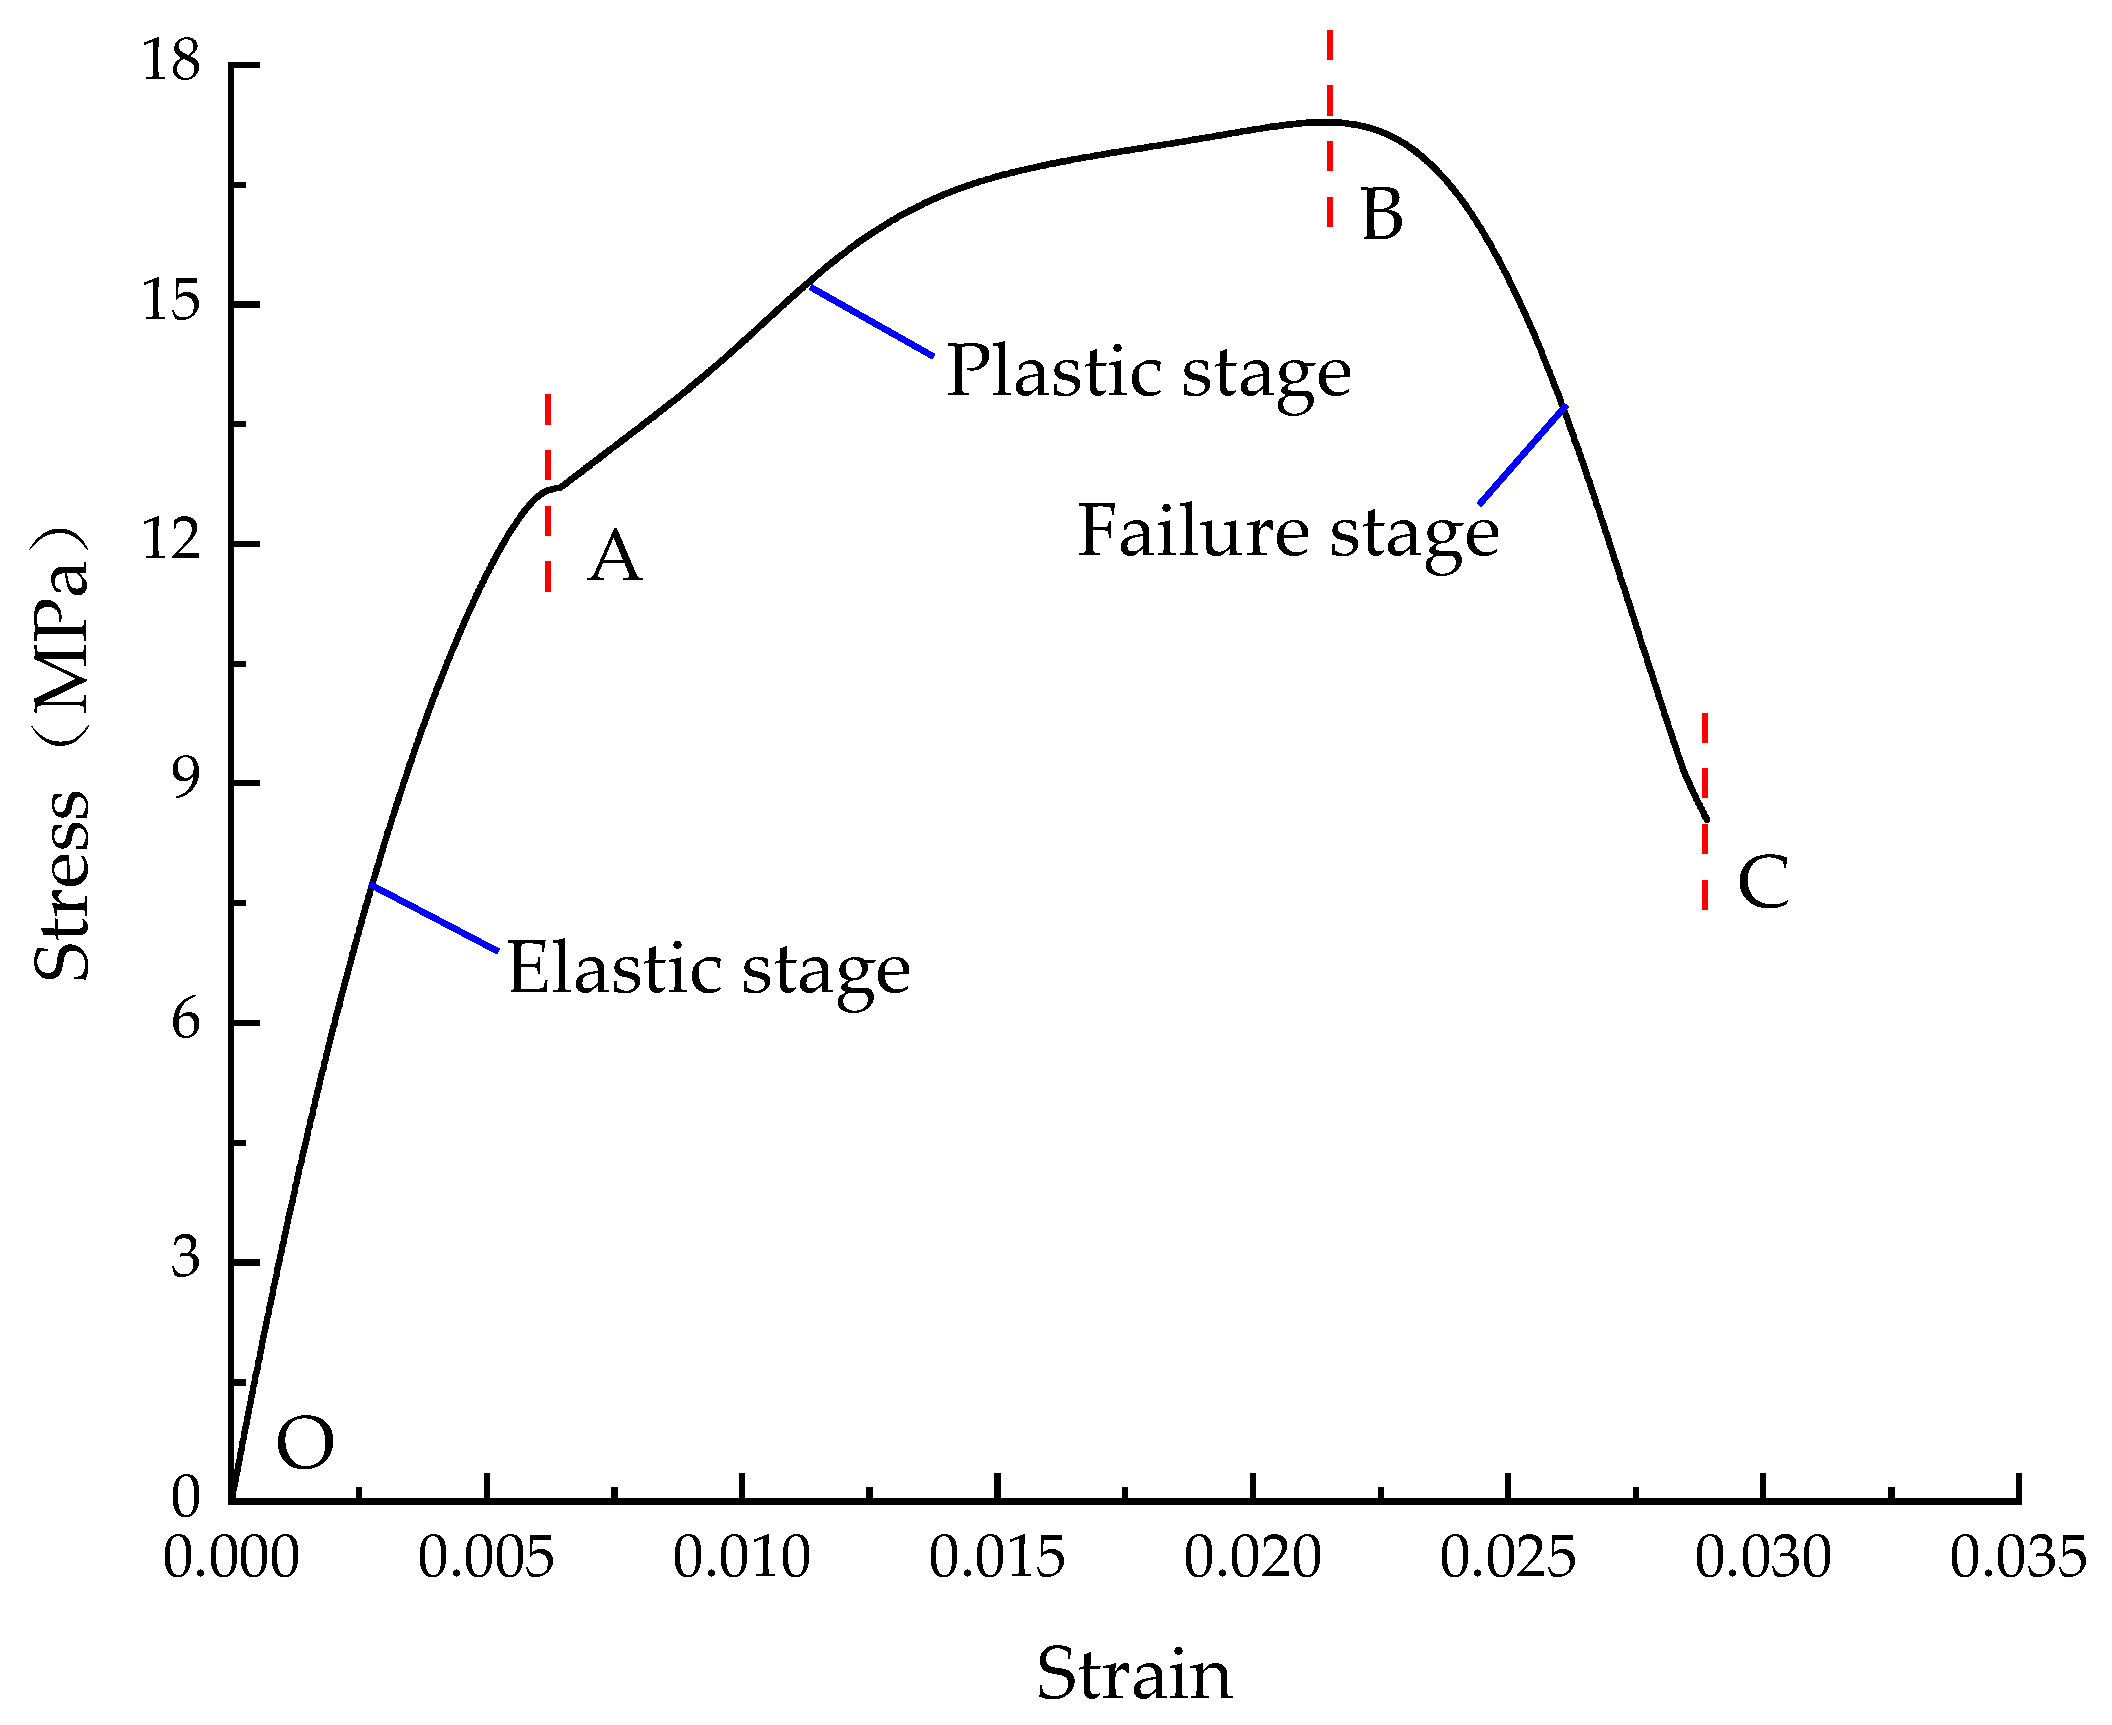
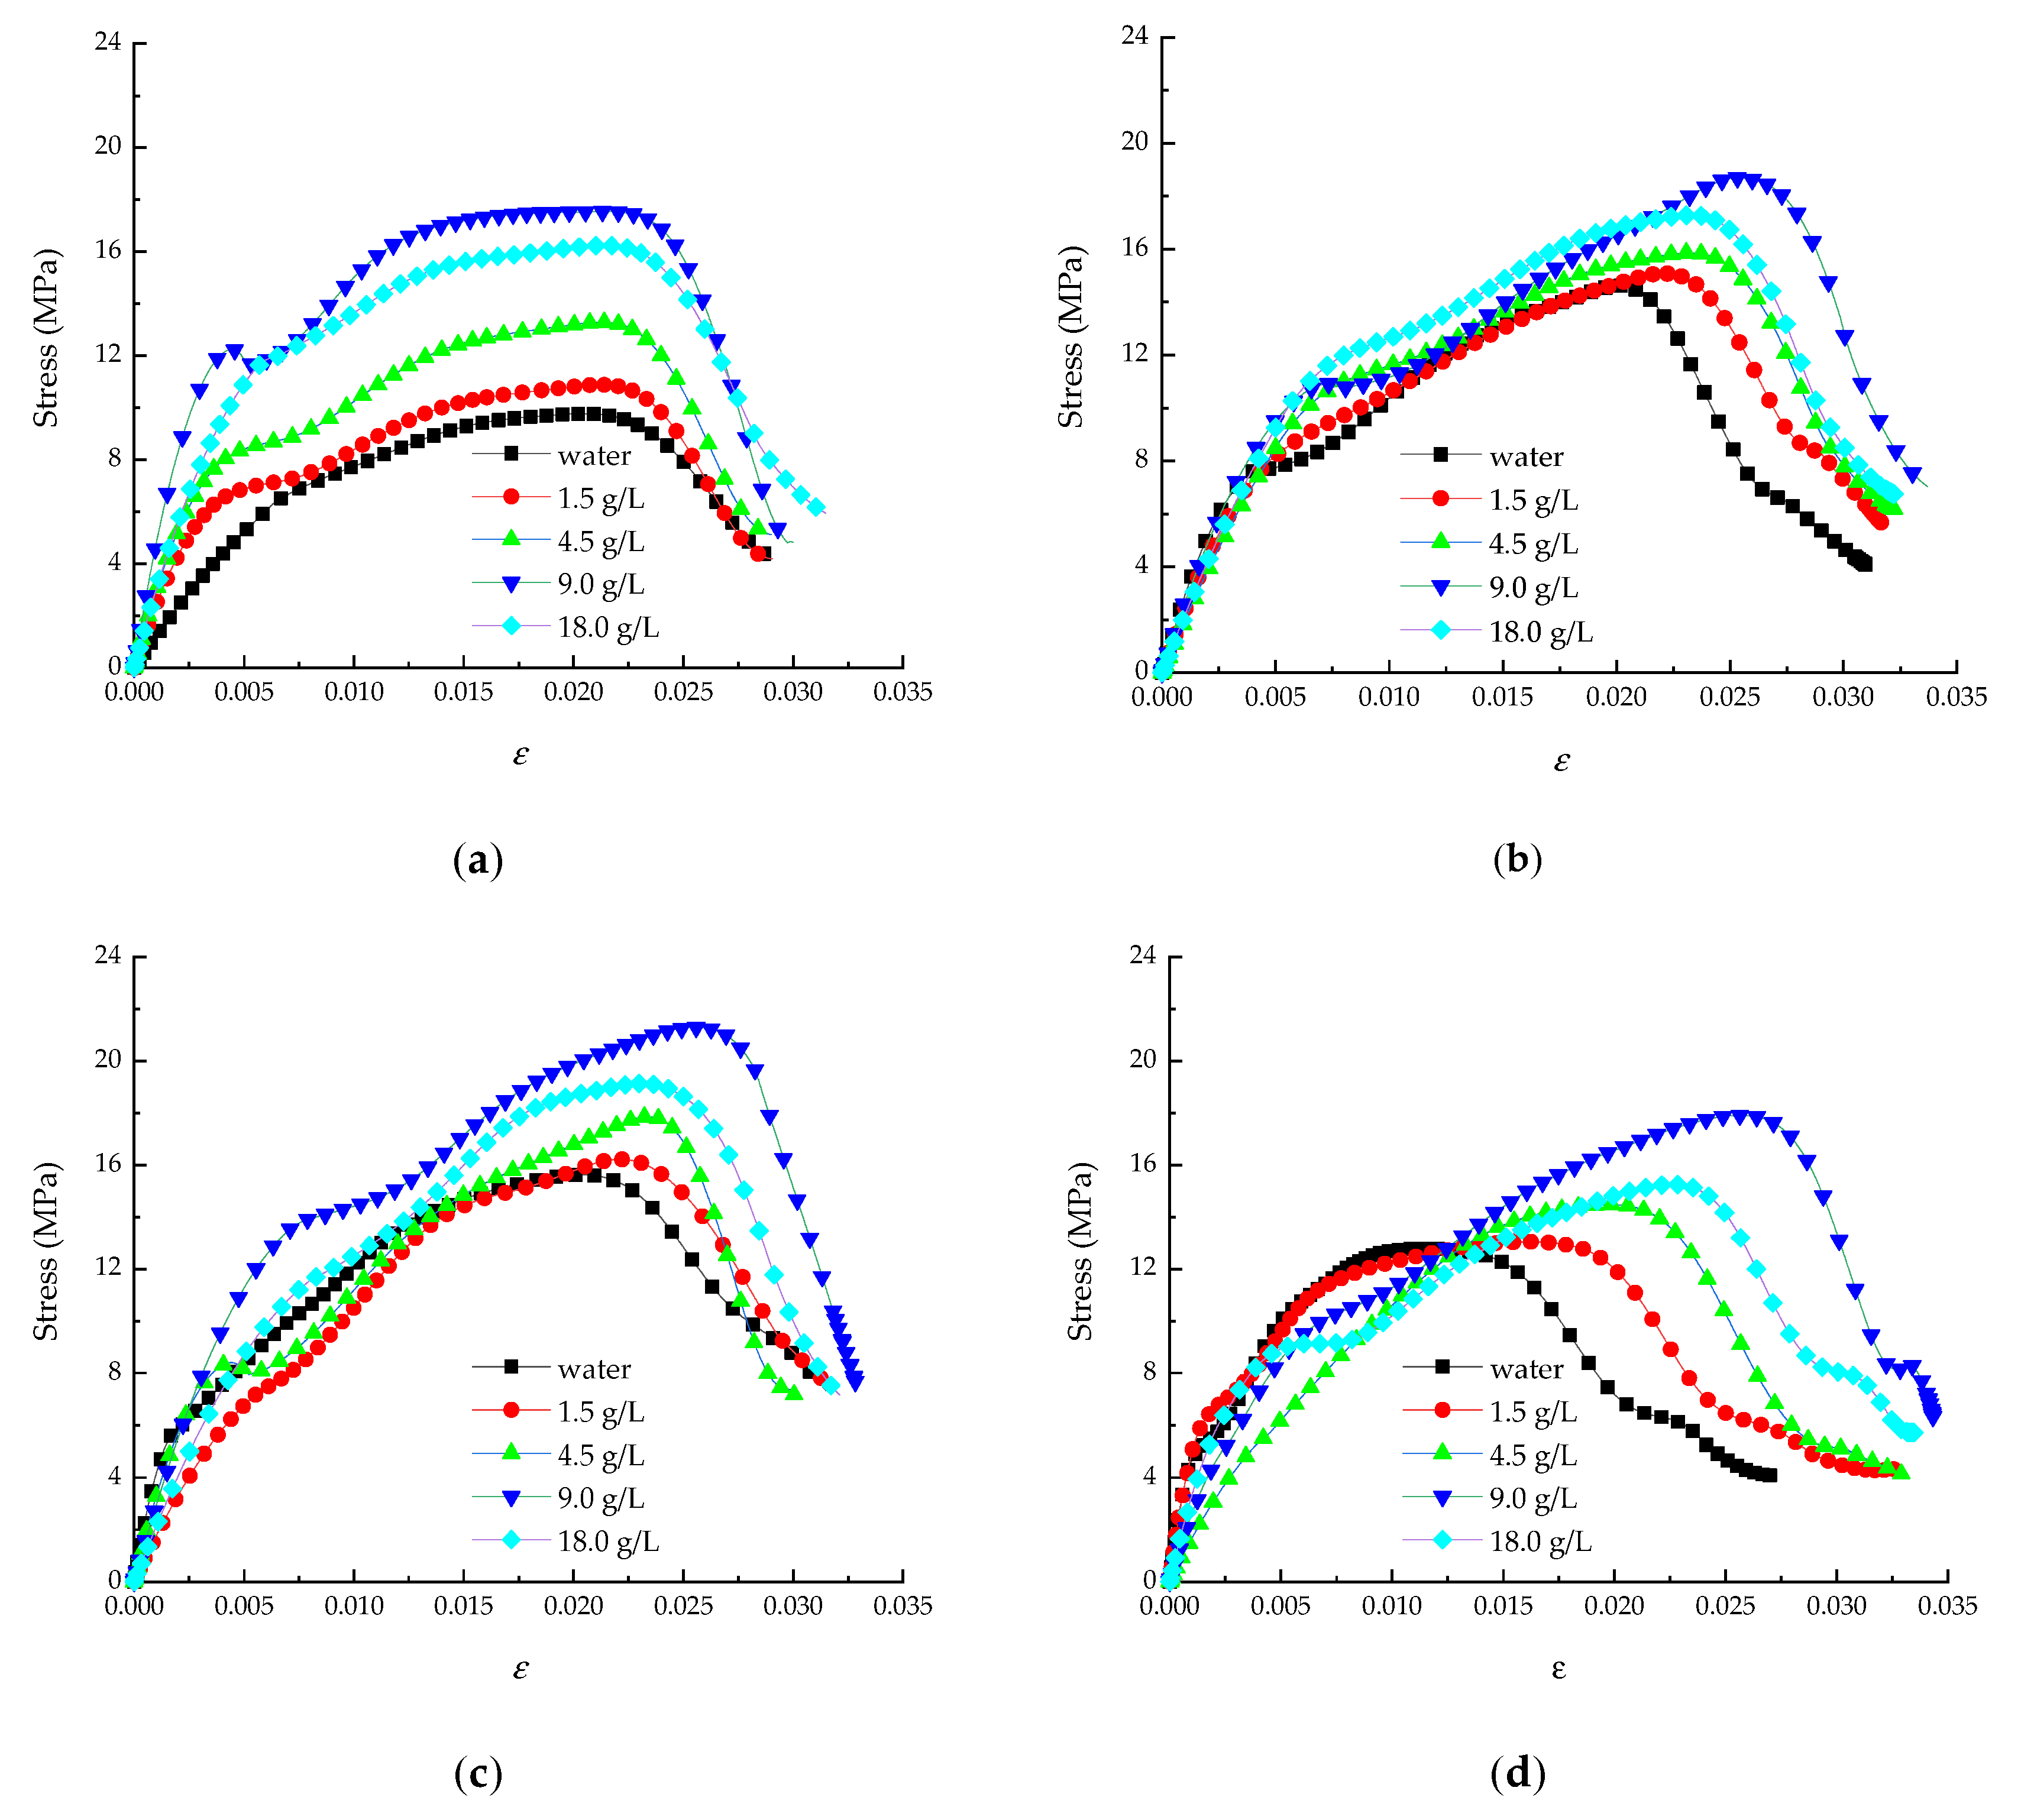
3.1. Dynamic Stress–Strain Curve

The dynamic stress–strain curves of the cement soil specimens can be roughly divided into an elastic stage, plastic stage, and failure stage (as shown in Figure 5) according to changes of the curing period and Na2SO4 solution concentration. The stress of the cement soil specimen increased linearly with increasing strain in the O-A stage (i.e., the stage between point O and point A in Figure 5), and the energy generated by the external force was continuously converted into elastic potential energy of the specimen. As the elastic stress of the specimen reached the limit value, it entered the A-B stage. At this stage, the stress of the cement soil specimen increased slowly with increasing strain, and microcracks emerged inside the specimen, which expanded gradually. Furthermore, the energy generated by the external force was dissipated because of the changing internal structure. As the yield stress was reached, the specimen entered the B-C stage. At this stage, the stress in the cement soil specimen decreased sharply with a small increase in strain, and eventually, cracks penetrated the specimen, causing damage.
Cement soil specimens, eroded by different curing periods and different concentrations of Na2SO4 solution, were subjected to dynamic impact tests and the original waveform diagrams were obtained. After processing by Equations (1)–(3), their stress–strain curves were drawn (as shown in Figure 6). A comparison of the four graphs in Figure 6 shows that under the erosion condition of the same concentration of Na2SO4 solution, the peak stress of the cement soil specimens showed a trend of first increasing and then decreasing with increasing curing period. A maximum value was reached at 14 d (as shown in Figure 6c). For the same curing period, the peak stress of the cement soil specimens followed a trend of first increasing and then decreasing with increasing Na2SO4 solution concentration but a constant curing period. The maximum value was reached at a Na2SO4 solution concentration of 9.0 g/L. Cement soil specimens with a curing period of 14 d were used for further analysis. The peak stresses and strains of the cement soil specimens were 15.63 MPa and 0.0203, 16.22 MPa and 0.0221, 17.86 MPa and 0.0232, 21.29 MPa and 0.0256, and 19.14 MPa and 0.0234 under the erosion of water and four different concentrations of Na2SO4 solutions (1.5, 4.5, 9.0, and 18.0 g/L, respectively). The peak stress was maximal at a concentration of Na2SO4 solution of 9.0 g/L, and increased by 36.22%, 31.26%, 19.23%, and 11.26% compared to water and the identified tested concentrations of Na2SO4 solution (1.5, 4.5, 9.0, and 18.0 g/L, respectively).

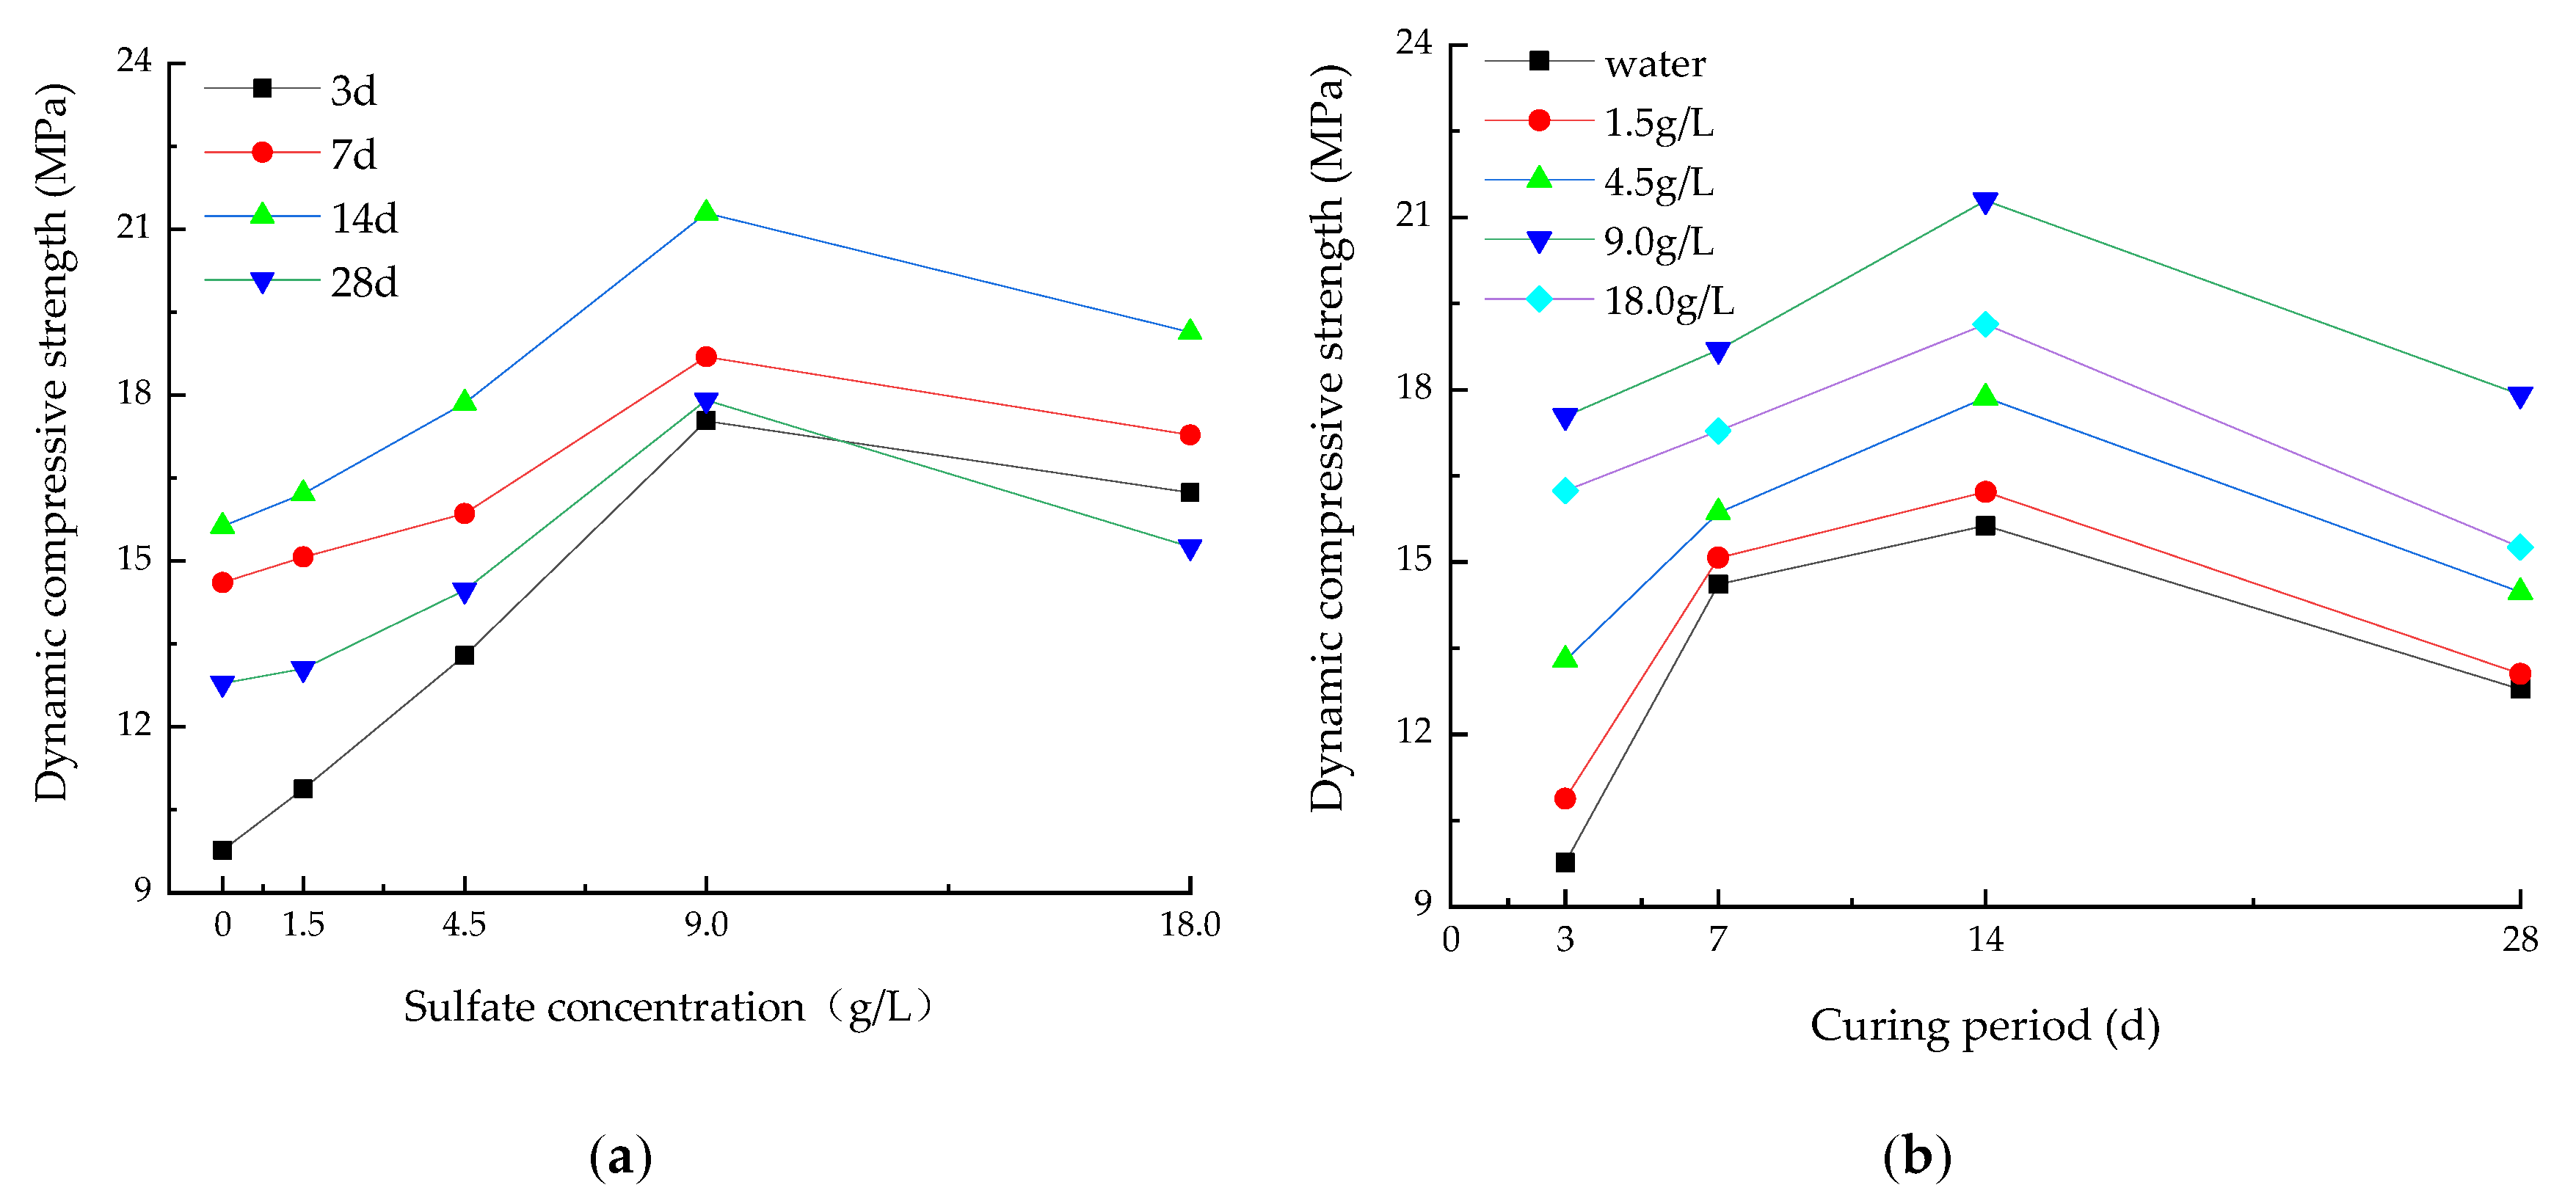
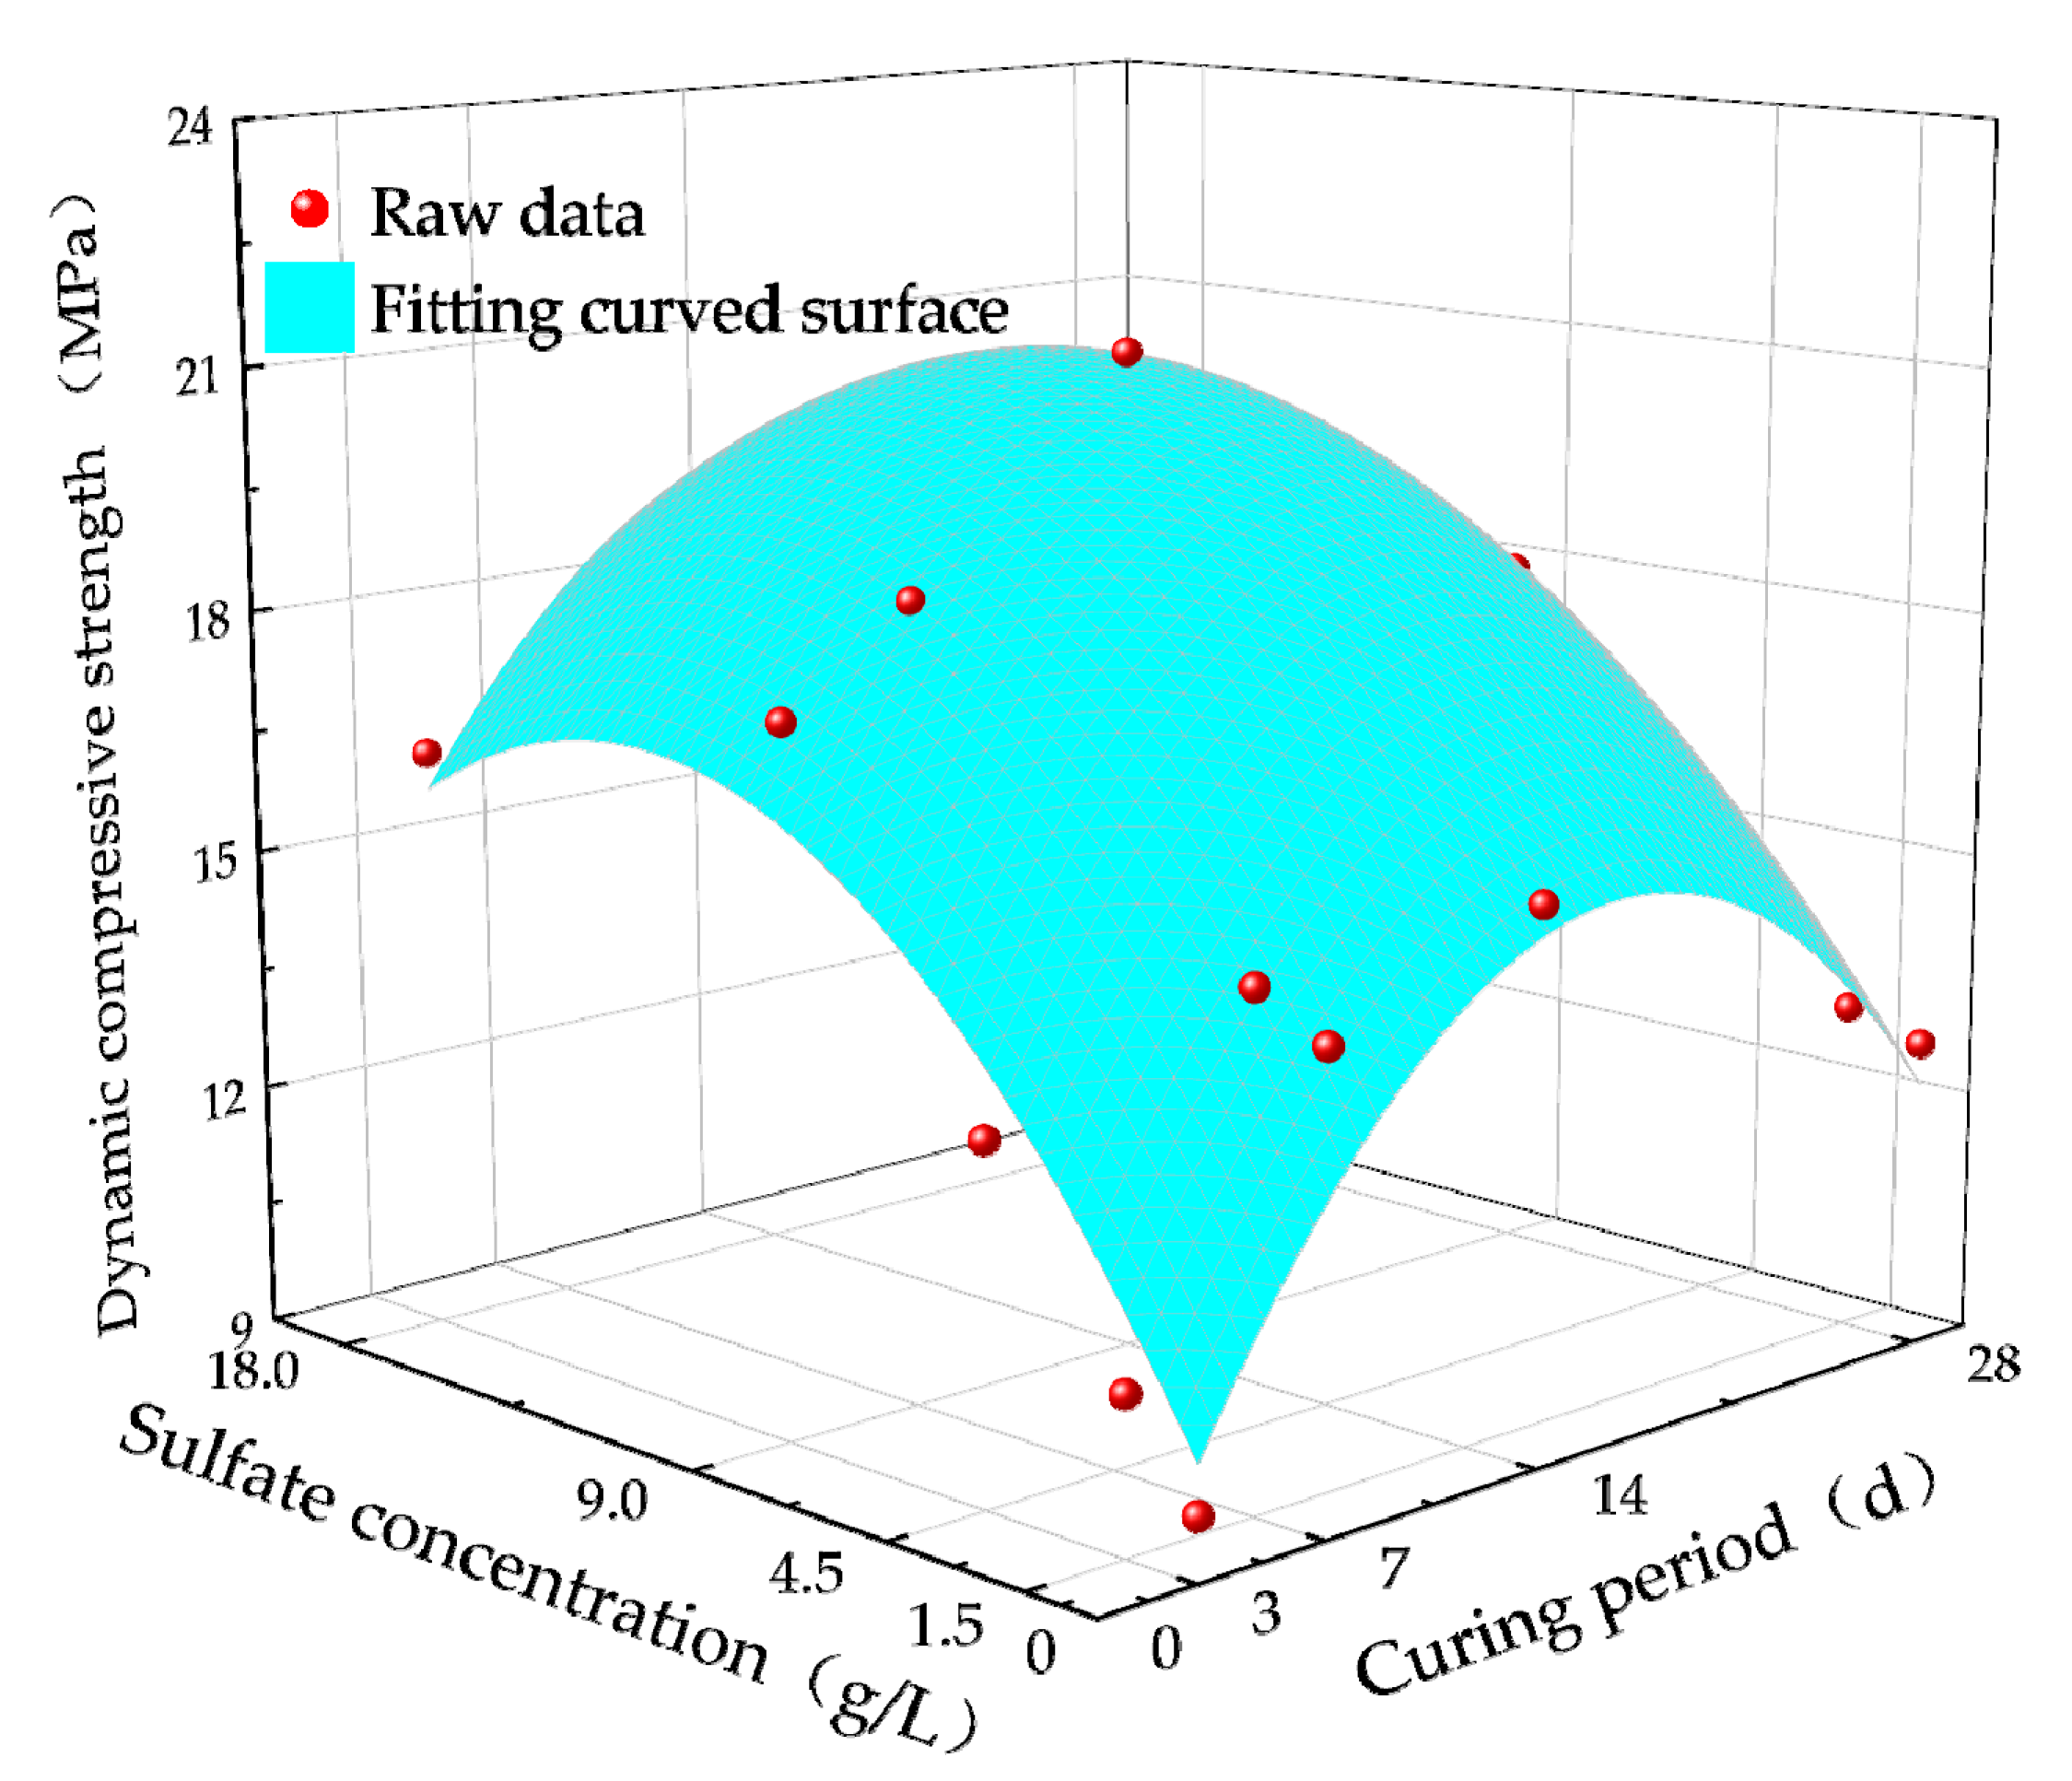
3.2. Dynamic Compressive Strength

Table 5 shows the dynamic compressive strength of the cement soil specimens under the action of different curing periods and different concentrations of Na2SO4 solution. The test data show a significant correlation between the curing period, the Na2SO4 solution concentration, and the dynamic compressive strength of the cement soil specimens.
To intuitively reflect the effect of curing period and Na2SO4 solution concentration on the dynamic compressive strength of the cement soil specimens, the data are depicted in Figure 7.
Figure 7a shows that under the erosion conditions of the same concentration of Na2SO4 solution, the dynamic compressive strength of the cement soil specimens showed a trend of first increasing and then decreasing with increasing curing period. Cement soil specimens eroded by 9.0 g/L Na2SO4 solution were analyzed. The dynamic compressive strengths of cement soil specimens with different curing periods (3, 7, 14, and 28 d) were 17.54, 18.69, 21.29, and 17.91 MPa, respectively. At a curing period of 14 d, the dynamic compressive strength was maximal, representing increases of 21.41%, 13.91%, and 18.87% compared with curing periods of 3, 7, and 28 d, respectively. This is because the Ca(OH)2 generated during the hydration process of the cement soil specimens promoted the hydration of fly ash; moreover, the SiO2 and Al2O3 substances in fly ash react chemically with Ca2+ to generate calcium silicate hydrate (3CaO·2SiO2·3H2O) and calcium aluminate hydrate (4CaO·Al2O3·19H2O), among other products. These hydration products are closely bonded to soil particles, thus forming a cemented mesh structure, which increases the strength of cement soil specimens. On the other hand, both the Na+ and SO42− in the sodium sulfate solution participate in the hydration reaction of cement soil to produce ettringite crystals (3CaO·Al2O3·3CaSO4·32H2O) and wollastonite (CaCO3·CaSO4·CaSiO3·15H2O), among other substances (the specific chemical formula is shown below). These gradually filled the internal pores of the specimens, yielding a denser specimen structure, thus leading to a rapid increase in dynamic compressive strength within the 14 d of curing. When the curing period increased beyond 14 d, the internal reaction gradually decreased with extended curing period, the generated material decreased correspondingly, and internal pores could not be filled well. With continuous erosion, the internal structure is gradually destroyed, leading to a decrease of dynamic compressive strength.
3 CaSO 4 + 4 CaO · Al 2 O 3 · 19 H 2 O + 14 H 2 O 3 CaO · Al 2 O 3 · 3 CaSO 4 · 32 H 2 O + Ca ( OH ) 2
2 CaSO 4 + 3 CaO · Al 2 O 3 · CaSO 4 · 18 H 2 O + 14 H 2 O 3 CaO · Al 2 O 3 · 3 CaSO 4 · 32 H 2 O
CaCO 3 + Ca ( OH ) 2 + SiO 2 + CaSO 4 · 2 H 2 O + 12 H 2 O CaCO 3 · CaCO 4 · CaSiO 3 · 15 H 2 O
Figure 7b shows that under the same curing period condition, the dynamic compressive strength of the cement soil specimens followed a trend of first increasing and then decreasing with increasing Na2SO4 solution concentration. Cement soil specimens with a curing period of 14 d were analyzed. The dynamic compressive strengths of the cement soil specimens were 15.63, 16.22, 17.86, 21.29, and 19.14 MPa under the action of water and four different Na2SO4 solution concentrations (1.5, 4.5, 9.0, and 18.0 g/L, respectively). At a concentration of Na2SO4 solution of 9.0 g/L, the dynamic compressive strength was maximal, representing increases of 36.22%, 31.26%, 19.23%, and 11.26% compared with water and the four concentrations of Na2SO4 solution, respectively. The reason is that at concentrations of Na2SO4 solution of 0, 1.5, and 4.5 g/L, the SO42− content in the specimen was low, the reaction generated less material, the pore filling rate was low, and the dynamic compressive strength was low. At a concentration of Na2SO4 solution of 18.0 g/L, the SO42− content was high, large amounts of ettringite crystals and wollastonite were generated, and the internal pores of the specimens were filled. When the expansion force exceeds the cementing force of the specimen, the internal structure is damaged, resulting in a lower dynamic compressive strength of the specimen.
Multivariate nonlinear fitting of the dynamic compressive strength of the cement soil specimen was carried out for the age of curing and the concentration of Na2SO4 solution. The fitting results are shown in Figure 8. The fitted surface shows an obvious arch feature; therefore, the dynamic compressive strength of cement soil specimens reaches the maximum value when the curing period and the concentration of Na2SO4 solution reach a specific range. In the tested case, the dynamic compressive strength of the cement soil specimens reached the maximum value at a curing period of 14 d and a Na2SO4 solution concentration of 9.0 g/L.
σ D C S = 7.920 + 0.892 t + 1.039 ρ 0.026 t 2 0.040 ρ 2 0.006 t ρ
R2 = 0.920
In this formula, σ D C S is the dynamic compressive strength of the cement soil specimen, t is the curing period of the specimen, and ρ is the mass concentration of the Na2SO4 solution.

3.3. Absorption Energy

In the dynamic impact test, according to the stress–strain curves of incident wave, reflected wave, and transmitted wave, the incident energy (WI), reflected energy (WR), and transmitted energy (WT) were calculated, respectively. The absorption energy (WS) of the cement soil specimen was calculated according to the principle of energy conservation [26,27]. The specific formulae are shown in the following:
W i = A 0 C 0 E 0 t ε i 2 ( t ) d t       i = I , R , T
WS = WI − WR − WT
Note: The energy lost by friction between the bar and the end of the specimen was neglected because an appropriate amount of lubricant (i.e., petroleum jelly) was evenly applied to the contact surface between the cement soil specimen and the bar.
According to the results of the impact tests, the curves of absorption energy of the cement soil specimens under different curing periods and different concentrations of Na2SO4 solution are shown in Figure 9. In the initial loading stage of the test (i.e., 0–25 μs), the absorption energy of the cement soil specimen was approximately 0 because of the time required for stress wave transmission. In the stage of 25–250 μs, the absorbed energy of the cement soil specimens increased roughly in a linear manner. This is because when subjected to impact loading, the stress wave strength exceeds the ultimate compressive strength of the cement soil specimen, causing the formation of internal microcracks. With continuous loading, the cracks inside the specimen gradually expand, and a large amount of energy is consumed to suppress further crack development; thus, the absorption energy continues to increase. In the stage of 250–300 μs, cracks inside the specimen expanded rapidly, and when the tensile force of the specimen was insufficient to resist the rate of crack expansion, the crack penetrated the specimen, causing damage. Finally, the absorption energy tended toward a stable value.
During the impact process, the absorption energy mainly consists of the energy absorbed by crack expansion and the damage of specimens. The energy consumed by the splash of fragments after the impact damage of the specimen and other energy consumption, and the energy used for the crack expansion and damage of the specimen accounts for at least 95% of the total absorption energy [28]. Therefore, during the loading process, the energy absorbed by the cement soil specimen is mainly used to resist crack expansion. As the substance generated by the reaction between SO42− and hydride fills pores inside the cement soil specimen, it yields a denser internal structure. A greater compactness inside the specimen yields a greater energy required for specimen failure and a greater absorption energy. In this test, the authors mixed basalt fibers into cement soil specimens, which added a bridging effect and crack resistance when subjected to impact loading. This treatment can effectively inhibit crack expansion, but this process also consumes considerable energy; therefore, the increase of absorption energy played a positive role in the resistance to damage of the cement soil specimen. The higher the absorption energy of the specimen, the stronger its resistance to damage, and the greater its dynamic strength.
Figure 9 shows that the absorbed energy of the cement soil specimens followed a trend of first increasing and then decreasing with increasing curing period and concentration of Na2SO4 solution. The absorption energy of the specimens reached the maximum value at a curing period of 14 d and a concentration of Na2SO4 solution of 9.0 g/L. At a concentration of Na2SO4 solution of 9.0 g/L, the absorption energy of the cement soil specimens cured for 3, 7, 14, and 28 d increased by 30.57%, 30.92%, 31.21%, and 31.32%, respectively. At a curing period of 14 d and Na2SO4 solution concentrations of 1.5, 4.5, 9.0, and 18.0 g/L, the absorption energy of the cement soil specimens increased by 5.03%, 15.78%, 31.21%, and 20.89%, respectively. These results indicate that a curing period of 14 d and a concentration of 9.0 g/L Na2SO4 solution are most beneficial for increasing the absorption energy of cement soil specimens.

3.4. Microstructural Characteristics

The microstructure and crystal structure of cement soil specimens changed significantly after cement soil specimens were eroded by sulfate. This change may have a large impact on the mechanical properties of specimens; therefore, the authors performed X-ray physical phase analysis and electron microscopy scanning on the cement soil specimens immersed in water and sulfate solution, respectively. The results of the analyses are shown in Figure 10 and Figure 11.

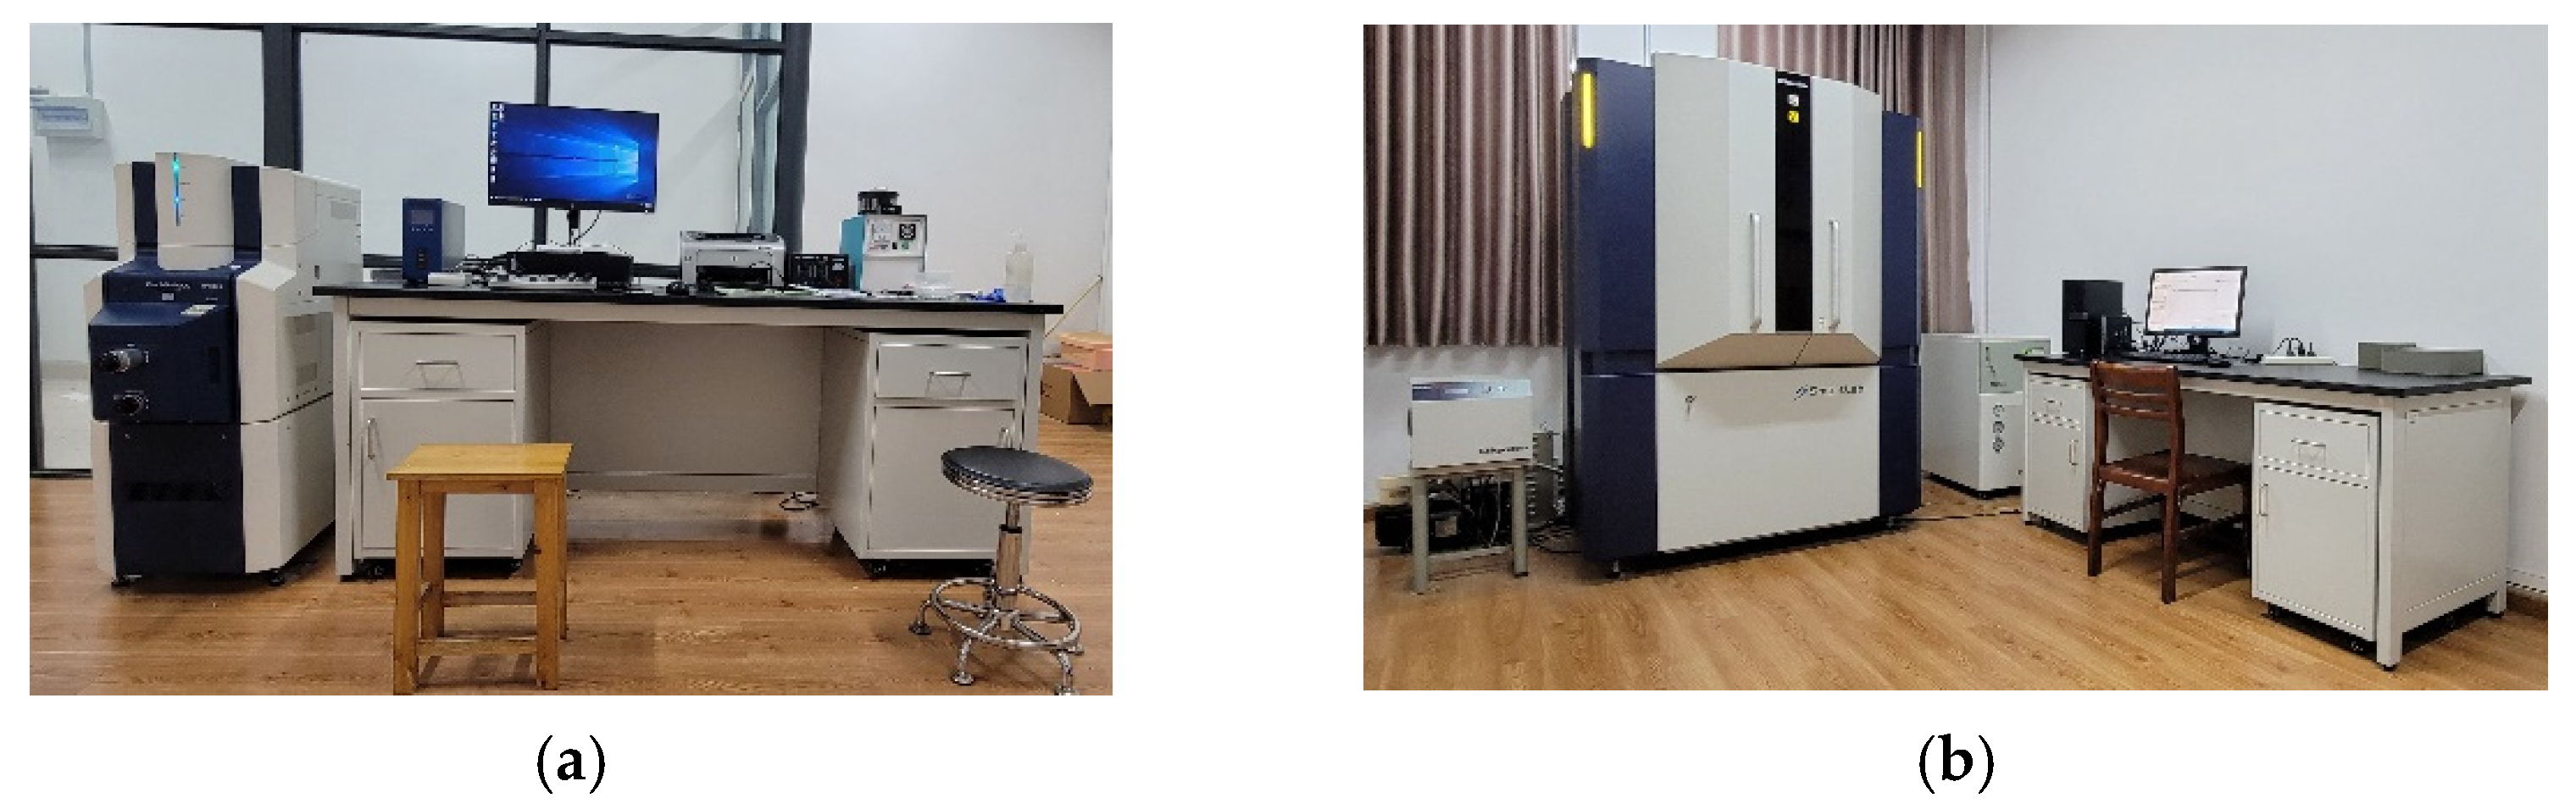
3.4.1. X-ray Physical Phase Analysis

Figure 10a presents the X-ray physical phase analysis of a cement specimen after soaking in water. Figure 10b shows the X-ray physical phase analysis of a cement specimen after soaking in sulfate solution. Several differences are apparent. Figure 10a shows that the cement soil specimen soaked in water shows characteristic quartz peaks, indicating a higher crystallinity. Characteristic peaks of muscovite, calcium silicate hydrate, anhydrite, calcite, wollastonite, and ettringite are weaker, indicating the presence of these substances in the specimen, but with lower crystallinity. Therefore, the corresponding characteristic peaks are lower. The corresponding PDF numbers and diffraction angles of these substances are listed in Table 6. Quartz, muscovite, anhydrite, and calcite were present in the cement soil specimen itself; reactive calcium reacts with both reactive silicon and reactive aluminum in a complex reaction, which forms calcium silicate hydrate; silicic acid reacts with calcium oxide, forming wollastonite; and gypsum reacts with calcium aluminate hydrate, forming ettringite.
Figure 10b shows that the mineral composition of the cement soil specimen soaked in sulfate solution differed from that of the specimen soaked in water. The characteristic peaks of albite and anorthite structures appeared in the specimen eroded by sulfate, while neither of these two characteristic peaks appeared in the specimen soaked in water. Furthermore, the intensity of the ettringite diffraction peak shown in Figure 10b was significantly stronger than that in Figure 10a. Because of the polymerization reaction of reactive sodium in sodium sulfate solution with both reactive aluminum and reactive silicon in the specimen (which promoted the generation of albite), and the reaction of reactive calcium with reactive aluminum and reactive silicon (which generated anorthite), albite and anorthite are rock-forming minerals. These two substances not only play a filling role, but anorthite is also a kind of hydrated calcium silicate aluminate gel, which can firmly bond soil particles together. This bonding significantly contributes to the development of strength. As the sulfate solution contained a large amount of SO42−, the amount of ettringite generated exceeded that of the specimen soaked in water. Large amounts of ettringite and albite continuously filled the pores inside the specimen, which continuously affected the strength of the cement soil specimen.

3.4.2. Scanning Electron Microscope Analysis

Figure 11 shows that there were more ettringite crystals, albite crystals, and anorthite crystals in cement soil specimens soaked in sulfate solution, which corroborates the results of the X-ray physical phase analysis. Figure 11a shows that there were flocculent gel substances and needle-like substances in the cement soil specimen soaked in water. These are calcium silicate hydrate and ettringite crystals. While these substances bond the soil particles together, because of their low bond strength, they can only exert a slight gelling function. Furthermore, the number of generated calcium alumite crystals was low and their filling effect was poor, causing the number of pores between soil particles to increase. At the same time, round spherical fly ash particles were scattered among soil particles, indicating that the hydration reaction of the cement soil specimen was not sufficient. Figure 11b shows that more needle-like ettringite crystals, massive albite crystals, and agglomerated anorthite crystals are were in the cement soil specimen. These continuously filled the pores inside the specimen, thus condensing the internal structure of the specimen and changing its strength.
The above analysis shows that the compressive strength of the cement soil specimens immersed in sulfate solution exceeded that of the specimens immersed in water. With increasing sulfate concentration, ettringite, albite, and other substances generated inside the specimen gradually increased, resulting in a constant improvement of the strength of the specimen. However, when the sulfate concentration is too high, an excessive amount of compound will be generated, causing the inside of the test piece to expand. This will damage the internal structure of the test piece, thereby reducing its strength.

4. Conclusions

In this study, the research variables of curing period and Na2SO4 solution concentration were applied. Their effects on the dynamic mechanical properties and energy absorption characteristics of cement soil specimens were assessed under the same impact load. The main conclusions are presented as follows:
(1) With continuous loading, cement soil specimens successively go through an elastic stage, plastic stage, and damage stage. In the elastic stage, specimens continuously absorb stored energy, and stress increases with increasing strain. When the elastic stress reaches the limit and specimens enter the plastic stage, the stress–strain increase rate decreases, and damage starts to occur inside the specimen. Moreover, the absorption energy is dissipated with the change of the internal structure. After reaching the yield stress, the stress decreases sharply with a small increase of strain, and cracks penetrate through specimens, causing damage.
(2) With increasing curing period and Na2SO4 solution concentration, the dynamic compressive strength of cement specimens follows a trend of first increasing and then decreasing. To better reflect the changes of dynamic compressive strength with the curing period and Na2SO4 solution concentration, a relationship model of the three was fitted. The results show that at a curing period of 14 days and a Na2SO4 solution concentration of 9.0 g/L, the dynamic compressive strength of the specimens reaches the maximum value.
(3) With increasing curing period and Na2SO4 solution concentration, the absorption energy of cement soil specimens follows a trend of first increasing and then decreasing. The results show that the absorption energy can effectively inhibit the generation and expansion of cracks inside specimens. The absorption energy of specimens is maximal at a curing period of 14 days and a concentration of Na2SO4 solution of 9.0 g/L.

Author Contributions

Conceptualization, J.-S.Z.; methodology, J.-S.Z. and X.-G.X.; software, J.-S.Z. and B.R.; data curation, X.-G.X. and B.R.; writing—original draft preparation, J.-S.Z.; writing—review and editing, J.-S.Z., X.-G.X. and B.R.; supervision, J.-S.Z.; funding acquisition, J.-S.Z. All authors have read and agreed to the published version of the manuscript.

Funding

This research was funded by the Graduate Innovation Fund of Anhui University of Science and Technology (grant number 2020CX2033).

Institutional Review Board Statement

Not applicable.

Informed Consent Statement

Not applicable.

Data Availability Statement

Not applicable.

Conflicts of Interest

The authors declare no conflict of interest.

References

  1. Xin, Y.; Yuhong, W.; Yingtao, L. Stabilization of pavement subgrade soils containing rich chloride salts. J. Transp. Eng. Part B Pavements 2018, 144, 04018025. [Google Scholar]
  2. Jiang, L.; Weng, X.-Z.; Yang, B.-H.; Zhang, J.; Liu, J.-Z.; Yan, X.-C.; Fang, H. Experimental research on mechanical properties of fiber reinforcement cement stabilized soil. In Proceedings of the 2015 International Conference on Material Science and Applications, Suzhou, China, 13–14 June 2015; Atlantis Press: Amsterdam, The Netherlands, 2015. [Google Scholar]
  3. Estabragh, M.A.R.; Pereshkafti, R.S.; Parsaei, B.; Javadi, A.A. Stabilised expansive soil behaviour during wetting and drying. Int. J. Pavement Eng. 2013, 14, 418–427. [Google Scholar] [CrossRef]
  4. Gowthaman, S.; Nakashima, K.; Kawasaki, S. Effect of wetting and drying cycles on the durability of bio-cemented soil of expressway slope. Int. J. Environ. Sci. Technol. 2021, 1–14. [Google Scholar] [CrossRef]
  5. Arifin, Y.; Agustina, E.; Andhi, F.; Agus, S. The role of additives in soil-cement subjected to wetting-drying cycles. Infrastructures 2021, 6, 48. [Google Scholar] [CrossRef]
  6. Aldaood, A.; Khalil, A.; Bouasker, M.; Muzahim, A.M. Experimental study on the mechanical behavior of cemented soil re-inforced with straw fiber. Geotechn. Geol. Eng. 2021, 39, 2985–3001. [Google Scholar] [CrossRef]
  7. Wang, X.Y.; Han, P.J.; Bai, X.H.; Li, X.Y. Influences of slag on properties of lightweight cement-treated soils subjected to sulfate corrosion. Constr. Build. Mater. 2019, 205, 511–518. [Google Scholar]
  8. Chen, F.; Tong, S. Effect of ferronickel slag powder on strength of soil in marine environment. Adv. Civ. Eng. 2020, 2020, 8856055. [Google Scholar] [CrossRef]
  9. Wen, H.; Suo, C.; Hao, Y.; Fan, P.; Dong, X. Effect of freezing-thawing cycle on the mechanical properties and micromechanism of red mud-calcium-based composite cemented soil. Adv. Civ. Eng. 2020, 2020, 8825576. [Google Scholar] [CrossRef]
  10. Xiong, F.; Xing, H.; Li, H. Experimental study on the effects of multiple corrosive ion coexistence on soil-cement characteristics. Soils Found. 2019, 59, 398–406. [Google Scholar] [CrossRef]
  11. Olivier, C.; Farimah, M.; Abdelwadoud, M. Alteration of the hydromechanical performances of a stabilized compacted soil exposed to successive wetting–drying cycles. J. Mater. Civ. Eng. 2020, 32, 04020349. [Google Scholar]
  12. Chen, M. Experimental study on mechanical strength of basalt fiber cement soil under dry and wet cycling conditions. Fly Ash Compr. Util. 2020, 34, 95–98+135. [Google Scholar]
  13. Guo, S.L.; Lu, Q.; Lin, Y.L.; Liu, Y.Z. Experiments on influence of freeze-thaw cycles on mechanical properties of basalt fiber cement soil. Adv. Sci. Technol. Water Resour. 2020, 40, 36–43. [Google Scholar]
  14. Guo, S.L.; Lu, Q.; Lin, Y.L.; Liu, Y.Z. Experimental study on fatigue resistance of basalt fiber reinforced cement soil under freeze-thaw condition. J. Water Resour. Water Eng. 2020, 31, 200–206. [Google Scholar]
  15. Han, P.J.; Liu, X.; Bai, X.H. Effect of sodium sulfate on strength and micropores of cemented soil. Rock Soil Mech. 2014, 35, 2555–2561. [Google Scholar]
  16. Liu, J.Z.; Weng, X.Z.; Zhang, J.; Lu, C.Q.; Zhang, J.P.; Du, X.P. Research on filber grid-cement soil base performance of airstrip. J. Build. Mater. 2014, 17, 1043–1048. [Google Scholar]
  17. Ma, Q.; Gao, C. Effect of basalt fiber on the dynamic mechanical properties of cement-soil in SHPB test. J. Mater. Civil Eng. 2018, 30, 04018185. [Google Scholar] [CrossRef]
  18. Zhu, Z.; Jia, J.; Zhang, F. A damage and elastic-viscoplastic constitutive model of frozen soil under uniaxial impact loading and its numerical implementation. Cold Reg. Sci. Technol. 2020, 175, 103081. [Google Scholar] [CrossRef]
  19. Mo, Y.-x.; Pang, J.-y.; Huang, J.-k.; Russo, P. Dynamic mechanical properties and fractal characteristics of poly-propylene fiber-reinforced cement soil under impact loading. Adv. Mater. Sci. Eng. 2019, 2019, 3735891. [Google Scholar] [CrossRef] [Green Version]
  20. Yilmaz, Y. Compaction and strength characteristics of fly ash and fiber amended clayey soil. Eng. Geol. 2015, 188, 168–177. [Google Scholar] [CrossRef]
  21. Ram, L.; Masto, R. Fly ash for soil amelioration: A review on the influence of ash blending with inorganic and organic amendments. Earth Sci. Rev. 2014, 128, 52–74. [Google Scholar] [CrossRef]
  22. Miletić, S.; Ilić, M.; Otović, S.; Folić, R.; Ivanov, Y. Phase composition changes due to ammonium-sulphate: Attack on Portland and Portland fly ash cements. Constr. Build. Mater. 1999, 13, 117–127. [Google Scholar] [CrossRef]
  23. Cheshomi, A.; Eshaghi, A.; Hassanpour, J. Effect of lime and fly ash on swelling percentage and Atterberg limits of sul-fate-bearing clay. Appl. Clay Sci. 2017, 135, 190–198. [Google Scholar] [CrossRef]
  24. Gu, L.; Lv, Q.; Wang, S.; Xiang, J.; Guo, L.; Jiang, J. Effect of sodium silicate on the properties of loess stabilized with alkali-activated fly ash-based. Constr. Build. Mater. 2021, 280, 122515. [Google Scholar] [CrossRef]
  25. Wang, T.T.; Shang, B. Three-wave mutual-checking method for data processing of SHPB experiments of concrete. J. Mech. 2014, 30, N5–N10. [Google Scholar] [CrossRef]
  26. Li, M.; Mao, X.; Lu, A.; Tao, J.; Zhang, G.; Zhang, L.; Li, C. Effect of specimen size on energy dissipation characteristics of red sandstone under high strain rate. Int. J. Min. Sci. Technol. 2014, 24, 151–156. [Google Scholar] [CrossRef]
  27. Lundberg, B. A split Hopkinson bar study of energy absorption in dynamic rock fragmentation. Int. J. Rock Mech. Min. Sci. Geomech. Abstr. 1976, 13, 187–197. [Google Scholar] [CrossRef]
  28. Dai, F.; Xia, K.; Tang, L. Rate dependence of the flexural tensile strength of Laurentian granite. Int. J. Rock Mech. Min. Sci. 2010, 47, 469–475. [Google Scholar] [CrossRef]
Figure 1. Particle gradation diagram.
Crystals 11 01291 g001
Figure 2. Split Hopkinson pressure bar test equipment: (a) picture of the split Hopkinson pressure bar and (b) schematic of the split Hopkinson pressure bar.
Crystals 11 01291 g002
Figure 3. Microscopic test equipment: (a) scanning electron microscope and (b) X-ray diffraction apparatus.
Crystals 11 01291 g003
Figure 4. Typical original waveform.
Crystals 11 01291 g004
Figure 5. Typical dynamic stress–strain relationship curve.
Crystals 11 01291 g005
Figure 6. Stress–strain relationship curves of cement soil specimens under different Na2SO4 solution concentrations: (a) curing period of 3 days; (b) curing period of 7 days; (c) curing period of 14 days; and (d) curing period of 28 days.
Crystals 11 01291 g006
Figure 7. Relationships between dynamic compressive strength, sulfate concentration, and curing period: (a) different sulfate concentrations and (b) different curing periods.
Crystals 11 01291 g007
Figure 8. 3D fitting curved surface of dynamic compressive strength.
Crystals 11 01291 g008
Figure 9. Curves of absorbed energy of cement soil specimens under different Na2SO4 solution concentrations: (a) curing period of 3 days; (b) curing period of 7 days; (c) curing period of 14 days; and (d) curing period of 28 days.
Crystals 11 01291 g009
Figure 10. X-ray diffraction images of specimens under different erosion environments of (a) water and (b) sulfate solution.
Crystals 11 01291 g010
Figure 11. Scanning electron microscopic images of specimens subjected to different erosion environments of (a) water and (b) sulfate solution.
Crystals 11 01291 g011
Table 1. Basic physical properties of the test soil.
Natural Moisture Content (%)Air-Dry Moisture Content (%)Unit Weight
(kN·m−3)
Liquid Limit (%)Plastic Limit (%)Plasticity Index
20.693.0119.3445.5127.3818.13
Table 2. Physical and mechanical properties of cement.
SoundnessInitial Setting Time (min)Final Setting Time (min)Fineness
(%)
Compressive Strength (MPa)Flexural Strength (MPa)
3 d28 d3 d28 d
Qualified1302151.226.654.85.28.3
Table 3. Physical index of fly ash.
Loss on Ignition (%)Water Demand (%)Bulk Density (g·cm−3)Specific Density
7.5087.500.901.96
Table 4. Physical index of basalt fiber.
Acid and Alkali ResistanceDensity (g·cm−3)Length (mm)Diameter (μm)Tensile Strength (MPa)Tensile Modulus of Elasticity (GPa)Elongation at Break (%)
Extremely high2.70617.40≥2000≥85≥2.5
Table 5. Dynamic compressive strength of cement soil specimens.
Curing Period (d)Sulfate Concentration (g/L)Dynamic Compressive Strength (MPa)
309.77
31.510.88
34.513.29
39.017.54
318.016.24
7014.61
71.515.08
74.515.86
79.018.69
718.017.28
14015.63
141.516.22
144.517.86
149.021.29
1418.019.14
28012.79
281.513.05
284.514.48
289.017.91
2818.015.26
Table 6. Results of X-ray physical phase analysis.
Mineral CompositionPDF NumberDiffraction Angles
Quartz (SiO2)46-104520.88, 26.62, 36.58, 39.55, 50.11, 68.39
Muscovite (Al2(Si2O5)(OH)4)07-002519.83
Calcium silicate hydrate (3CaO2SiO42H2O)12-047528.07, 60.14
Anhydrite (CaSO4)43-060629.59
Calcite (CaCO3)05-058629.46
Wollastonite (CaSiO3)27-008835.07
Ettringite (3CaO·Al2O3·3CaSO4·32H2O)41-145135.07, 36.91, 39.62
Albite (Na2O·Al2O3·6SiO2)09-045627.94
Anorthite (CaAl2Si2O8)41-148128.07, 27.88
Publisher’s Note: MDPI stays neutral with regard to jurisdictional claims in published maps and institutional affiliations.

