
Beryl Reference Materials for In Situ Oxygen Isotope Determination

 , , , , ,
Abstract
:1. Introduction
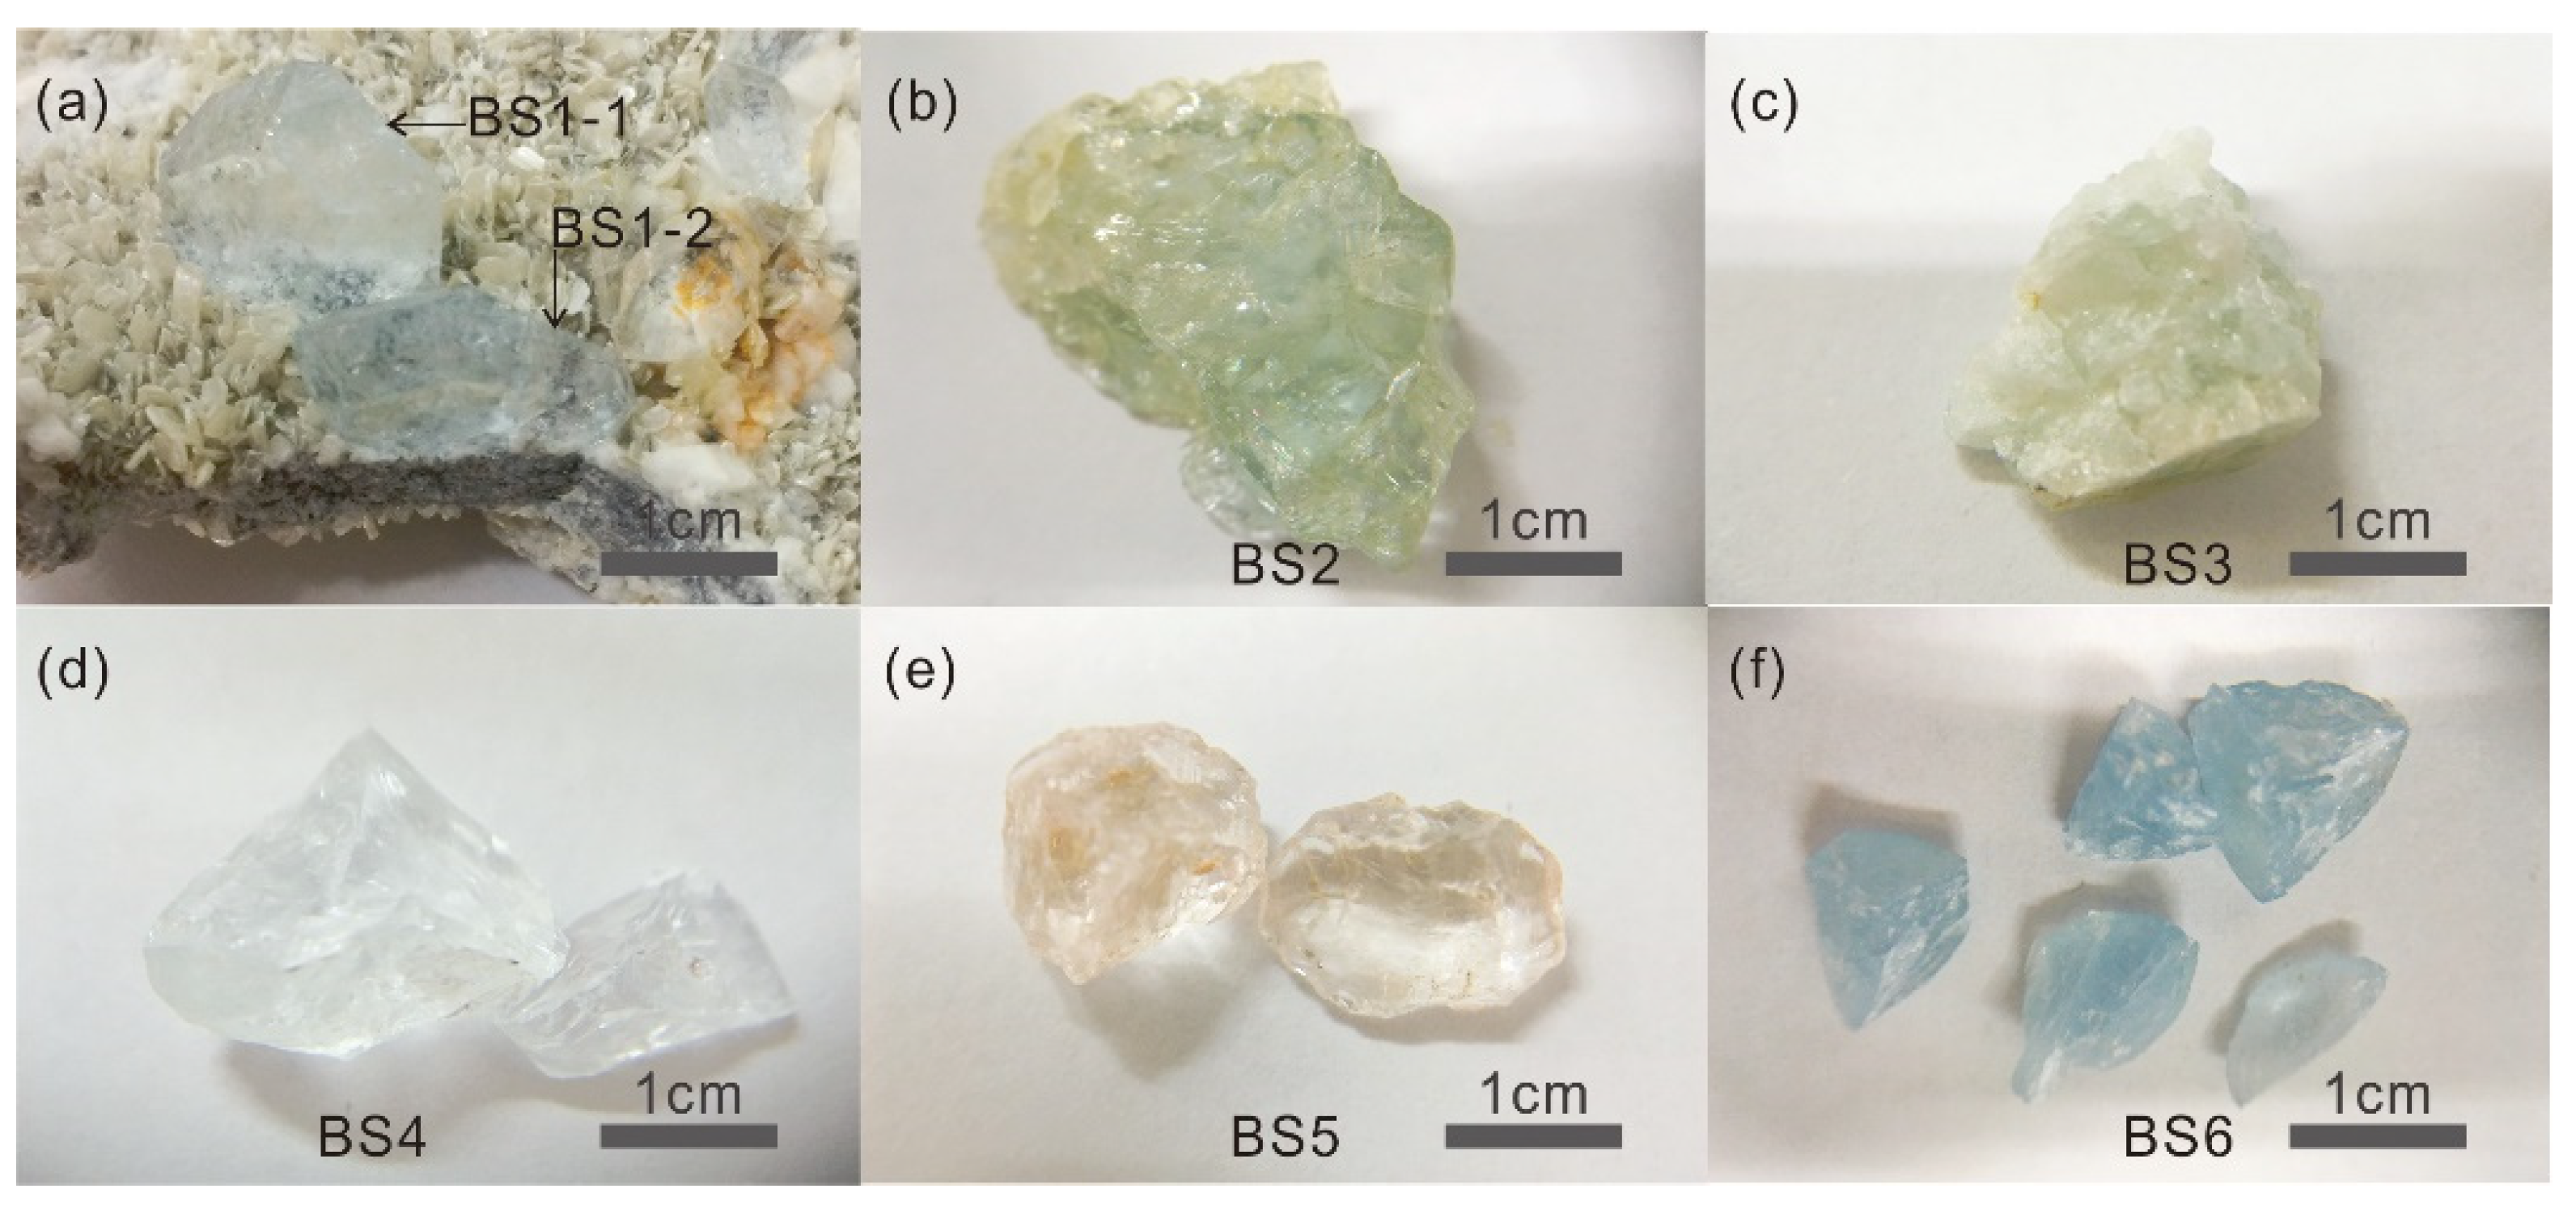
2. Samples
3. Methods
4. Results and Discussion
4.1. Structural Study by Raman Spectroscopy
4.2. Chemical Composition
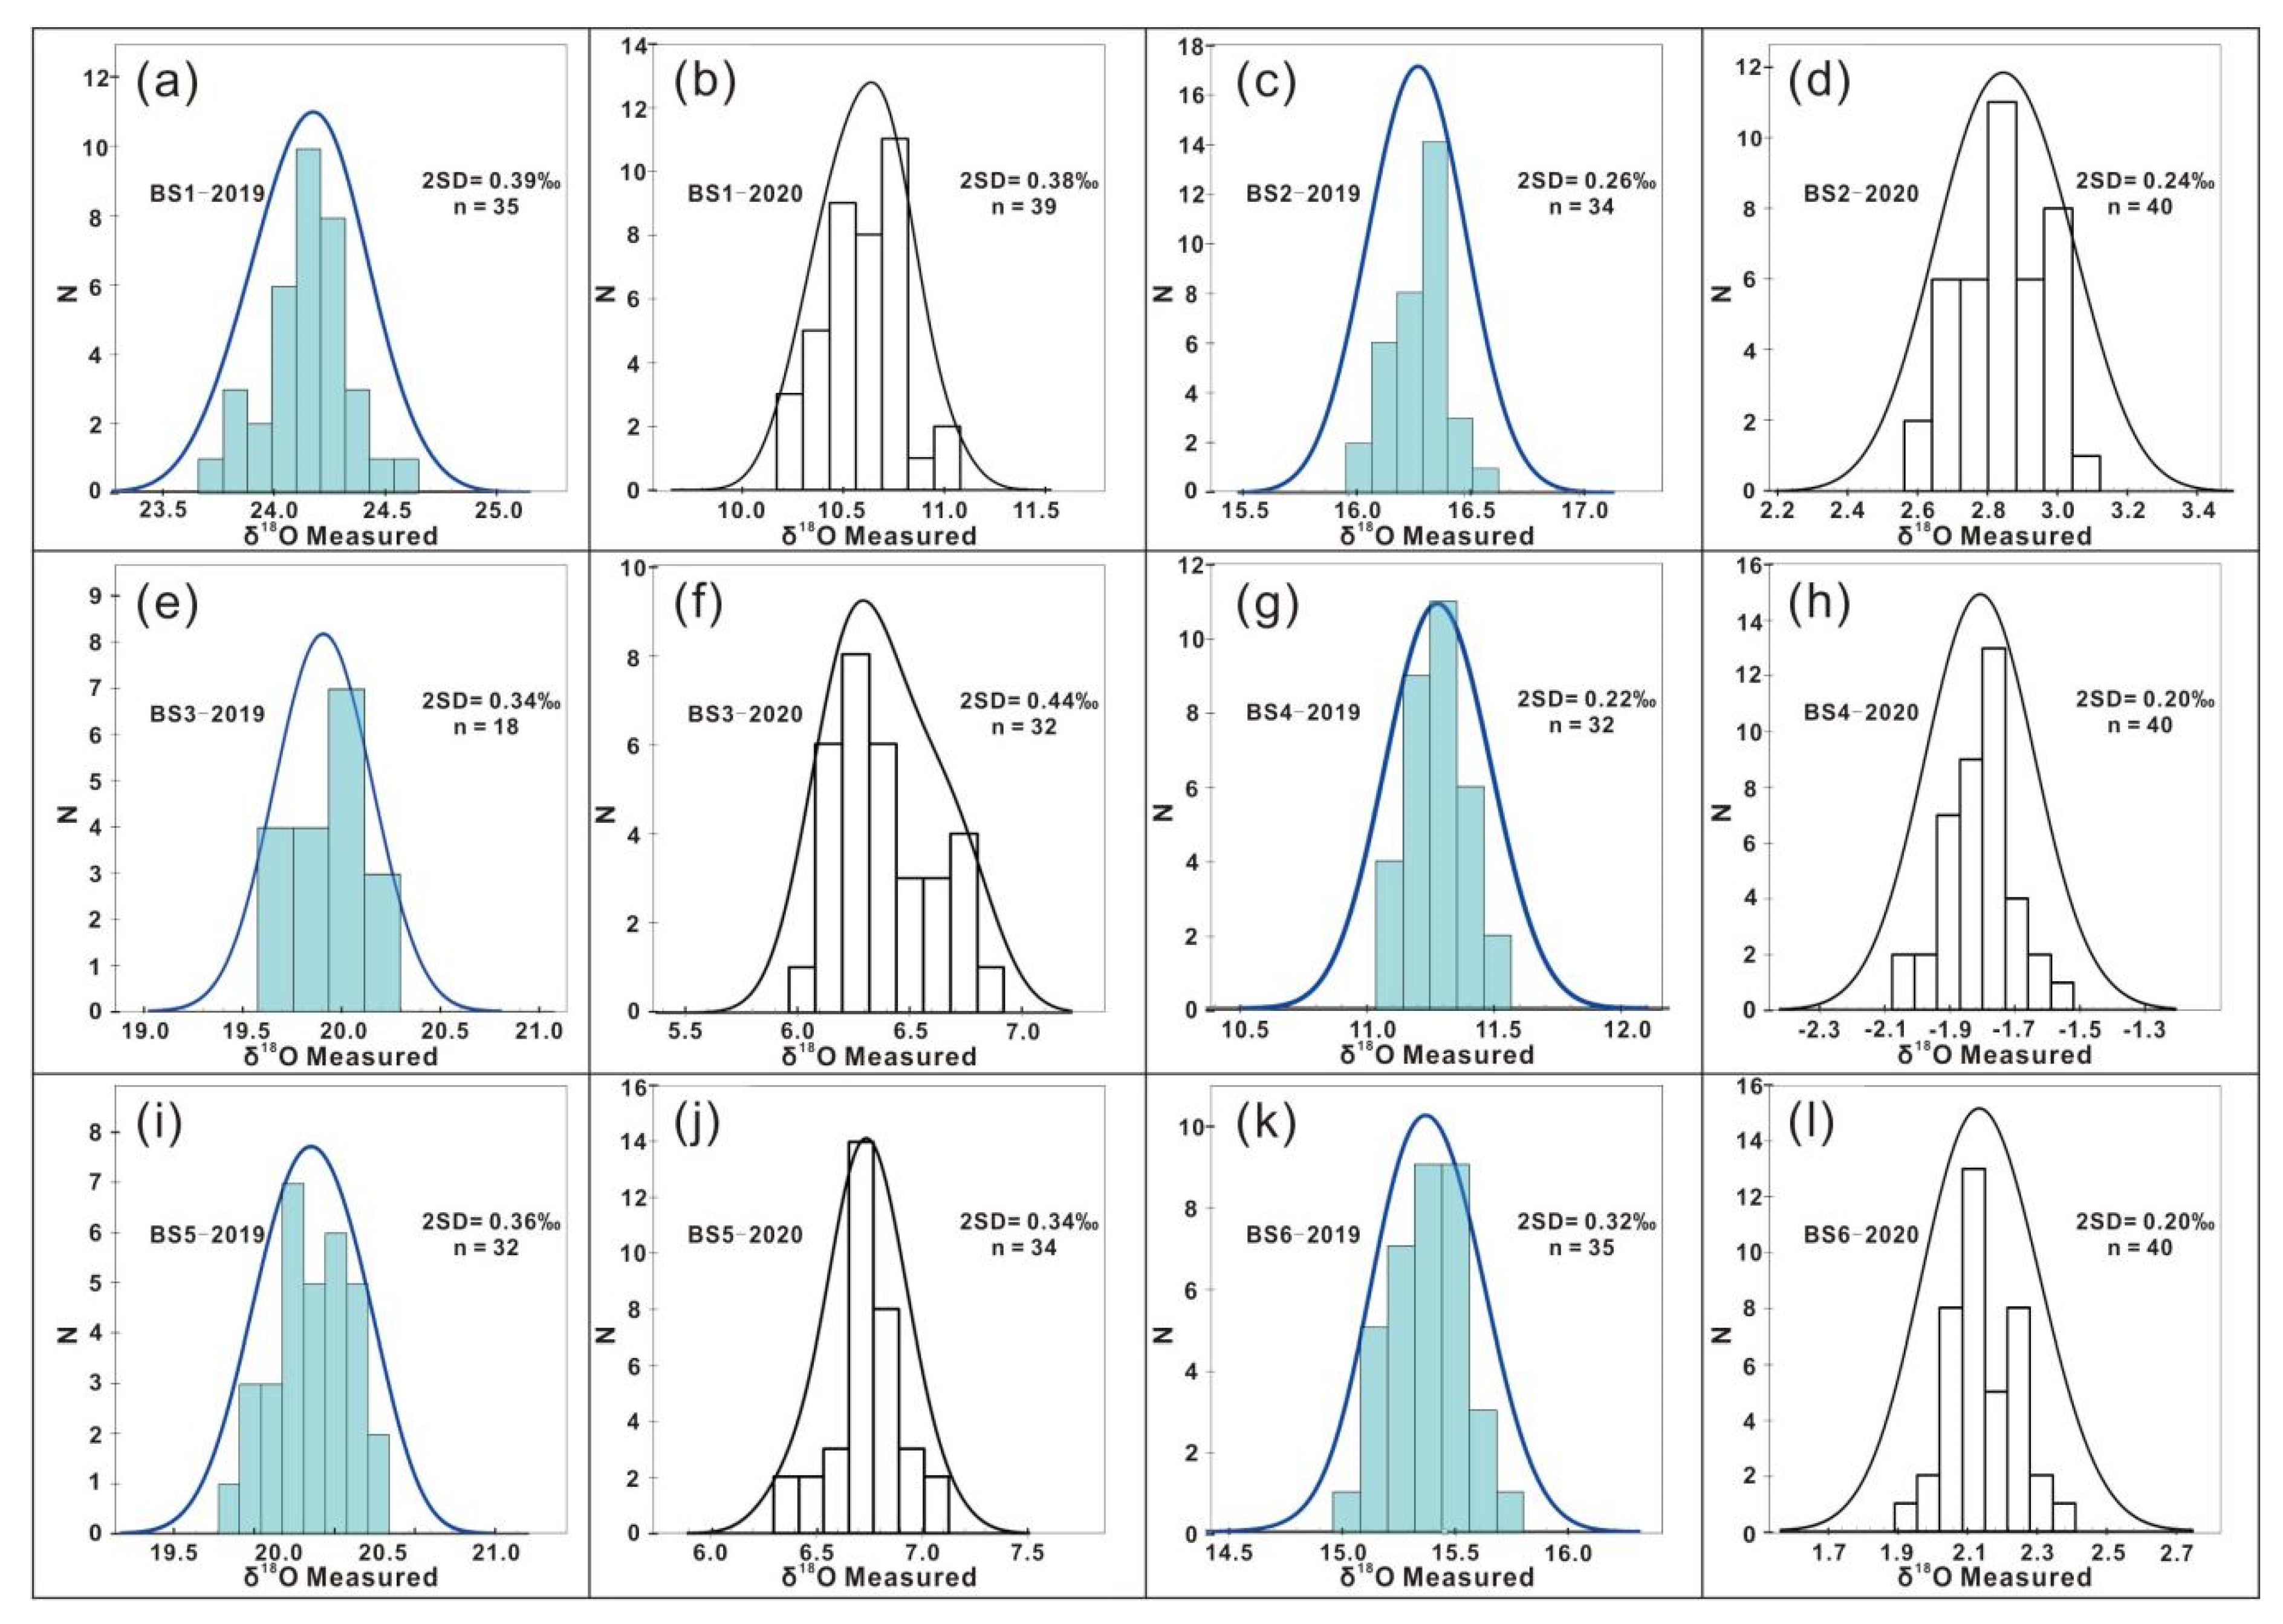
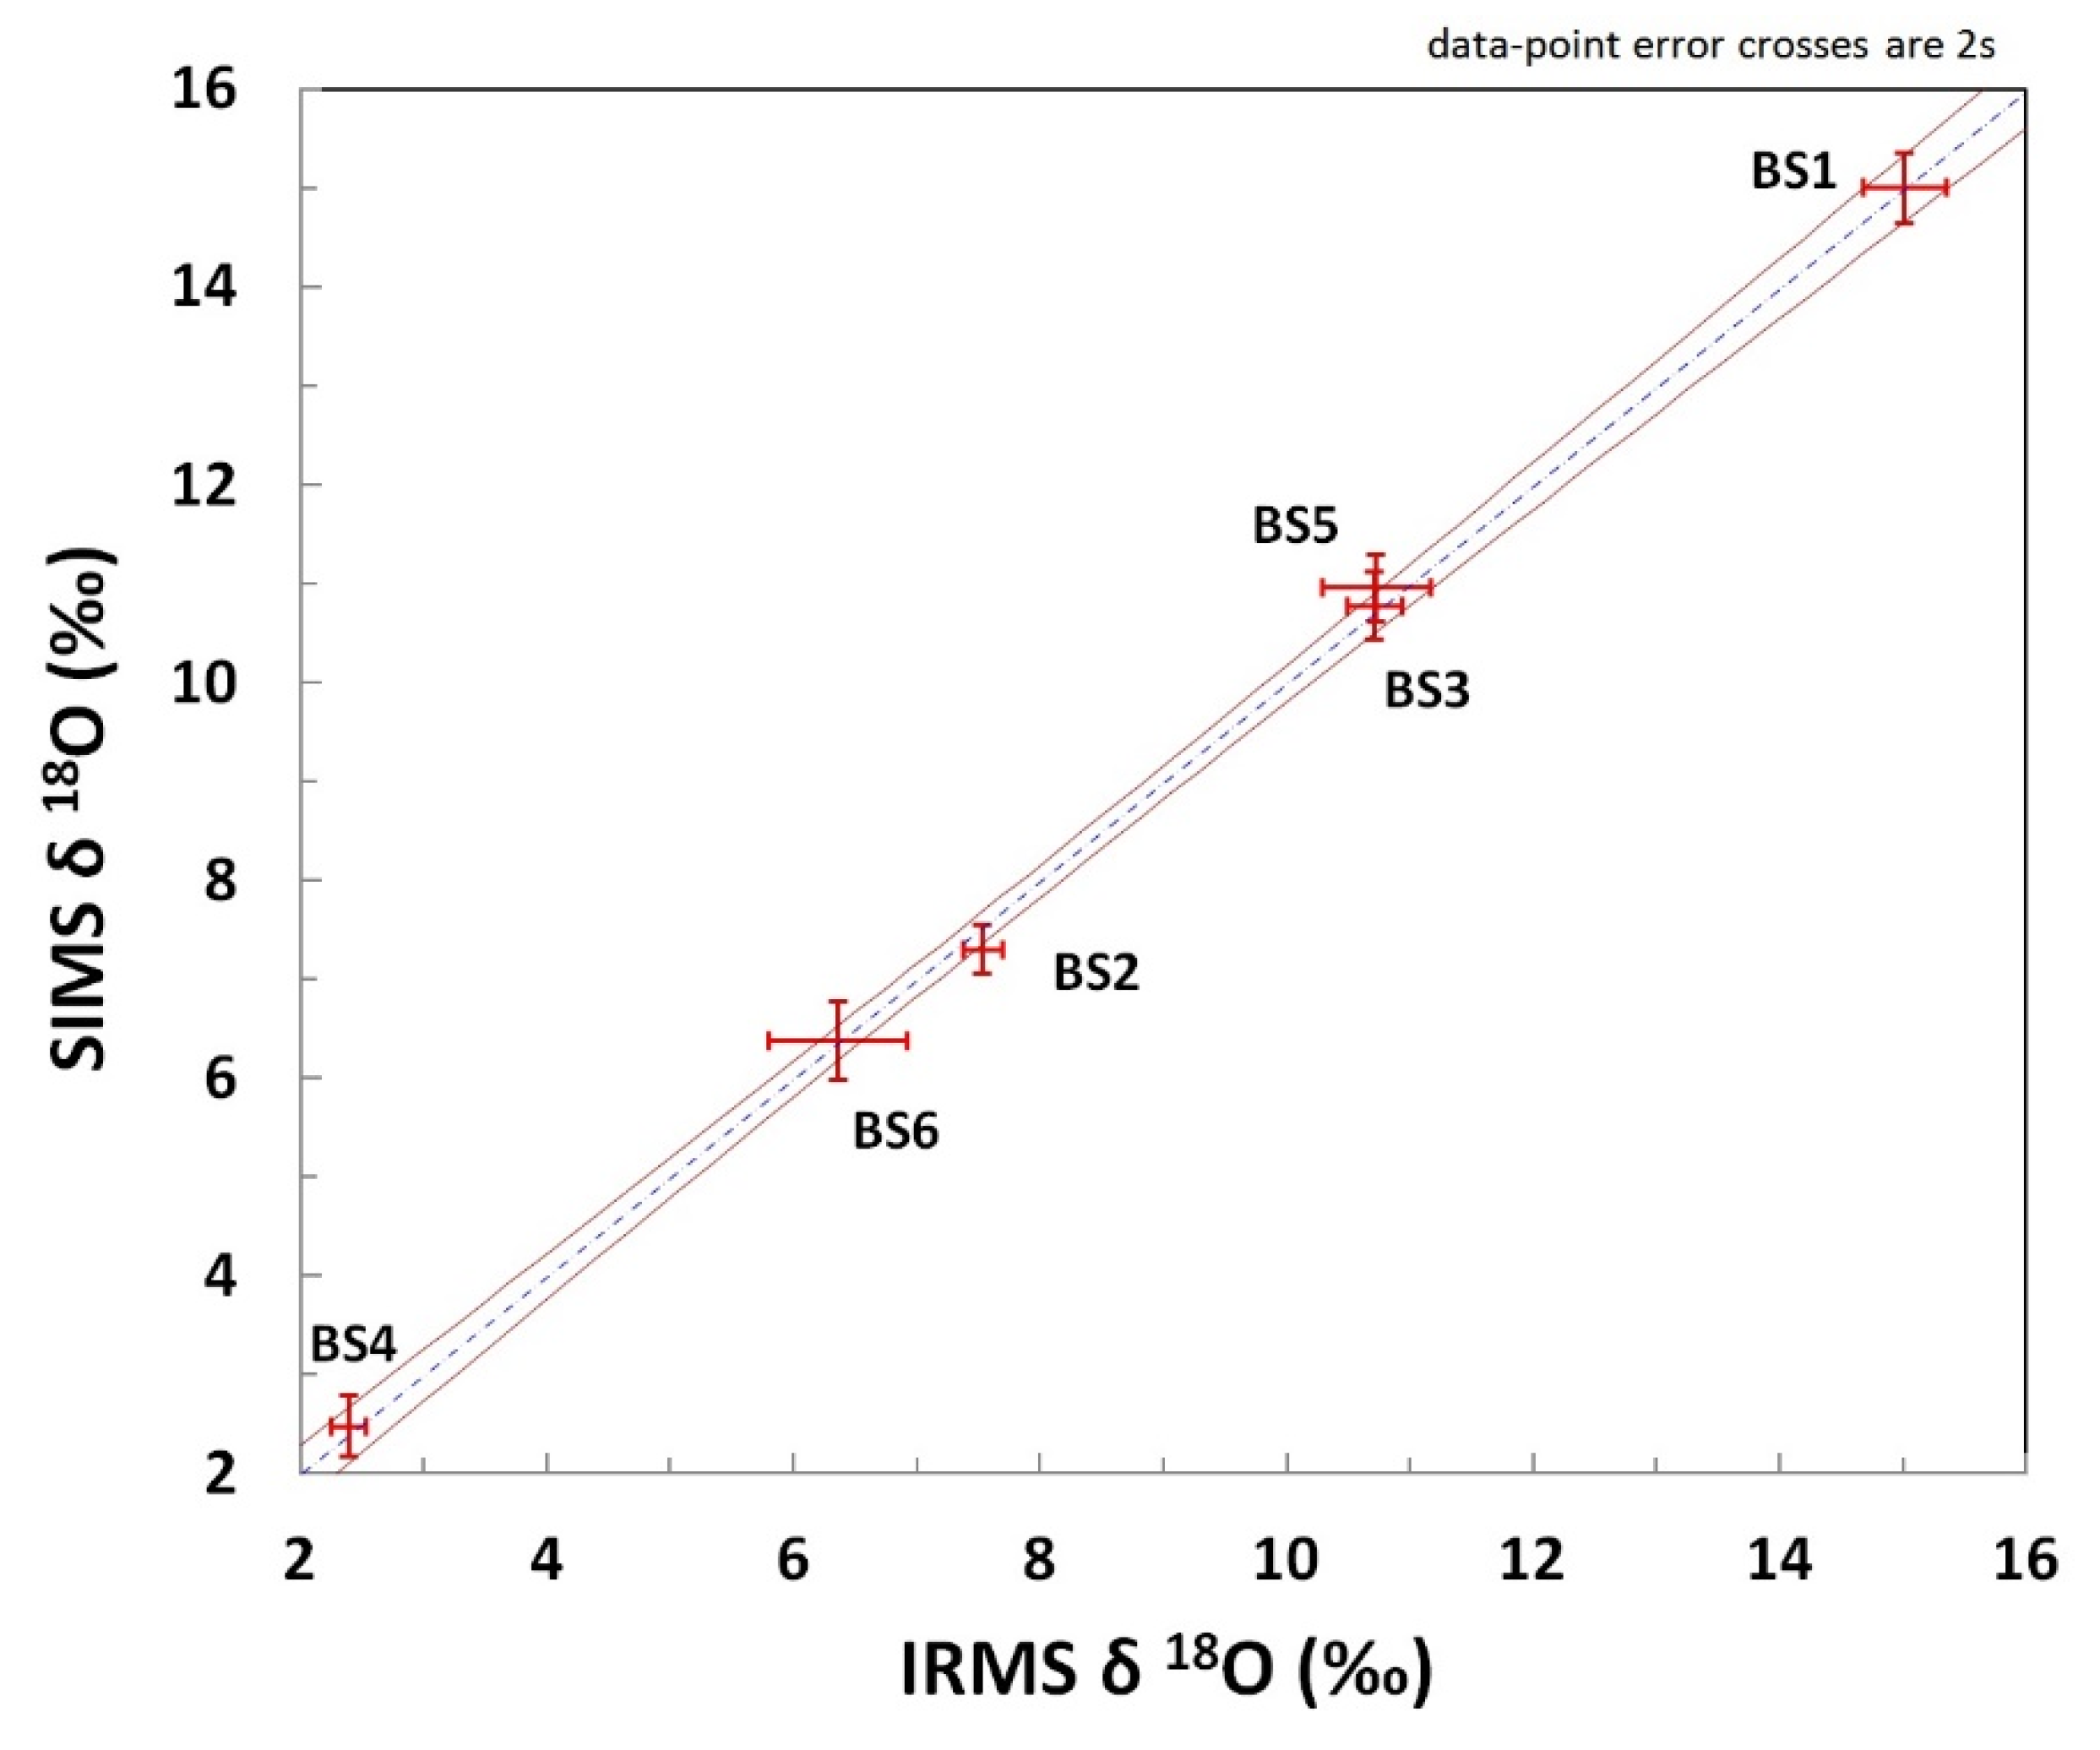
4.3. Oxygen Isotopes Using SIMS and IRMS
5. Conclusions
Supplementary Materials
Author Contributions
Funding
Institutional Review Board Statement
Informed Consent Statement
Data Availability Statement
Acknowledgments
Conflicts of Interest
References
- Hofstra, A.H.; Kreiner, D.C. Systems-Deposits-Commodities-Critical Minerals Table for the Earth Mapping Resources Initiative (ver. 1.1, May 2021); U.S. Geological Survey Open-File Report 2020-1042; U.S. Geological Survey: Reston, VA, USA, 2020; 26p. [Google Scholar]
- Wang, R.; Wu, B.; Xie, L.; Che, X.; Xiang, L.; Liu, C. Global tempo-spatial distribution of rare-metal mineralization and continental evolution. Acta Geol. Sin. 2021, 95, 182–193. [Google Scholar]
- Ottaway, T.L.; Wicks, F.J.; Bryndzia, L.T.; Kyser, T.K.; Spooner, E.T.C. Formation of the Muzo hydrothermal emerald deposit in Colombia. Nat. Cell Biol. 1994, 369, 552–554. [Google Scholar] [CrossRef]
- Cérný, P. Mineralogy of Beryllium in Granitic Pegmatites. Rev. Miner. Geochem. 2002, 50, 405–444. [Google Scholar] [CrossRef]
- Tao, X.; Xie, L.; Wang, R.; Zhang, R.; Hu, H.; Liu, C. Mineralogical characteristics of beryl: A case study of the beryls from Cuona and Qomolangma district in Himalaya. J. Nanjing Univ. 2020, 56, 815–829. [Google Scholar] [CrossRef]
- Wu, F.-Y.; Liu, X.-C.; Liu, Z.-C.; Wang, R.-C.; Xie, L.; Wang, J.-M.; Ji, W.-Q.; Yang, L.; Liu, C.; Khanal, G.P.; et al. Highly fractionated Himalayan leucogranites and associated rare-metal mineralization. Lithos 2020, 352–353, 105319. [Google Scholar] [CrossRef]
- Zhou, Q.; Qin, K.; Tang, D. Mineralogy of columbite-group minerals from the rare-element pegmatite dykes in the East-Qinling orogen, Central China: Implications for formation times and ore genesis. J. Asian Earth Sci. 2021, 27, 104879. [Google Scholar] [CrossRef]
- Onuma, N.; Clayton, R.N.; Mayeda, T.K. Oxygen Isotope Fractionation between Minerals and an Estimate of the Temperature of Formation. Science 1970, 167, 536–538. [Google Scholar] [CrossRef]
- Taylor, R.P.; Fallick, A.E.; Breaks, F.W. Volatile Evolution in archean rare-element granitic pegmatites—Evidence from the hydrogen isotopic composition of channel H2O in beryl. Can. Mineral. 1992, 30, 877–893. [Google Scholar]
- Galili, N.; Shemesh, A.; Yam, R.; Brailovsky, I.; Sela-Adler, M.; Schuster, E.M.; Collom, C.; Bekker, A.; Planavsky, N.; Macdonald, F.A.; et al. The geologic history of seawater oxygen isotopes from marine iron oxides. Science 2019, 365, 469–473. [Google Scholar] [CrossRef]
- Giuliani, G.; France-Lanord, C.; Coget, P.; Schwarz, D.; Cheilletz, A.; Branquet, Y.; Giard, D.; Martin-Izard, A.; Alexandrov, P.; Piat, D.H. Oxygen isotope systematics of emerald: Relevance for its origin and geological significance. Miner. Depos. 1998, 33, 513–519. [Google Scholar] [CrossRef]
- Giuliani, G.; Chaussidon, M.; Schubnel, H.-J.; Piat, D.H.; Rollion-Bard, C.; France-Lanord, C.; Giard, D.; de Narvaez, D.; Rondeau, B. Oxygen Isotopes and Emerald Trade Routes Since Antiquity. Science 2000, 287, 631–633. [Google Scholar] [CrossRef] [Green Version]
- Ireland, T.R. Considerations in Zircon Geochronology by SIMS. Rev. Miner. Geochem. 2003, 53, 215–241. [Google Scholar] [CrossRef]
- Isa, J.; Kohl, I.; Liu, M.-C.; Wasson, J.; Young, E.; McKeegan, K. Quantification of oxygen isotope SIMS matrix effects in olivine samples: Correlation with sputter rate. Chem. Geol. 2017, 458, 14–21. [Google Scholar] [CrossRef] [Green Version]
- Scicchitano, M.R.; Rubatto, D.; Hermann, J.; Majumdar, A.S.; Putnis, A. Oxygen isotope analysis of olivine by ion microprobe: Matrix effects and applications to a serpentinised dunite. Chem. Geol. 2018, 499, 126–137. [Google Scholar] [CrossRef]
- Vho, A.; Rubatto, D.; Putlitz, B.; Bouvier, A. New Reference Materials and Assessment of Matrix Effects for SIMS Measurements of Oxygen Isotopes in Garnet. Geostand. Geoanalytical Res. 2020, 44, 459–471. [Google Scholar] [CrossRef]
- Eiler, J.M.; Graham, C.; Valley, J. SIMS analysis of oxygen isotopes: Matrix effects in complex minerals and glasses. Chem. Geol. 1997, 138, 221–244. [Google Scholar] [CrossRef]
- Tang, G.; Su, B.; Li, Q.; Xia, X.; Jing, J.; Feng, L.; Martin, L.; Yang, Q.; Li, X. High-Mg# Olivine, Clinopyroxene and Orthopyroxene Reference Materials for In Situ Oxygen Isotope Determination. Geostand. Geoanalytical Res. 2019, 43, 585–593. [Google Scholar] [CrossRef]
- Lum, J.E.; Viljoen, F.; Cairncross, B.; Frei, D. Mineralogical and geochemical characteristics of Beryl (Aquamarine) from the Erongo Volcanic Complex, Namibia. J. Afr. Earth Sci. 2016, 124, 104–125. [Google Scholar] [CrossRef]
- Liu, Y.; Deng, J.; Shi, G.; Sun, D. Geochemical and morphological characteristics of coarse-grained tabular beryl from the Xuebaoding W–Sn–Be deposit, Sichuan Province, western China. Int. Geol. Rev. 2012, 54, 1673–1684. [Google Scholar] [CrossRef]
- Wu, S.; Karius, V.; Schmidt, B.C.; Simon, K.; Wörner, G. Comparison of Ultrafine Powder Pellet and Flux-free Fusion Glass for Bulk Analysis of Granitoids by Laser Ablation-Inductively Coupled Plasma-Mass Spectrometry. Geostand. Geoanalytical Res. 2018, 42, 575–591. [Google Scholar] [CrossRef]
- Wu, S.; Wörner, G.; Jochum, K.P.; Stoll, B.; Simon, K.; Kronz, A. The Preparation and Preliminary Characterisation of Three Synthetic Andesite Reference Glass Materials (ARM-1, ARM-2, ARM-3) for In Situ Microanalysis. Geostand. Geoanalytical Res. 2019, 43, 567–584. [Google Scholar] [CrossRef] [Green Version]
- Griffin, W.; Powell, W.; Pearson, N.J.O.; Reilly, S. GLITTER: Data reduction software for laser ablation ICP-MS. In Laser Ablation-ICP-MS in the Earth Sciences: Current Practices and Outstanding Issues; Sylvester, P., Ed.; Mineralogical Association of Canada: Québec, QC, Canada, 2008; pp. 308–311. [Google Scholar]
- Li, X.H.; Liu, Y.; Li, Q.L.; Guo, C.H.; Chamberlain, K.R. Precise determination of Phanerozoic zircon Pb/Pb age by multi-collector SIMS without external standardization. Geochem. Geophys. Geosyst. 2009, 10, Q04010. [Google Scholar] [CrossRef]
- Tang, G.-Q.; Liu, Y.; Feng, L.-J.; Wei, G.-J.; Su, W.; Li, Y.; Ren, G.-H.; Li, X.-H. New Natural and Fused Quartz Reference Materials for Oxygen Isotope Microanalysis. At. Spectrosc. 2020, 41, 41. [Google Scholar] [CrossRef]
- Ludwig, K.R. User’s Manual for Isoplot 3.75, A Geochronological Tooklit for Microsoft Excel; Berkeley Geochronology Center Special Publication: Berkeley, CA, USA, 2012. [Google Scholar]
- Feng, L.; Li, H.; Li, T. Potential Reference Materials for Hematite Oxygen Isotope Analysis. Minerals 2020, 10, 987. [Google Scholar] [CrossRef]
- Li, X.-H.; Long, W.-G.; Li, Q.; Liu, Y.; Zheng, Y.-F.; Yang, Y.-H.; Chamberlain, K.R.; Wan, D.-F.; Guo, C.-H.; Wang, X.-C.; et al. Penglai Zircon Megacrysts: A Potential New Working Reference Material for Microbeam Determination of Hf-O Isotopes and U-Pb Age. Geostand. Geoanalytical Res. 2010, 34, 117–134. [Google Scholar] [CrossRef]
- Kim, C.C.; Bell, M.; McKeown, D. Vibrational analysis of beryl (Be3Al2Si6O18) and its constituent ring (Si6O18). Phys. B Condens. Matter 1995, 205, 193–208. [Google Scholar] [CrossRef]
- Hagemann, H.; Lucken, A.; Bill, H.; Gysler-Sanz, J.; Stalder, H. Polarized Raman spectra of beryl and bazzite. Phys. Chem. Miner. 1990, 17, 395–401. [Google Scholar] [CrossRef]
- Wang, P.; Gray, T.P.; Li, Z.; Anderson, E.J.D.; Allaz, J.; Smyth, J.R.; Koenig, A.E.; Qi, L.; Zhou, Y.; Raschke, M.B. Mineralogical classification and crystal water characterisation of beryl from the W–Sn–Be occurrence of Xuebaoding, Sichuan province, western China. Miner. Mag. 2021, 85, 172–188. [Google Scholar] [CrossRef]
- Tang, G.-Q.; Li, X.-H.; Li, Q.-L.; Liu, Y.; Ling, X.-X.; Yin, Q.-Z. Deciphering the physical mechanism of the topography effect for oxygen isotope measurements using a Cameca IMS-1280 SIMS. J. Anal. At. Spectrom. 2015, 30, 950–956. [Google Scholar] [CrossRef]
- Peres, P.; Kita, N.T.; Valley, J.W.; Fernandes, F.; Schuhmacher, M. New sample holder geometry for high precision isotope analyses. Surf. Interface Anal. 2013, 45, 553–556. [Google Scholar] [CrossRef]
- Treble, P.; Schmitt, A.; Edwards, R.; McKeegan, K.; Harrison, T.; Grove, M.; Cheng, H.; Wang, Y. High resolution Secondary Ionisation Mass Spectrometry (SIMS) δ18O analyses of Hulu Cave speleothem at the time of Heinrich Event 1. Chem. Geol. 2007, 238, 197–212. [Google Scholar] [CrossRef]


| Sample | Location | Color | Transparency | Weight/Gram |
|---|---|---|---|---|
| BS1 | Sichuan, China | Colorless to pale blue | Transparent | 15 |
| BS2 | Norway | Light greenish-blue | Transparent | 15 |
| BS3 | Hunan, China | Greenish-white | Semitransparent | 12 |
| BS4 | Nigeria | Colorless | Transparent | 15 |
| BS5 | Myanmar | Light pink | Transparent | 10 |
| BS6 | Brazil | Light blue | Transparent | 10 |
| EMPA | BS1 (n = 25) | BS2 (n = 25) | BS3 (n = 25) | BS4 (n = 25) | BS5 (n = 25) | BS6 (n = 25) | ||||||
| wt.% | Mean | 1 SD | Mean | 1 SD | Mean | 1 SD | Mean | 1 SD | Mean | 1 SD | Mean | 1 SD |
| SiO2 | 66.15 | 0.55 | 66.63 | 0.87 | 66.80 | 0.90 | 67.05 | 0.93 | 66.01 | 0.76 | 66.89 | 0.67 |
| Al2O3 | 17.88 | 0.19 | 18.09 | 0.13 | 18.06 | 0.24 | 18.41 | 0.15 | 18.13 | 0.15 | 17.86 | 0.11 |
| FeO | 0.17 | 0.05 | 0.61 | 0.02 | 0.61 | 0.15 | 0.21 | 0.02 | 0.03 | 0.03 | 0.88 | 0.03 |
| MgO | 0.11 | 0.06 | 0.00 | 0.01 | 0.14 | 0.12 | 0.01 | 0.03 | 0.00 | 0.01 | 0.13 | 0.02 |
| CaO | 0.01 | 0.01 | 0.00 | 0.00 | 0.00 | 0.00 | 0.00 | 0.00 | 0.00 | 0.01 | 0.00 | 0.00 |
| BeOcal | 12.65 | 0.23 | 13.63 | 0.18 | 13.72 | 0.21 | 13.77 | 0.35 | 12.75 | 0.30 | 13.69 | 0.15 |
| Li2Ocal | 0.66 | 0.14 | 0.14 | 0.01 | 0.11 | 0.04 | 0.11 | 0.15 | 0.59 | 0.15 | 0.13 | 0.03 |
| Na2O | 1.26 | 0.29 | 0.19 | 0.03 | 0.20 | 0.08 | 0.21 | 0.29 | 1.02 | 0.36 | 0.27 | 0.06 |
| K2O | 0.03 | 0.01 | - | - | 0.01 | 0.01 | - | - | 0.04 | 0.01 | - | - |
| Cs2O | 0.40 | 0.10 | 0.41 | 0.02 | 0.11 | 0.08 | 0.04 | 0.10 | 0.78 | 0.67 | 0.01 | 0.01 |
| Total | 99.33 | - | 99.72 | - | 99.75 | - | 99.82 | - | 99.35 | - | 99.88 | - |
| Si | 6.00 | - | 6.00 | - | 6.00 | - | 6.00 | - | 6.00 | - | 6.00 | - |
| Becal | 2.76 | - | 2.95 | - | 2.96 | - | 2.96 | - | 2.79 | - | 2.95 | - |
| Lical | 0.24 | - | 0.05 | - | 0.04 | - | 0.04 | - | 0.21 | - | 0.05 | - |
| sum | 3.00 | - | 3.00 | - | 3.00 | - | 3.00 | - | 3.00 | - | 3.00 | - |
| Al | 1.91 | - | 1.92 | - | 1.91 | - | 1.94 | - | 1.94 | - | 1.89 | - |
| Fe2+ | 0.01 | - | 0.05 | - | 0.05 | - | 0.02 | - | 0.00 | - | 0.07 | - |
| Mn | 0.00 | - | 0.00 | - | 0.00 | - | 0.00 | - | 0.00 | - | 0.00 | - |
| Mg | 0.01 | - | 0.00 | - | 0.02 | - | 0.00 | - | 0.00 | - | 0.02 | - |
| sum | 1.94 | - | 1.97 | - | 1.98 | - | 1.96 | - | 1.94 | - | 1.97 | - |
| Ca | 0.00 | - | 0.00 | - | 0.00 | - | 0.00 | - | 0.00 | - | 0.00 | - |
| Na | 0.22 | - | 0.03 | - | 0.03 | - | 0.04 | - | 0.18 | - | 0.05 | - |
| K | 0.00 | - | 0.00 | - | 0.00 | - | 0.00 | - | 0.00 | - | 0.00 | - |
| Cs | 0.02 | - | 0.02 | - | 0.00 | - | 0.00 | - | 0.03 | - | 0.00 | - |
| sum | 0.24 | - | 0.05 | - | 0.04 | - | 0.04 | - | 0.21 | - | 0.05 | - |
| Cs/Na | 0.07 | - | 0.49 | - | 0.16 | - | 0.04 | - | 0.21 | - | 0.01 | - |
| Mg/Fe | 1.04 | - | 0.01 | - | 0.38 | - | 0.10 | - | / | - | 0.26 | - |
| LA-ICP-MS | BS1 (n = 7) | BS2 (n = 7) | BS3 (n = 7) | BS4 (n = 7) | BS5 (n = 7) | BS6 (n = 10) | ||||||
| μg/g | Mean | 1 SD | Mean | 1 SD | Mean | 1 SD | Mean | 1 SD | Mean | 1 SD | Mean | 1 SD |
| Li | 3381 | 77 | 408 | 6 | 253 | 18 | 233 | 8 | 5095 | 68 | 87 | 5 |
| Rb | 67 | 5 | 114 | 3 | 46 | 8 | 19 | 0.1 | 339 | 5 | 4 | 0.1 |
| Cs | 3769 | 576 | 3653 | 88 | 1163 | 381 | 154 | 8 | 21,913 | 211 | 31 | 1 |
| Fe | 1370 | 245 | 3983 | 144 | 5059 | 528 | 1417 | 34 | - | - | 5667 | 69 |
| Mn | 72 | 9 | 72 | 2 | 105 | 20 | 84 | 2 | 19 | 1 | 126 | 5 |
| Mg | 799 | 61 | 26 | 1 | 354 | 38 | 12 | 1 | - | - | 614 | 6 |
| Ti | 197 | 8 | 219 | 7 | 218 | 3 | 218 | 4 | 193 | 2 | 219 | 3 |
| K | 115 | 15 | - | - | 61 | 23 | - | - | 144 | 41 | - | - |
| P | 94 | 5 | 128 | 10 | 122 | 7 | 121 | 7 | 112 | 7 | 120 | 5 |
| Zn | 61 | 11 | 185 | 8 | 441 | 11 | 282 | 4 | 10 | 1 | 174 | 4 |
| Ga | 24 | 3 | 31 | 1 | 25 | 1 | 11 | 0.1 | 13 | 1 | 19 | 0.1 |
| V | 4 | 1 | 0.9 | 0.1 | - | - | 1.3 | 0.1 | - | - | 1.6 | 0.1 |
| Sc | 2.2 | 0.7 | 1.3 | 0.1 | 0.5 | 0.1 | 0.5 | 0.1 | - | - | 0.6 | 0.1 |
| Sn | 2.1 | 0.6 | 323.0 | 30 | - | - | - | - | - | - | - | - |
| Cu | 1.4 | 0.1 | - | - | - | - | - | - | - | - | - | - |
| Ta | - | - | - | - | - | - | - | - | 14.2 | 0.7 | - | - |
| Sr | - | - | - | - | - | - | - | - | - | - | 0.5 | 0.4 |
| Ge | - | - | - | - | - | - | - | - | 8.4 | 0.5 | - | - |
| Be | 45,478 | 282 | 51,460 | 531 | 51,998 | 315 | 51,514 | 508 | 43,967 | 543 | 51,566 | 355 |
| Na | 11,844 | 294 | 1400 | 27 | 1581 | 115 | 1117 | 30 | 6901 | 131 | 2375 | 82 |
| Methods | IRMS | SIMS/Standard: BS1 | |||||||
|---|---|---|---|---|---|---|---|---|---|
| Time | 2021 | 2019-12-20 | 2021-7-20 | ||||||
| Sample | Mean | 2 SD | n | Mean | 2 SD | n | Mean | 2 SD | n |
| BS1 | 15.01 | 0.34 | 14 | 15.01 | 0.39 | 35 | 15.01 | 0.38 | 39 |
| BS2 | 7.53 | 0.16 | 3 | 7.31 | 0.26 | 34 | 7.30 | 0.24 | 40 |
| BS3 | 10.71 | 0.22 | 3 | 10.75 | 0.34 | 18 | 10.80 | 0.44 | 32 |
| BS4 | 2.38 | 0.14 | 3 | 2.36 | 0.22 | 32 | 2.58 | 0.20 | 40 |
| BS5 | 10.72 | 0.44 | 3 | 10.98 | 0.36 | 32 | 10.94 | 0.34 | 34 |
| BS6 | 6.35 | 0.56 | 3 | 6.23 | 0.32 | 35 | 6.52 | 0.20 | 40 |
Publisher’s Note: MDPI stays neutral with regard to jurisdictional claims in published maps and institutional affiliations. |
© 2021 by the authors. Licensee MDPI, Basel, Switzerland. This article is an open access article distributed under the terms and conditions of the Creative Commons Attribution (CC BY) license (https://creativecommons.org/licenses/by/4.0/).
Share and Cite
Ling, X.; Li, Q.; Feng, L.; Zhang, D.; Liu, Y.; Tang, G.; Li, J.; Wu, S.; Huang, L.; Li, T.; et al. Beryl Reference Materials for In Situ Oxygen Isotope Determination. Crystals 2021, 11, 1322. https://0-doi-org.brum.beds.ac.uk/10.3390/cryst11111322
Ling X, Li Q, Feng L, Zhang D, Liu Y, Tang G, Li J, Wu S, Huang L, Li T, et al. Beryl Reference Materials for In Situ Oxygen Isotope Determination. Crystals. 2021; 11(11):1322. https://0-doi-org.brum.beds.ac.uk/10.3390/cryst11111322
Chicago/Turabian StyleLing, Xiaoxiao, Qiuli Li, Lianjun Feng, Di Zhang, Yu Liu, Guoqiang Tang, Jiao Li, Shitou Wu, Liangliang Huang, Tiejun Li, and et al. 2021. "Beryl Reference Materials for In Situ Oxygen Isotope Determination" Crystals 11, no. 11: 1322. https://0-doi-org.brum.beds.ac.uk/10.3390/cryst11111322