Article

Time-Resolved Nanobeam X-ray Diffraction of a Relaxor Ferroelectric Single Crystal under an Alternating Electric Field

1
Department of Information and Basic Science, Graduate School of Science, Nagoya City University, Nagoya 467-8501, Japan
2
Department of Applied Chemistry, Faculty of Engineering, Saitama University, 255 Shimoohkubo, Sakura-ku, Saitama 338-8570, Japan
3
Center for Synchrotron Radiation Research, Japan Synchrotron Radiation Research Institute, Sayo, Hyogo 679-5198, Japan
*
Author to whom correspondence should be addressed.
Submission received: 31 October 2021 / Revised: 12 November 2021 / Accepted: 17 November 2021 / Published: 20 November 2021
(This article belongs to the Special Issue Time Resolved Crystallography)

Abstract

:
Lead-containing relaxor ferroelectrics show enormous piezoelectric capabilities relating to their heterogeneous structures. Time-resolved nanobeam X-ray diffraction reveals the time and position dependences of the local lattice strain on a relaxor ferroelectric single crystal mechanically vibrating and alternately switching, as well as its polarization under an alternating electric field. The complicated time and position dependences of the Bragg intensity distributions under an alternating electric field demonstrate that nanodomains with the various lattice constants and orientations exhibiting different electric field responses exist in the measured local area, as the translation symmetry breaks to the microscale. The dynamic motion of nanodomains in the heterogeneous structure, with widely distributed local lattice strain, enables enormous piezoelectric lattice strain and fatigue-free ferroelectric polarization switching.

1. Introduction

Lead-containing composite perovskites, (1−x)Pb(Mg1/3Nb2/3)O3xPbTiO3 (PMN-PT) and (1−x)Pb(Zn1/3Nb2/3)O3xPbTiO3 (PZN-PT), are well known as relaxor ferroelectrics and are widely used in many applications due to their excellent piezoelectric properties [1,2,3]. Their piezoelectric constants and electromechanical coupling factors strongly depend on the PbTiO3 (PT) fraction x and have a maximum value near the morphotropic phase boundary (MPB) that separates low-PT rhombohedral and high-PT tetragonal phases [4,5,6,7,8]. The piezoelectric constants of PMN-PT with x = 0.30 (PMN-30PT) and PZN-PT with x = 0.08 (PZN-8PT) near their MPBs exceed 2 × 10³ pC/N [7,8]. It has been suggested that electric field-induced phase transitions involving polarization rotation and electric field responses of polar nano regions (PNRs) aiding the polarization rotation explain the enormous piezoelectric capabilities around MPB [9,10,11,12,13,14,15,16,17,18,19,20,21,22,23,24]. Monoclinic and orthorhombic phases exist in a narrow composition region near MPB and are easily induced by applying an electric field [8,10,11,14,17,18]. PNRs first occur below the Burns temperature in the high-temperature paraelectric cubic phase, expanding with cooling and coexisting with regular ferroelectric domains in low-temperature ferroelectric phases [21].
We have recently reported the results of the time-resolved crystal structure analysis of a PZN-4.5PT single crystal under a sinusoidal alternating electric field [25]. Disordered Pb atoms partially occupying off-center sites show an intersite rotational displacement involving polarization rotation under an alternating electric field with an amplitude bigger than the coercive field for polarization switching. The average crystal structure of the single-crystal size below 0.1 mm was successfully analyzed using a rhombohedral and a monoclinic structure model with disordered Pb atoms under zero and non-zero fields, respectively. However, the crystal with PNRs must have a heterogeneous structure in which the lattice is locally strained, and the Pb displacements are locally modulated. In fact, heterogeneous spatial distributions of Pb displacements in relaxor ferroelectric perovskites have been discovered by diffuse and total scattering using X-ray, neutron, and transmission electron microscopy [26,27,28,29]. The structural responses of the heterogeneous local Pb displacements and the local lattice strain to an electric field are crucial to understanding the giant piezoelectric properties of relaxor ferroelectric perovskites.
In this study, we used time-resolved scanning nanobeam X-ray diffraction (XRD) of a single-crystal PMN-30PT under an alternating electric field to show the position and time dependences of the local lattice strain in relaxor ferroelectric perovskites under an alternating electric field. With high accuracy, scanning nanobeam XRD can visualize a distribution of local lattice strains on a crystal surface [30,31]. The X-ray beam size of 300 nm is much larger than the PNR’s size of 20 nm [21]. However, a fractal character has been found in relaxor ferroelectric perovskites by quasi-elastic light scattering and X-ray diffuse scattering measurements [32,33]. The nanobeam XRD detects submicron scale structural inhomogeneity originating from the fractal character. The time-resolved scanning nanobeam XRD for PMN-30PT under an alternating electric field in this study provides essential information about the local lattice strain with such a fractal character, as well as its electric field responses relating to the giant piezoelectric properties.

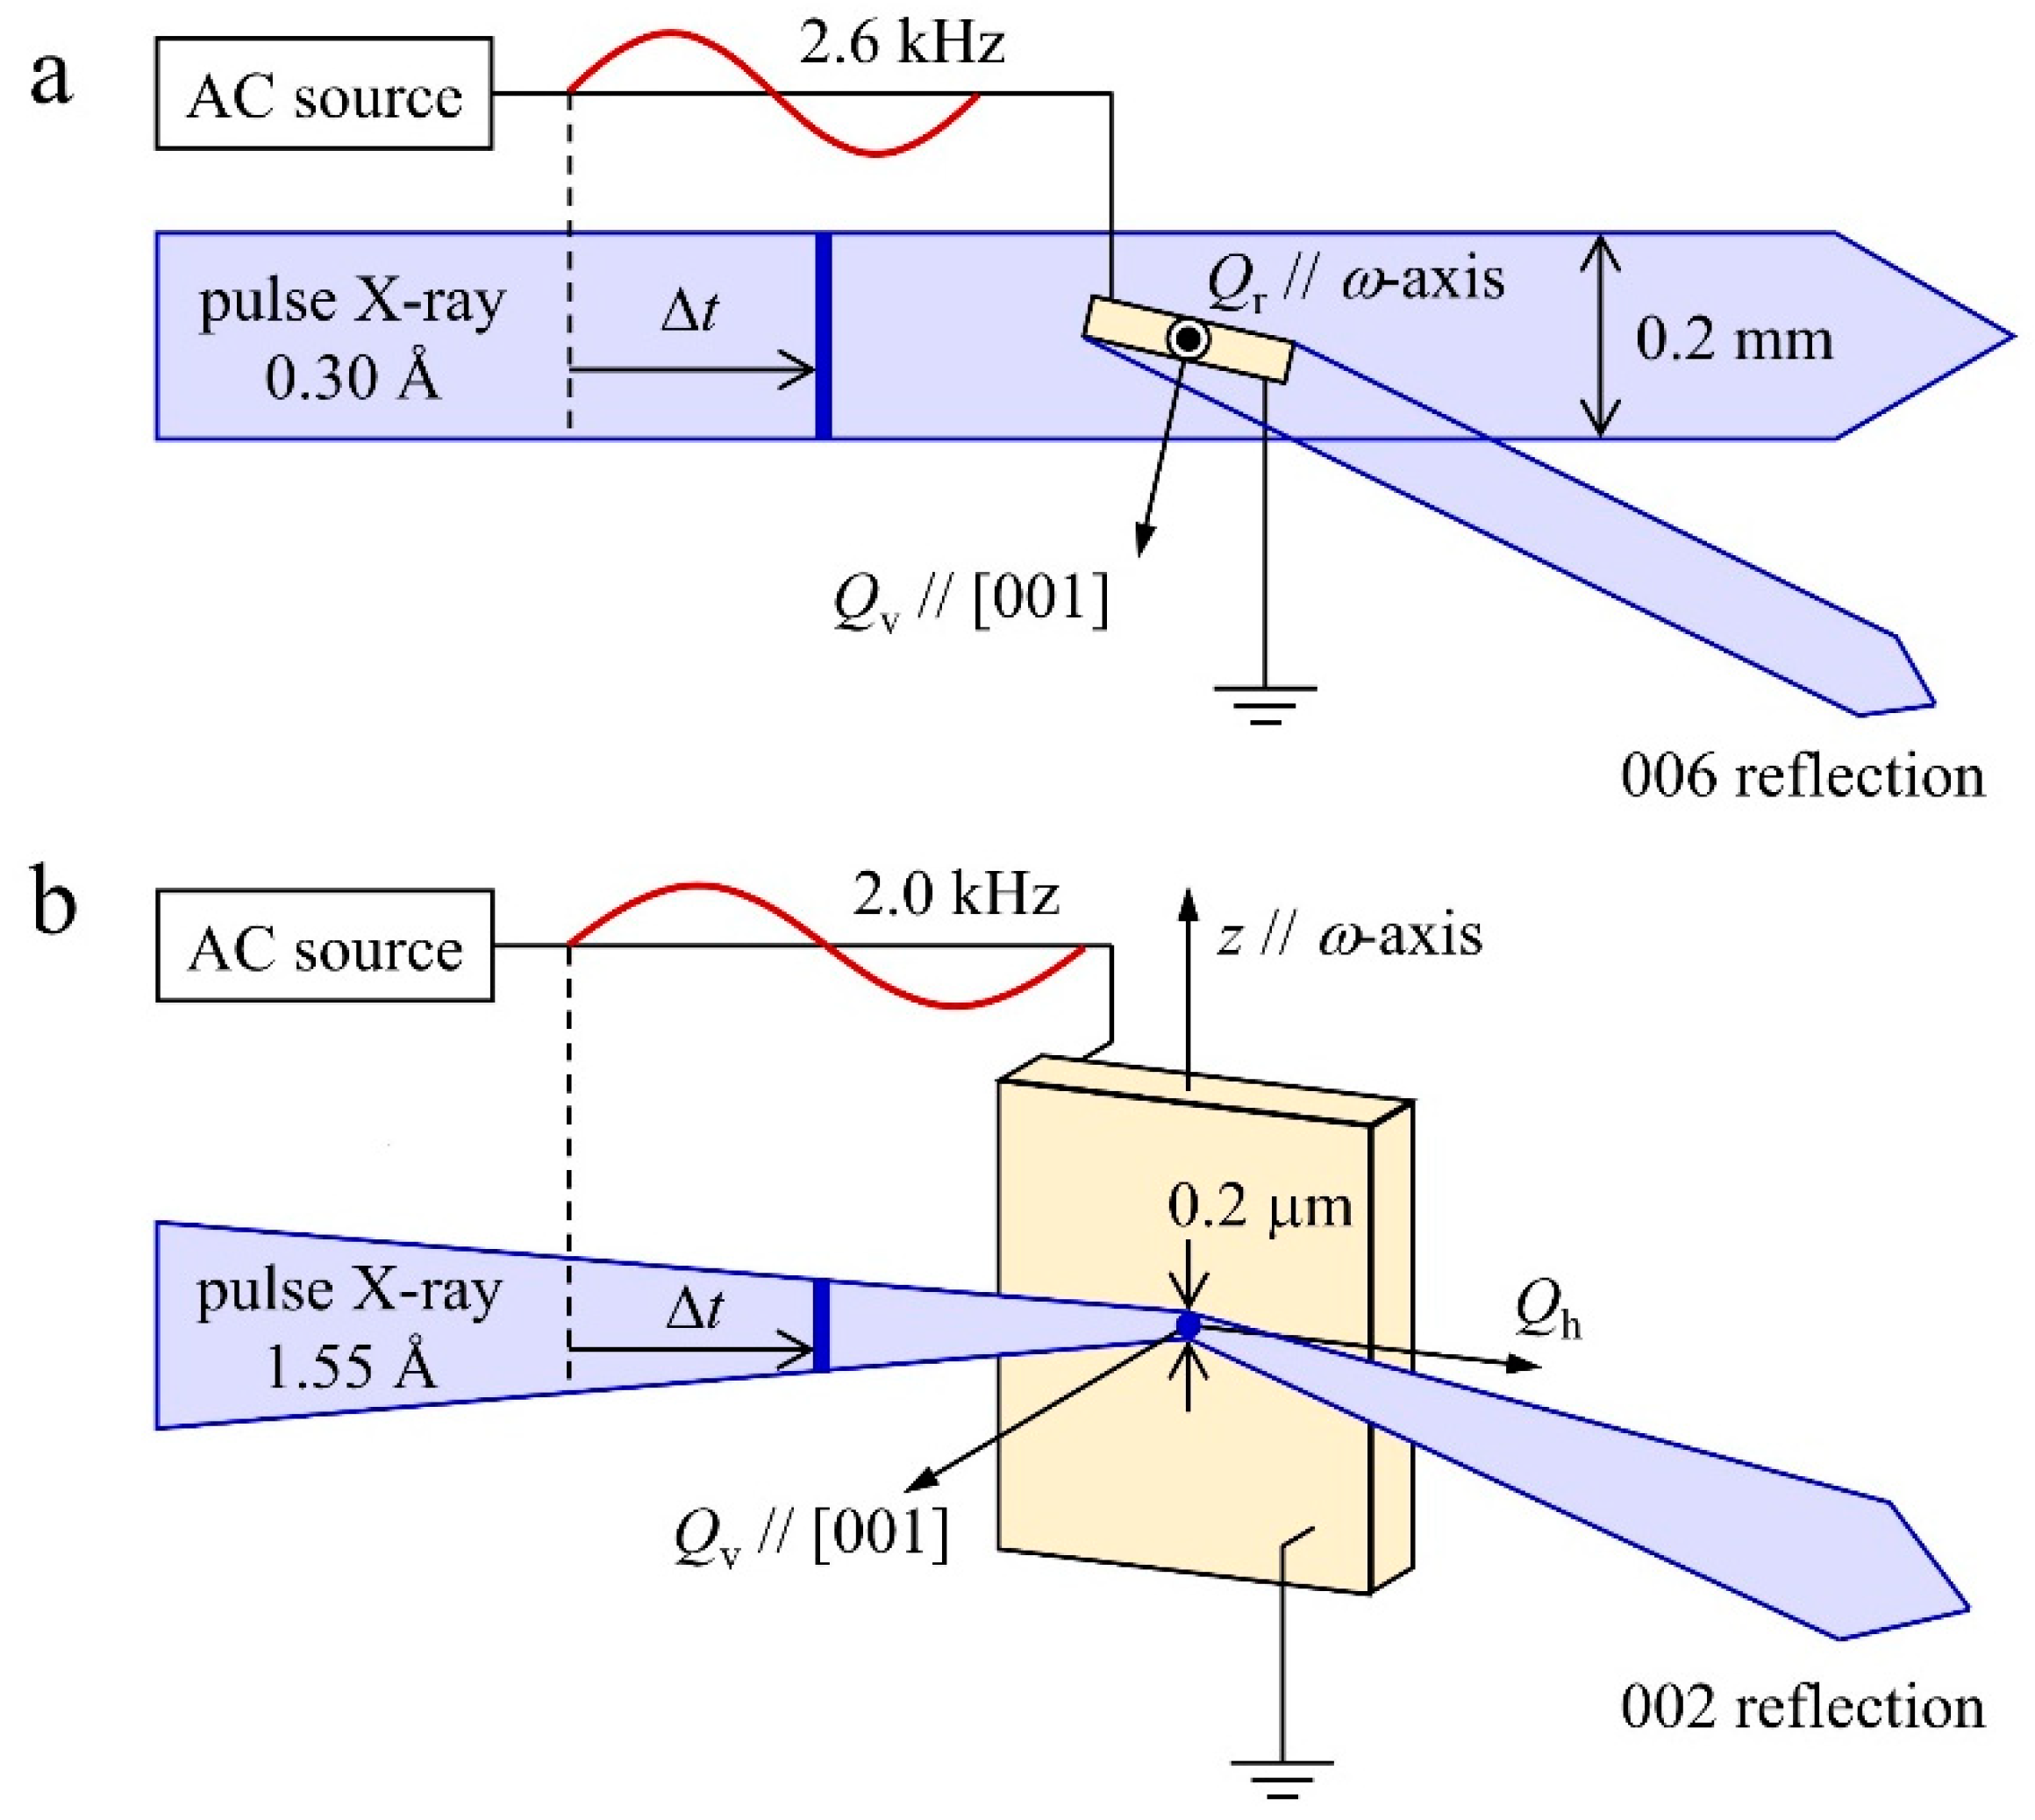
2. Materials and Methods

We performed three kinds of XRD experiments on PMN-30PT single crystals: (1) time-resolved XRD for the average structure under an AC field, (2) time-resolved nanobeam XRD for the local structure under an AC field, and (3) nanobeam XRD for the local structure under a DC field. The time-resolved XRD for the average structure was performed at the beamline BL02B1 of a SPring-8 large synchrotron radiation facility [34]. The nanobeam XRD for the local structure was performed at the beamline BL13XU of SPring-8 [35].
A schematic layout of the time-resolved XRD for the average structure under the AC field is shown in Figure 1a. The PMN-30PT single crystal with a size of 0.15 × 0.15 × 0.10 // [001] mm3 was obtained from a commercial crystal and embedded in an epoxy thin plate. Two crystal surfaces perpendicular to [001] and parallel to the epoxy thin plate were polished bare and coated by an evaporated Au thin film for application of AC fields. A high-energy X-ray with a wavelength of λ = 0.300 Å and a penetration depth of 0.12 mm for PMN-30PT was used to reduce the absorption effects of the Pb atoms. The X-ray beam size at 0.2 mm is larger than the crystal size. Repetitive X-ray pulses with a pulse width of 1.5 μs were extracted with a high-repetition-rate X-ray chopper [36] at a repetition rate of 2.6 kHz and radiated onto the PMN-30PT single crystal. The PMN-30PT single crystal was mechanically vibrating and alternately switching its polarization under a bipolar sinusoidal electric field along [001] with an amplitude of 10 kV/cm and a frequency of 2.6 kHz, which synchronized with the repetitive X-ray pulses. The time-resolved X-ray intensities of the 006 Bragg reflection were measured by transmission geometry using a large cylindrical imaging plate camera with a radius of 191.3 mm by changing the delay time Δt of the repetitive X-ray pulses to the sinusoidal electric field. We monitored the time dependences of the voltage and current between the two electrodes on the crystal surfaces with a digital oscilloscope.
A schematic layout of the time-resolved nanobeam XRD for the local structure under the AC field is shown in Figure 1b. A commercially available [001] oriented thin single-crystal plate of PMN-30PT with surfaces of 3 × 2 mm2 coated by Au electrodes and a thickness of 0.1 mm was used in the experiment. The Au-coated PMN-30PT single crystal attached to an Au-coated glass plate with silver paste was mounted on a nanobeam X-ray diffractometer to align the crystal surface perpendicular to the horizontal plane and parallel to the incident X-ray beam axis at the crystal orientation angle ω = 0. The incident X-ray beam with the λ = 1.55 Å wavelength was focused on the crystal surface using a Fresnel zone plate. The penetration depth of the X-ray was 7 μm for PMN-30PT. The X-ray beam size at the sample position was 430 (horizontal) × 190 (vertical) nm2 at the full width of half maximum (FWHM). Repetitive X-ray pulses with a pulse width of 1.5 μs, extracted at a repetition rate of 2.0 kHz, were radiated onto the PMN-30PT single crystal, while mechanically vibrating and alternately switching its polarization under a bipolar sinusoidal electric field along [001] with an amplitude of 6 kV/cm and frequency of 2.0 kHz. A motorized sample stage scanned the beam position on the crystal surface. Only the vertical position z was scanned from 0 to 10 μm in this study. The time-resolved X-ray intensities of the 002 Bragg reflection were measured in surface-sensitive reflection geometry using a Timepix STPX-65k (Amsterdam Scientific Instruments BV) two-dimensional hybrid pixel detector located at the diffraction angle of 2θ = 45.2° and the camera length of 338 mm by changing the delay time Δt. Time dependences of voltage and current between the two electrodes on the crystal surfaces were monitored with a digital oscilloscope.
The nanobeam XRD for the local structure under the DC field was performed using a DC source instead of an AC source without an X-ray chopper in the experimental layout of Figure 1b. The X-ray intensities of the 002 Bragg reflection were measured under static electric fields from E = −8 to 8 kV/cm applied [001] perpendicular to the crystal surface. The vertical beam position z was scanned from 0 to 10 μm using a motorized sample stage.

3. Results

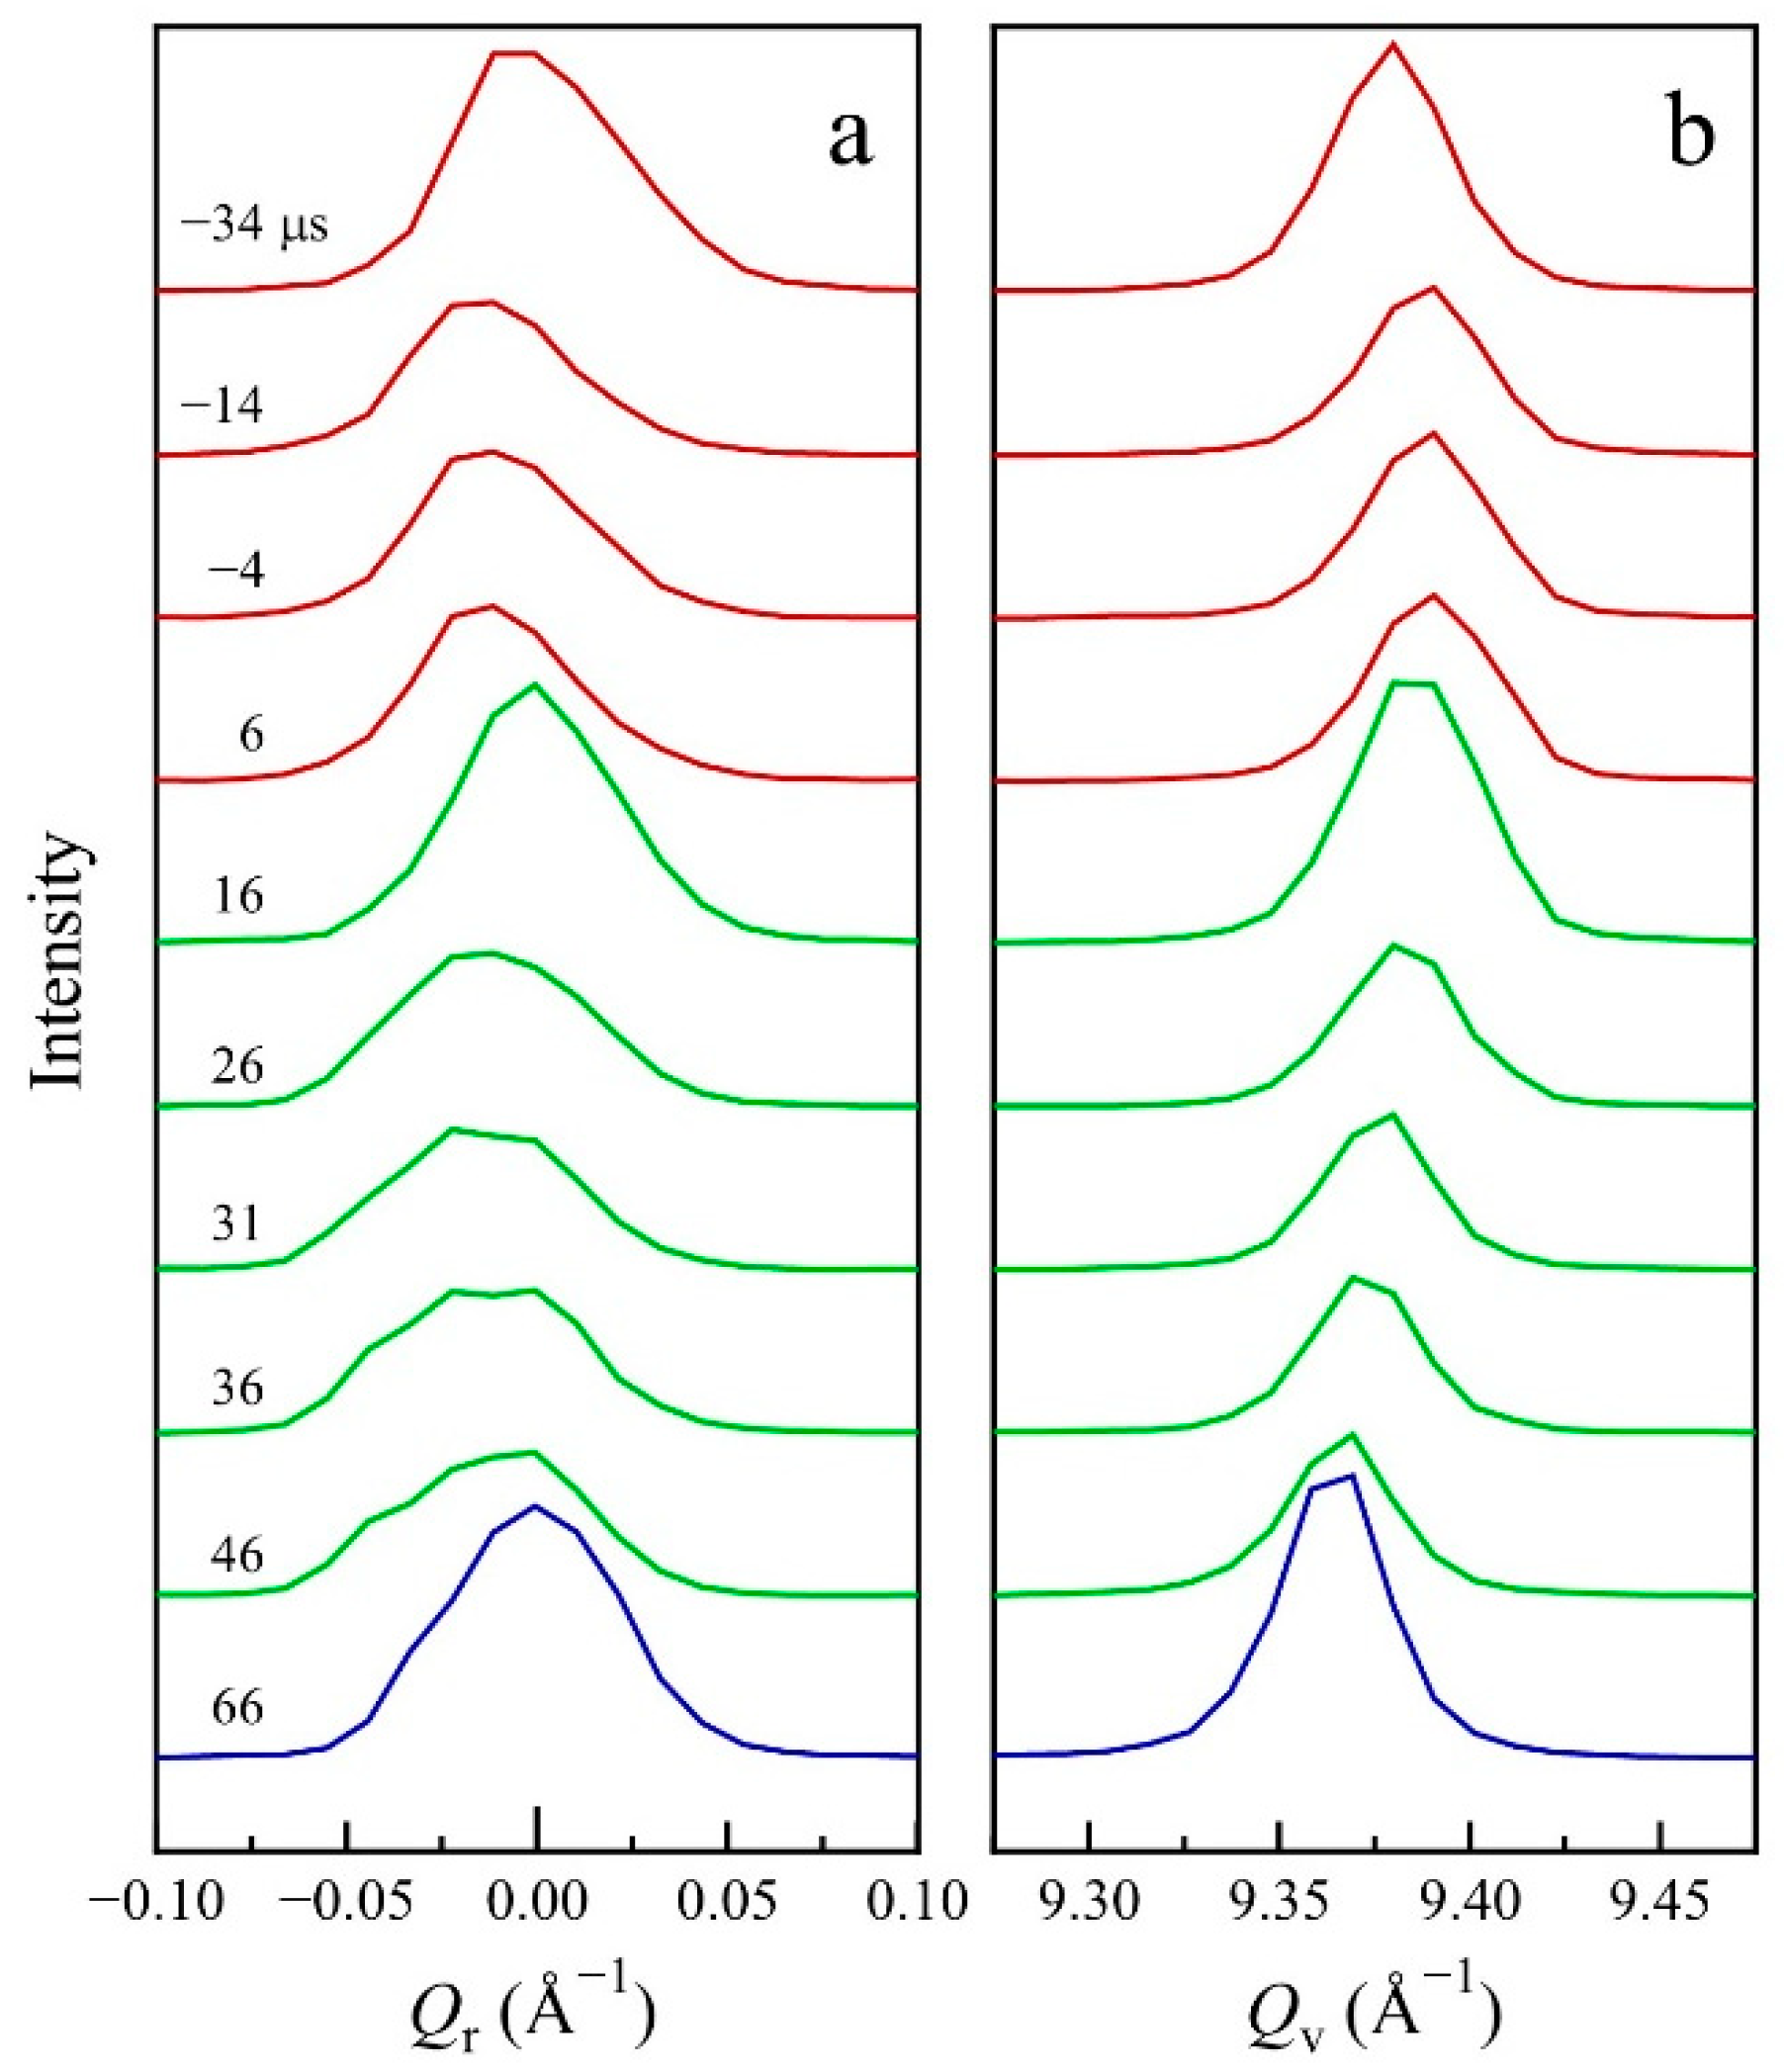
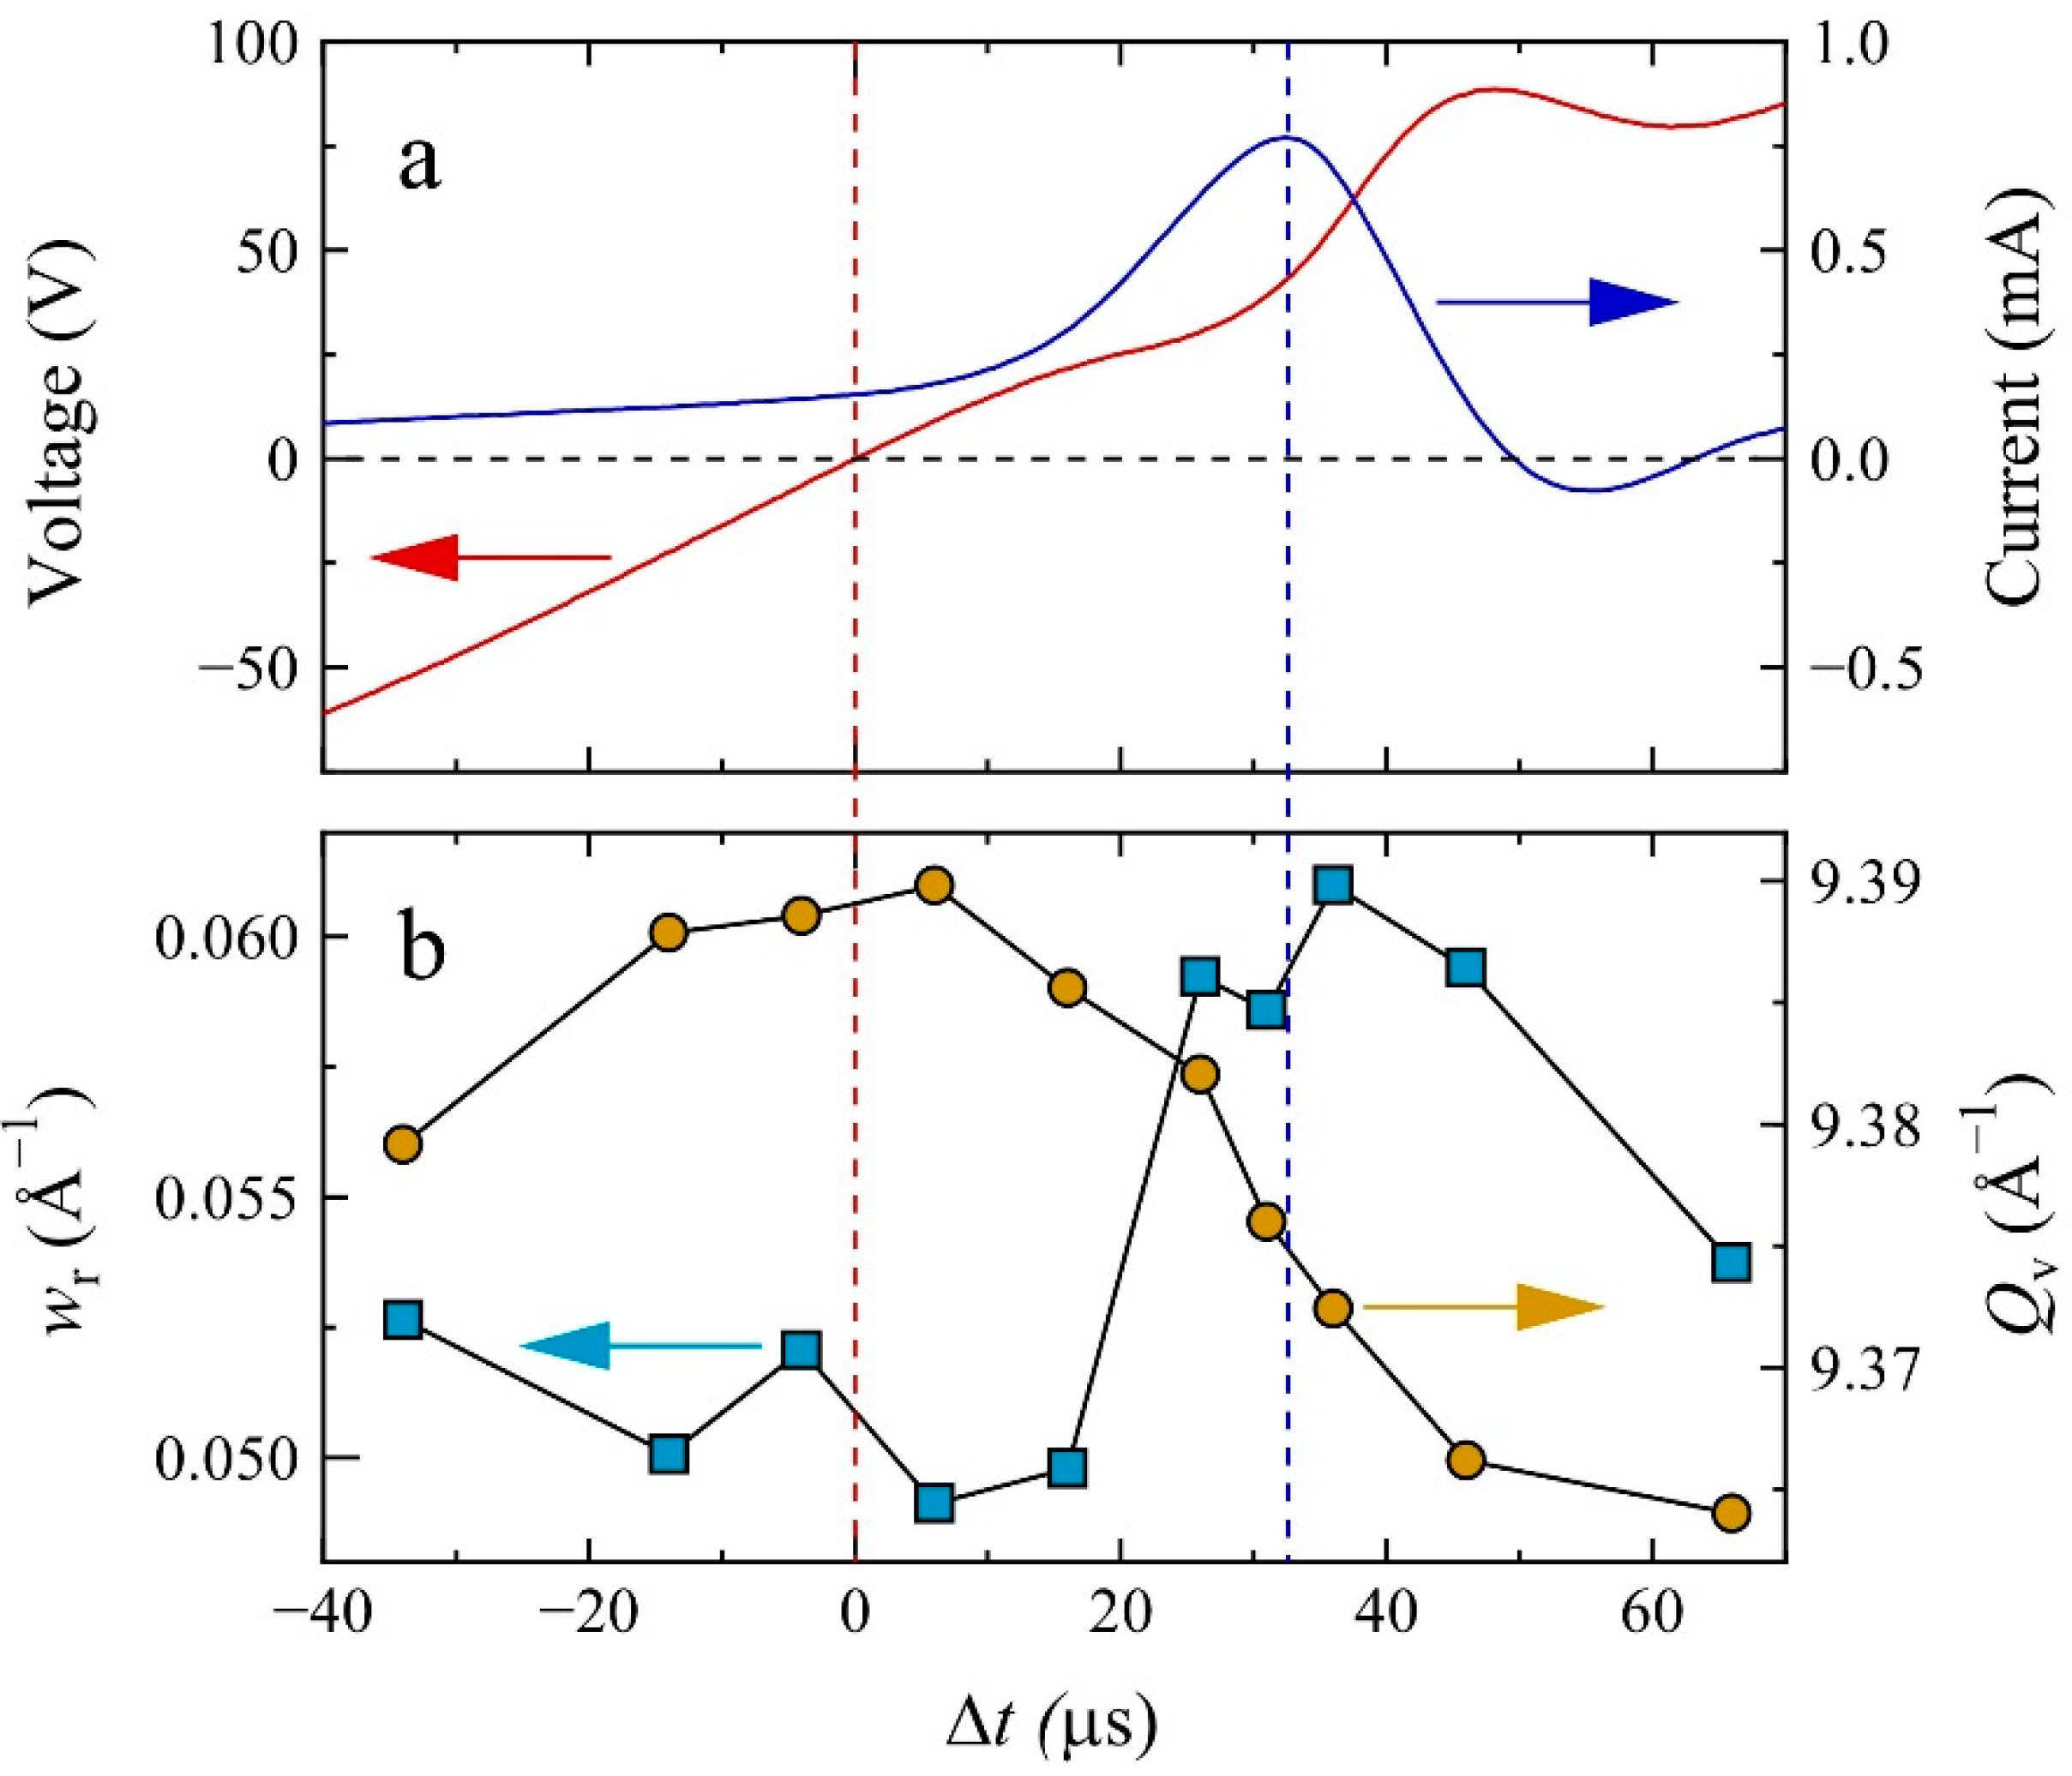
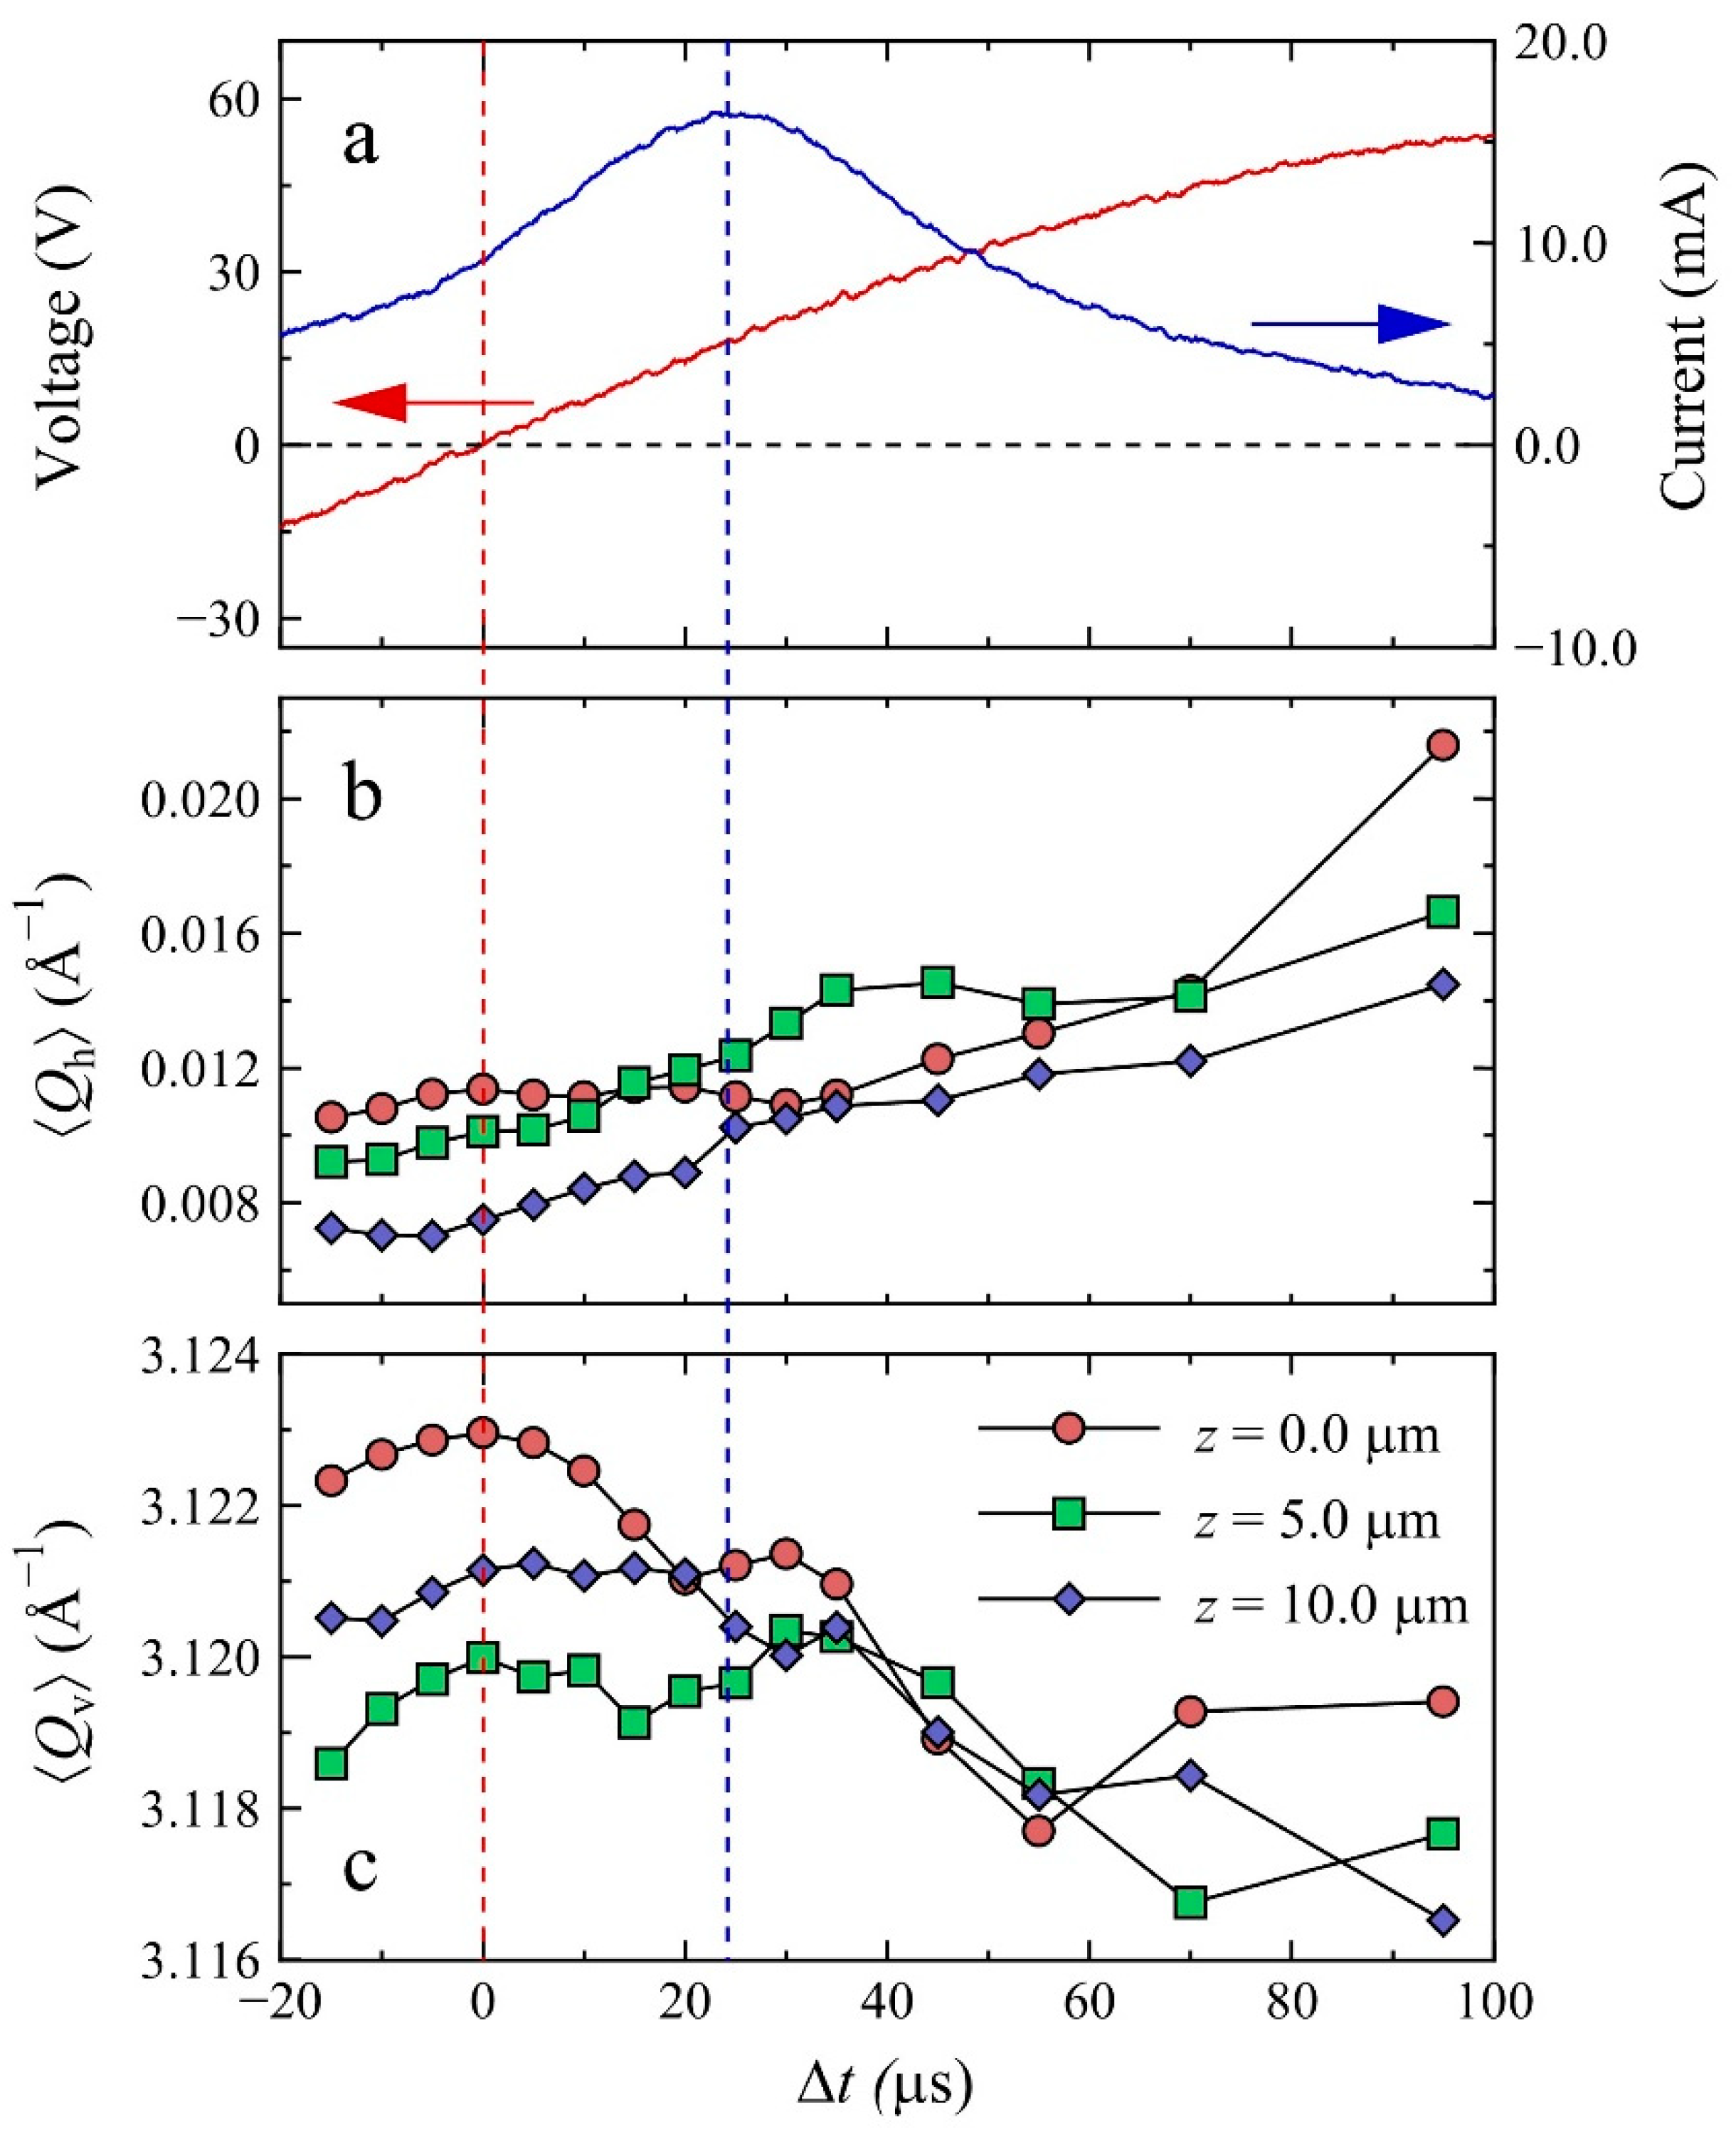
3.1. Transient Average Structure under AC Field

Figure 2a,b shows the time dependences of the Qr and Qv one-dimensional profiles of the 006 Bragg peak through the intensity maxima, respectively, which were diffracted from a whole crystal of PMN-30PT (R3m, a = 4.028 Å, α = 89.92°) in the experimental layout of Figure 1a. Both Qr and Qv represent two-dimensional reciprocal space coordinates along the crystal rotation ω-axis and [001] parallel to the electric field, respectively (Figure 1a), where the scattering vector length is Q = Q r 2 + Q v 2 = 4 π sin θ / λ = 2 π / d (d: d-spacing). A peak broadening along Qr and a peak shift along Qv, due to the polarization switching, can be seen in the time region from Δt = 16 to 46 μs. The time dependences of the voltage and current between the two electrodes on the crystal surfaces were monitored by a digital oscilloscope from Δt = −40 to 70 μs, as shown in Figure 3a. A transient positive current peak caused by the polarization switching is clearly seen in the time region from Δt = 16 to 46 μs with the maximum at Δt = 33 μs.
The time dependences of the FWHM along Qr (wr) and the Qv position at the intensity maximum were obtained by least-squares fitting using a pseudo-Voigt function as shown in Figure 3b. The rhombohedral crystal with a multi-domain structure consisting of four domains with the polarization along [11 1 ¯ ], [ 1 ¯ 1 1 ¯ ], [1 1 ¯ 1 ¯ ], and [ 1 ¯ 1 ¯ 1 ¯ ] at Δt = −34 μs after poling under a negative electric field antiparallel to [001]. wr decreased and Qv increased from Δt = −34 to 6 μs while changing the field (voltage) from a negative to a positive value. The peak sharpening was caused by the easing of the lattice strain, and the relaxation of the mismatch in boundaries between the ferroelectric domains, accompanied by decreases in polarization. The increase in Qv was caused by a piezoelectric tensile lattice strain with the contraction of the rhombohedral lattice constant a along [001]. When the polarization switching started at Δt = 6 μs, wr increased and Qv decreased with the increase in the polarization switching current. After wr and the polarization switching current reached their maxima at Δt = 33 μs, wr and Qv decreased with the decrease in polarization switching current. The peak broadening was caused by the increase in crystal mosaicity, accompanied by nucleation, and the growth of the polarization-reversed ferroelectric domains. The decrease in Qv was caused by a ferroelectric polarization switch with the elongation of the rhombohedral lattice constant a along [001]. The time dependences of wr and Qv of the 006 Bragg peak under an alternating electric field were basically the same as those previously observed in PZN-4.5PT [25].

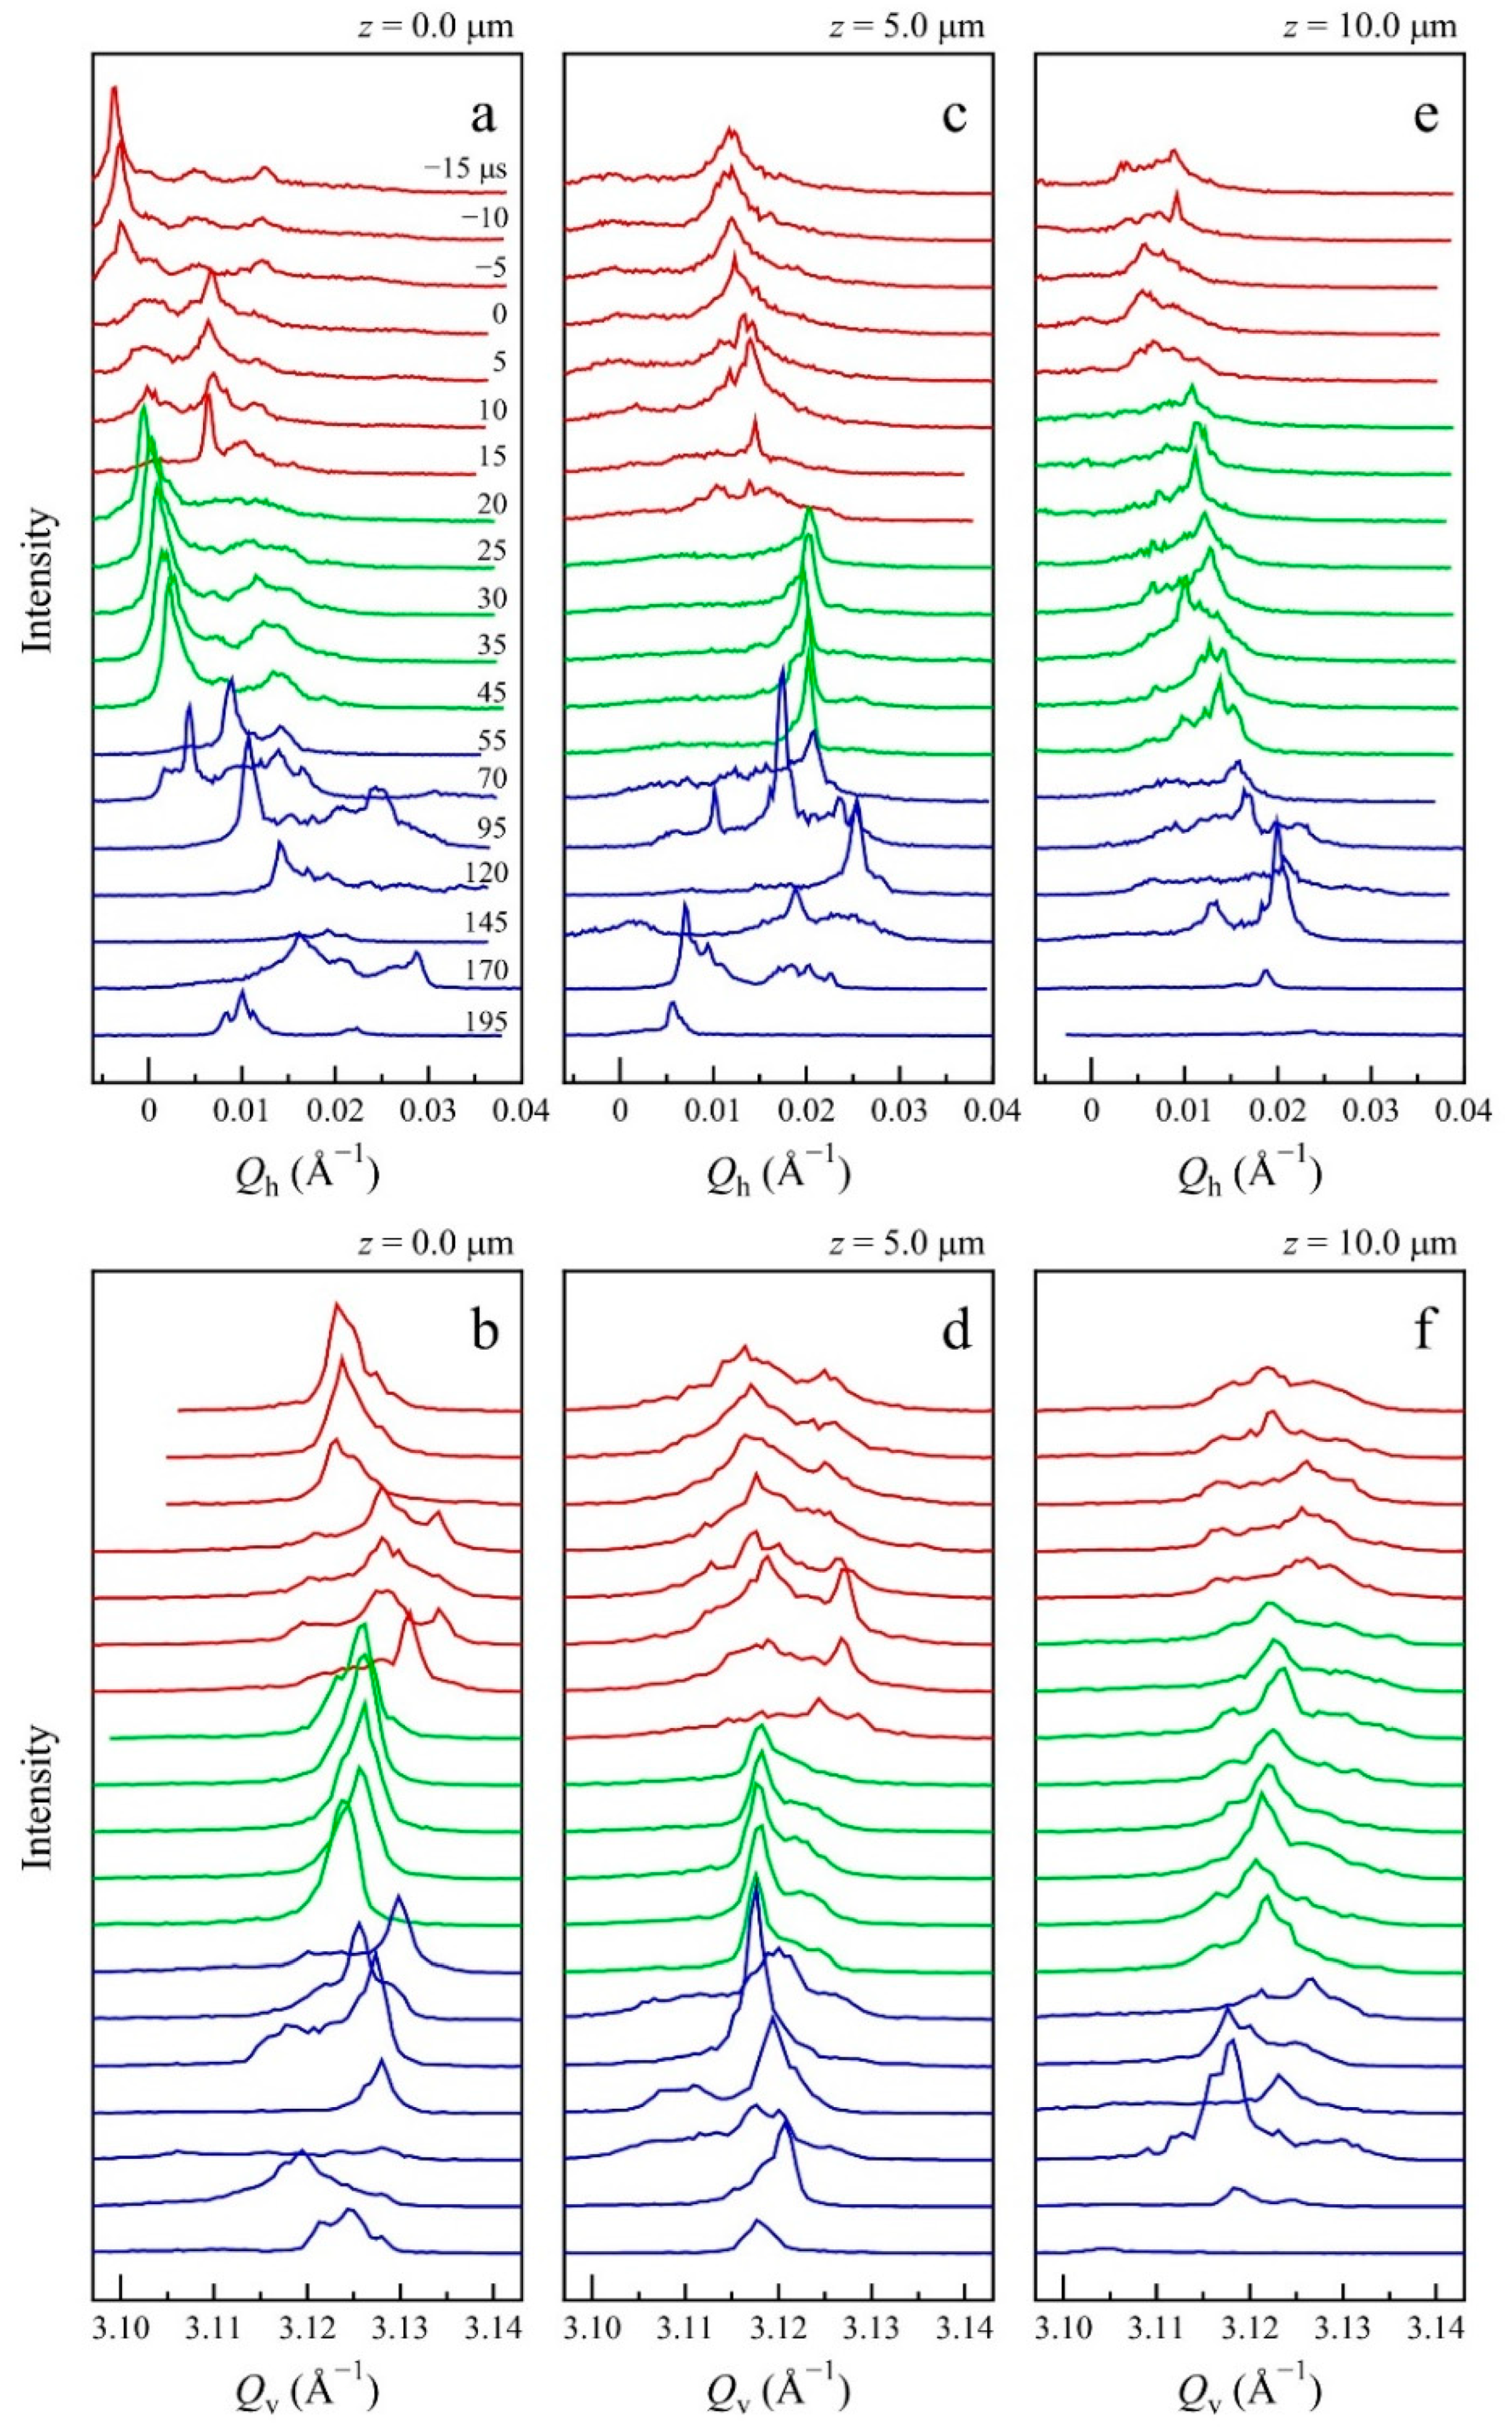
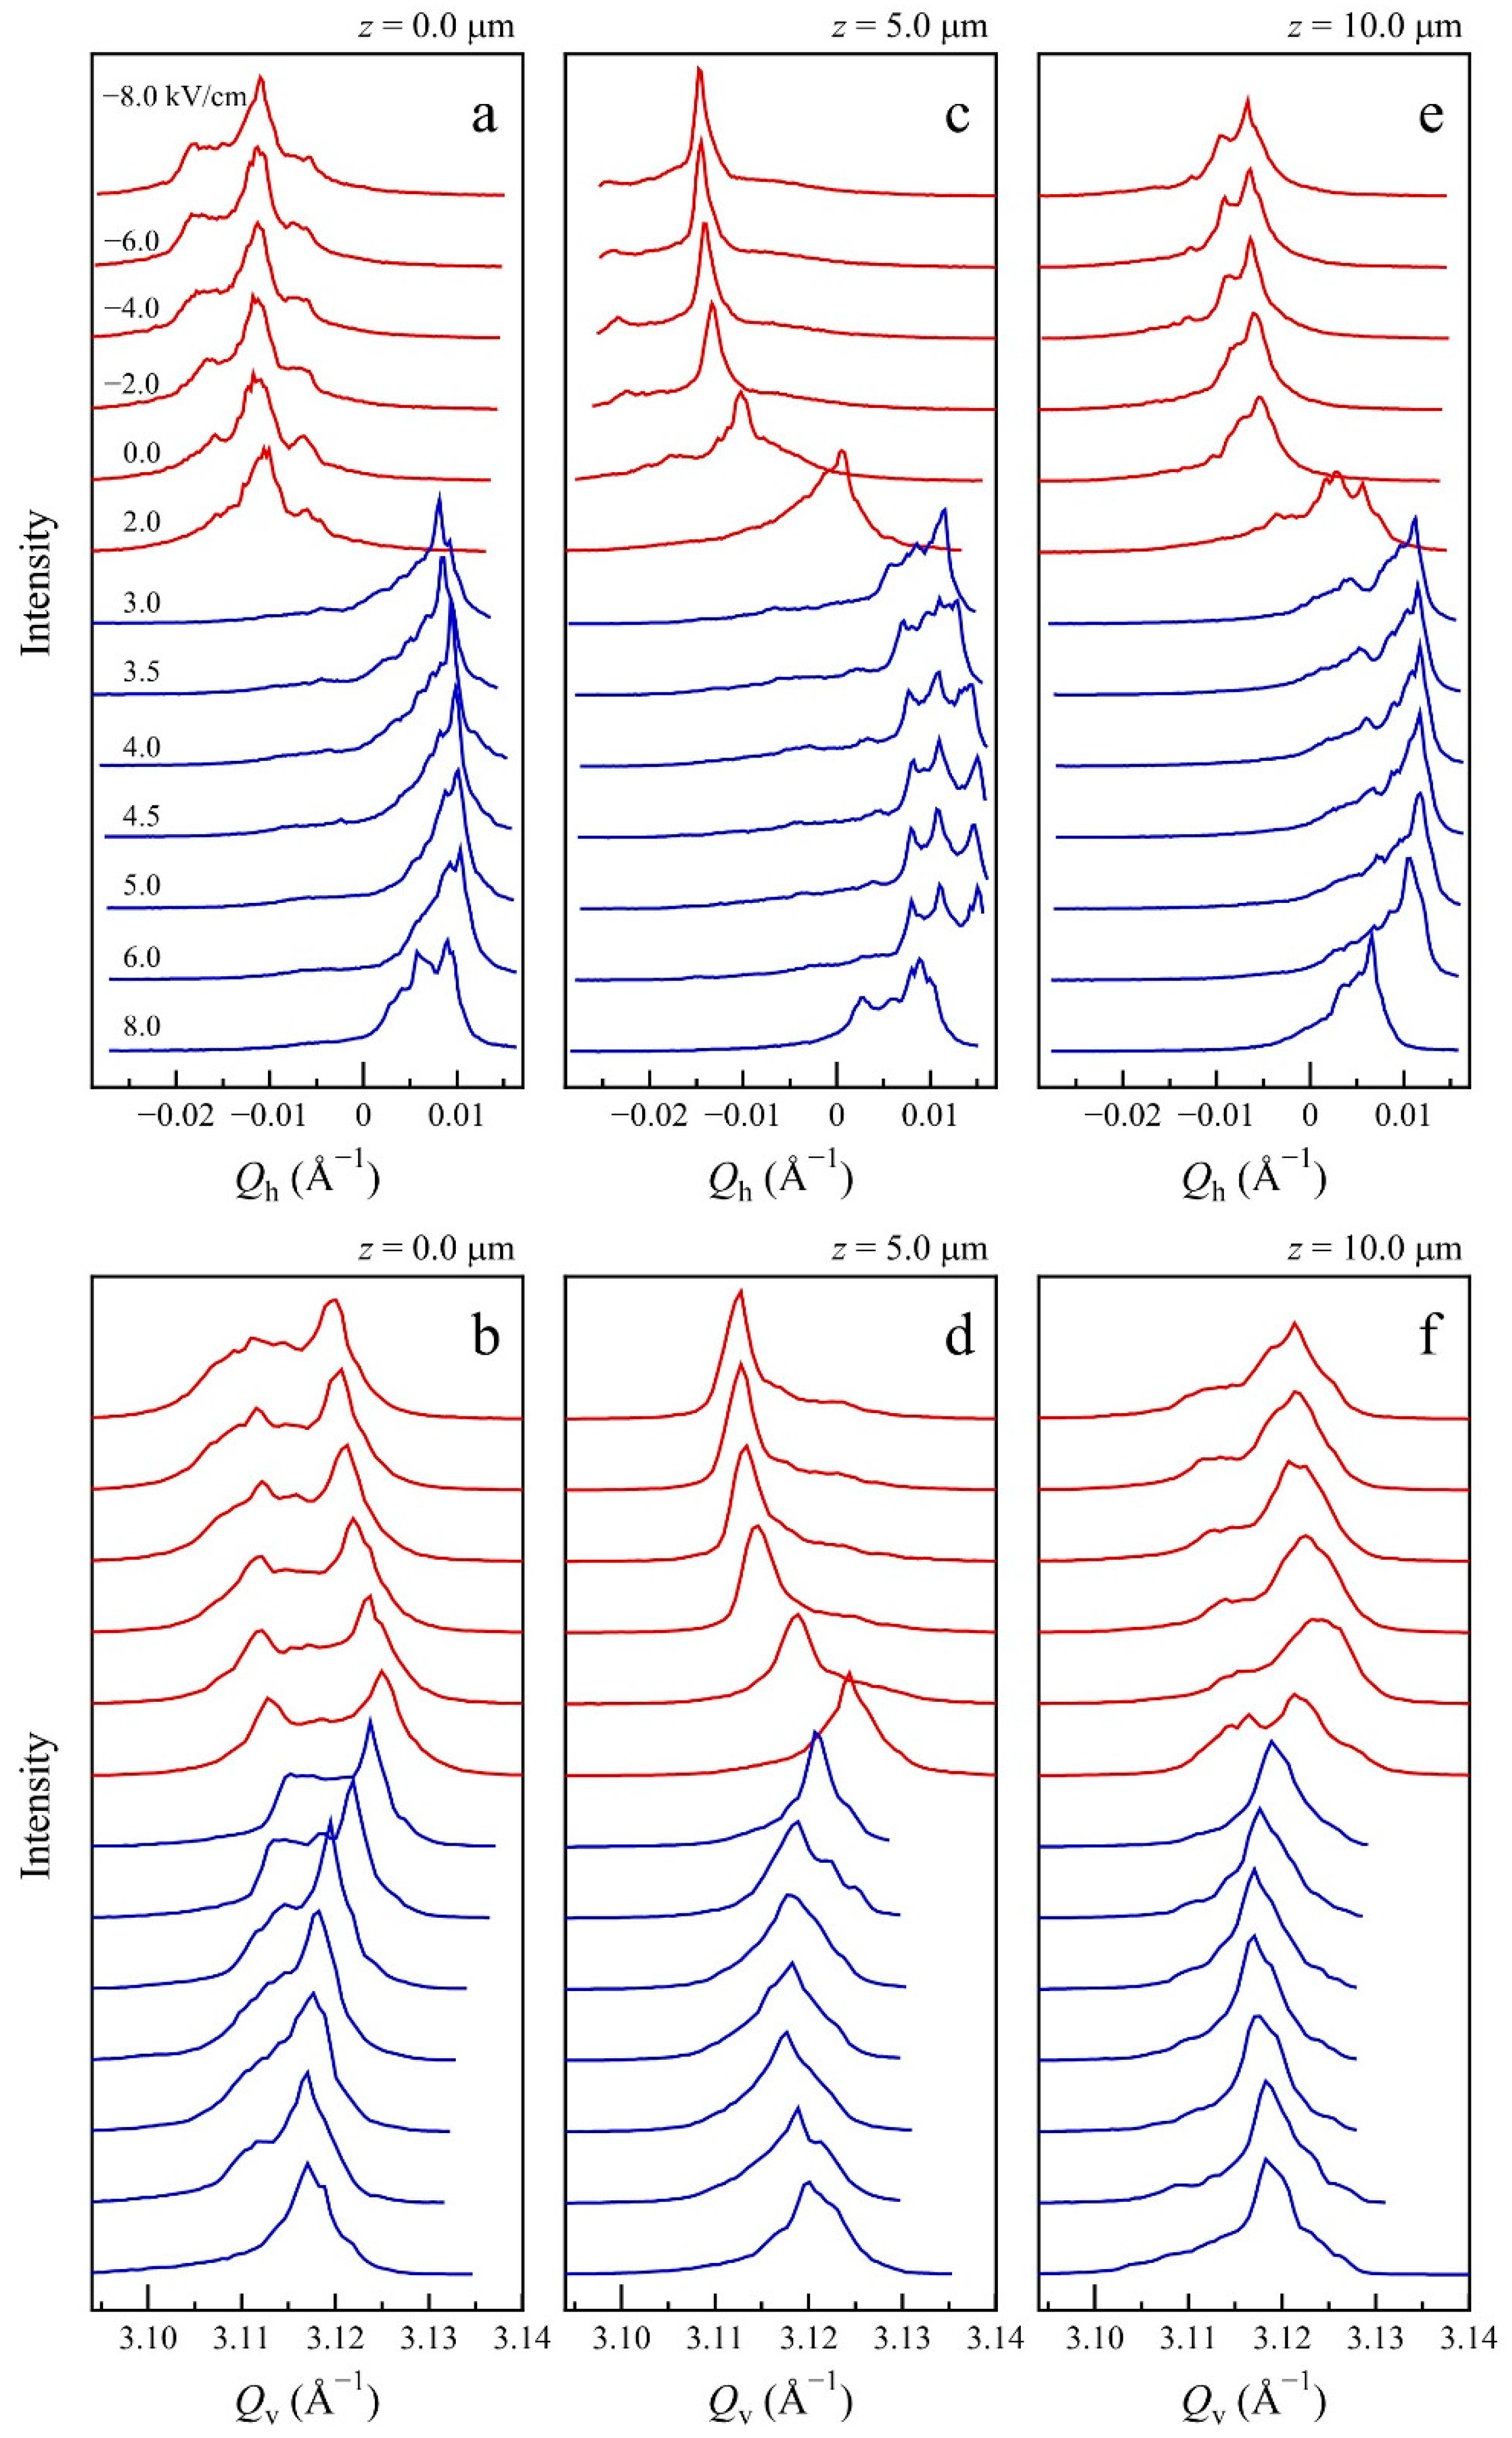
3.2. Transient Local Structure under AC Field

Figure 4a,b shows the time dependences in the Qh and Qv one-dimensional profiles of the 002 Bragg peak through the intensity maxima, respectively, which were diffracted from a local area on the crystal surface at z = 0.0 μm, as shown in the experimental layout in Figure 1b. The Qh is a reciprocal space coordinate perpendicular to both the crystal rotation ω-axis, and [001] parallel to the electric field (Figure 1b), where the scattering vector length is Q = Q h 2 + Q v 2 = 4 π sin θ / λ = 2 π / d . The corresponding Qh and Qv profiles at z = 5.0 and 10.0 μm are also shown in Figure 4c–f. Unlike the Bragg profiles of the whole crystal in Figure 2, those with local areas on the crystal surface consisted of several sharp peaks and a weak broad peak that demonstrated strong position dependences. The results suggest that nanodomains with various lattice constants, and orientations, exist in the measured local area, and the translation symmetry breaks into the microscale. A few nanodomains with larger volumes in the local area contributed to strong, sharp peaks. However, smaller nanodomains with various lattice constants and orientations contributed to a weak broad peak. The average intensity distributions obtained by averaging the intensity distributions through z = 0–10 μm displayed a near single-peak shape, consistent with the Bragg peak shape of the whole crystal, as shown in Figure 2.
The time dependences of the voltage and current between the two electrodes on the crystal surfaces, as monitored by a digital oscilloscope from Δt = −20 to 100 μs, are shown in Figure 5a. A transient positive current peak caused by the polarization switching is clearly seen with its maximum at Δt = 24 μs. The complicated time and position dependences of the 002 Bragg intensity distributions are shown in Figure 4. However, the intensity distributions were apparently different in three time-regions, before, during, and after the polarization switching. The start and finishing times of the polarization switching, confirmed by the intensity distributions, seemed to depend on the local location. We attributed this to the Bragg peak broadening during the polarization switching of the average structure, as shown in Figure 2a and Figure 3b. After the polarization, the switching finished at around Δt = 60 μs, and the dynamic intensity redistributions were attributed to the reorientations of the nanodomains.
The time dependences of the averaged Qh and Qv in the two-dimensional intensity distributions, calculated by Q h = i Q h i I i / i I i and Q v = i Q v i I i / i I i at each local location, are shown in Figure 5b,c, respectively. The 〈 Q h 〉 was shifted to the positive side with the progression of the switching polarization. The time dependence of 〈 Q h 〉 was likely caused by the switching of the rhombohedral lattice angle α from 90 − Δα to 90 + Δα (°) (Δα = 0.08°), accompanied with the polarization switching. Such time dependence is not observed in the Bragg peak of the average structure, as shown in Figure 2a, because of its multi-domain structure. The rhombohedral multi-domain crystal poled along [001] formed a domain structure consisting of four domains with the polarization along [111], [ 1 ¯ 11], [1 1 ¯ 1], and [ 1 ¯ 1 ¯ 1]. The time dependence of 〈 Q v 〉 is basically same as that of Qv at the intensity maximum of the average structure, as shown in Figure 3b. Both the 〈 Q h 〉 and 〈 Q v 〉 under the AC field shared certain position dependences, forming the heterogeneous structure, which consisted of nanodomains with various lattice constants and orientations.

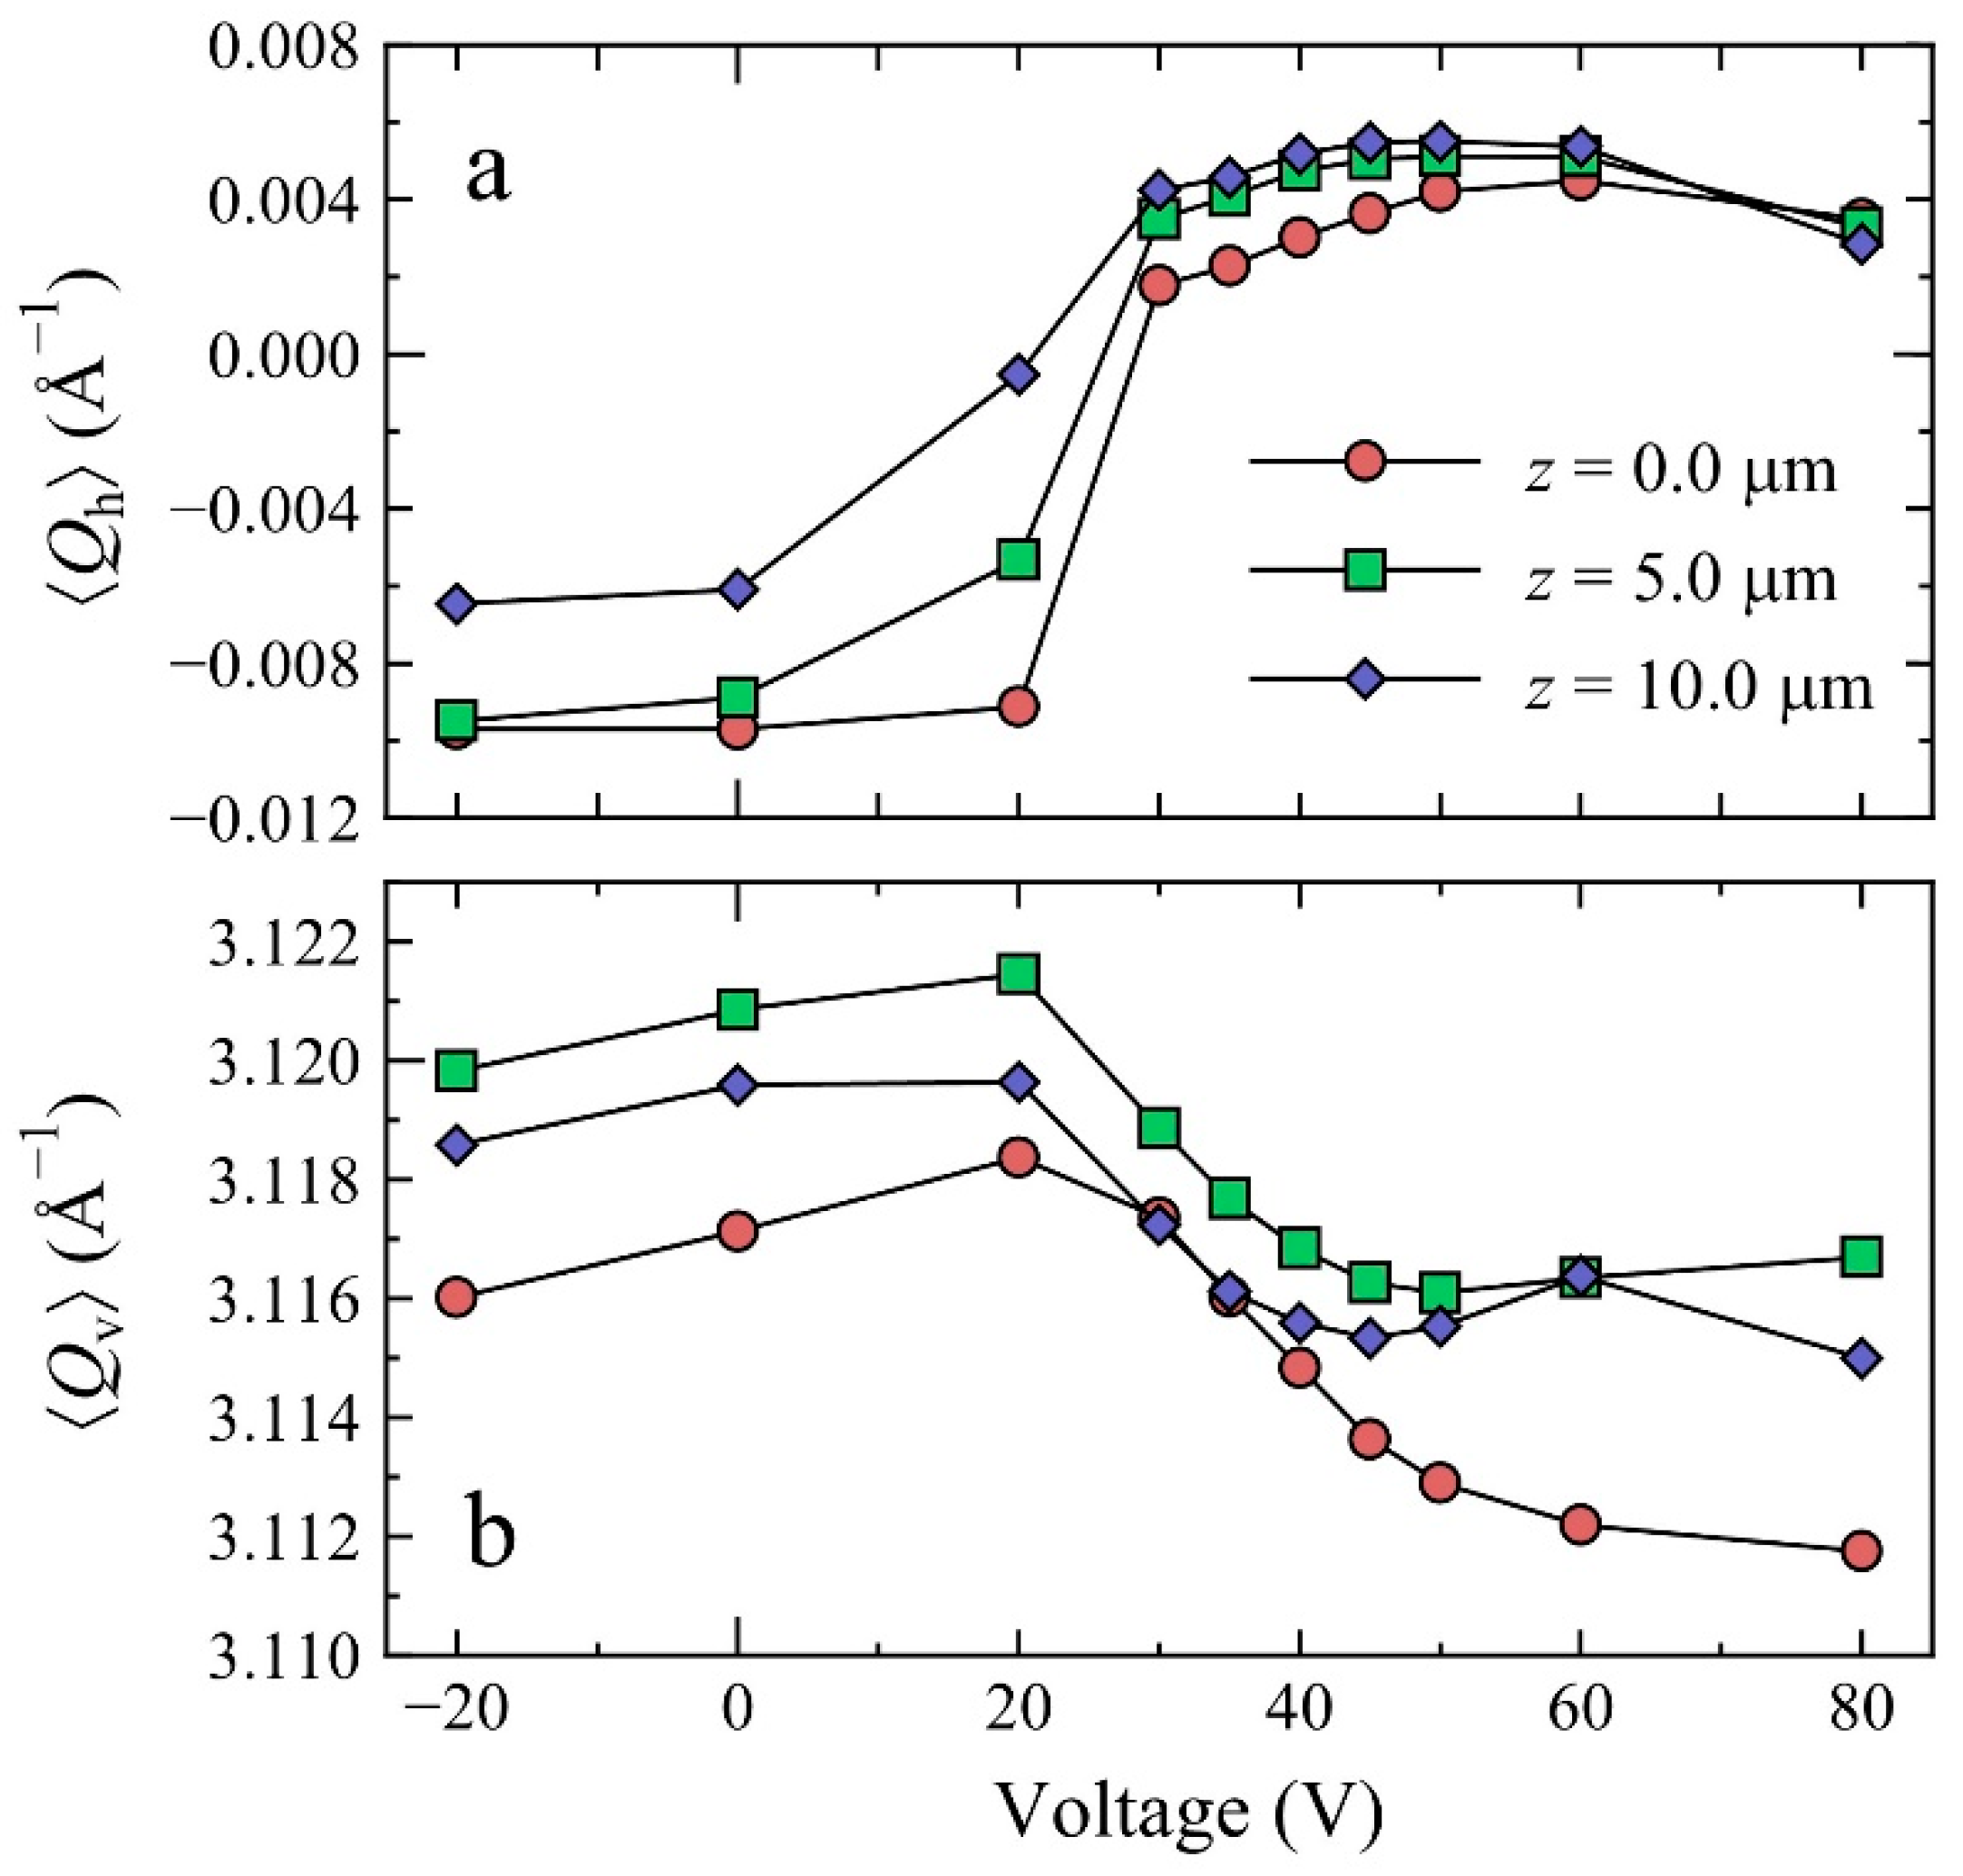
3.3. Static Local Structure under DC Field

Figure 6a,b shows, respectively, both the DC field dependences of the Qh and Qv one-dimensional profiles of the 002 Bragg peak through the intensity maxima, which were diffracted from a local area on the crystal surface at z = 0.0 μm in the experimental layout in Figure 1b. The corresponding Qh and Qv profiles at z = 5.0 and 10.0 μm are also shown in Figure 6c–f. The DC field was changed from E = −8.0 to 8.0 kV/cm (−80 to 80 V in voltage). The field dependences of 〈 Q h 〉 and 〈 Q v 〉 from E = −2.0 to 8.0 kV/cm at each local location are shown in Figure 7a,b, respectively. Discontinuous peak shifts along Qh with intensity redistributions were observed between E = 2 and 3 kV/cm (20 and 30 V in voltage). This behavior is explained by the switching of the rhombohedral lattice angle α from 90 − Δα to 90 + Δα (°) (Δα = 0.08°), accompanied by the polarization switching, and the redistribution of the polar nanodomains with a heterogeneous structure. The moment-to-moment change in 〈 Q h 〉, due to the discontinuous lattice deformation, was detected in the time-resolved nanobeam XRD under AC field, as shown in Figure 5b. The DC field dependences of 〈 Q v 〉 were consistent with the time dependence of 〈 Q v 〉 under the AC field, as shown in Figure 5c. The field-induced tensile lattice strain calculated from 〈 Q v 〉 was s = 1.3 × 10⁻³ at E = 8.0 kV/cm. The piezoelectric constant estimated from the tensile lattice strain was d = s/E = 1.6 × 10³ pC/N, which was consistent with the bulk piezoelectric constant. While both 〈 Q h 〉 and 〈 Q v 〉 were under the zero and DC fields, some position dependences were observed, resulting in the heterogeneous structure consisting of nanodomains with various lattice constants and orientations.

4. Discussion

The time dependences of the 006 Bragg peak under the AC field measured for a whole crystal of PMN-30PT (Figure 2 and Figure 3b) are similar to those of PZN-4.5PT reported previously [25]. It is expected that PMN-30PT also exhibits an intersite rotational displacement of disordered Pb atoms under the AC field, which has been found in PZN-4.5PT. The time-resolved crystal structure analysis of PMN-30PT to reveal the Pb atomic motion under the AC field is progressing and will be reported shortly.
The time dependences of the Bragg intensity distribution, under the AC field, measured for local areas of PMN-30PT (Figure 4), are quite different from those measured for a whole crystal (Figure 2), and show strong position dependences. The results demonstrate that the crystal has a heterogeneous structure consisting of nanodomains with various lattice constants, and orientations exhibiting different electric field responses as the translation symmetry is broken down from nano to microscale pieces. The nano-to-microscale heterogeneous crystal structure, with its widely and continuously distributed local lattice strain, would enable the enormous electric field-induced lattice strain and fatigue-free polarization switching.
Changes in the 〈 Q h 〉 of the Bragg intensity distribution measured for local areas of PMN-30PT under the AC field (Figure 5b) are smaller than those under the DC field (Figure 7b). Instead, the dynamic intensity redistributions attributed to reorientations of the nanodomains, were observed in the time-resolved nanobeam XRD, under the AC field (Figure 4). Therefore, the shear lattice strain switching the α angle accompanied with the polarization switching is gradually increased with reorientations of the nanodomains. The dynamic motion of the nanodomains in the heterogeneous structure relaxes a lattice mismatch of the ferroelectric domains, and should contribute to the enormous electric field induced lattice strain, and the fatigue-free polarization switching.

5. Conclusions

The time-resolved nanobeam XRD revealed the time and position dependences of the local lattice strain on a relaxor ferroelectric single crystal of PMN-30PT mechanically vibrating and alternately switching its polarization under an alternating electric field. A heterogeneous structure consisting of nanodomains with various lattice constants and orientations exhibiting different electric field responses, and breaking the translation symmetry, was detected. The enormous piezoelectric lattice strain and fatigue-free ferroelectric polarization switching could be caused by the field-induced intersite rotational displacement of disordered Pb atoms, along with the dynamic motion of the nanodomains in the heterogeneous structure.

Author Contributions

Conceptualization, S.A.; methodology, H.O., Y.I. and S.K.; software, H.O., K.S. and Y.I.; experiment, S.A., H.O., K.S., Y.I. and S.K.; validation, S.A., A.A. and H.T.; analysis, S.A. and A.A.; writing, S.A.; project administration, S.A.; funding acquisition, S.A. and H.T. All authors have read and agreed to the published version of the manuscript.

Funding

This work was supported by a Grant-in-Aid for Scientific Research from the Japan Society for the Promotion of Science (JSPS) (Grant Nos. JP16K05017, JP19H02797, and JP20H05879), Tatematsu Foundation, Toyoaki Scholarship Foundation, and Daiko Foundation.

Acknowledgments

This work was supported by the Research Equipment Sharing Center at the Nagoya City University. The synchrotron radiation experiments were performed at SPring-8 with the approval of the Japan Synchrotron Radiation Research Institute (JASRI) (Proposal Nos. 2017A1036, 2017A1465, 2017B1476, 2018B1529, 2018B1534, 2019A1308, 2020A0690, and 2020A1511).

Conflicts of Interest

The authors declare no conflict of interest.

References

  1. Cowley, R.A.; Gvasaliya, S.N.; Lushnikov, S.G.; Roessli, B.; Rotaru, G.M. Relaxing with relaxors: A review of relaxor ferroelectrics. Adv. Phys. 2011, 60, 229–327. [Google Scholar] [CrossRef]
  2. Zhang, S.; Li, F. High performance ferroelectric relaxor-PbTiO3 single crystals: Status and perspective. J. Appl. Phys. 2012, 111, 2. [Google Scholar] [CrossRef] [Green Version]
  3. Sun, E.; Cao, W. Relaxor-based ferroelectric single crystals: Growth, domain engineering, characterization and applications. Prog. Mater. Sci. 2014, 65, 124–210. [Google Scholar] [CrossRef] [Green Version]
  4. Kuwata, J.; Uchino, K.; Nomura, S. Dielectric and Piezoelectric Properties of 0.91Pb(Zn1/3Nb2/3)O3-0.09PbTiO3 Single Crystals. Jpn. J. Appl. Phys. 1982, 21, 1298–1302. [Google Scholar] [CrossRef]
  5. Park, S.-E.; Shrout, T.R. Characteristics of relaxor-based piezoelectric single crystals for ultrasonic transducers. IEEE Trans. Ultrason. Ferroelectr. Freq. Control 1997, 44, 1140–1147. [Google Scholar] [CrossRef]
  6. Park, S.-E.; Shrout, T.R. Ultrahigh strain and piezoelectric behavior in relaxor based ferroelectric single crystals. J. Appl. Phys. 1997, 82, 1804–1811. [Google Scholar] [CrossRef]
  7. Zhang, R.; Jiang, B.; Jiang, W.; Cao, W. Anisotropy in domain engineered 0.92Pb(Zn1/3Nb2/3)O3-0.08PbTiO3 single crystal and analysis of its property fluctuations. IEEE Trans. Ultrason. Ferroelectr. Freq. Control 2002, 49, 1622–1627. [Google Scholar] [CrossRef]
  8. Guo, Y.; Luo, H.; Ling, D.; Xu, H.; He, T.; Yin, Z. The phase transition sequence and the location of the morphotropic phase boundary region in (1 − x)[Pb(Mg1/3Nb2/3)O3]–xPbTiO3 single crystal. J. Phys. Condens. Matter 2003, 15, L77. [Google Scholar] [CrossRef]
  9. Fu, H.; Cohen, R.E. Polarization rotation mechanism for ultrahigh electromechanical response in single-crystal piezoelectrics. Nat. Cell Biol. 2000, 403, 281–283. [Google Scholar] [CrossRef]
  10. Noheda, B.; Cox, D.E.; Shirane, G.; Park, S.-E.; Cross, L.E.; Zhong, Z. Polarization Rotation via a Monoclinic Phase in the Piezoelectric 92% PbZn1/3Nb2/3O3-8% PbTiO3. Phys. Rev. Lett. 2001, 86, 3891–3893. [Google Scholar] [CrossRef] [Green Version]
  11. Chien, R.R.; Schmidt, V.H.; Tu, C.-S.; Hung, L.-W.; Luo, H. Field-induced polarization rotation in (001)-cut Pb(Mg1/3Nb2/3)0.76Ti0.24O3. Phys. Rev. B 2004, 69, 172101. [Google Scholar] [CrossRef] [Green Version]
  12. Kutnjak, Z.; Petzelt, J.; Blinc, R. The giant electromechanical response in ferroelectric relaxors as a critical phenomenon. Nat. Cell Biol. 2006, 441, 956–959. [Google Scholar] [CrossRef] [PubMed]
  13. Kutnjak, Z.; Blinc, R.; Ishibashi, Y. Electric field induced critical points and polarization rotations in relaxor ferroelectrics. Phys. Rev. B 2007, 76, 104102. [Google Scholar] [CrossRef]
  14. Davis, M.; Damjanovic, D.; Setter, N. Electric-field-, temperature-, and stress-induced phase transitions in relaxor ferroelectric single crystals. Phys. Rev. B 2006, 73, 014115. [Google Scholar] [CrossRef]
  15. Davis, M. Picturing the elephant: Giant piezoelectric activity and the monoclinic phases of relaxor-ferroelectric single crystals. J. Electroceramics 2007, 19, 25–47. [Google Scholar] [CrossRef]
  16. Li, F.; Zhang, S.; Xu, Z.; Wei, X.; Shrout, T.R. Critical Property in Relaxor-PbTiO3 Single Crystals-Shear Piezoelectric Response. Adv. Funct. Mater. 2011, 21, 2118–2128. [Google Scholar] [CrossRef]
  17. Liu, H.; Chen, J.; Fan, L.; Ren, Y.; Pan, Z.; Lalitha, K.V.; Rödel, J.; Xing, X. Critical Role of Monoclinic Polarization Rotation in High-Performance Perovskite Piezoelectric Materials. Phys. Rev. Lett. 2017, 119, 017601. [Google Scholar] [CrossRef]
  18. Hou, D.; Usher, T.-M.; Fulanovic, L.; Vrabelj, M.; Otonicar, M.; Ursic, H.; Malic, B.; Levin, I.; Jones, J.L. Field-induced polarization rotation and phase transitions in 0.70Pb(Mg1/3Nb2/3)O3−0.30PbTiO3 piezoceramics observed by in situ high-energy X-ray scattering. Phys. Rev. B 2018, 97, 214102. [Google Scholar] [CrossRef] [Green Version]
  19. Pirc, R.; Blinc, R.; Vikhnin, V.S. Effect of polar nanoregions on giant electrostriction and piezoelectricity in relaxor ferroelectrics. Phys. Rev. B 2004, 69, 212105. [Google Scholar] [CrossRef] [Green Version]
  20. Xu, G.; Wen, J.; Stock, C.; Gehring, P.M. Phase instability induced by polar nanoregions in a relaxor ferroelectric system. Nat. Mater. 2008, 7, 562–566. [Google Scholar] [CrossRef] [PubMed] [Green Version]
  21. Fu, D.; Taniguchi, H.; Itoh, M.; Koshihara, S.-Y.; Yamamoto, N.; Mori, S. Relaxor Pb(Mg1/3Nb2/3)O3: A Ferroelectric with Multiple Inhomogeneities. Phys. Rev. Lett. 2009, 103, 207601. [Google Scholar] [CrossRef] [Green Version]
  22. Li, F.; Zhang, S.; Yang, T.; Xu, Z.; Zhang, N.; Liu, G.; Wang, J.; Wang, J.; Cheng, Z.; Ye, Z.-G.; et al. The origin of ultrahigh piezoelectricity in relaxor-ferroelectric solid solution crystals. Nat. Commun. 2016, 7, 13807. [Google Scholar] [CrossRef] [PubMed]
  23. Manley, M.E.; Abernathy, D.L.; Sahul, R.; Parshall, D.E.; Lynn, J.W.; Christianson, A.D.; Stonaha, P.J.; Specht, E.D.; Budai, J.D. Giant electromechanical coupling of relaxor ferroelectrics controlled by polar nanoregion vibrations. Sci. Adv. 2016, 2, e1501814. [Google Scholar] [CrossRef] [PubMed] [Green Version]
  24. Li, F.; Zhang, S.; Xu, Z.; Chen, L.-Q. The Contributions of Polar Nanoregions to the Dielectric and Piezoelectric Responses in Domain-Engineered Relaxor-PbTiO3 Crystals. Adv. Funct. Mater. 2017, 27, 1700310. [Google Scholar] [CrossRef]
  25. Aoyagi, S.; Aoyagi, A.; Osawa, H.; Sugimoto, K.; Nakahira, Y.; Moriyoshi, C.; Kuroiwa, Y.; Iwata, M. Rotational intersite displacement of disordered lead atoms in a relaxor ferroelectric during piezoelectric lattice straining and ferroelectric domain switching. Phys. Rev. B 2020, 101, 064104. [Google Scholar] [CrossRef]
  26. Welberry, T.R.; Goosens, D.J.; Gutmann, M.J. Chemical origin of nanoscale polar domains in PbZn1/3Nb2/3O3. Phys. Rev. B 2006, 74, 224108. [Google Scholar] [CrossRef]
  27. Eremenko, M.; Krayzman, V.; Bosak, A.; Playford, H.Y.; Chapman, K.W.; Woicik, J.C.; Ravel, B.; Levin, I. Local atomic order and hierarchical polar nanoregions in a classical relaxor ferroelectric. Nat. Commun. 2019, 10, 1–9. [Google Scholar] [CrossRef] [Green Version]
  28. Cabral, M.J.; Zhang, S.; Dickey, E.C.; LeBeau, J.M. Direct observation of local chemistry and local cation displacements in the relaxor ferroelectric PMN-PT. Microsc. Microanal. 2016, 22, 1402–1403. [Google Scholar] [CrossRef] [Green Version]
  29. Otoničar, M.; Bradeško, A.; Fulanović, L.; Kos, T.; Uršič, H.; Benčan, A.; Cabral, M.J.; Henriques, A.; Jones, J.L.; Riemer, L.; et al. Connecting the Multiscale Structure with Macroscopic Response of Relaxor Ferroelectrics. Adv. Funct. Mater. 2020, 30, 2006823. [Google Scholar] [CrossRef]
  30. Dolabella, S.; Frison, R.; Chahine, G.A.; Richter, C.; Schulli, T.U.; Tasdemir, Z.; Alaca, B.E.; Leblebici, Y.; Dommanna, A.; Neels, A. Real-and Q-space travelling: Multi-dimensional distribution maps of crystal-lattice strain (ϵ044) and tilt of suspended monolithic silicon nanowire structures. J. Appl. Crystallogr. 2020, 53, 58–68. [Google Scholar] [CrossRef] [Green Version]
  31. Cao, Y.; Assefa, T.; Banerjee, S.; Wieteska, A.R.; Wang, D.Z.-R.; Pasupathy, A.N.; Tong, X.; Liu, Y.; Lu, W.; Sun, Y.; et al. Complete Strain Mapping of Nanosheets of Tantalum Disulfide. ACS Appl. Mater. Interfaces 2020, 12, 43173–43179. [Google Scholar] [CrossRef]
  32. Koreeda, A.; Taniguchi, H.; Saikan, S.; Itoh, M. Fractal Dynamics in a Single Crystal of a Relaxor Ferroelectric. Phys. Rev. Lett. 2012, 109, 197601. [Google Scholar] [CrossRef] [PubMed]
  33. Tsukada, S.; Ohwada, K.; Ohwa, H.; Mori, S.; Kojima, S.; Yasuda, N.; Terauchi, H.; Akishige, Y. Relation between Fractal Inhomogeneity and In/Nb-Arrangement in Pb(In1/2Nb1/2)O3. Sci. Rep. 2017, 7, 17508. [Google Scholar] [CrossRef] [Green Version]
  34. Sugimoto, K.; Ohsumi, H.; Aoyagi, S.; Nishibori, E.; Moriyoshi, C.; Kuroiwa, Y.; Sawa, H.; Takata, M. Extremely High Resolution Single Crystal Diffractometory for Orbital Resolution using High Energy Synchrotron Radiation at SPring-8. AIP Conf. Proc. 2010, 1234, 887–890. [Google Scholar]
  35. Imai, Y.; Sumitani, K.; Kimura, S. Current status of nanobeam x-ray diffraction station at SPring-8. AIP Conf. Proc. 2019, 2054, 050004. [Google Scholar]
  36. Osawa, H.; Kudo, T.; Kimura, S. Development of high-repetition-rate X-ray chopper system for time-resolved measurements with synchrotron radiation. Jpn. J. Appl. Phys. 2017, 56, 48001. [Google Scholar] [CrossRef] [Green Version]
Figure 1. Schematic layouts of (a) time-resolved XRD for average structure under AC field and (b) time-resolved nanobeam XRD for local structure under AC field.
Crystals 11 01419 g001
Figure 2. Time (Δt) dependences of (a) Qr and (b) Qv one-dimensional profiles of the 006 Bragg peak through the intensity maxima in the time-resolved XRD for average structure under AC field. Profiles before, during, and after polarization switching are colored in red, green, and blue, respectively.
Crystals 11 01419 g002
Figure 3. Time (Δt) dependences of (a) voltage (red) and current (blue) between two electrodes on the crystal surfaces, and (b) FWHM along Qr (wr) (square) and Qv at the intensity maximum (circle) of the 006 Bragg peak in the time-resolved XRD for average structure under AC field. Red and blue dashed lines indicate times when the voltage becomes zero at Δt = 0 and the current becomes the maximum at Δt = 33 μs, respectively.
Crystals 11 01419 g003
Figure 4. Time (Δt) dependences of Qh and Qv one-dimensional profiles of the 002 Bragg peak through the intensity maxima at z = (a,b) 0.0, (c,d) 5.0, and (e,f) 10.0 μm in the time-resolved nanobeam XRD for local structure under AC field. Profiles before, during, and after polarization switching are colored in red, green, and blue, respectively.
Crystals 11 01419 g004
Figure 5. Time (Δt) dependences of (a) voltage (red) and current (blue) between two electrodes on the crystal surfaces, and (b) 〈 Q h 〉 and (c) 〈 Q v 〉 at local locations of z = 0.0, 5.0, and 10.0 μm in the time-resolved nanobeam XRD for local structure under AC field. Red and blue dashed lines indicate times when the voltage becomes zero at Δt = 0 and the current becomes the maximum at Δt = 24 μs, respectively.
Crystals 11 01419 g005
Figure 6. DC field dependences of Qh and Qv one-dimensional profiles of the 002 Bragg peak through the intensity maxima at z = (a,b) 0.0, (c,d) 5.0, and (e,f) 10.0 μm in the nanobeam XRD for local structure under DC field. Profiles before and after polarization switching are colored in red and blue, respectively.
Crystals 11 01419 g006
Figure 7. DC field (voltage) dependences of (a) 〈 Q h 〉 and (b) 〈 Q v 〉 at local locations of z = 0.0, 5.0, and 10.0 μm in the nanobeam XRD for local structure under DC field.
Crystals 11 01419 g007
Publisher’s Note: MDPI stays neutral with regard to jurisdictional claims in published maps and institutional affiliations.

