3.1. Chemical Analysis
The chemical composition of the glasses was measured first in order to have control of the concentration of oxide formers and modifiers and then on the melting process. The second objective was the identification of the possible volatilization of B
2O
3 due to the high melting temperature employed and its low thermal stability compared with the alkaline-earth oxides [
23] in these compositions. This oxide considerably improves the adherence of the sealing glass.
Table 1 shows the theoretical and analyzed compositions in mol%. and weight %.
No relevant changes have been detected in any of the analysed glasses. All the main components presented a minimum variation of the percentage, except for MgO, whose percentage diminishes in both glasses with losses of 6 and 14 wt% for the composition of Sr and Ba, respectively. These losses can be associated with volatilizations of this oxide at the melting temperature.
On the contrary, no volatilization of B2O3 was observed after the melting process, since both compositions showed practically the same analysed and theoretical values. There were several impurities in both compositions of alkaline and alkaline-earth oxides, which could have come from impurities in the raw materials and small contaminations during the melting process.
3.2. Sintering Behaviour
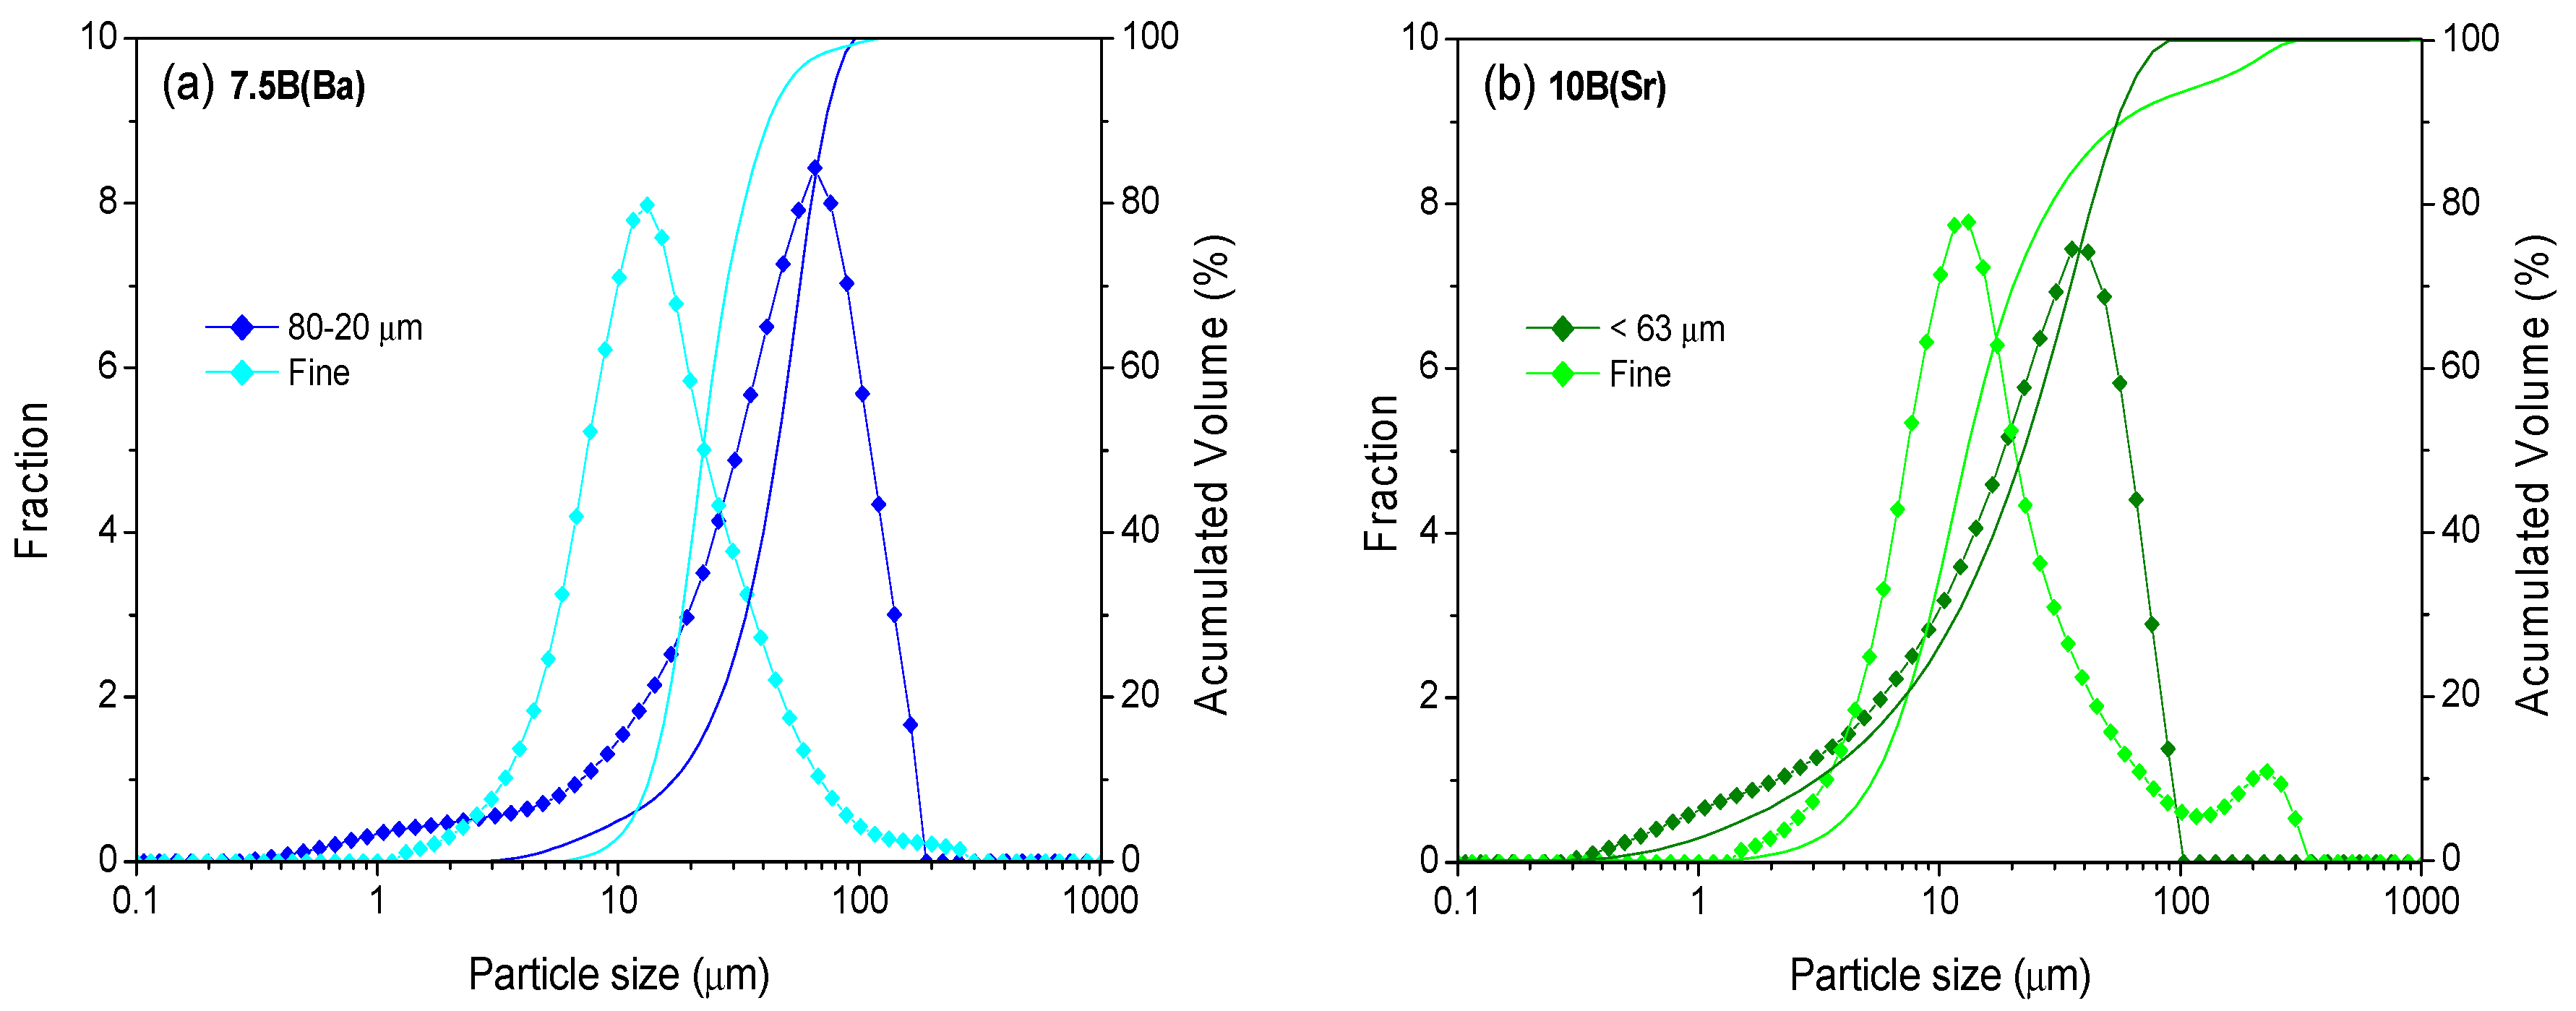
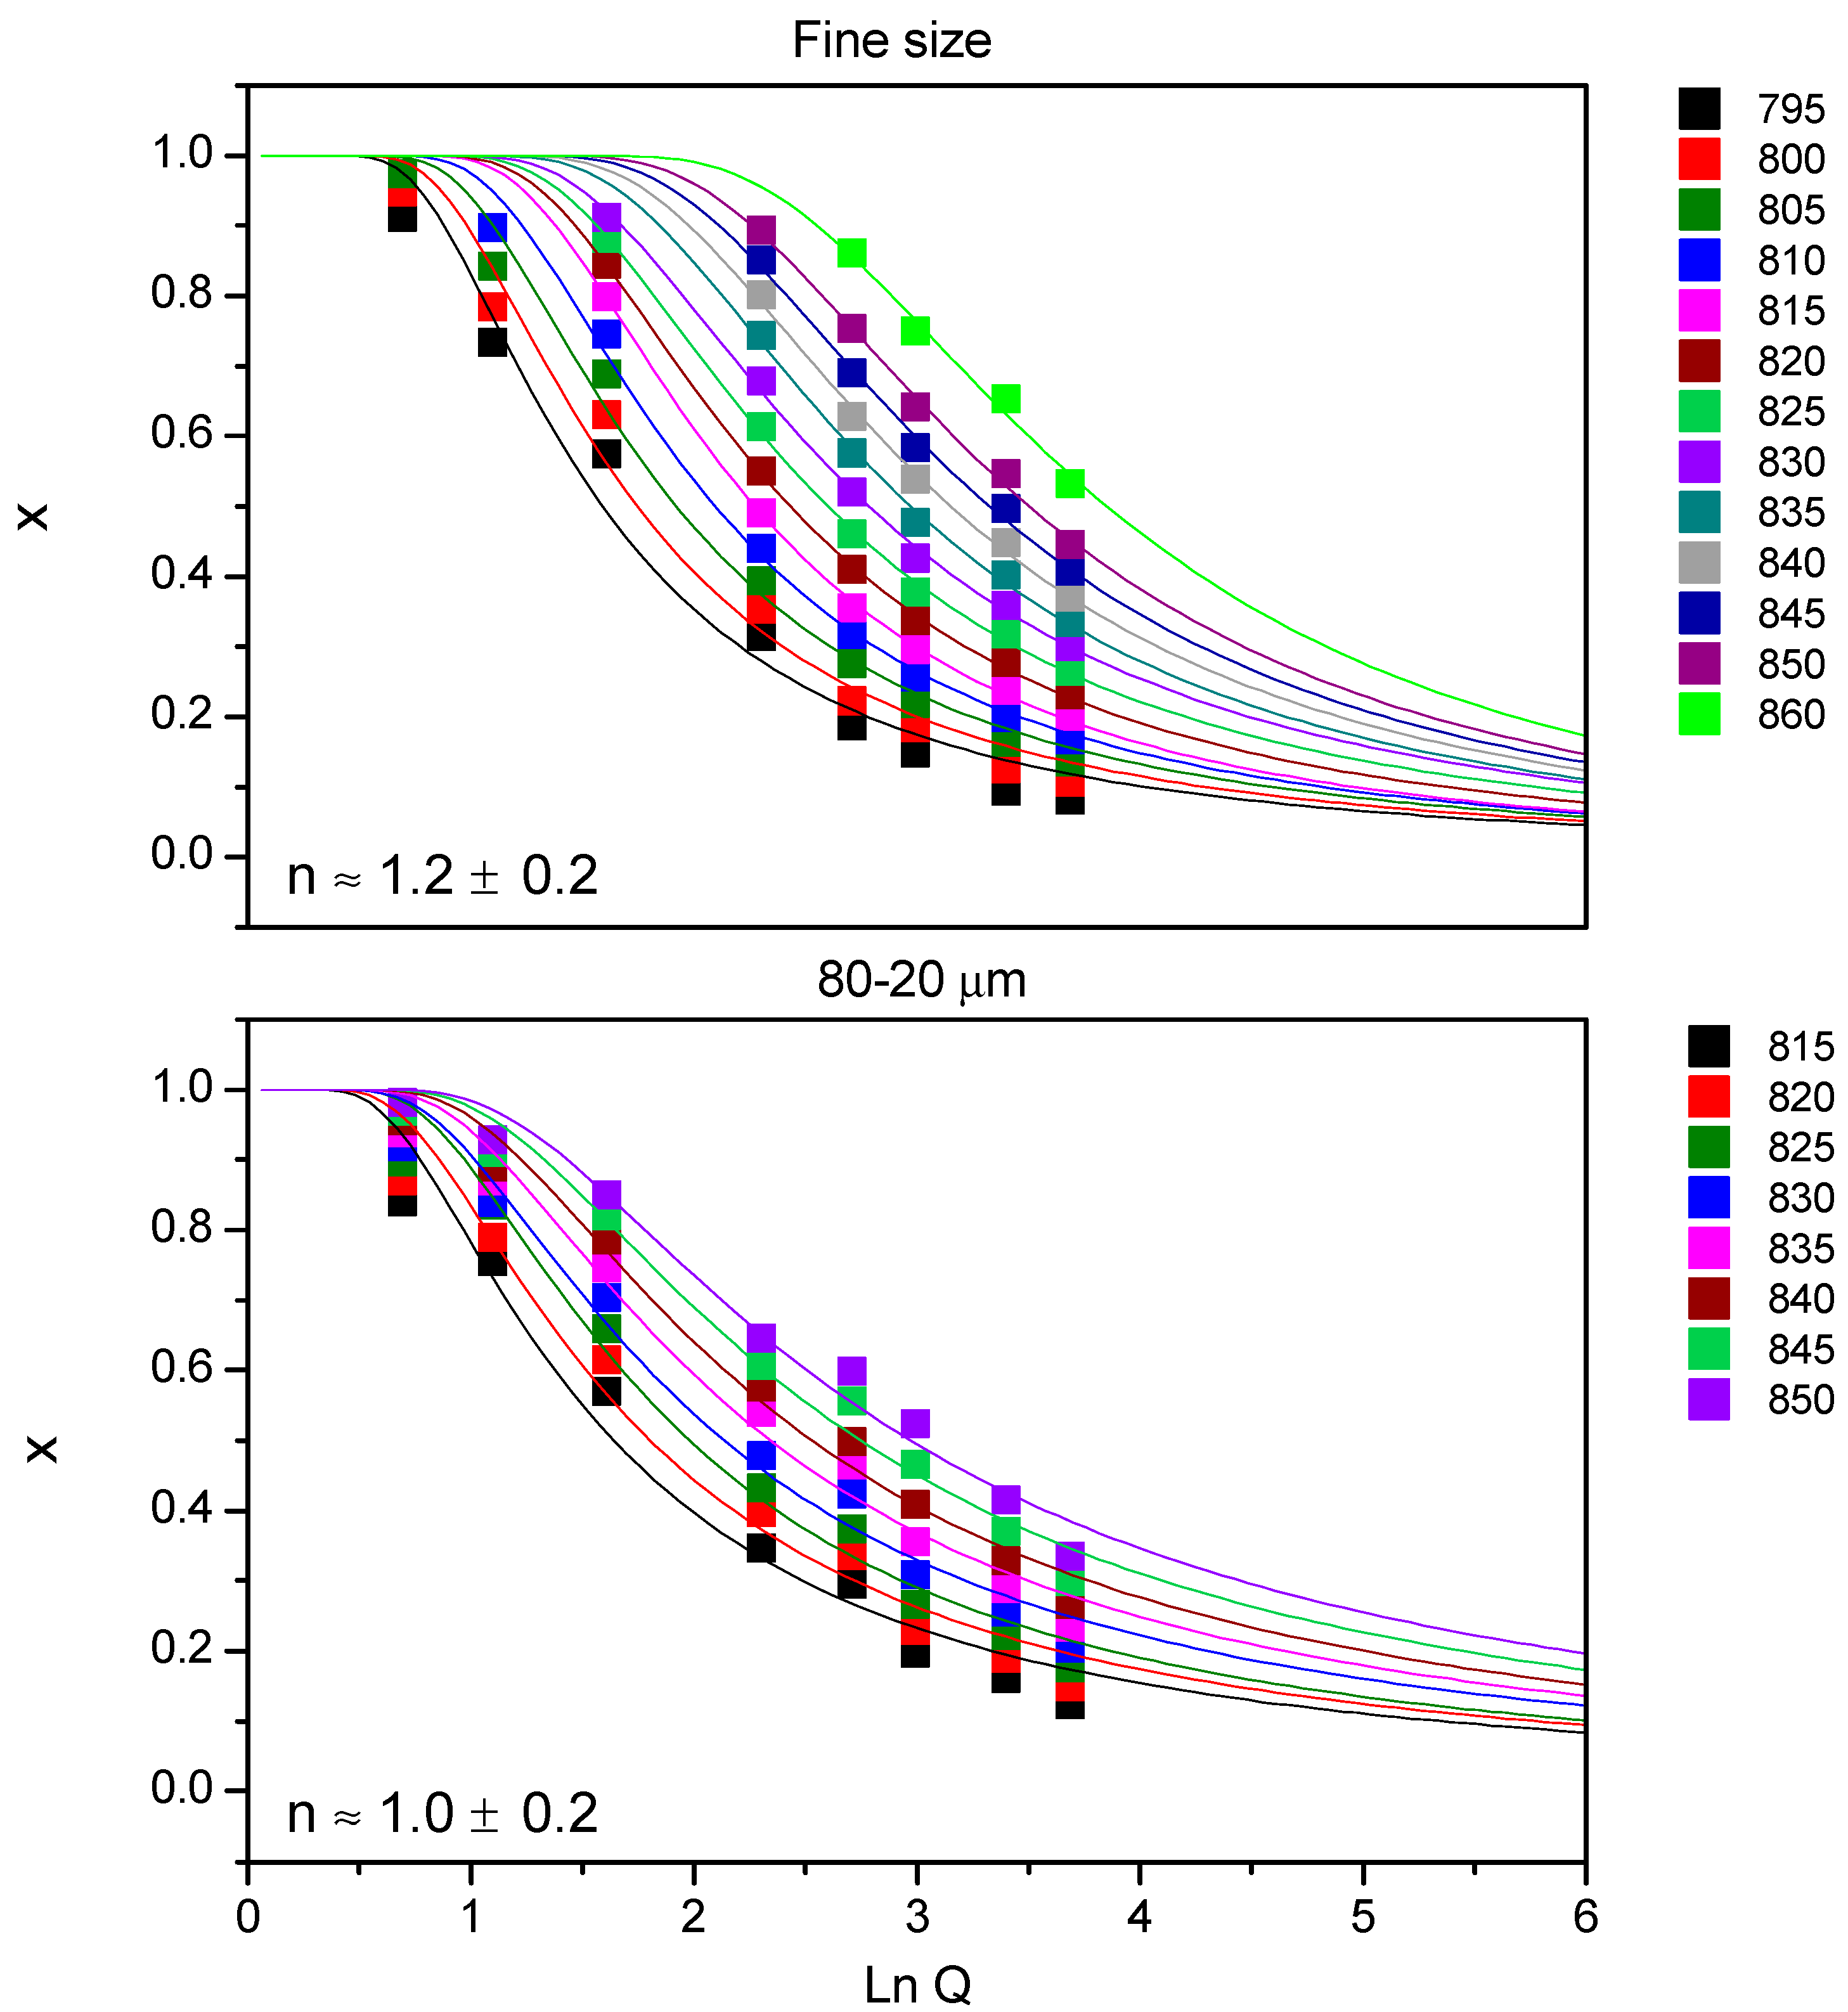
Initially, different particle sizes (<40 µm, <63 µm, <80 µm, 80–20 µm and 100–20 µm) were investigated in order to obtain the optimum densification of the glass-ceramics after thermal treatment. The highest densification for the glass powder pellets and bars was obtained with the particle size 80–20 µm for 7.5B(Ba) (treatments at 800 °C) and for 10B(Sr) with the size <63 µm (treatments at 750 °C). Relative densities between 0.99 and 0.98 and contraction in volume between 35 and 39% were obtained. These sizes together with that <40 µm with an average particle size of 13 µm, from now on designated as fine powder, were selected to study the sintering kinetics employing different heating rates using hot-stage microscopy (HSM). The size of this fine powder was optimized for the sealant application with a dispenser robot, tape casting or screen printing in an SOFC simulator. The selected particle size distributions are shown in
Figure 1 and with detailed values in
Table 2.
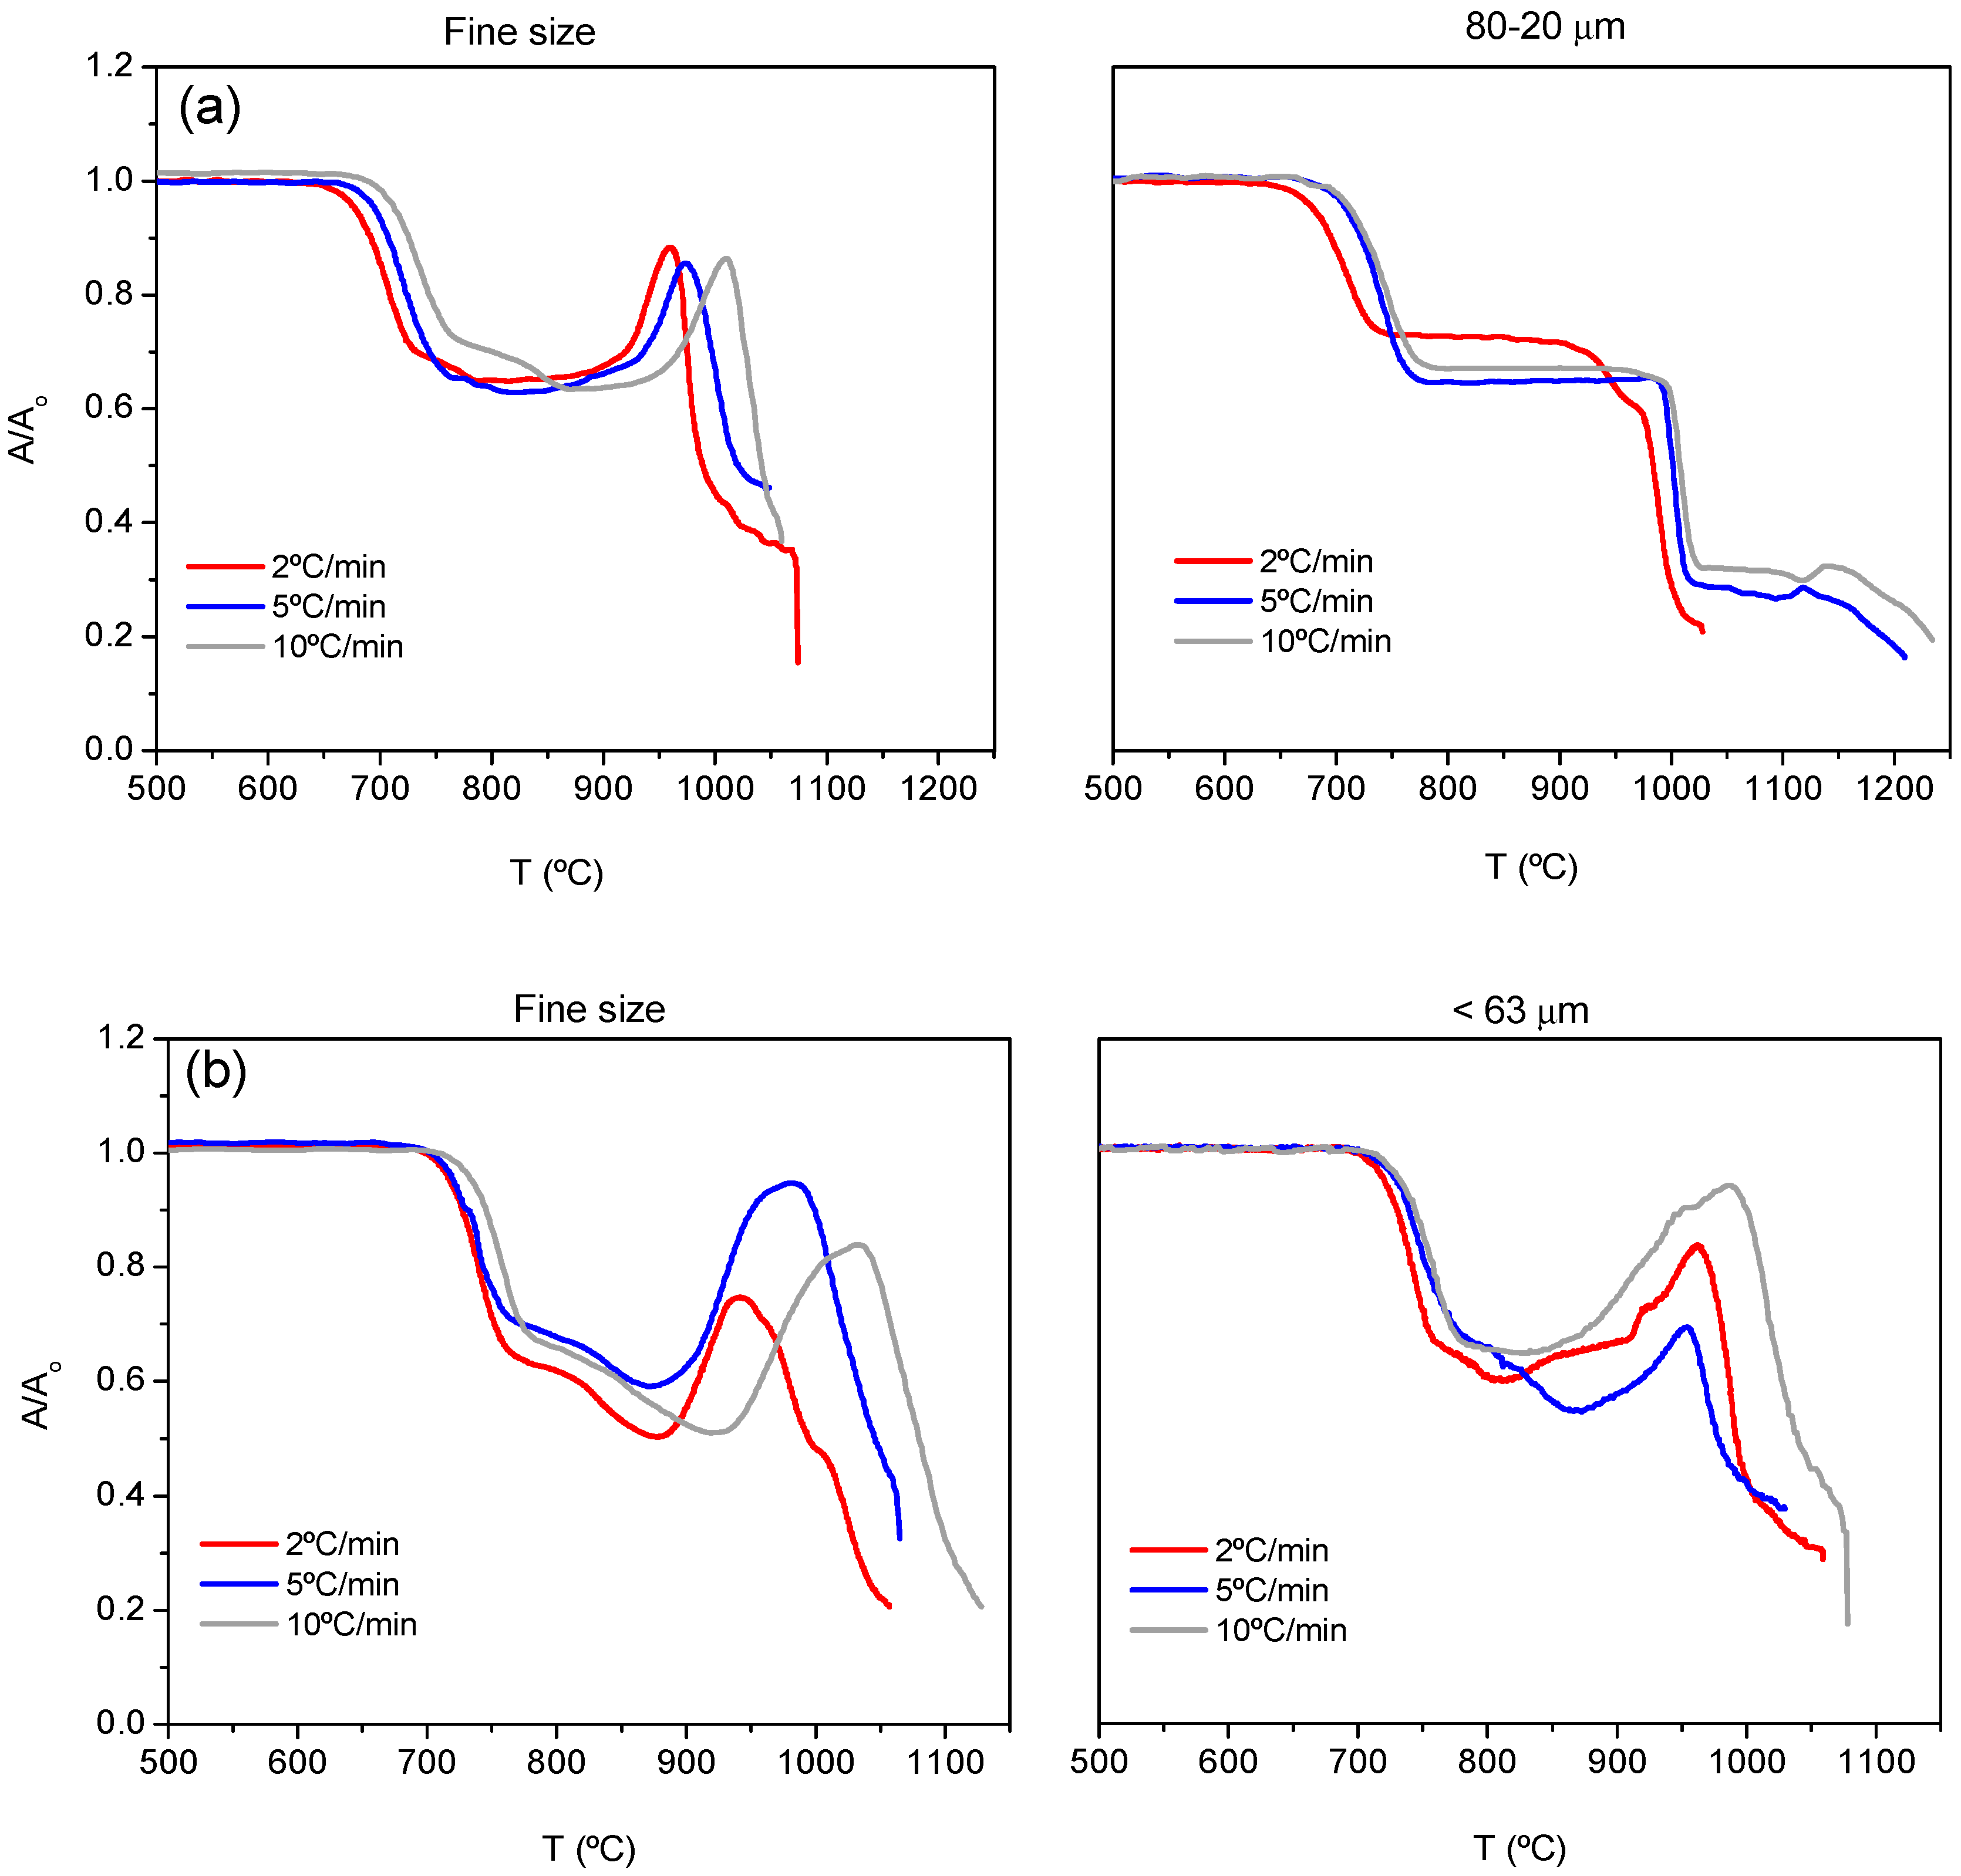
Three heating rates were used for the study by HSM (2, 5 and 10 °C/min). The rate for the start-up and sealing in an SOFC is normally slow since a high rate can produce temperature gradients provoking stresses in the materials and leading to cracks and curvatures with the consequent failure of the stack. The more relevant heating rate for a SOFC is then 2 °C/min.
Figure 2a,b shows the HSM curves (area variation A/A
0 as a function of temperature) for both compositions 7.5B(Ba) and 10B(Sr), respectively.
Table 3 summarizes the characteristic temperatures obtained from these experiments, which include first shrinkage (T
FS), maximum shrinkage (T
MS), softening temperature (T
S), half ball (T
HB) and flow (T
F) [
24].
In
Figure 2a,b, the increase in heating rate gives a delay in the beginning and end of sintering as well as the rest of the following processes: softening, half ball and flow. A greater particle size produces a similar effect. The values of these temperatures can be found in
Table 3. An expansion of the samples is observed in the high-temperature region due to a foaming phenomenon, which is more remarkable with the smaller particle size. This foaming is due to the elimination of gases such as CO
2 as described in [
10]. It is not observed for a particle size of 80–20 μm. This phenomenon makes the determination of the softening as well as half-ball temperatures difficult.
The best densification was obtained for a heating rate of 5 °C/min for both fine powder and 80–20 μm but when pellets are prepared and treated at 800 °C for different times, the greater size leads to better relative density around 0.98, and in this way, this particle size was used for preparing bulk glass-ceramics pellets and bars for dilatometry and viscosity measurements.
In the case of 10B(Sr), both particle sizes provide good densification. The best results were obtained when pellets were prepared from the particle size <63 microns and treated at 750 °C for different times (heating rate 5 °C/min) so this size was used for pellets and bars preparation. The temperatures of 800 and 750 °C for 7.5B(Ba) and10B(Sr) were adjusted to avoid sample deformation.
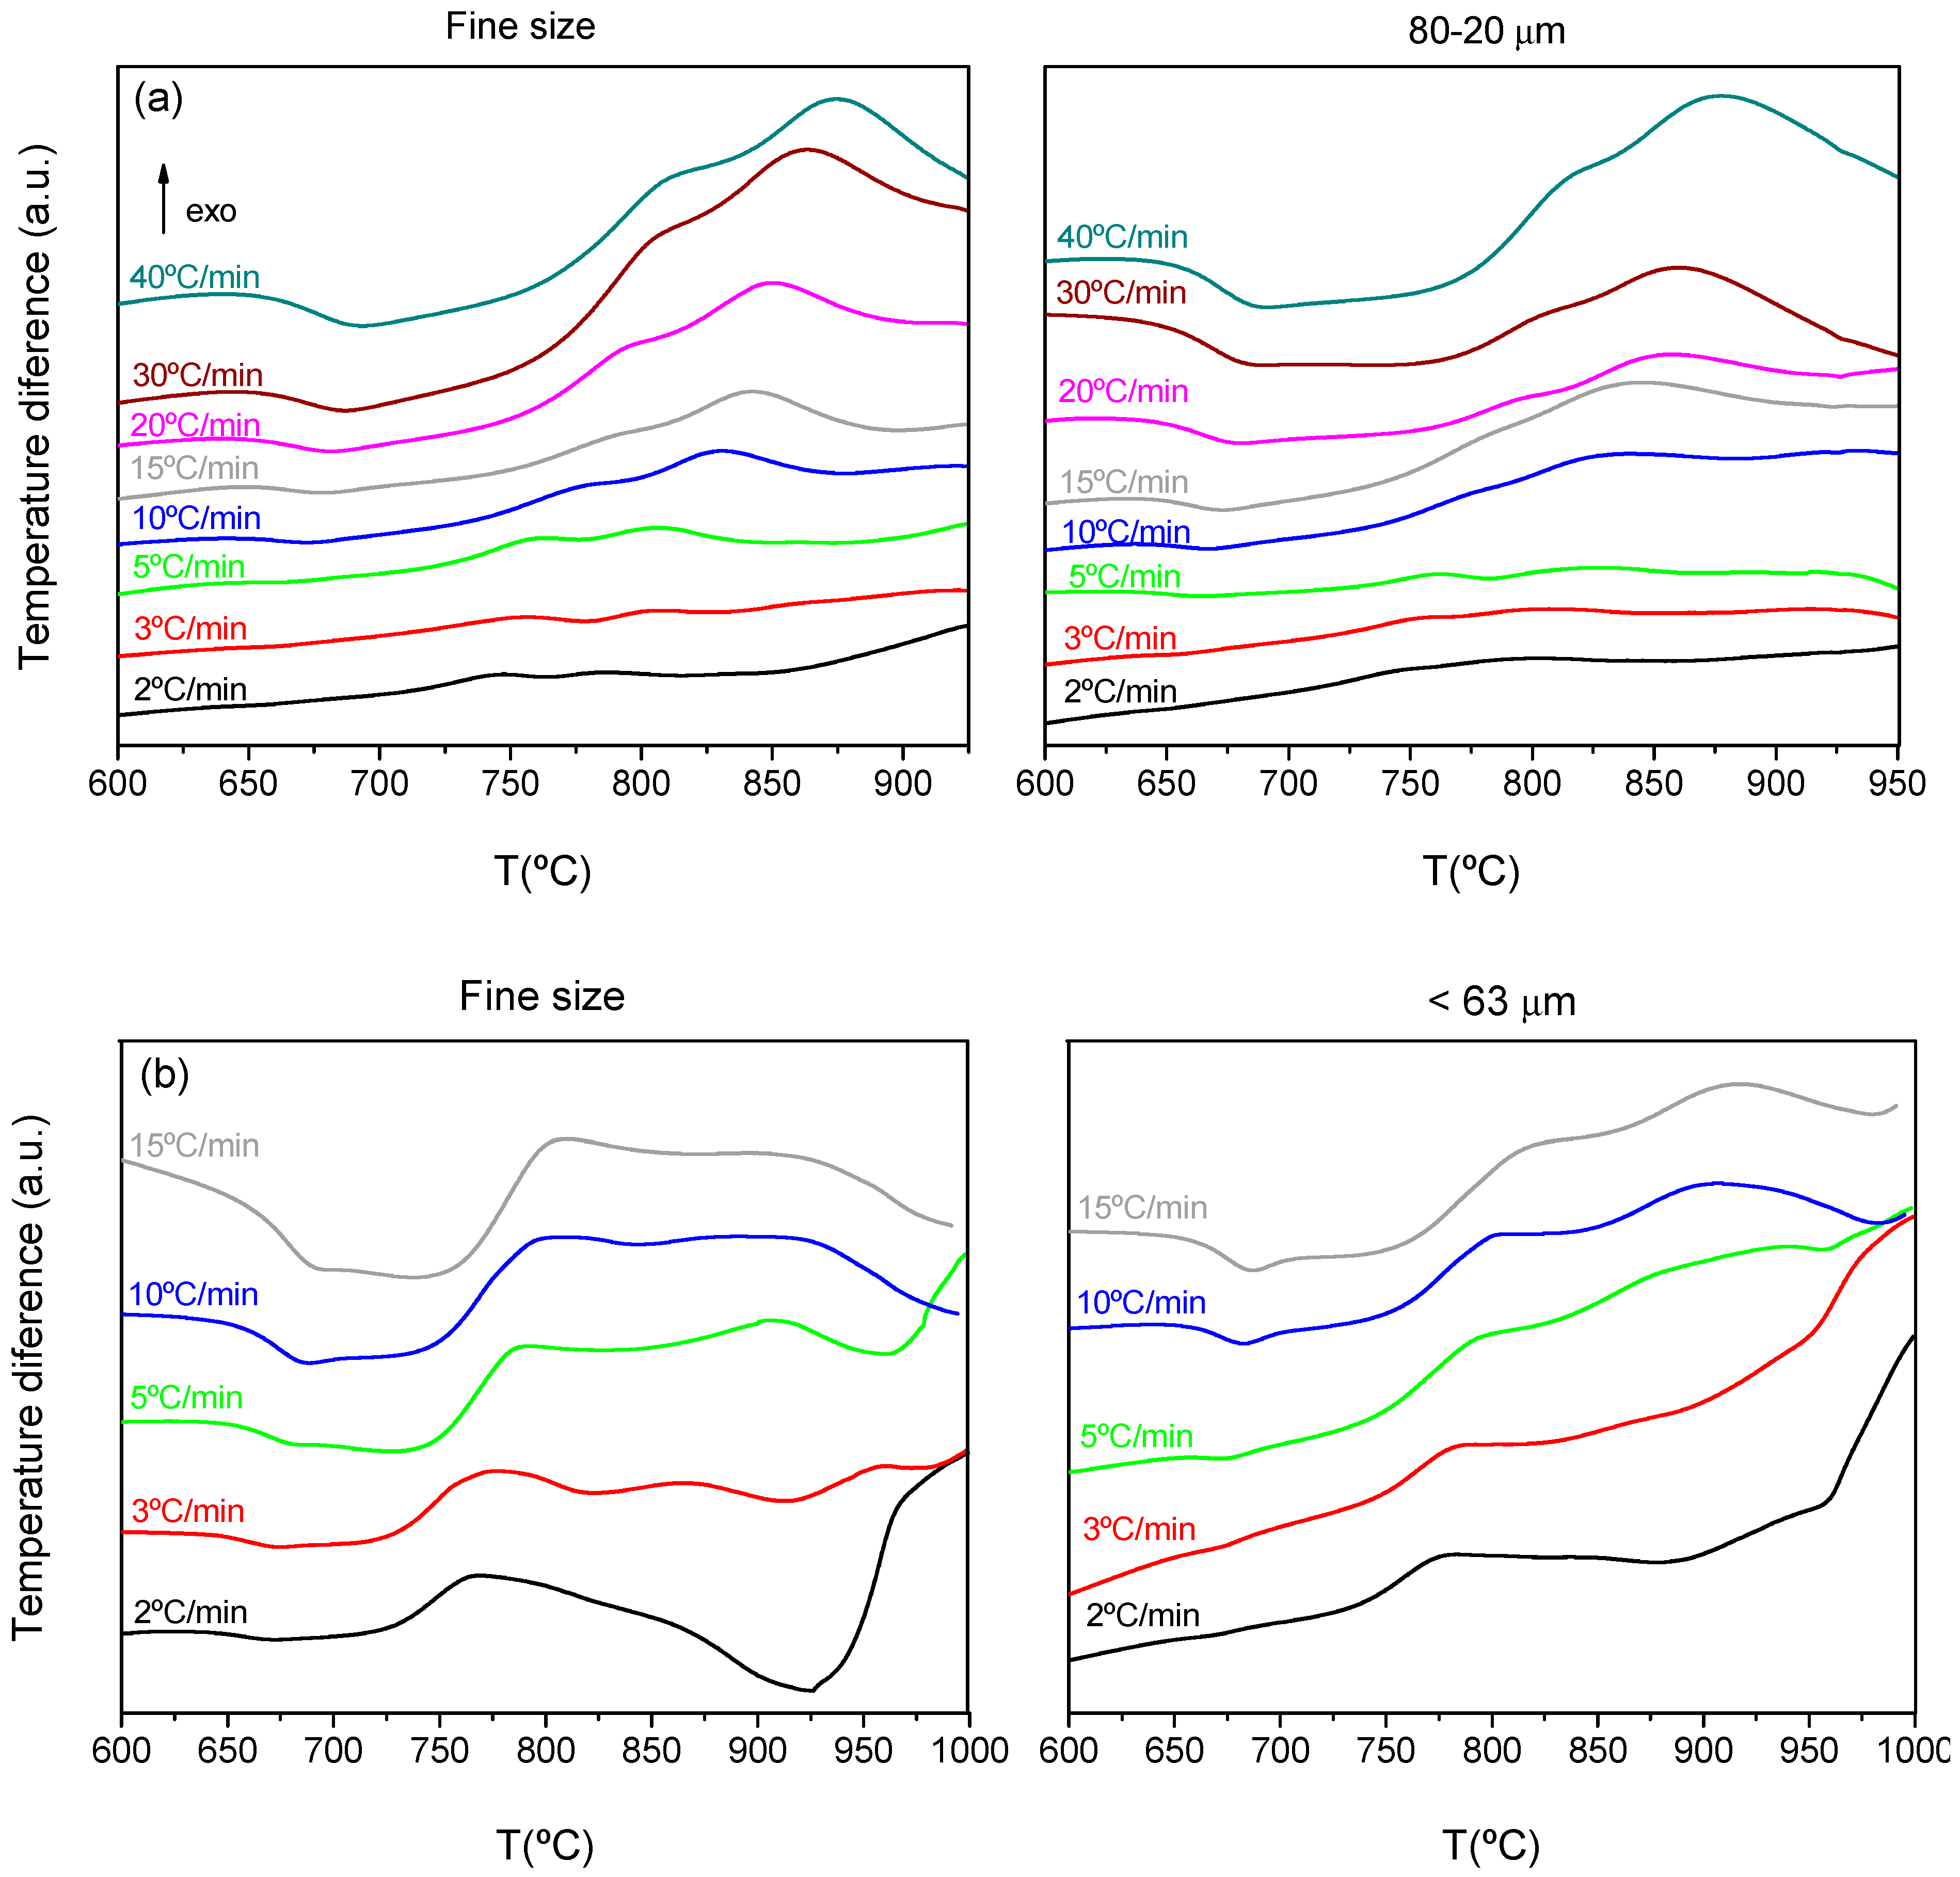
3.3. Influence of the Glass Powder Particle Size and the Heating Rate in the DTA Characteristic Temperatures: Crystallization Mechanism
Figure 3 shows the DTA scans at different heating rates and for the two selected particle sizes for each composition. As previously mentioned, the very fine powder is the one practically used for the sealing application, but other particle sizes 80–20 microns and <63 were those optimized to obtain glass-ceramic well-densified pieces [
14,
15].
The DTA curves provided the characteristic temperatures, which are represented in
Table 4. There is a wide peak of crystallization with two maxima, which indicate the presence of two crystallization peaks occurring at similar temperatures. For the calculation of each peak temperature, the signal was adjusted to two Gaussian peaks and the maximum of each gaussian was taken as the peak temperature, T
p1 and T
p2 in
Table 4. When increasing the heating rate, all the crystallization temperatures shifted to higher temperatures. The nucleation time decreased with higher heating rates, reducing the nuclei formation and further crystallization and leading to crystallization peaks appearing at higher temperatures [
25,
26].
The particle size had a similar effect on the temperatures, so when increasing the particle size, the crystallization peaks shifted to higher temperatures.
Another relevant value in
Table 4 is the parameter T
x − T
g; this difference indicates the glass stability versus crystallization. The largest this value, the higher the glass thermal resistance versus crystallization. This parameter is slightly higher for 10B(Sr), so this composition will crystallize slower than 7.5B(Ba).
In order to study the crystallization mechanism, the Avrami parameter (
n) was calculated. The calculation has been done in two ways, firstly employing Ozawa equation [
17] and then the Avramov equation [
18,
19] to confirm the obtained results.
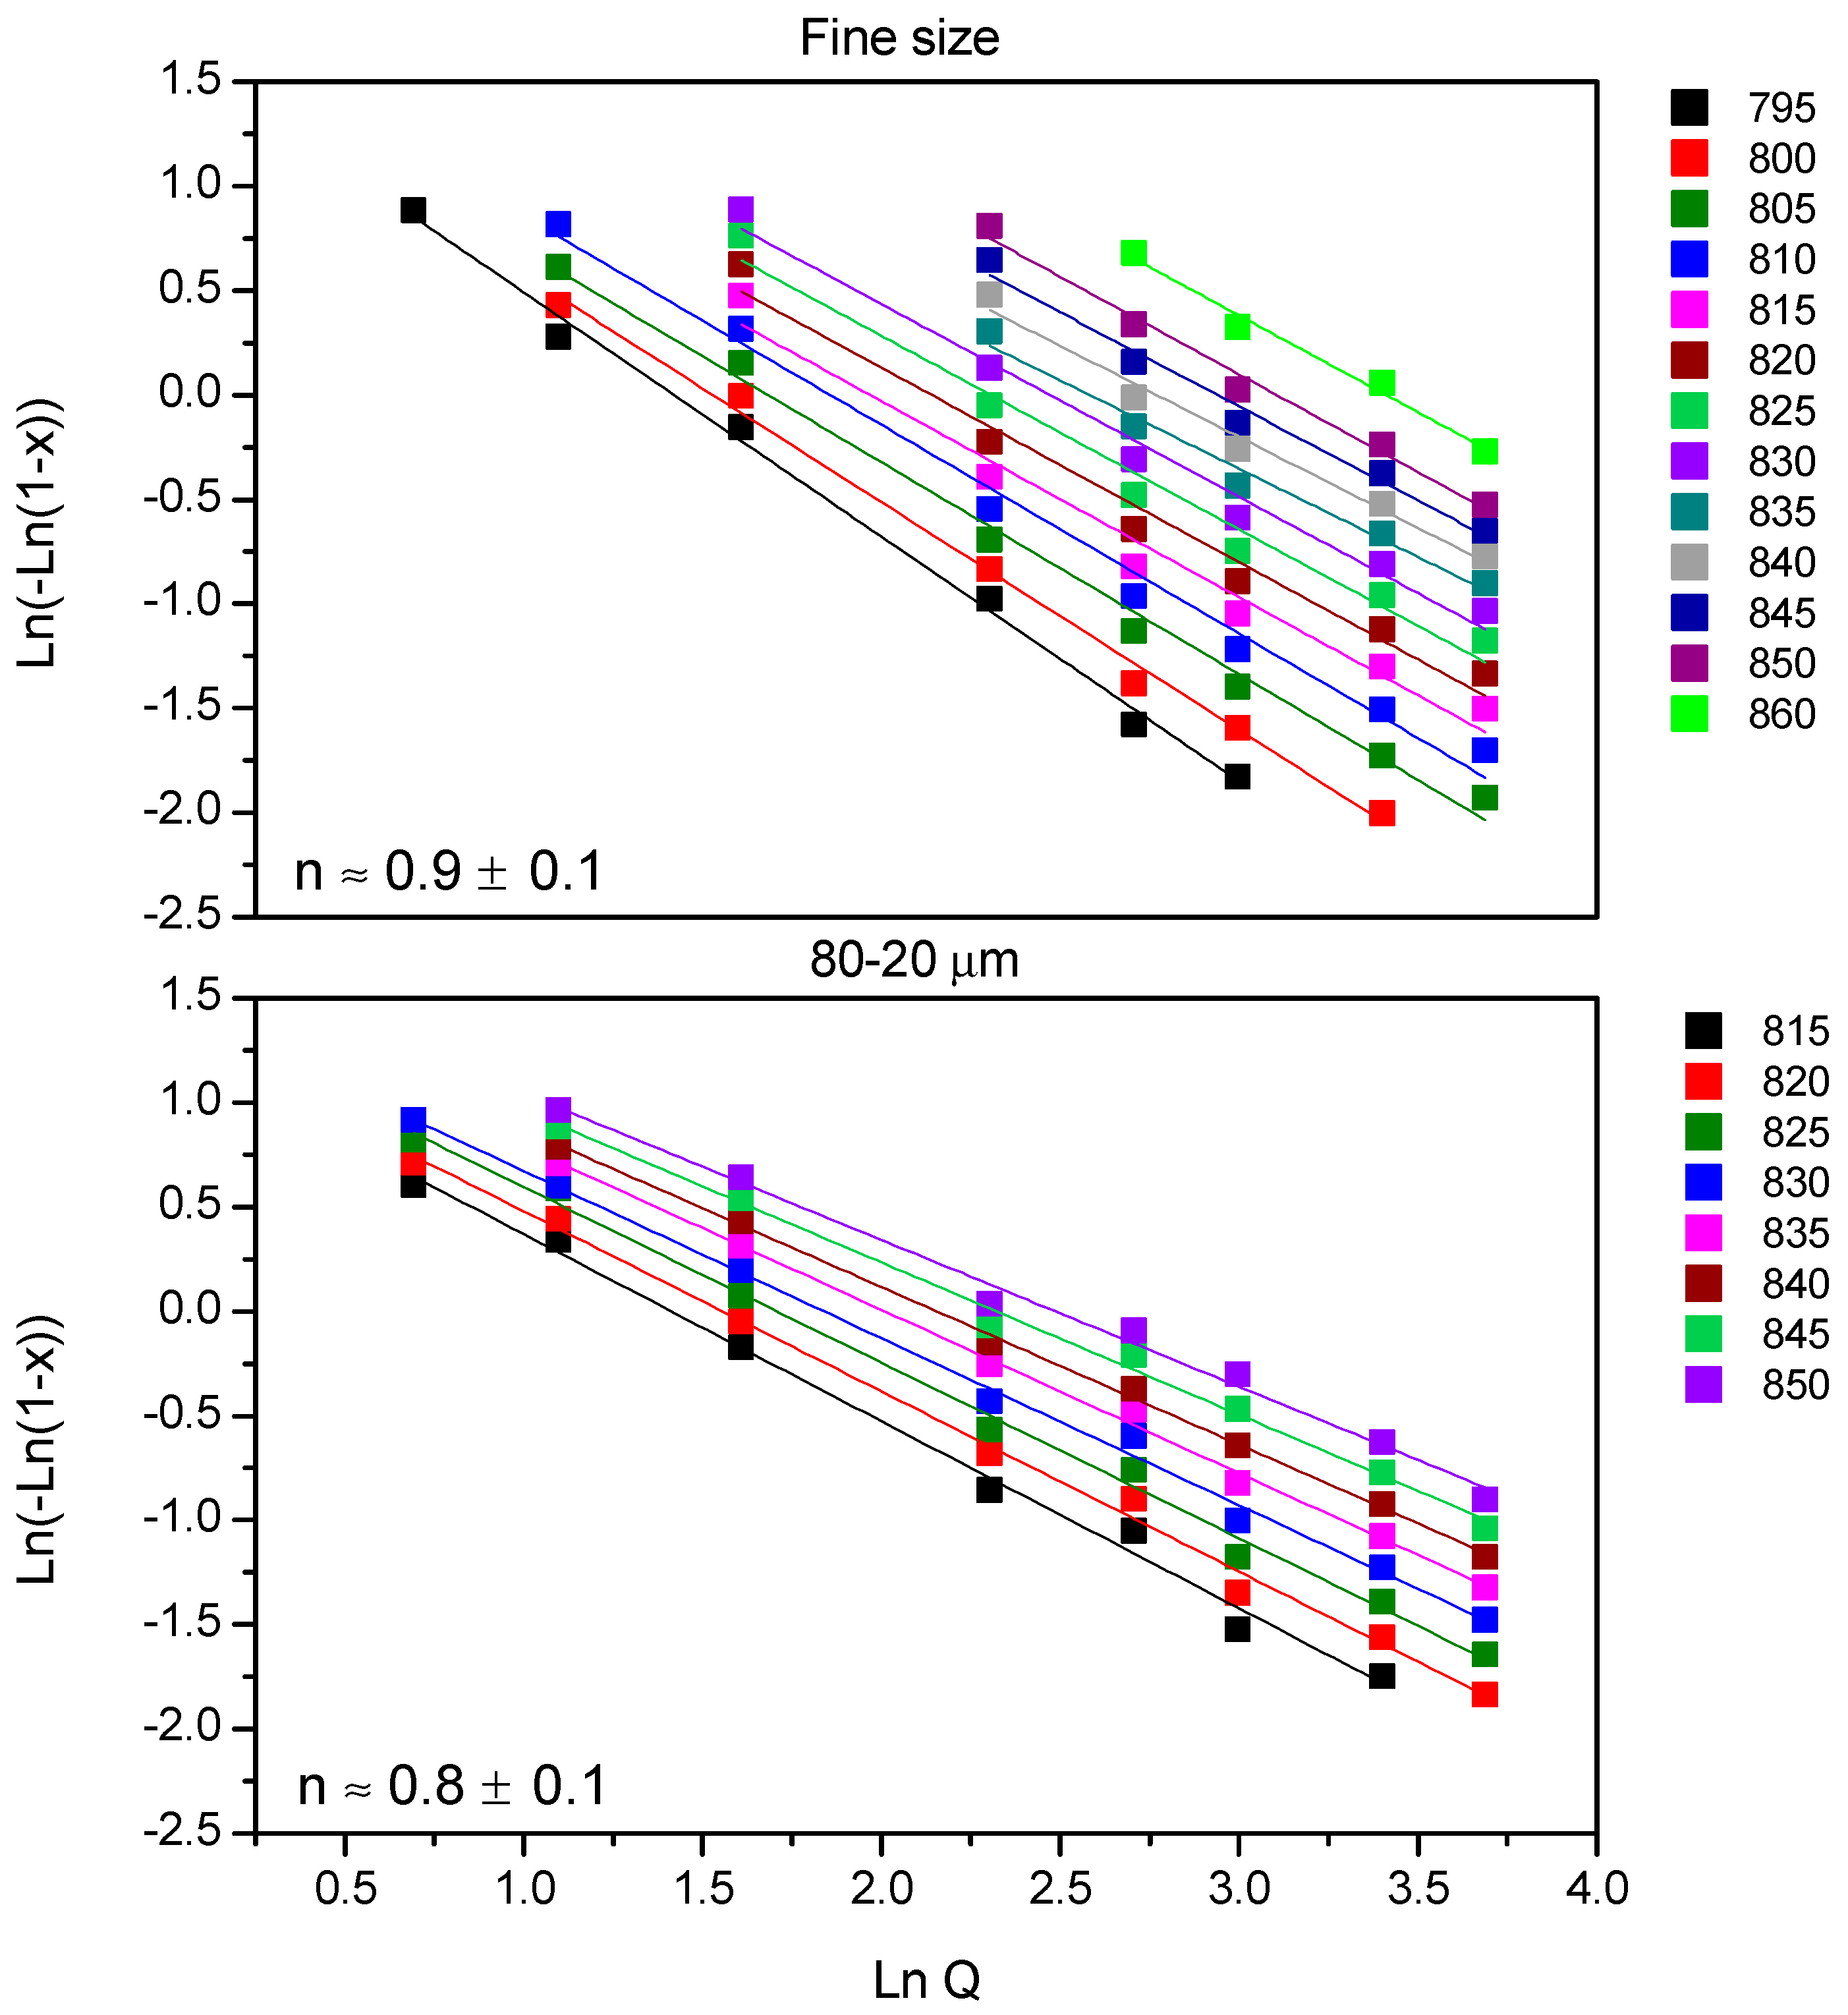
Figure 4 shows Ozawa plots for 7.5B(Ba) glass, and all the fits showed a regression (r
2) equal to 0.97 or higher. Together with the fitted lines, the medium value of
n is given with its deviation, so for both studied sizes
n is ~1. No variation of the
n parameter with temperature was observed.
Figure 5 shows the results using the Avramov equation for 7.5B(Ba) glass; all the fits gave a regression coefficient (r
2) equal to 0.96 or higher. The medium value
n is indicated inside the graphs together with its deviation, 1.2 ± 0.2 for the fine powder and 1.0 ± 0.2 for the size 80–20 µm, so for both studied sized
n ~ 1. Again, no variation of this parameter with temperature was observed.
The two employed methods for the calculation of n parameter are similar, although slightly superior values were obtained from the Avramov method, both can be approached to n ~ 1 in composition 7.5B(Ba).
The same procedure was employed for 10B(Sr) composition. The Ozawa plots (figure not shown) for the fine powder and for <63 μm provided fits with a regression coefficient (r2) equal to 0.97 or higher. The medium n value was 0.8 ± 0.1 for the fine size and 0.9 ± 0.1 for the size <63 µm, so for both studied sizes, n is ~ 1. Similar to the previous composition, there was no variation of the n parameter with temperature.
The results obtained by the Avramov method for the glass 10B(Sr) (figure not shown) provided fits with a regression coefficient (r2) of 0.96 or higher. The average value of n together with its deviation was 1.2 ± 0.1 for the fine size and 1.3 ± 0.1 for <63 µm, so for both sizes, n ~ 1 and similarly, no variation of n with temperature was observed.
Again, the two employed methods for the calculation of n parameter lead to similar results although also slightly higher for the Avrami method. All n values for this composition are close to 1.
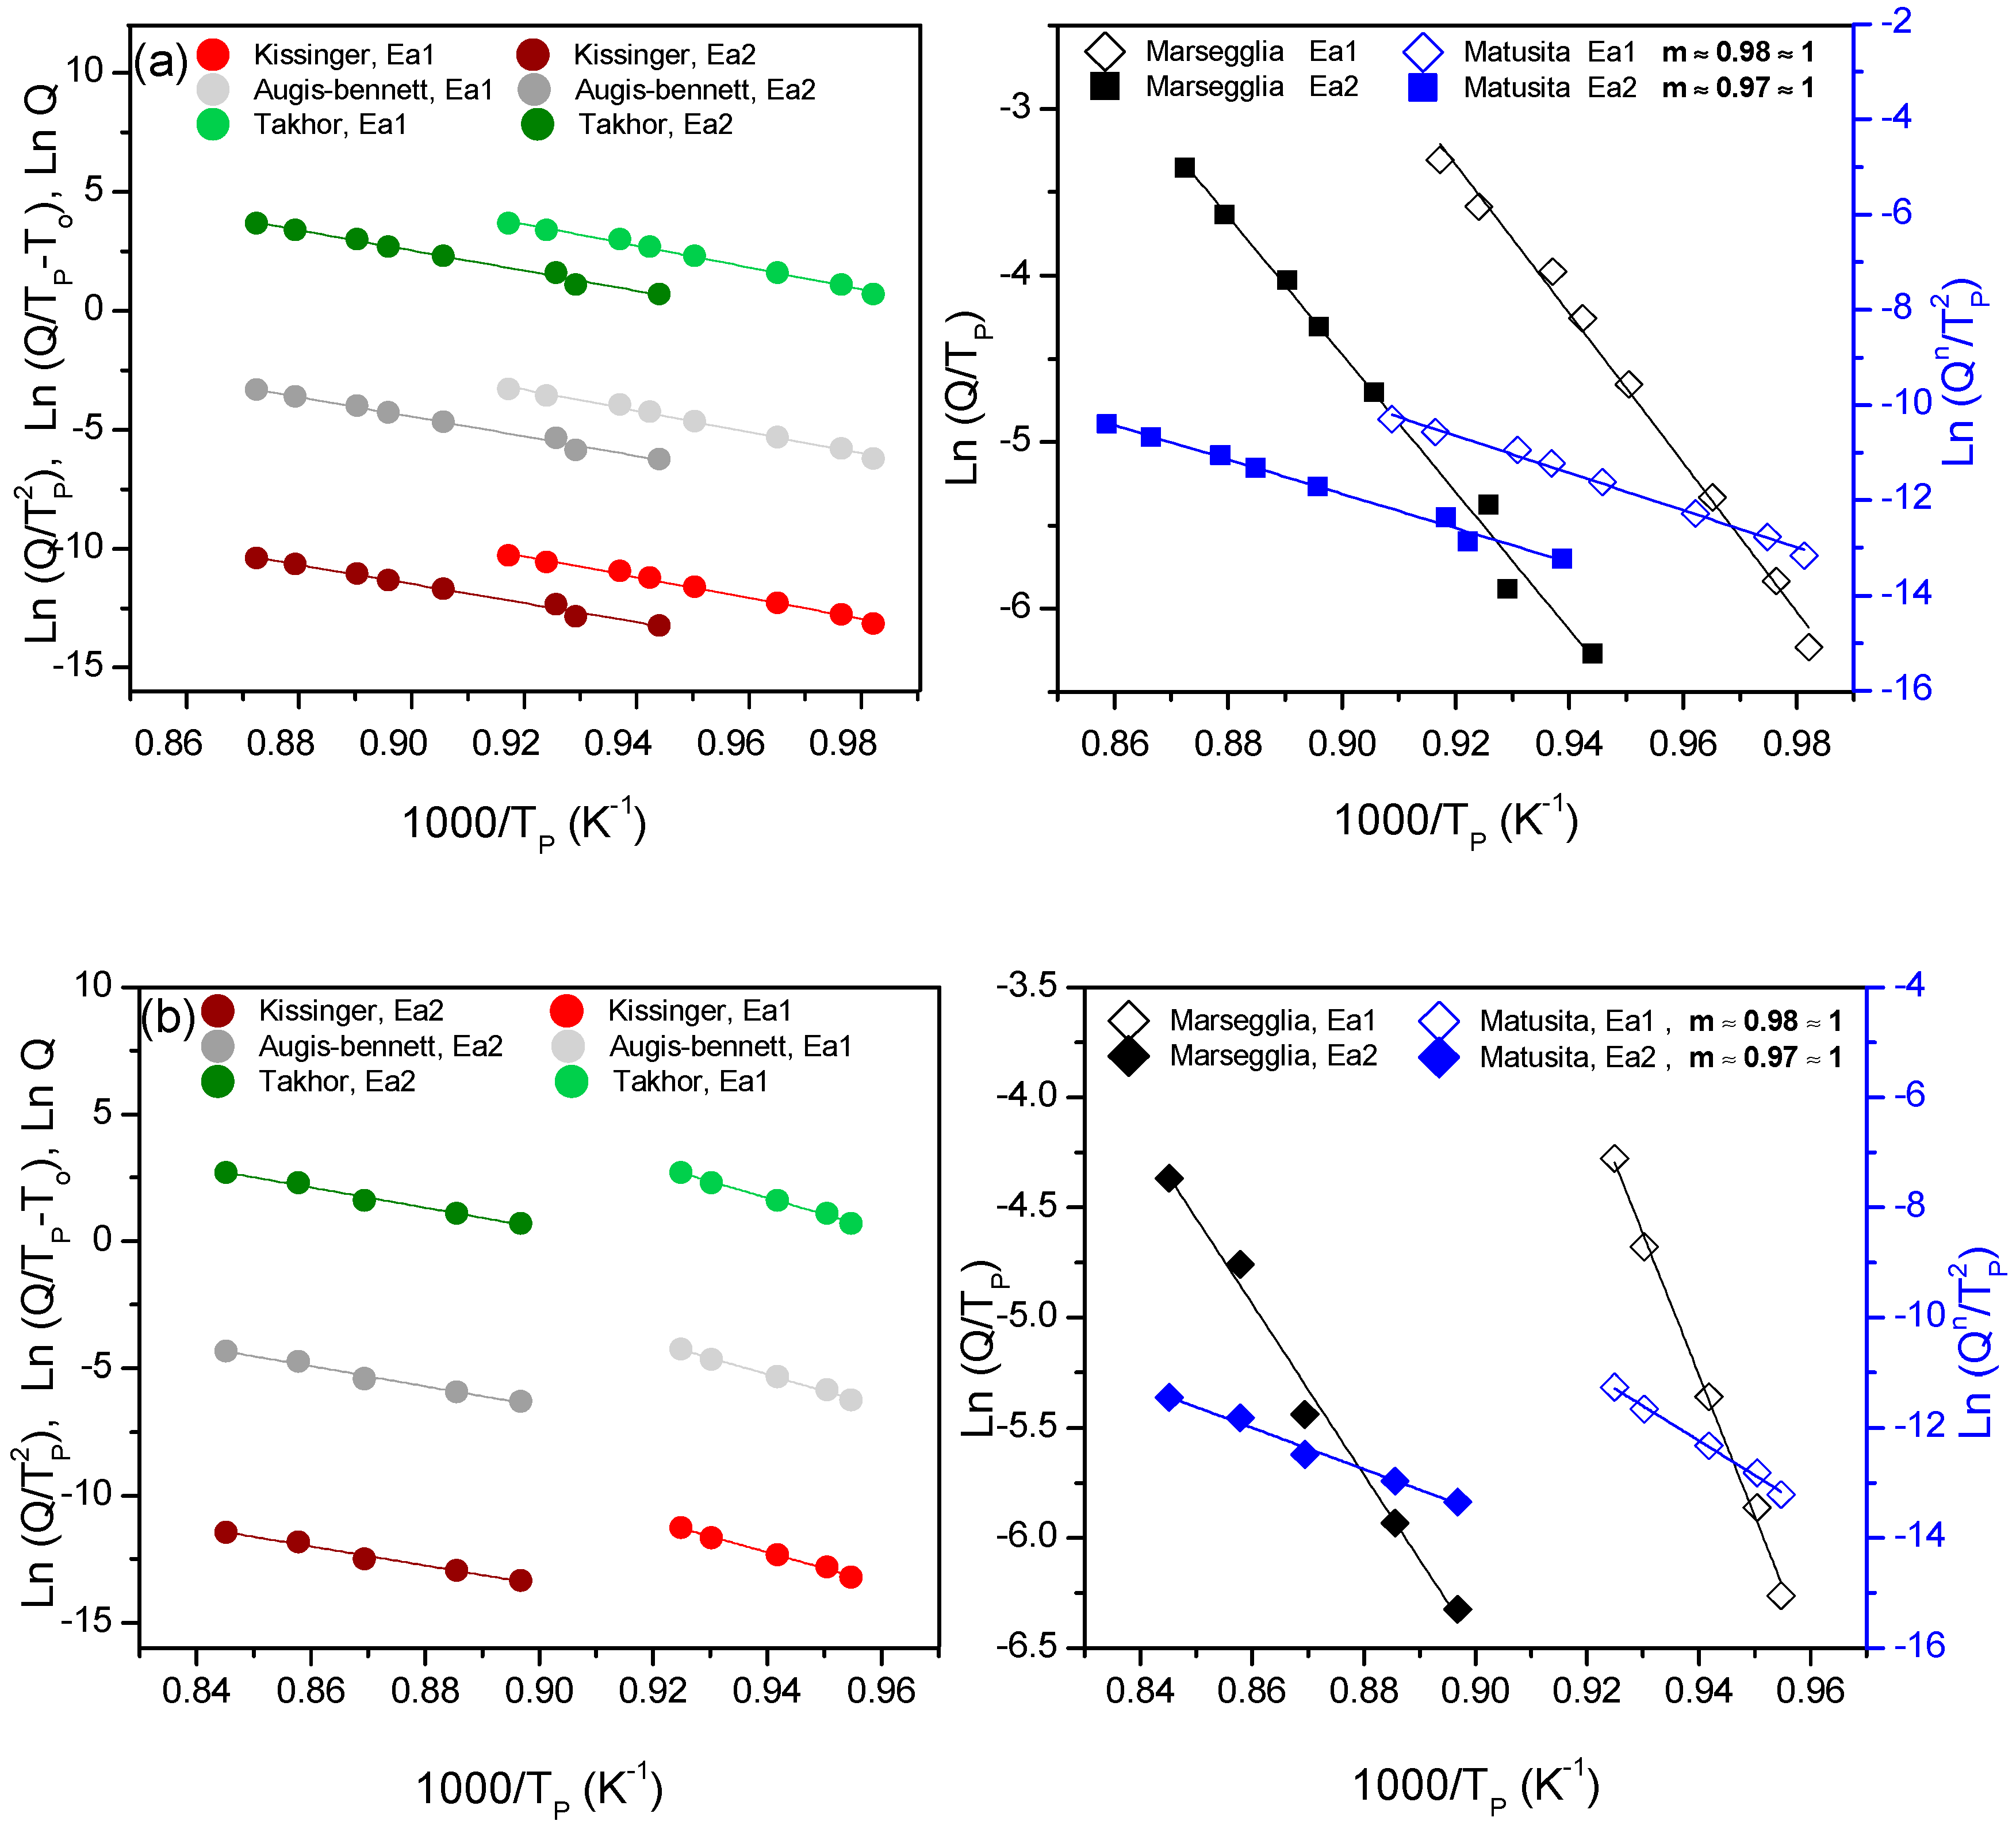
Once the n value was determined, the calculation of the activation energy has been carried out for the two crystallization peaks, taking into account two hypotheses:
- (1)
n = m, for which the KTAB equations have been employed.
- (2)
n ≠ m, for which the Marseglia and Matusita equations have been employed, the m value has been obtained from this last equation.
The results of both hypotheses were applied for the two particle sizes for both compositions, and results are only shown for the fine size (
Figure 6a,b). The values obtained for the activation energy from the fits of these equations are summarized in
Table 5 and
Table 6.
For both compositions, the
m value is approximately 1 for all the studied sizes, so
n ~
m ~ 1. Once the
n and
m values were obtained, and taking into account that
n value does not change with temperature, the crystallization mechanism can be determined from Donald´s work [
27], concluding that the studied glass powders have a preferential superficial crystallization mechanism.
The KTAB equations are valid in this case, since
n ~
m ~ 1. The obtained values for 7.5B(Ba) do not show a large dependence of the activation energy with the particle size, although the size 80–20 µm shows slightly higher values in the second crystallization peak and practically equal for the first peak. Both peaks present similar activation energies for the two particle sizes; this is because they are very close in temperature. The barium glass (55(Ba)) (without boron) presents activation energies of 464 KJ/mol [
28] about 100 KJ/mol more than the energy calculated for the 7.5B(Ba) composition, so the addition of B
2O
3 significantly reduces the crystallization activation energy.
Similarly, KTAB equations are valid for 10B(Sr) glass, since n ~ m ~ 1. The obtained values show a larger dependence of the activation energy with the particle size for the first peak. Similar values in the activation energy of the second peak were obtained for both sizes. The activation energy difference between the two peaks is higher due to their larger difference in temperature.
The two studied compositions undergo a surface crystallization mechanism, and the activation energy of the barium compositions is similar in both peaks and around 350 KJ/mol, while the activation energy for the strontium one is between 540–440 KJ/mol for the first crystallization peak and around 300 KJ/mol for the second one. These data are in agreement with a lower tendency for crystallization of the strontium glass.
3.4. Thermal Expansion
The study of the crystallization kinetics revealed a crystallization rate higher for the fine sizes, but the final crystalline phases after long thermal treatments (from 24 to 1500 hours) are the same employing a different particle size. The study of the evolution of the crystalline phases with the thermal treatment showed a stabilization of the main phases after 100h in both compositions. All the details of crystalline phases present and final microstructures were previously reported in [
14,
15]. The predominant crystalline phases were BaSi
2O
5 (BS
2), BaMg
2Si
2O
7 (BM
2S
2), Ba
5Si
8O
21 (B
5S
8), Ba
2Si
3O
8 (B
2S
3) and Ba
3B
6Si
2O
16 (B
3B
6S
2) for composition 7.5B(Ba) and SrMgSi
2O
6 (SMS
2), SiO
2, SrSiO
3 (SS) and SrB
2Si
2O
8 (SB
2S
2) for composition 10B(Sr). The glass-ceramics microstructure investigated showed a low degree of crystallization for glass-ceramic 10B(Sr) with 24h of thermal treatment but much higher for 7.5B(Ba).
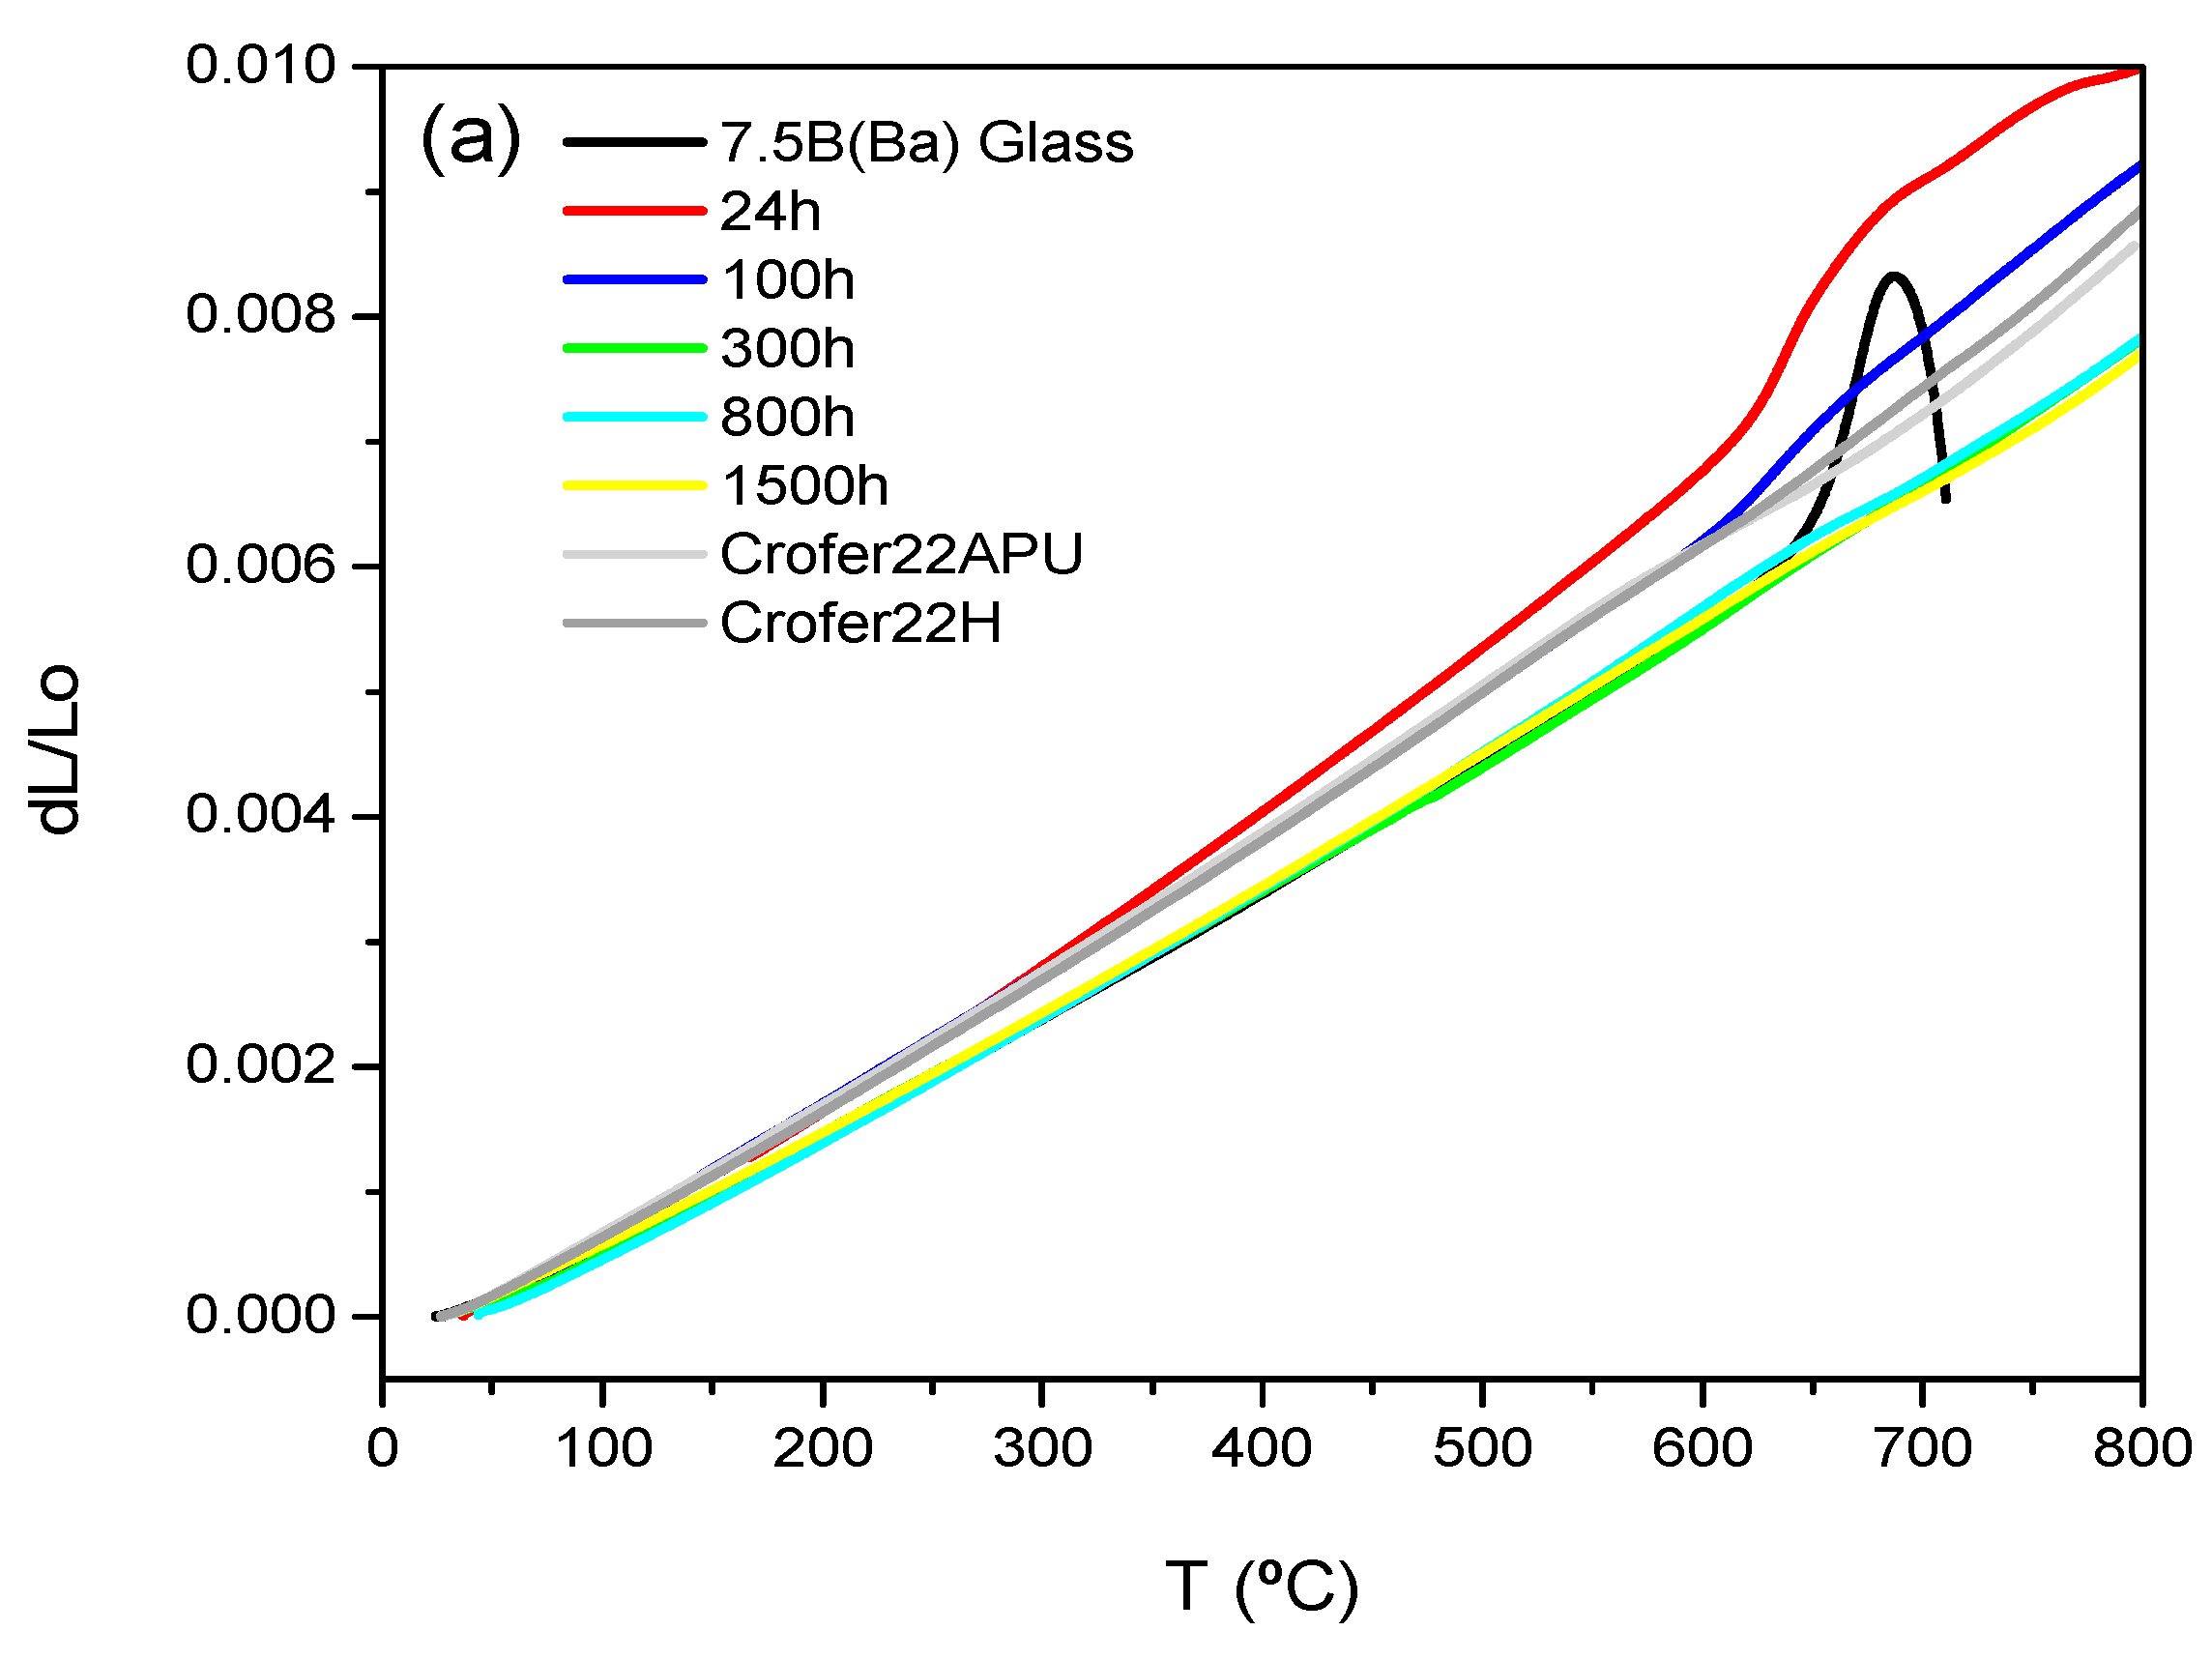
Figure 7a,b shows the dilatometric curves for 7.5B(Ba) and 10B(Sr) glass-ceramics as a function of the thermal treatment. The dilatometric values obtained are summarized in
Table 7 together with the values for the starting glasses and the TEC of the interconnect and electrolyte.
The TECs of 7.5B(Ba) and 10B(Sr) base glasses are 9.7∙10
−6 K
−1 and 9.2∙10
−6 K
−1, respectively, and both values fit well the 8YSZ TEC (10.5∙10
−6 K
−6) [
29] and are very close to those of Crofer22APU and Crofer22H (typical interconnect materials) with a value of 11.2∙10
−6 K
−1. The composition 7.5B(Ba) showed an increase of TEC after 24 h and 100 h of thermal treatment with values of 12.4 and 11·10
−6 K
−1, respectively. After 24 h, the main crystalline phase in the glass-ceramic is BaSi
2O
5 with a high TEC (12.9∙10
−6 K
−1 between 100–800 °C) [
30]. There is an increase in BaMg
2Si
2O
7 (TEC = 10.0∙10
−6 K
−1 between 100–600 °C) [
31] from increasing the treatment time, and new phases appear, albeit in a lower amount, such as Ba
5Si
8O
21 (TEC = 14.5∙10
−6 K
−1 between 100–800 °C) and Ba
2Si
3O
8 (TEC = 13.2∙10
−6 K
−1 between 100–800 °C) [
31]. Despite the fact that the same crystalline phases were formed after 100 h exposure, their ratio still changed, as did the TEC. The decrease in TEC after 100 and 300 h is attributed to a greater presence BaMg
2Si
2O
7 phase
. After 300 h of thermal treatment, the TEC remained constant up to 1500 h, so the boron phase Ba
3B
6Si
2O
16 precipitating at 800 h seems not to affect TEC, since it is in less proportion in comparison to the other phases. The glass-ceramics softening after 24 and 100 h of thermal treatment occurring at high temperature in
Figure 7a is due to the presence of residual glassy phase.
The 10B(Sr) glass-ceramics behave differently because thermal expansion seems not to be so much affected by crystallization; the TEC value keeps practically constant from the glass to the glass-ceramic with 1500 h of thermal treatment. As previously mentioned, the XRD characterization was published in [
14,
15]. The only thermal expansion data found in the literature correspond to the SrSiO
3 phase (TEC = 11.2∙10
−6 K
−1 between 100–800 °C) [
32]. In spite of the high TEC of the SrSiO
3 phase, the global value of the glass-ceramic is similar to that of the starting glass, so the rest of the phases could present TECs that do not differ much from that of the glass. The softening after 24 and 100 h of thermal treatment (
Figure 7b) is again attributed to the presence of the residual glass, which is especially relevant in the glass-ceramic of 24 h, also observed in the corresponding microstructure [
14].
3.5. Glass-Ceramics Viscosity
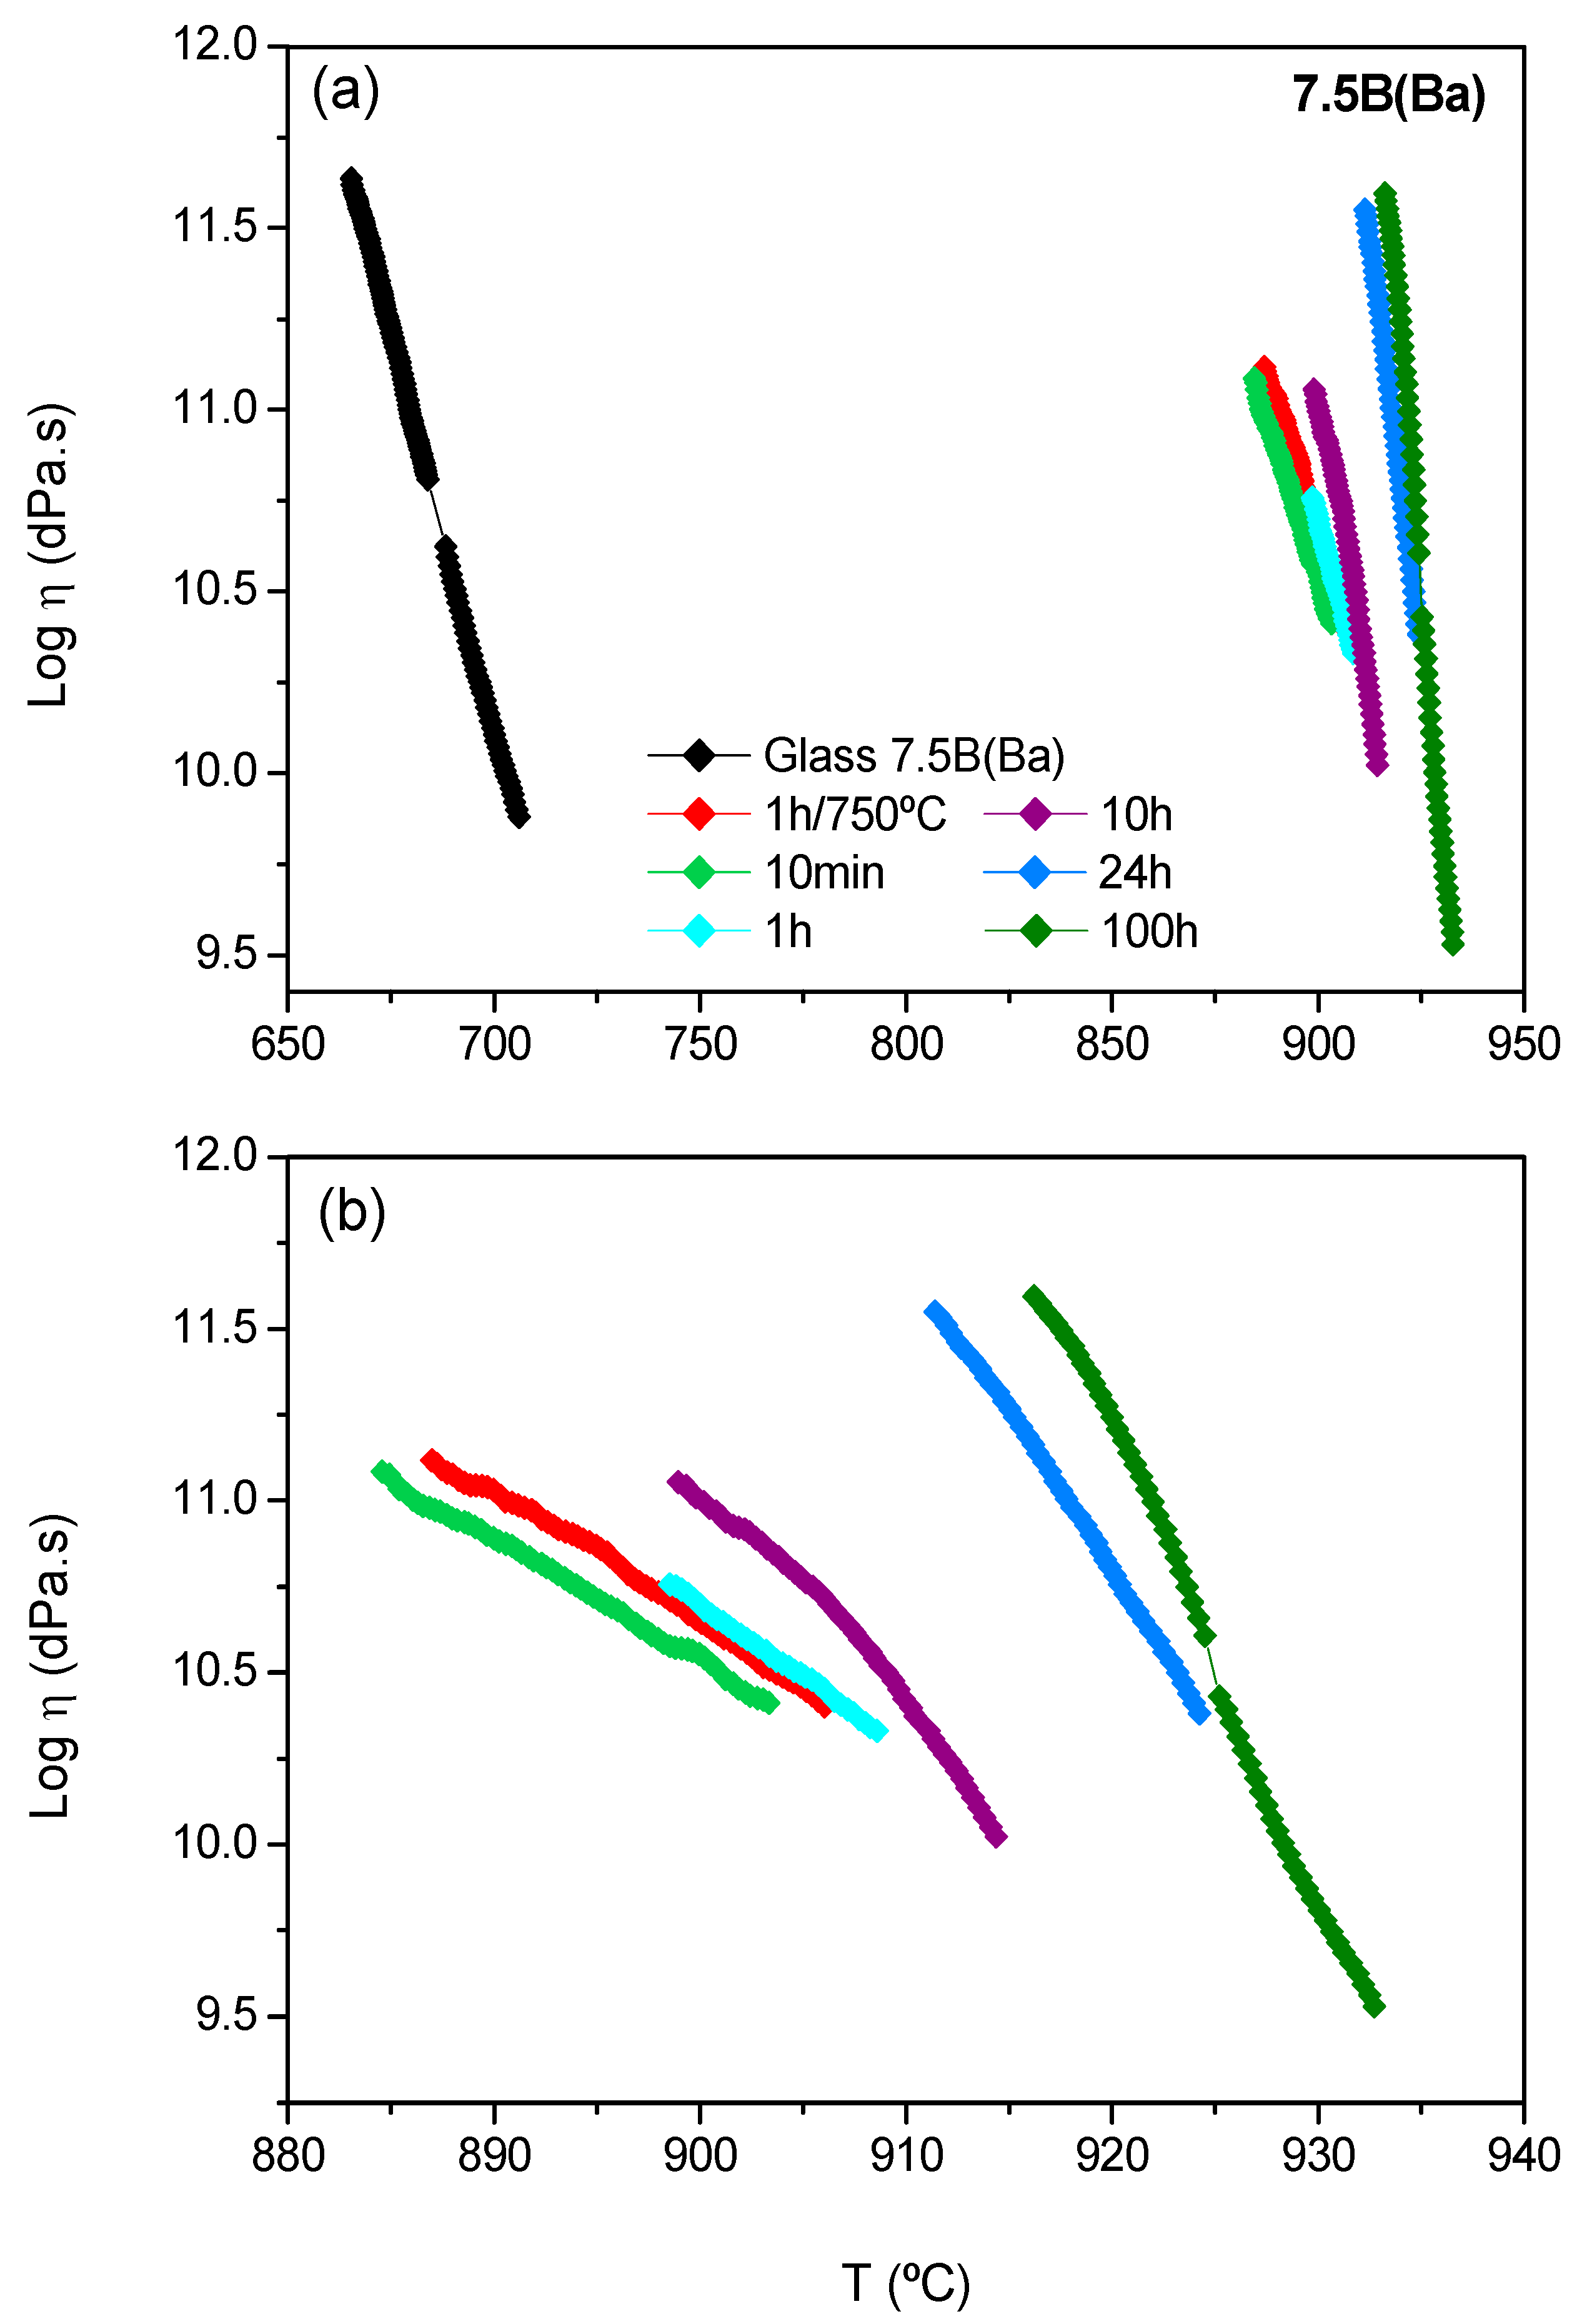
The increase in viscosity of the glass-ceramics with respect to the starting glass is a key issue, since the seal must acquire a certain mechanical stability for the suitable performance of the stack. The evolution of viscosity of the glass-ceramics at high temperature as a function of the crystallization degree has been studied by the “beam-bending” method.
The thermal treatment temperature chosen for the 7.5B(Ba) composition was 800 °C, and the starting glass shows a viscosity of log η ~ 6.8 dPa.s at this temperature [
15]. For the composition 10B(Sr), the chosen temperature for the thermal aging was 750 °C, and the starting glass has a viscosity of log η ~ 8.6 dPa.s at this temperature [
15].
Glass-ceramic bars treated at 800 °C for 7.5B(Ba) (
Figure 8) and 750 °C for 10B(Sr) (
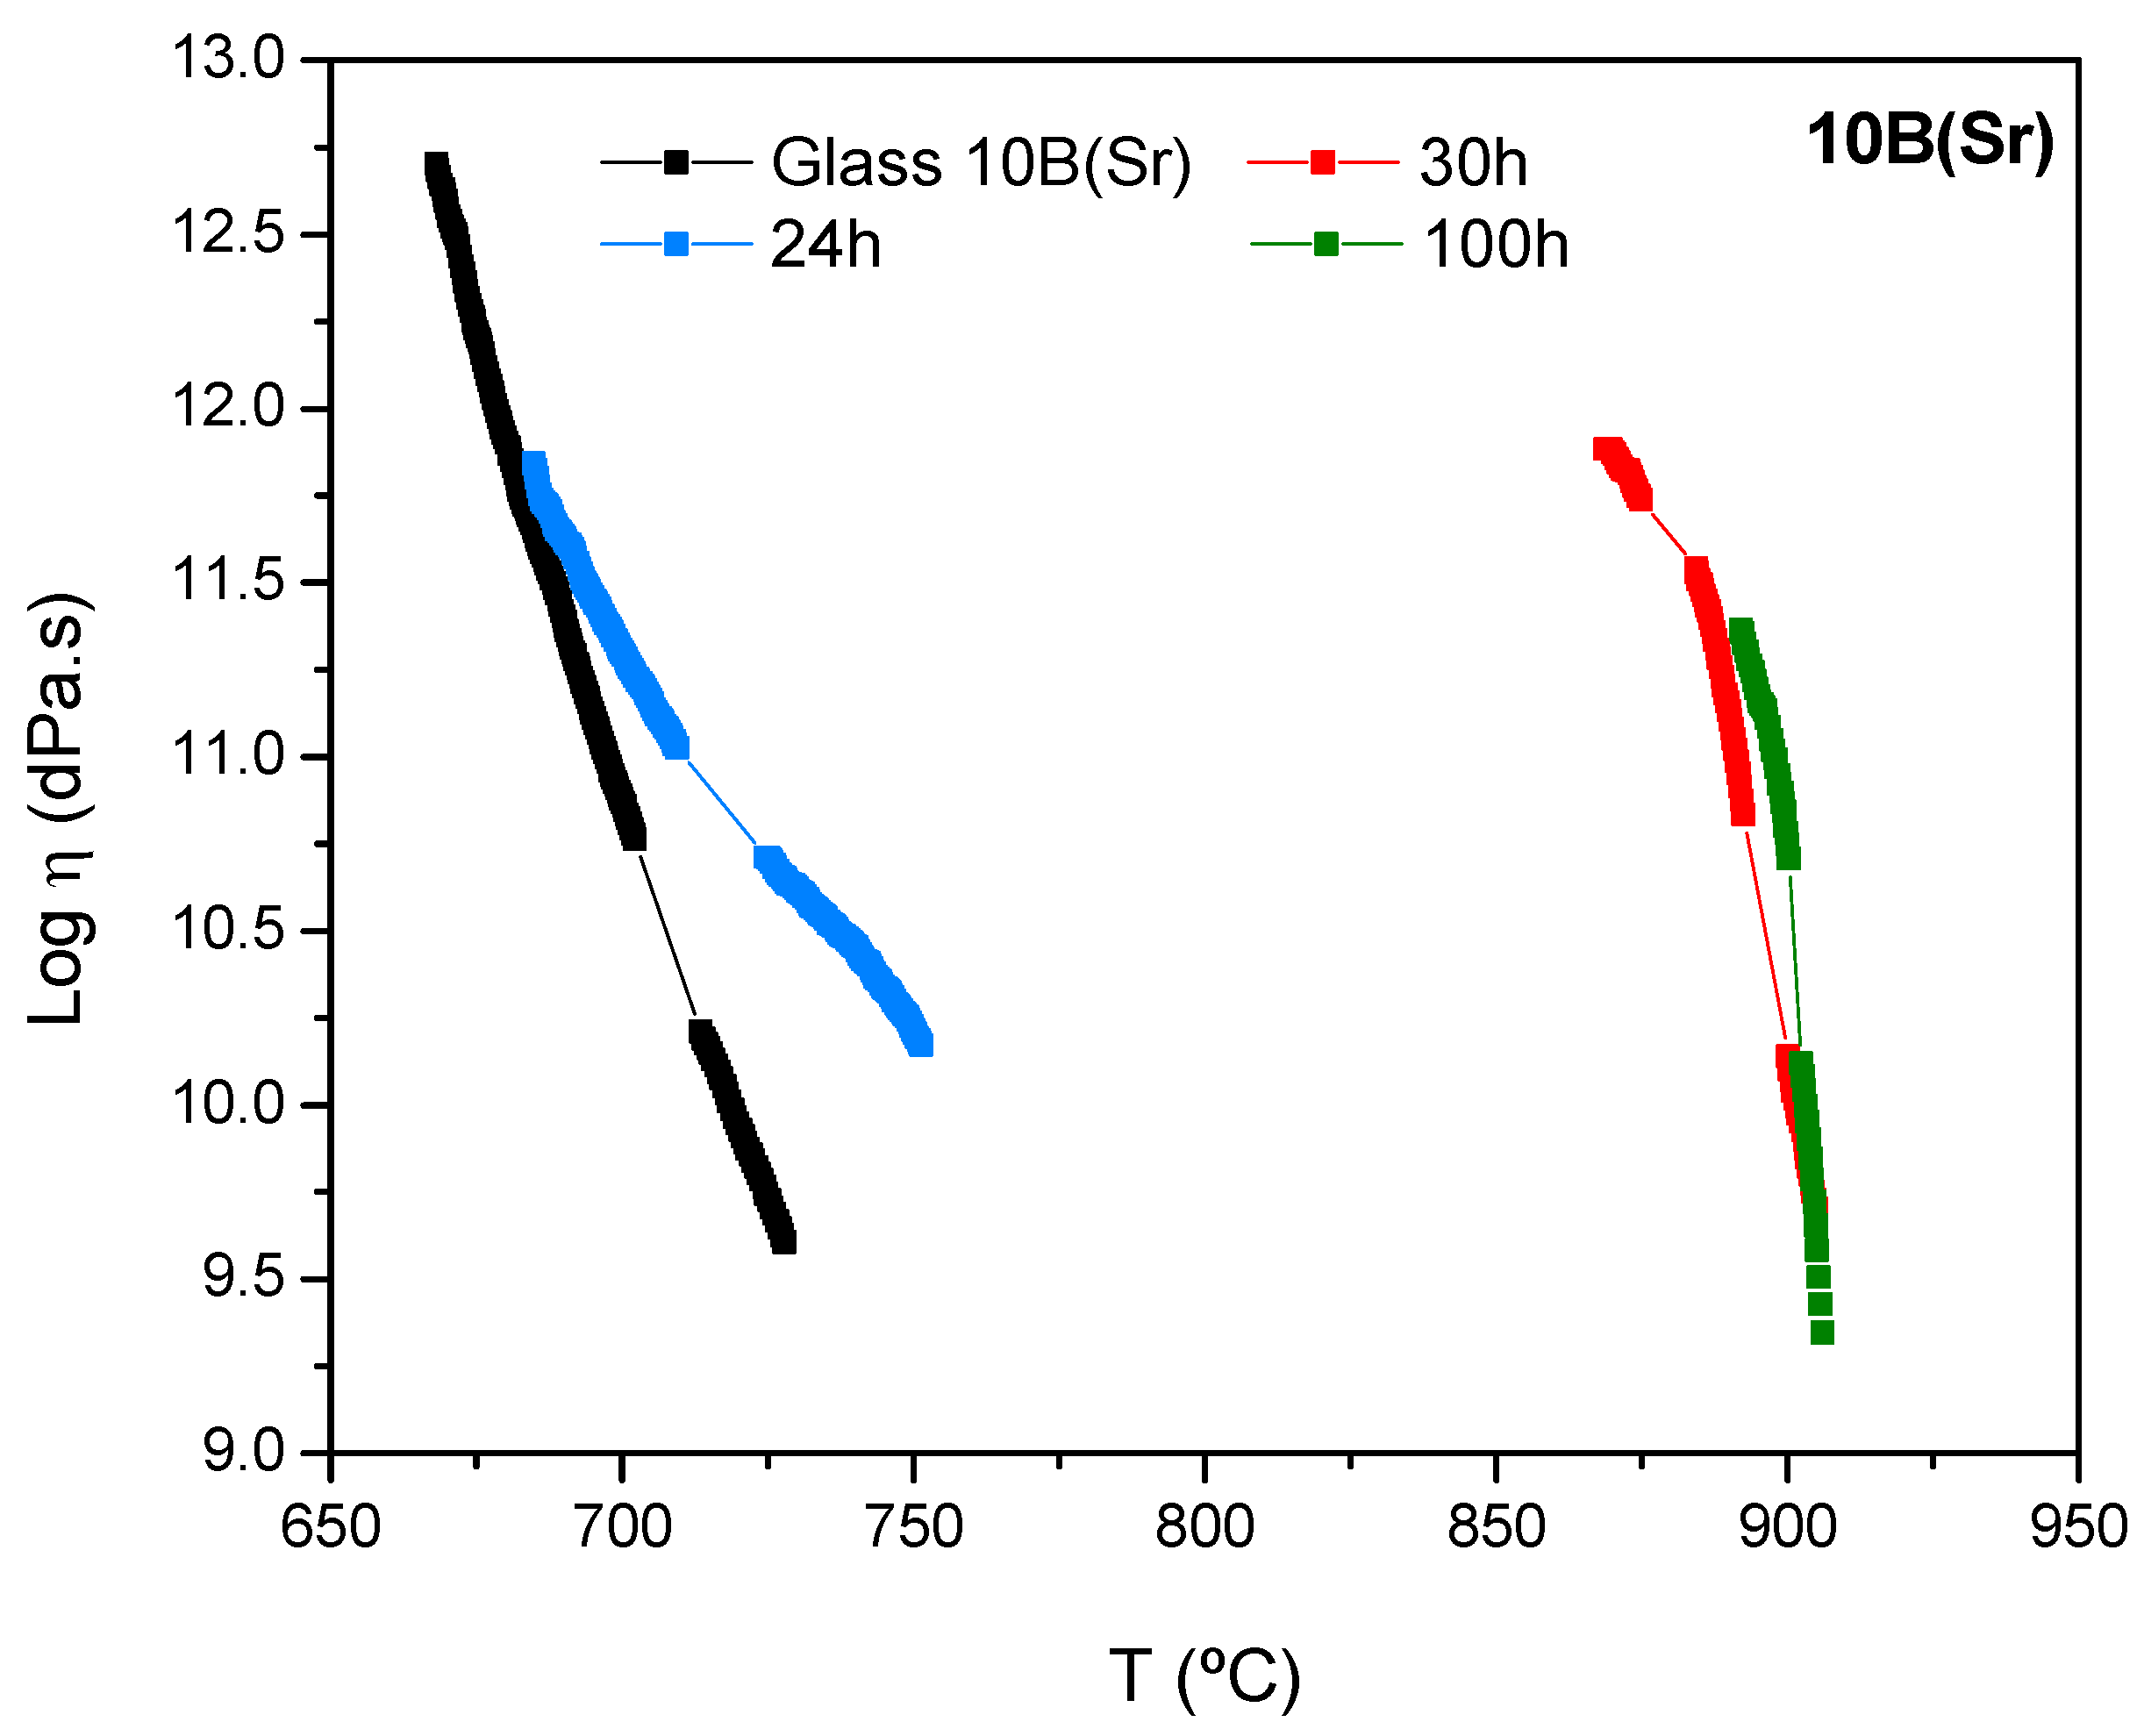
Figure 9) during different times were employed for the viscosity measurement. In both cases, the glass-ceramics viscosity has been compared with the starting glass viscosity determined with the same technique.
In the case of 7.5B(Ba), the evolution of viscosity undergoes an important increase after 10 min of thermal treatment. This composition behaves as a rapid crystallizing glass. The increase in viscosity within the thermal treatment time takes place gradually, presenting the higher value after 100 h. Due to this high increase in viscosity, it is difficult to compare the viscosity values between the glass-ceramics and the starting glass, so the temperatures at which a viscosity of log η = 10.5 dPa.s is reached are calculated. The starting glass shows this viscosity at 690 °C, and the glass-ceramics treated during 10 min, 1 h, 10 h, 24 h and 100 h of thermal treatment have this viscosity at 901, 905, 909, 923 and 925 °C, respectively. An increase in temperature of ~ 200 °C between the glass and the glass-ceramic within 10 min of thermal treatment and other smaller increases of temperature of 10–15 °C between 10 h and 24 h took place. Finally, the viscosity values seemed to stabilize after 100 h, coinciding with the stabilization of the crystallized barium silicate phases.
The viscosity evolution with the treatment time is slower for 10B(Sr) with respect to 7.5B(Ba). The viscosity of the glass and the glass-ceramic after 24 h of treatment shows similar values at low temperature; this is due to the low crystalline fraction of the 24 h glass-ceramic. The high increase in viscosity occurs between 24 and 30 h of thermal treatment. The glass-ceramics at 30 and 100 h show similar viscosity values, probably due to a stabilization of the crystalline phases as observed by XRD [
14,
15].
In order to check the viscosity values, the same process was used for the 10B(Sr) composition. The base glass presents a viscosity of log η ~ 11 at 697 °C, and the glass-ceramics with 24, 30 and 100 h of thermal treatment had this viscosity value at 709, 891 and 898 °C, respectively. Again, there was an increase of temperature of ~ 200 °C between the glass and the glass-ceramic with 30 h of thermal treatment, which shows a strong increase in viscosity. Then, the values stabilized after 100 h of treatment.
The viscosity requirements at the operation temperature of the cell (> 109 dPa.s) are satisfied for both compositions. For the composition 7.5B(Ba), this viscosity was reached very quickly, but for 10B(Sr), an additional treatment time is necessary between 24 and 30 h to acquire the suitable viscosity.
The fast crystallization behaviour of the 7.5B(Ba) requires practical sealing temperatures of 1000 °C in order to get a good gas-tight seal with the SOFC interconnect materials Crofer22APU or Crofer22H; nevertheless, this is possible at lower temperatures (850 °C) with the 10B(Sr) composition [
15].


