Article

Polymer-Stabilized Blue Phase and Its Application to a 1.5 µm Band Wavelength Selective Filter

1
Graduate School of Science and Engineering, Kagoshima University, Korimoto 1, Kagoshima-shi, Kagoshima 890-0065, Japan
2
Institute for Materials Chemistry and Engineering, Kyushu University, 6-1 Kasuga-koen Kasuga-shi, Fukuoka 816-8580, Japan
3
Sumitomo Electric Industries Ltd., 1 Tayacho, Sakae-ku, Yokohama-shi 244-8588, Japan
*
Author to whom correspondence should be addressed.
Submission received: 20 July 2021 / Revised: 20 August 2021 / Accepted: 23 August 2021 / Published: 25 August 2021
(This article belongs to the Special Issue Liquid Crystal Optics for Applications)

Abstract

:
The use of polymer-stabilized blue phase (PSBP) including a tolane-type liquid crystal was investigated to develop a voltage-controlled wavelength selective filter for wavelength-division-multiplexing optical fiber network. It was found that the tolane-type liquid crystal introduction can increase both a blue-phase temperature range and a Kerr coefficient. A Fabry–Perot etalon filled with PSBP functioned as a wavelength selective filter, as expected. The tuning wavelength range was 62 nm although peak transmission was not as high as expected. Numerical analysis suggested that light absorption in transparent electrodes may cause the issue. Minor change to the etalon structure will result in improved performance.

1. Introduction

A wavelength selective filter (WSF) has become an essential device in a wavelength- division-multiplexed (WDM) optical fiber communication system, where multiple color signals are transmitted in parallel in the optical fiber to increase communication throughput [1,2,3,4]. Current systems employ wavelengths between 1.3 and 1.6 μm as optical fibers show the smallest absorption and the smallest chromatic dispersion near these wavelengths. The WSFs are necessary both in transmitters and receivers in such systems. WDM systems could be developed by using constant wavelength filters while the systems employing the WSFs have more advantages in design flexibility, low-cost construction and maintenance, and functionality. Furthermore, system researchers and designers impose other requirements such as low-voltage operation, low-power consumption, fast response, and wide temperature range. A large number of WSFs have been developed and some are commercially available [5,6]. It should be noted that the use of liquid crystal (LC) is advantageous in large change in refractive index and low-voltage and low-power operation [7]. Response times of nematic LC are typically in ms order although some LC materials can respond in µs order [8].
Polymer stabilization of LC could extend its application field to optical fiber communication devices. We have succeeded in development of a variable optical attenuator for 1.5 µm optical fiber networks [9]. This paper focuses on the use of polymer-stabilized blue phase (PSBP) for a WSF. We were drawn to conventional—unstabilized—blue phase devices as a viable option due to its non-birefringence at zero electric field, high speed response, and large Kerr effect [10]. However, a major disadvantage of the conventional blue phases is narrow temperature range of the phase. Blue phase is eroded by a chiral nematic phase and an isotropic phase. As a result, blue phase appears only in a few °C at temperatures higher than room temperature. To overcome this problem, we set out to fix blue phase liquid crystal in polymer network. Thus, we achieved a blue-phase temperature range of 47 °C by using tolane-type liquid crystal as host mixture [11]. Another issue that needed to be resolved is to decrease the applied voltage. Typically, a higher voltage operation is necessary due to the short coherent length in orientational order and highly twisted molecular alignment in the conventional devices.
Then, we filled a Fabry–Perot etalon with the PSBP to develop a lower-voltage WSF and succeeded in its demonstration. A tuning wavelength range of 62 nm was experimentally obtained at 120 V or lower voltages. In other words, the required voltage for 7 nm tunability is 13.5 V, assuming an application to access network called NG-PON2 [4].
A molecule structure, a sample preparation, and a phase diagram of the PSBP are described in Section 2. The structure and experimental results are described in Section 3 that includes transmission spectrum of the PSBP-filled WSF. We discuss the characteristics of the developed WSF and suggestions for future improvement in Section 4. We conclude this paper in Section 5.

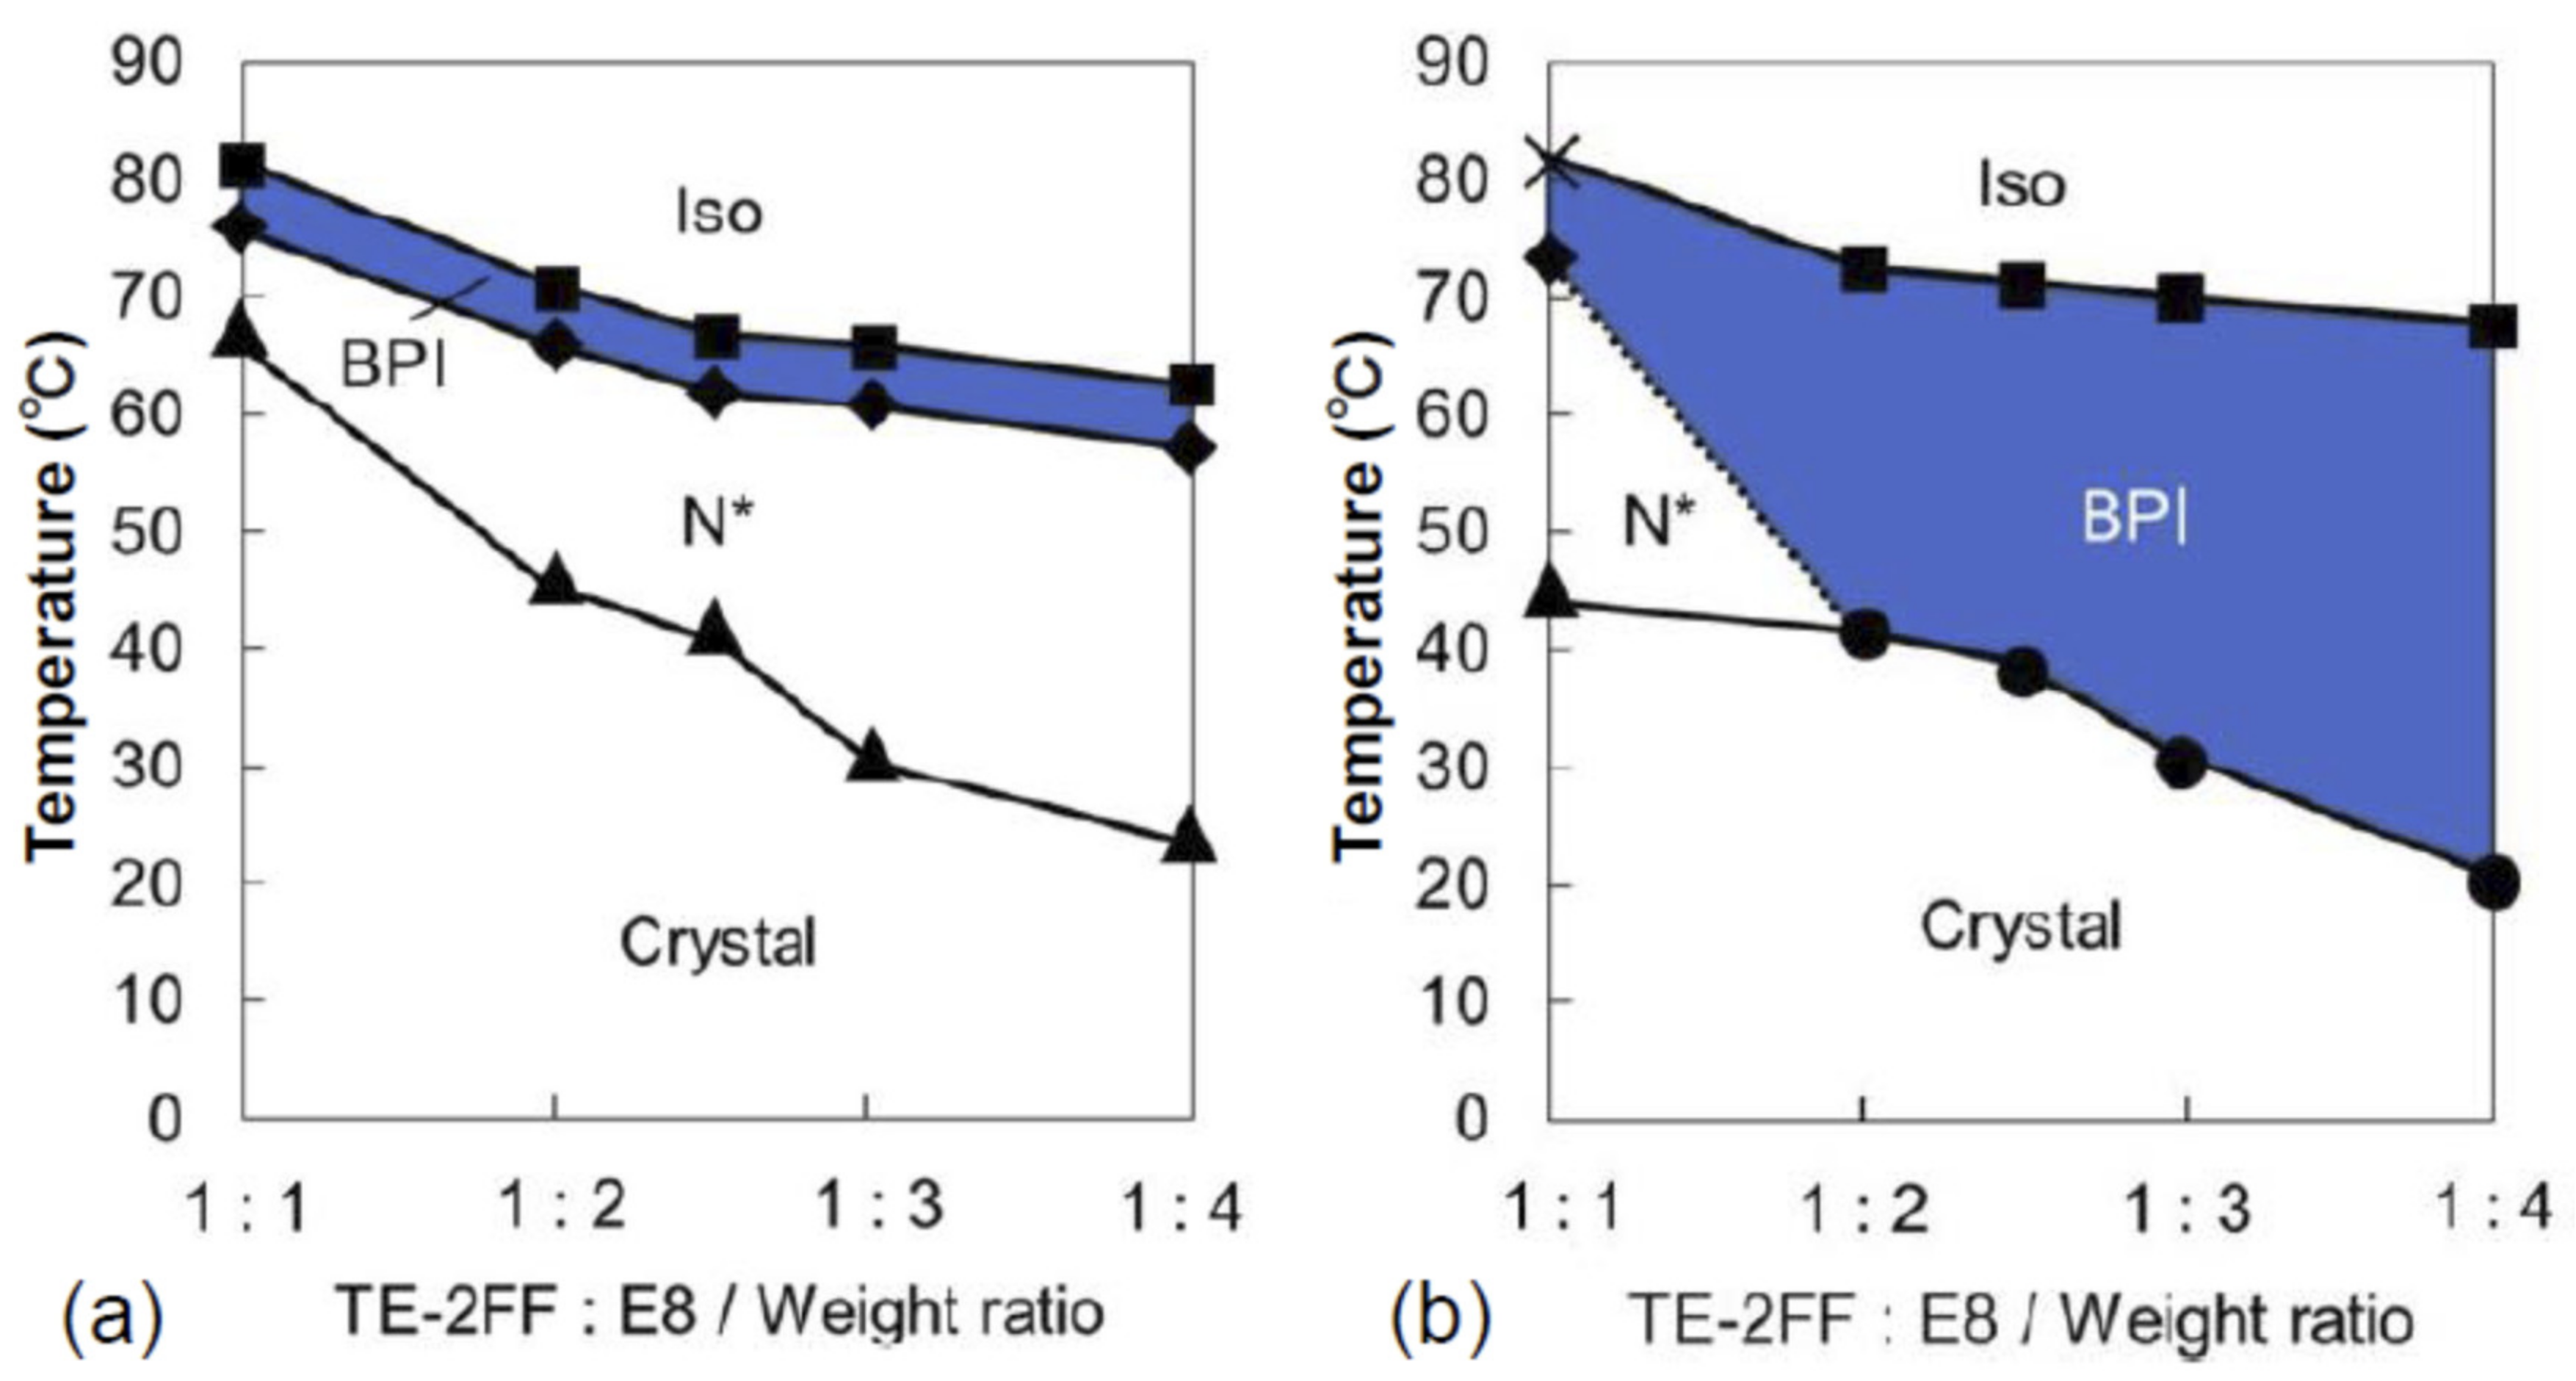
2. Preparation and Measurement of Mixture

Sample fabrication processes are divided into two: liquid crystal mixture and Fabry–Perot etalon manufacture described below and in Section 3.
First, we describe the principle and mixture method of PSBP. Blue phase appeared in only a few °C between a chiral nematic (N*) phase and an isotropic (Iso) phase in a previous report [10]. It was expected that the temperature range can be expanded by the fixation of LC molecules in polymer-stabilized network. Figure 1a shows a schematic diagram of BP I with double twisted cylinders (blue) and disclination lines (violet) and Figure 1b shows the LC molecules (brown) aligned along the disclination lines. To achieve larger birefringence or low-voltage operation, a tolane-type LC is regarded as one of the strongest candidates as host nematic LC (NLC). Schematics of general tolane-type molecule and TE-2FF are shown in Figure 2a,b, respectively. The use of tolane-type host LC can enlarge the Kerr effect and decrease the operation voltage. We chose two tolane-type LCs: TE-2FF and E8 (Merck, Darmstadt, Germany). Precursors to PSBP consist of the described host LCs, a chiral dopant, a mono-functional monomer, a bi-functional monomer, and a photo initiator. Details of the materials are summarized in Table 1. Then, the precursor mixture was irradiated with 365 nm, 1.5 mW/cm2 ultra-violet (UV) light to the blue phase for 20 min. Phase transition of the mixture was observed during preparation by using a polarization microscope at a wavelength of 633 nm before and after UV light irradiation. Materials were observed between two glass substrates during fabrication. The injection was done at 110 °C for the TE-2FF:E8 ratio of 1:1 and 1:2 and at 95 °C for the ratio of 1:2.5, 1:3, and 1:4.
We obtained phase diagrams with a parameter of the TE-2FF:E8 ratio, as shown in Figure 3a,b, that were observed before and after UV irradiation, respectively. We describe the characteristics for the cell before UV light irradiation first. The developed materials show BP I phase between N* phase and isotropic phase for all the host mixture ratios. Between the N*-phase and the isotropic phase, a BP I phase appears only in 4.4–4.7 °C, as shown in Figure 3a. The BP I temperature range was independent of the mixture ratio. In contrast, we observed wider temperature range of BP I phase in the sample after UV irradiation or the polymer-stabilized sample, as shown in Figure 3b. The BP I temperature ranges are 10 °C for a ratio of 1:1 and 47 °C for the ratio of 1:4. The temperature range becomes widened as the E8 ratio increases. Furthermore, we observed that the BP I phase appears at a temperature as low as 20 °C, which is regarded as room temperature. The BP I phase appears between the N* phase and the isotropic phase for the cells with TE-2FF:E8 of 1:1 while we find that the BP I phase appears between the crystal phase and isotropic phase for the cells with TE-2FF:E8 ratio of 1:2 to 1:4. The latter cells show no N* phase.
We observed the Kerr effect of our new material and conventional, non-tolane 5CB:JC1041XX material, as shown in Figure 4. JC1041XX was available from JNC, Tokyo, Japan. Light transmission was observed with the crossed-Nicol polarized microscope. All the curves seem proportional to the square of sinusoidal function except at the voltage of lower than 40 V, in which case, they reach their peaks, and then decrease. We should note that the voltage at the peak transmission is 216 V for the conventional mixture while we find 97 and 108 V for our new mixture with TE-2FF:E8 ratios of 1:2.5 and 1:3. These new data shows that reduction of the applied voltage is as high as 55 and 50%.

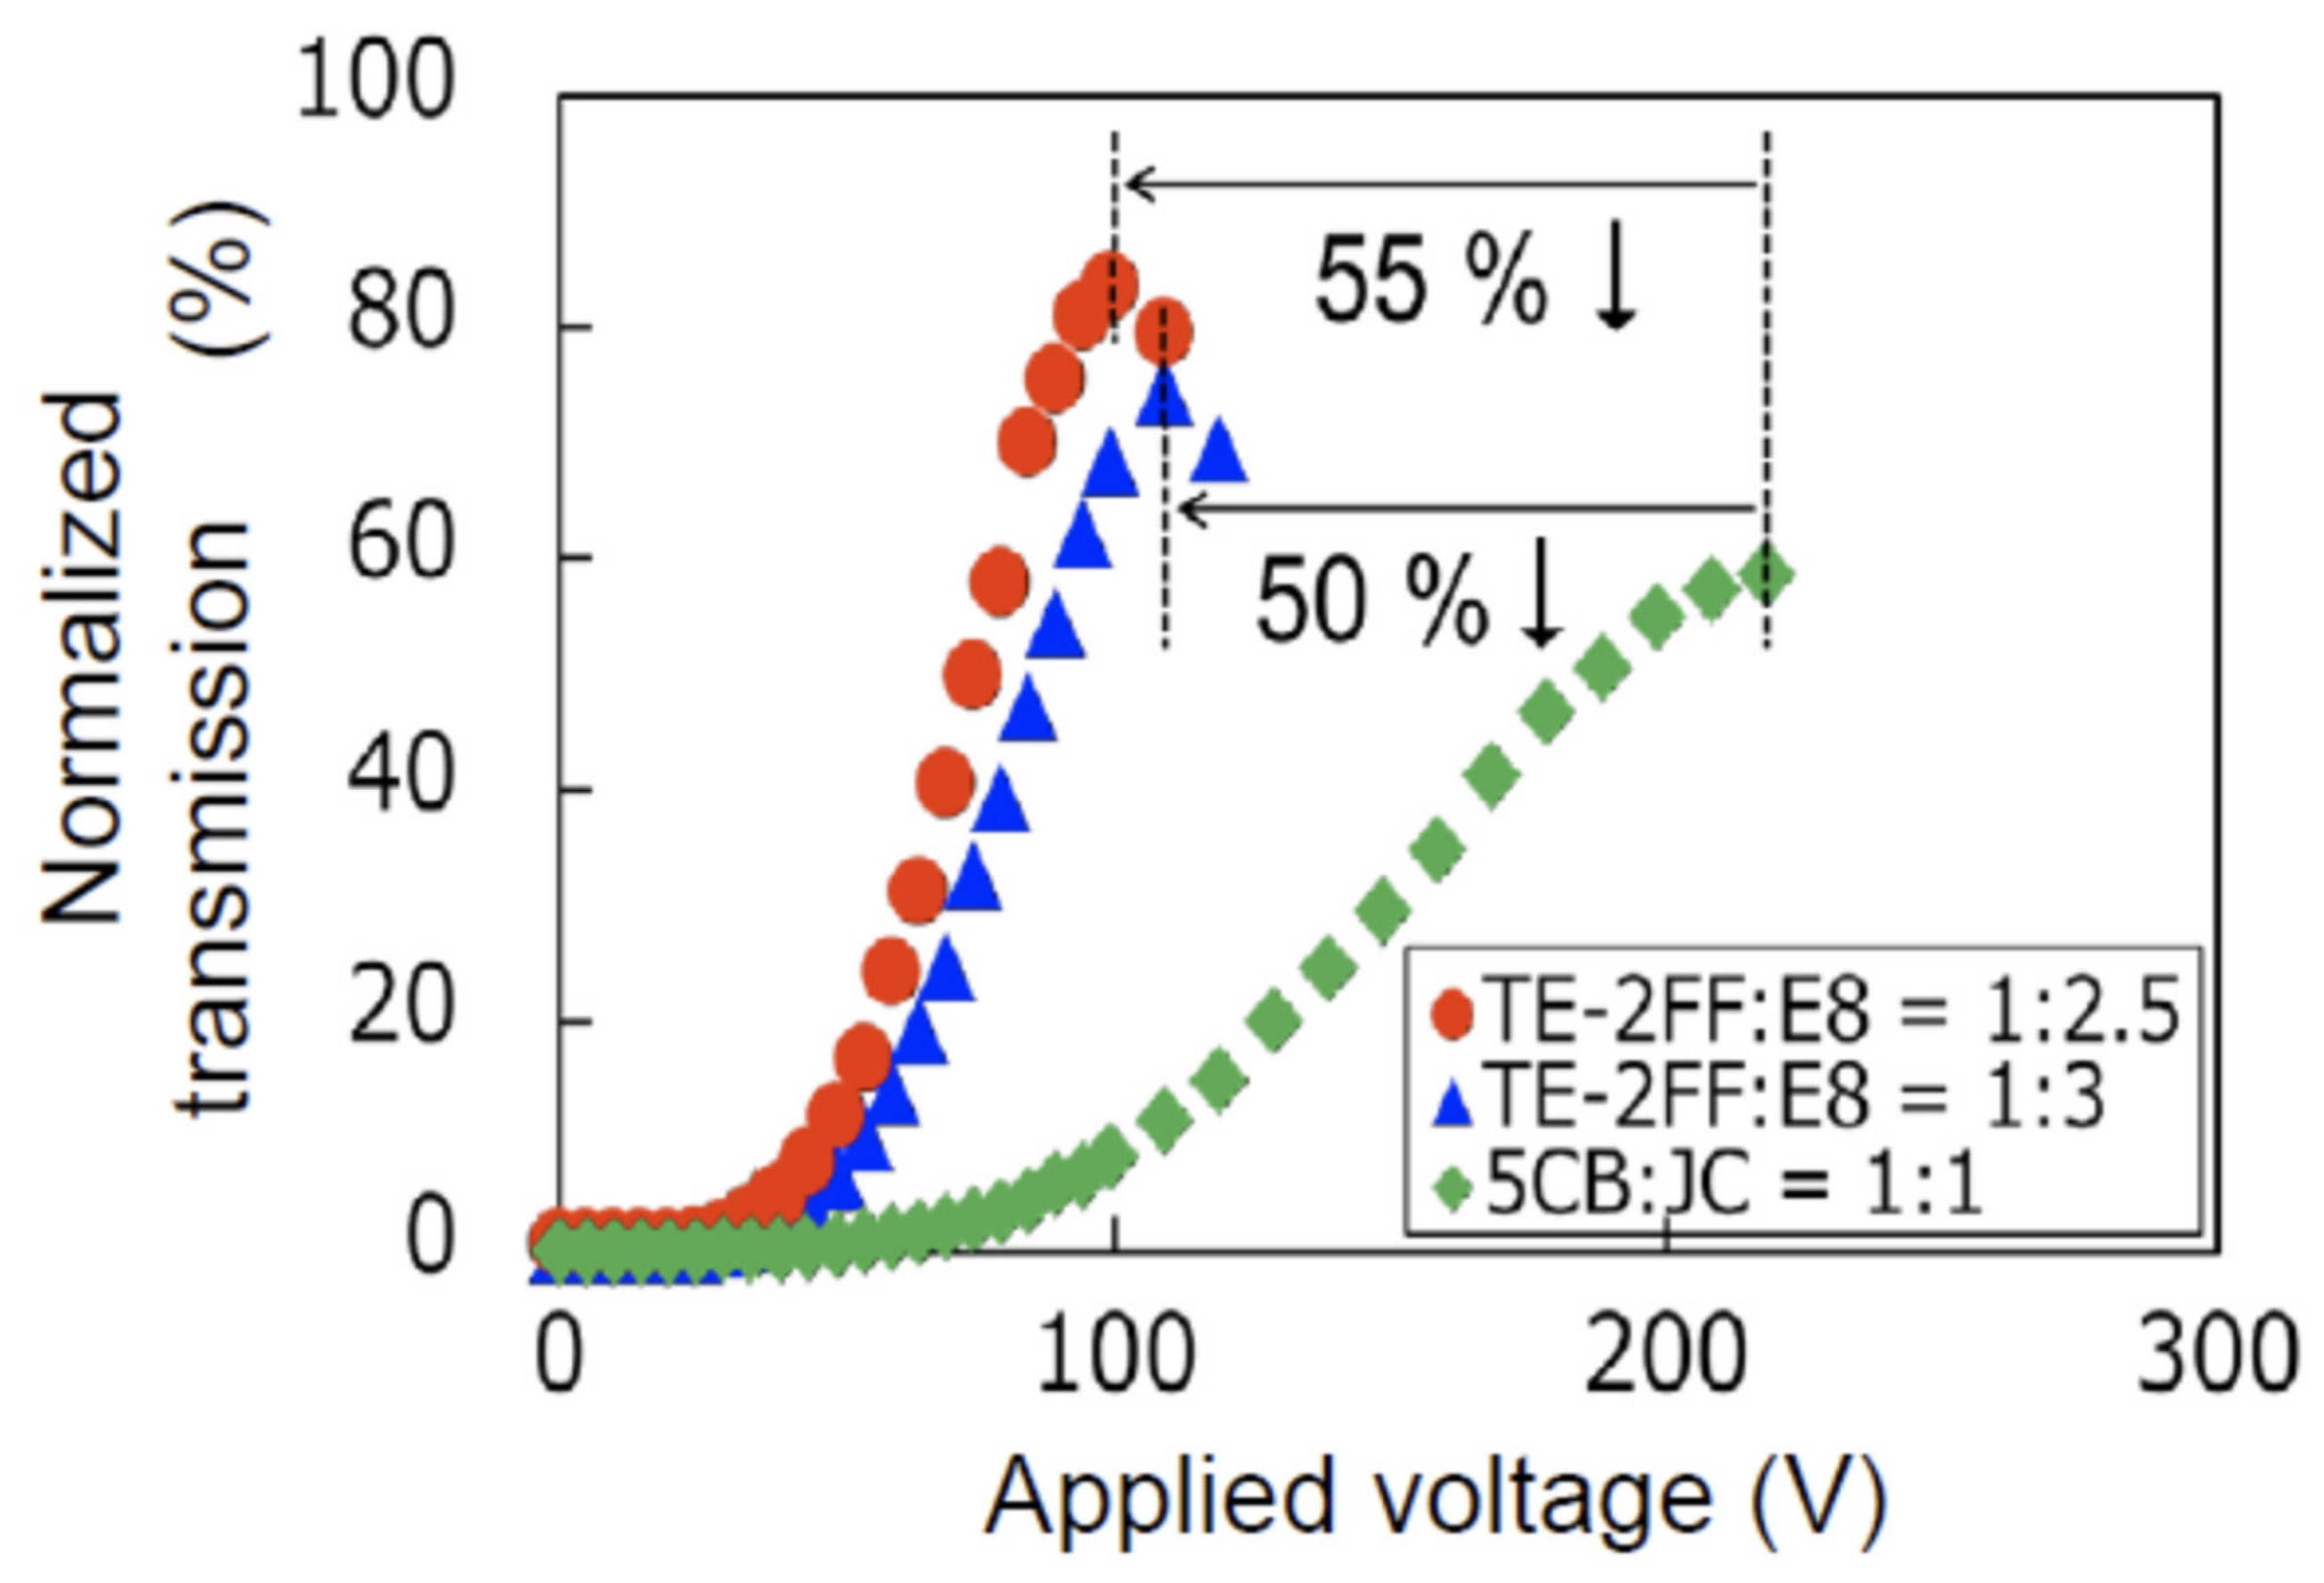
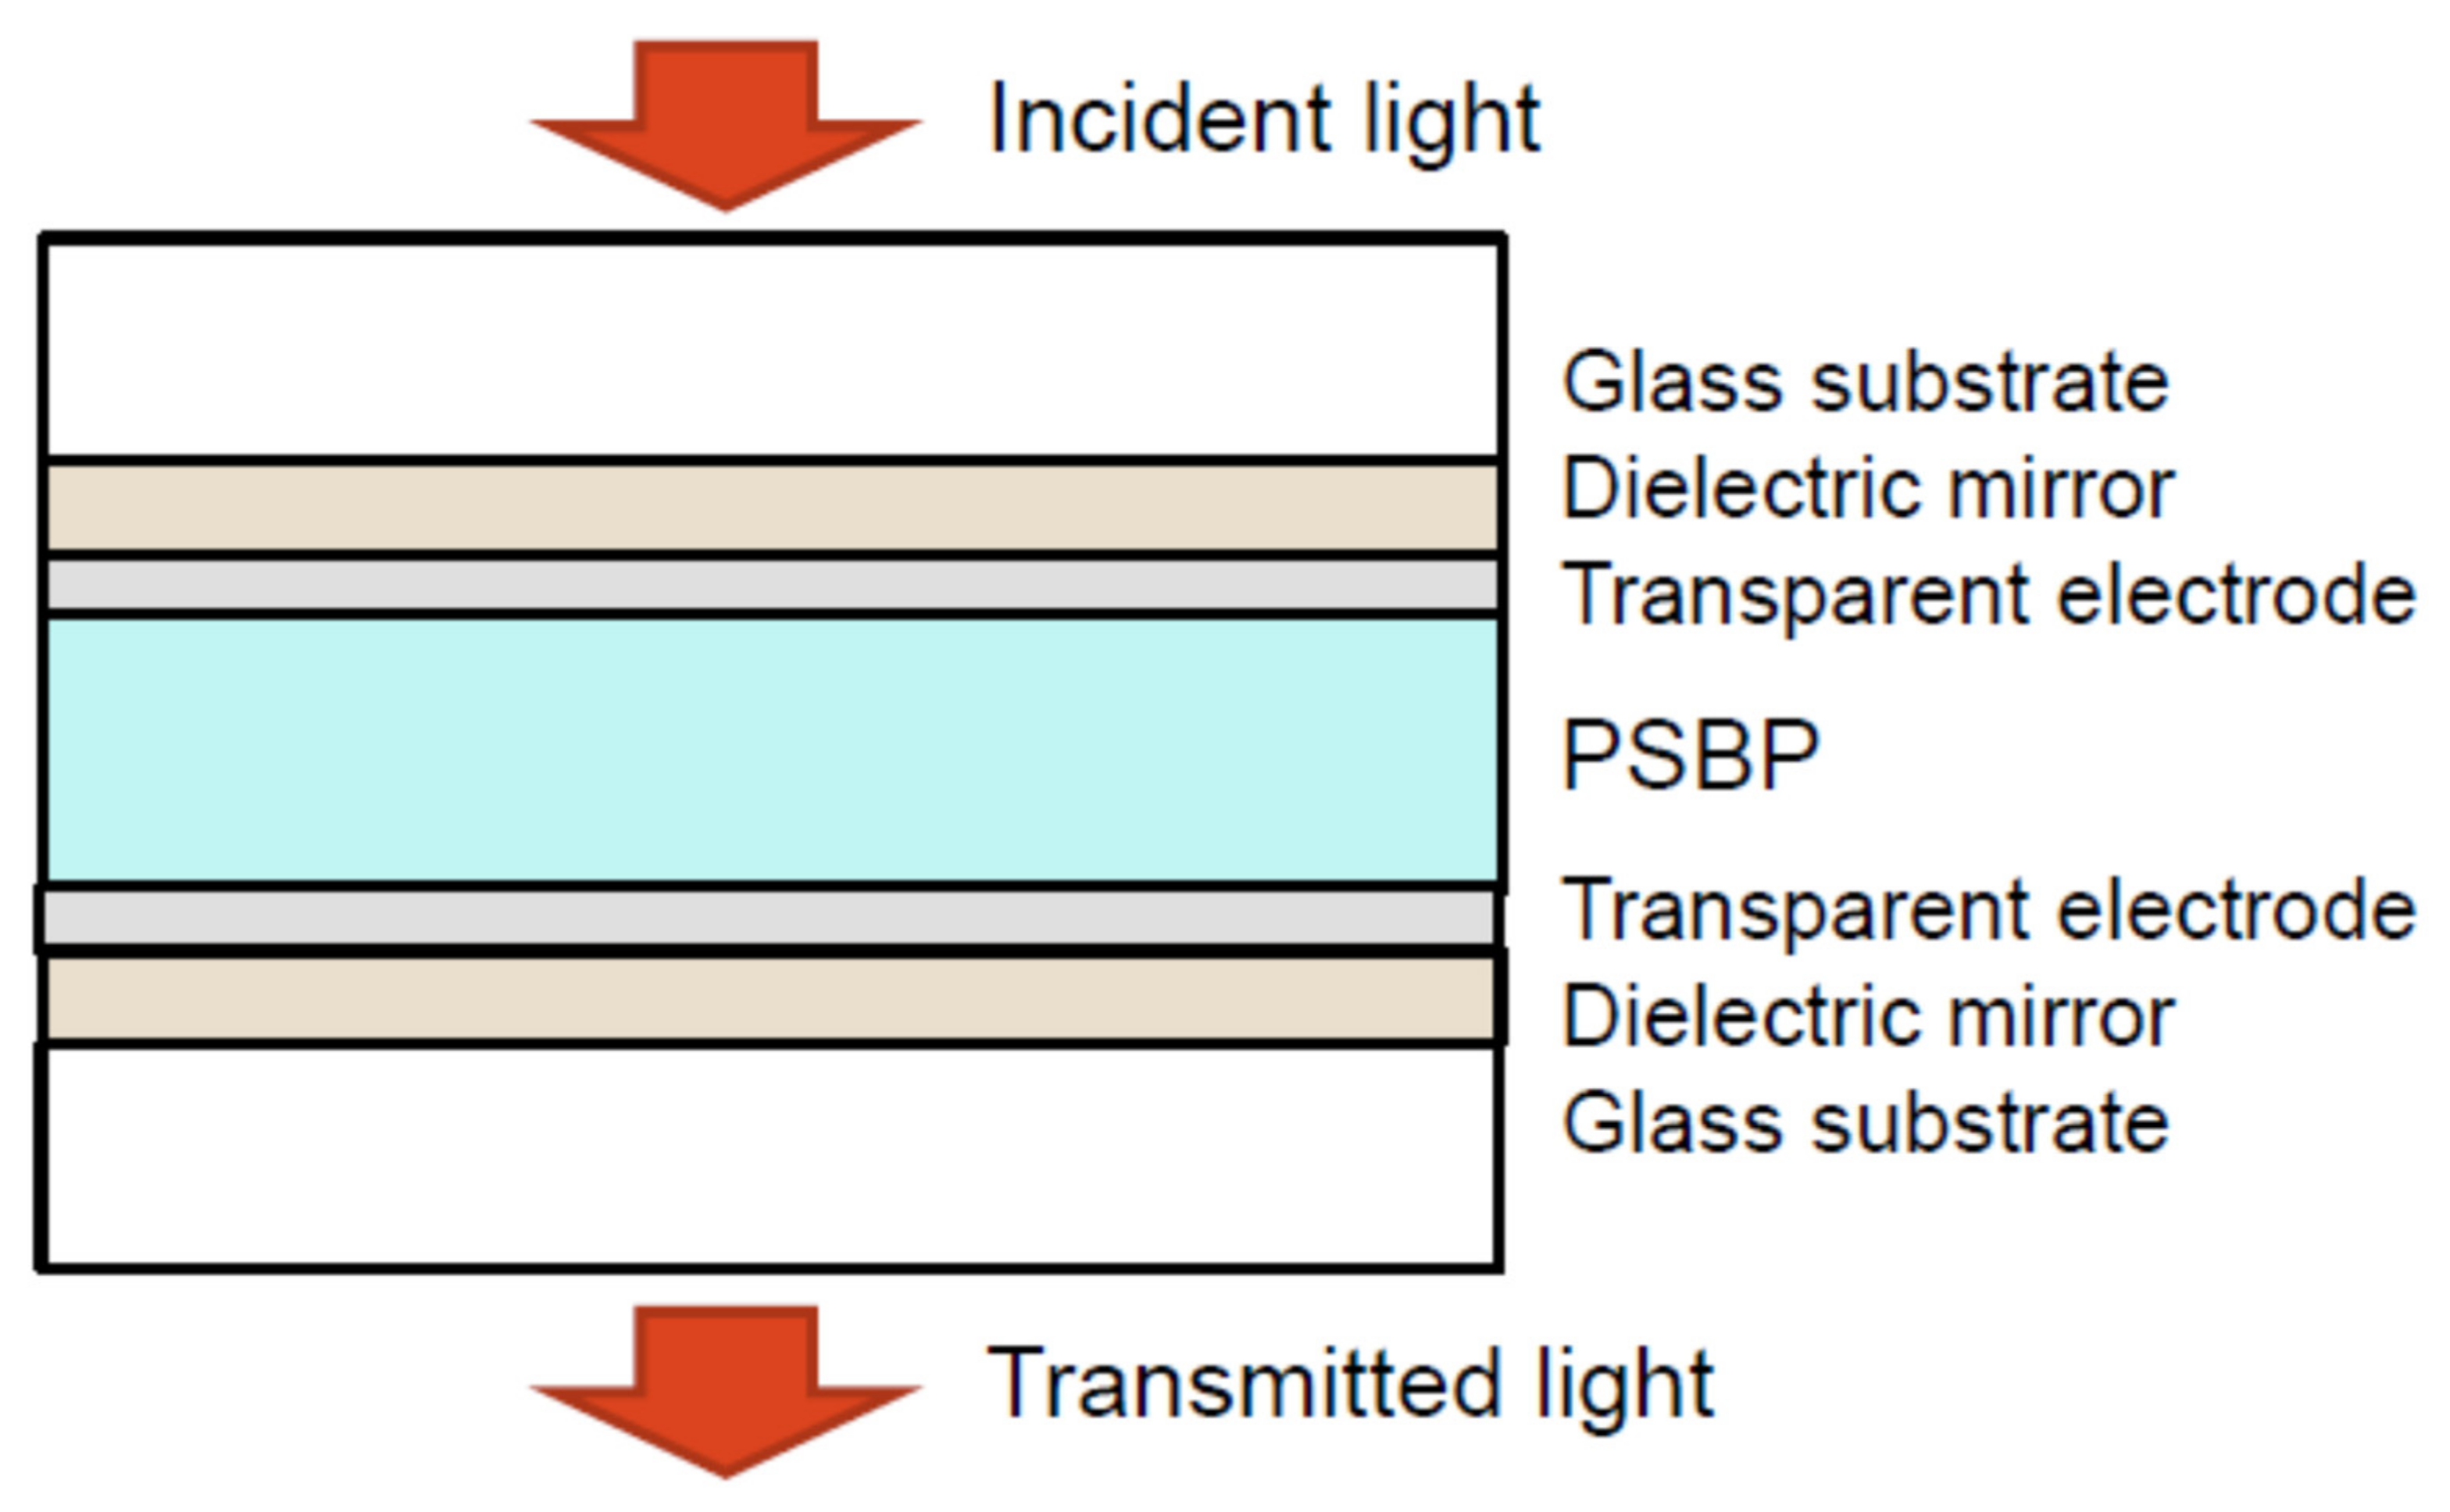
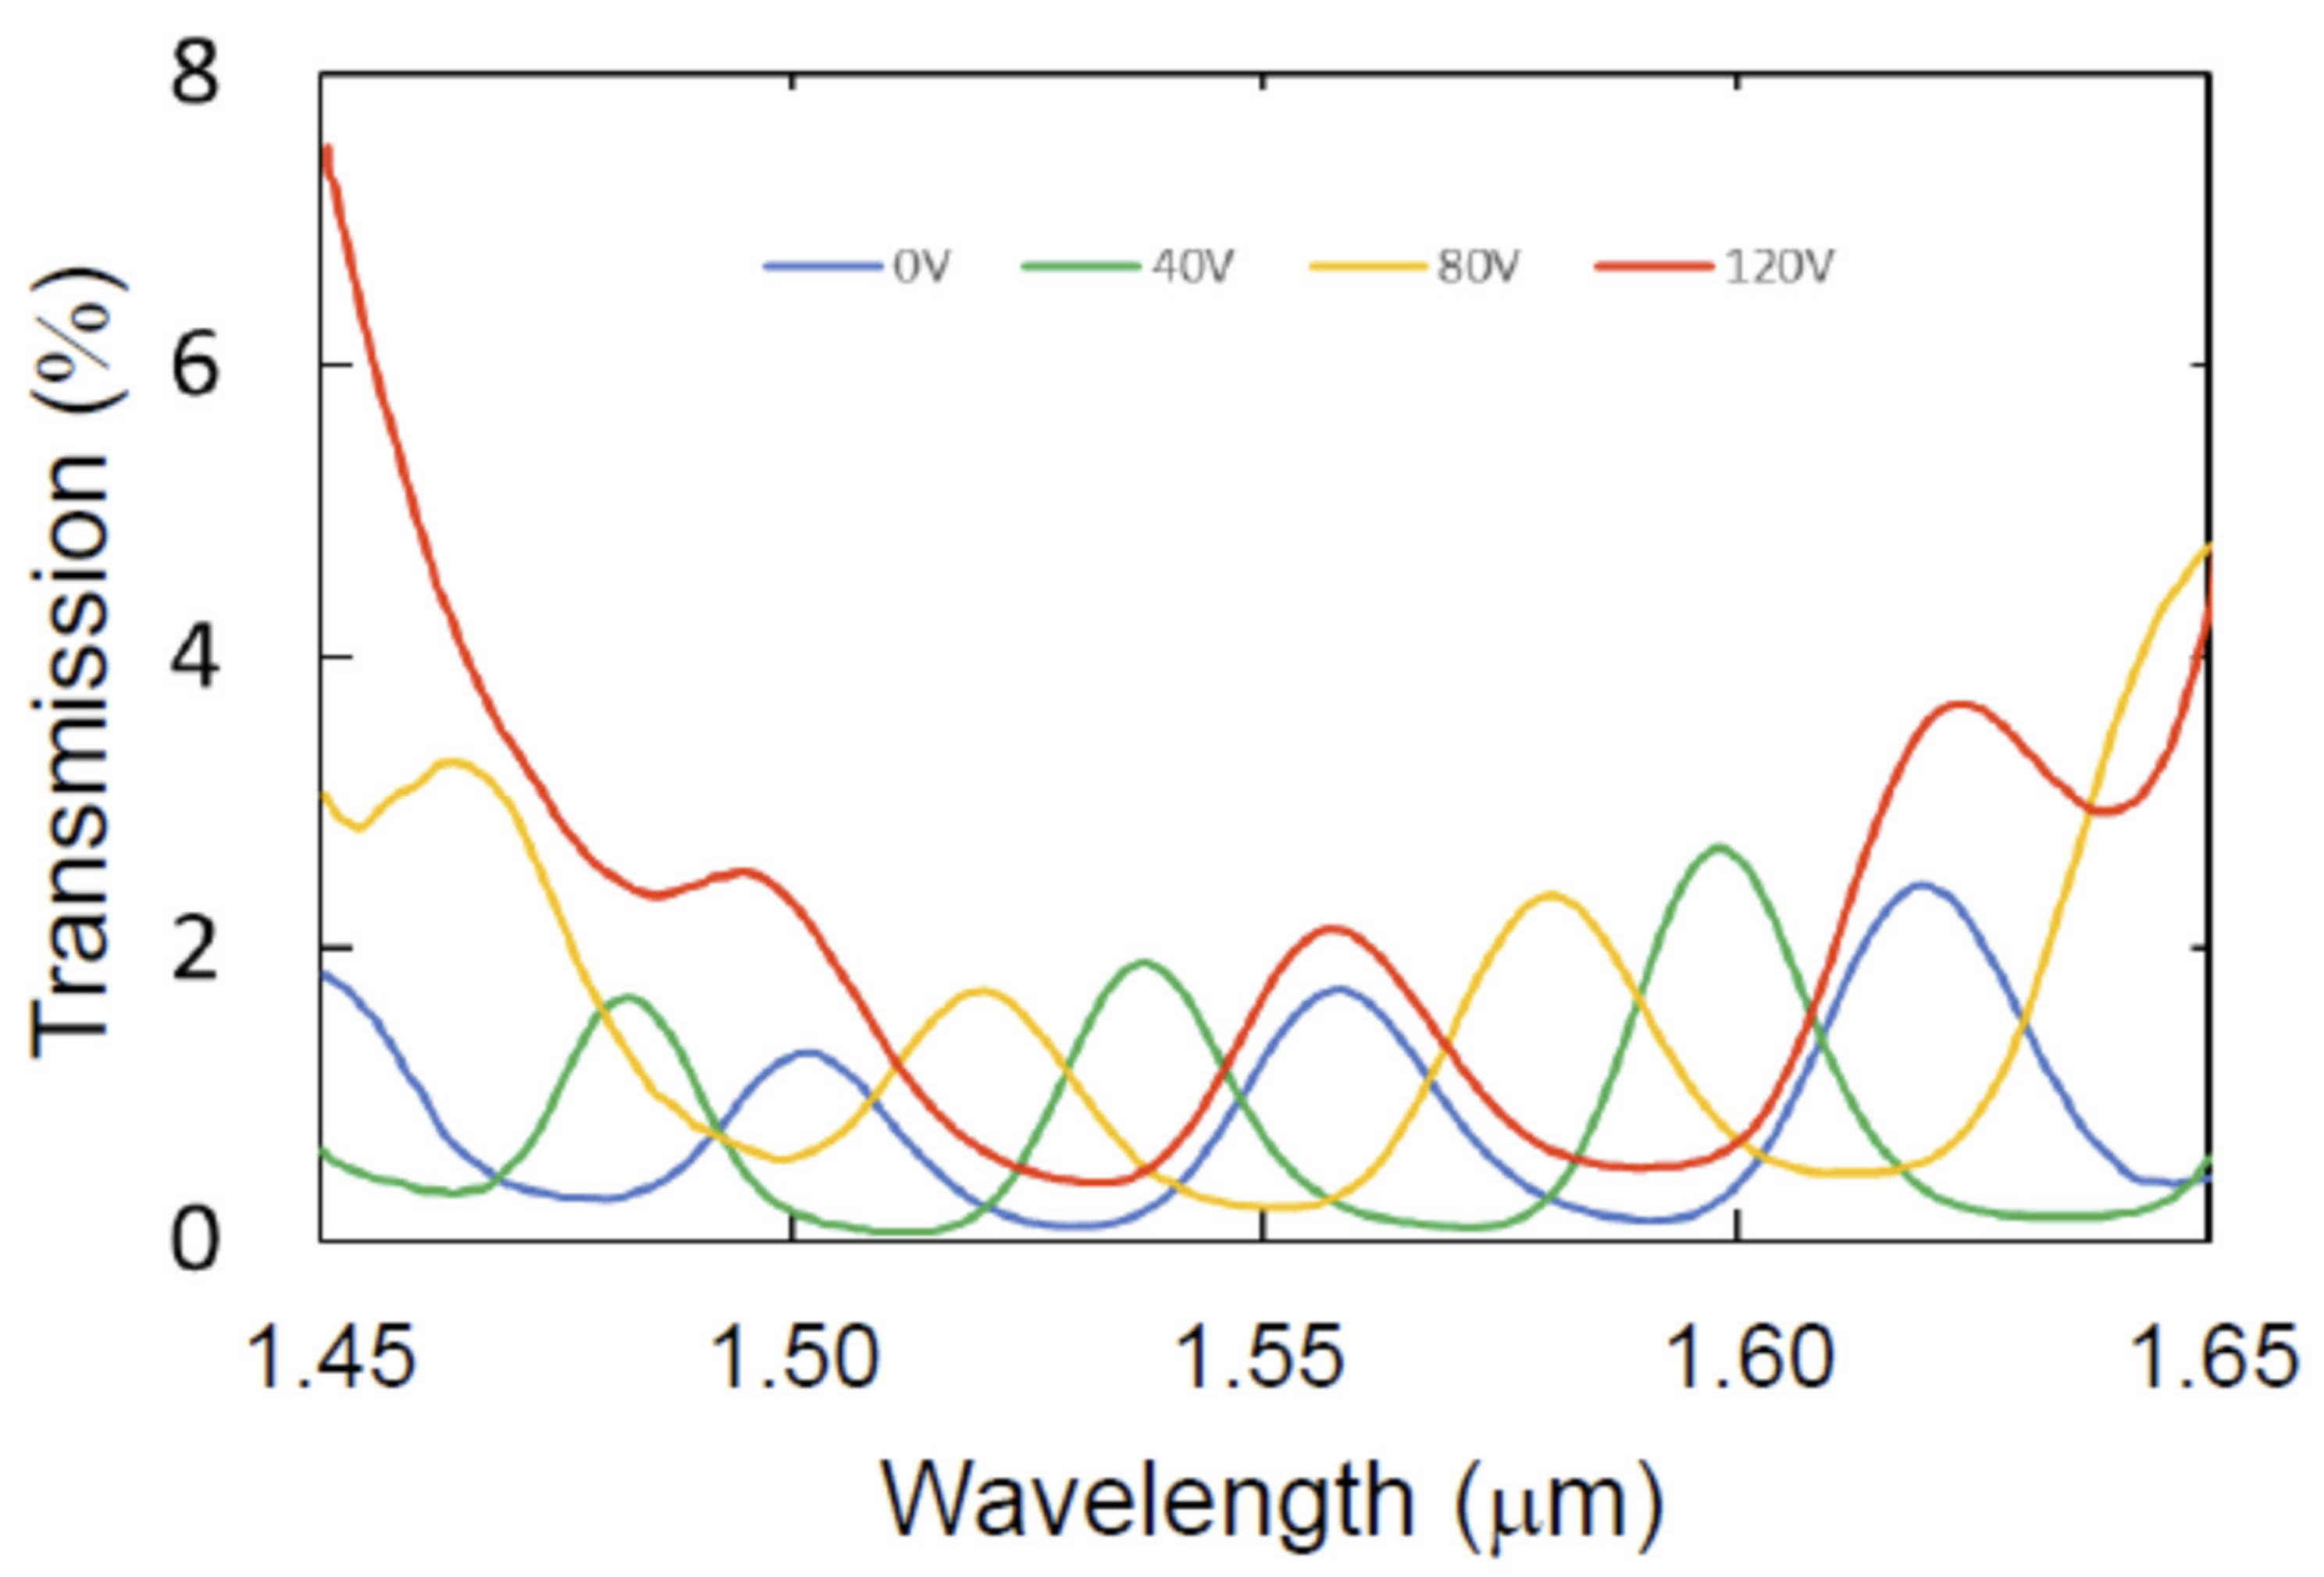
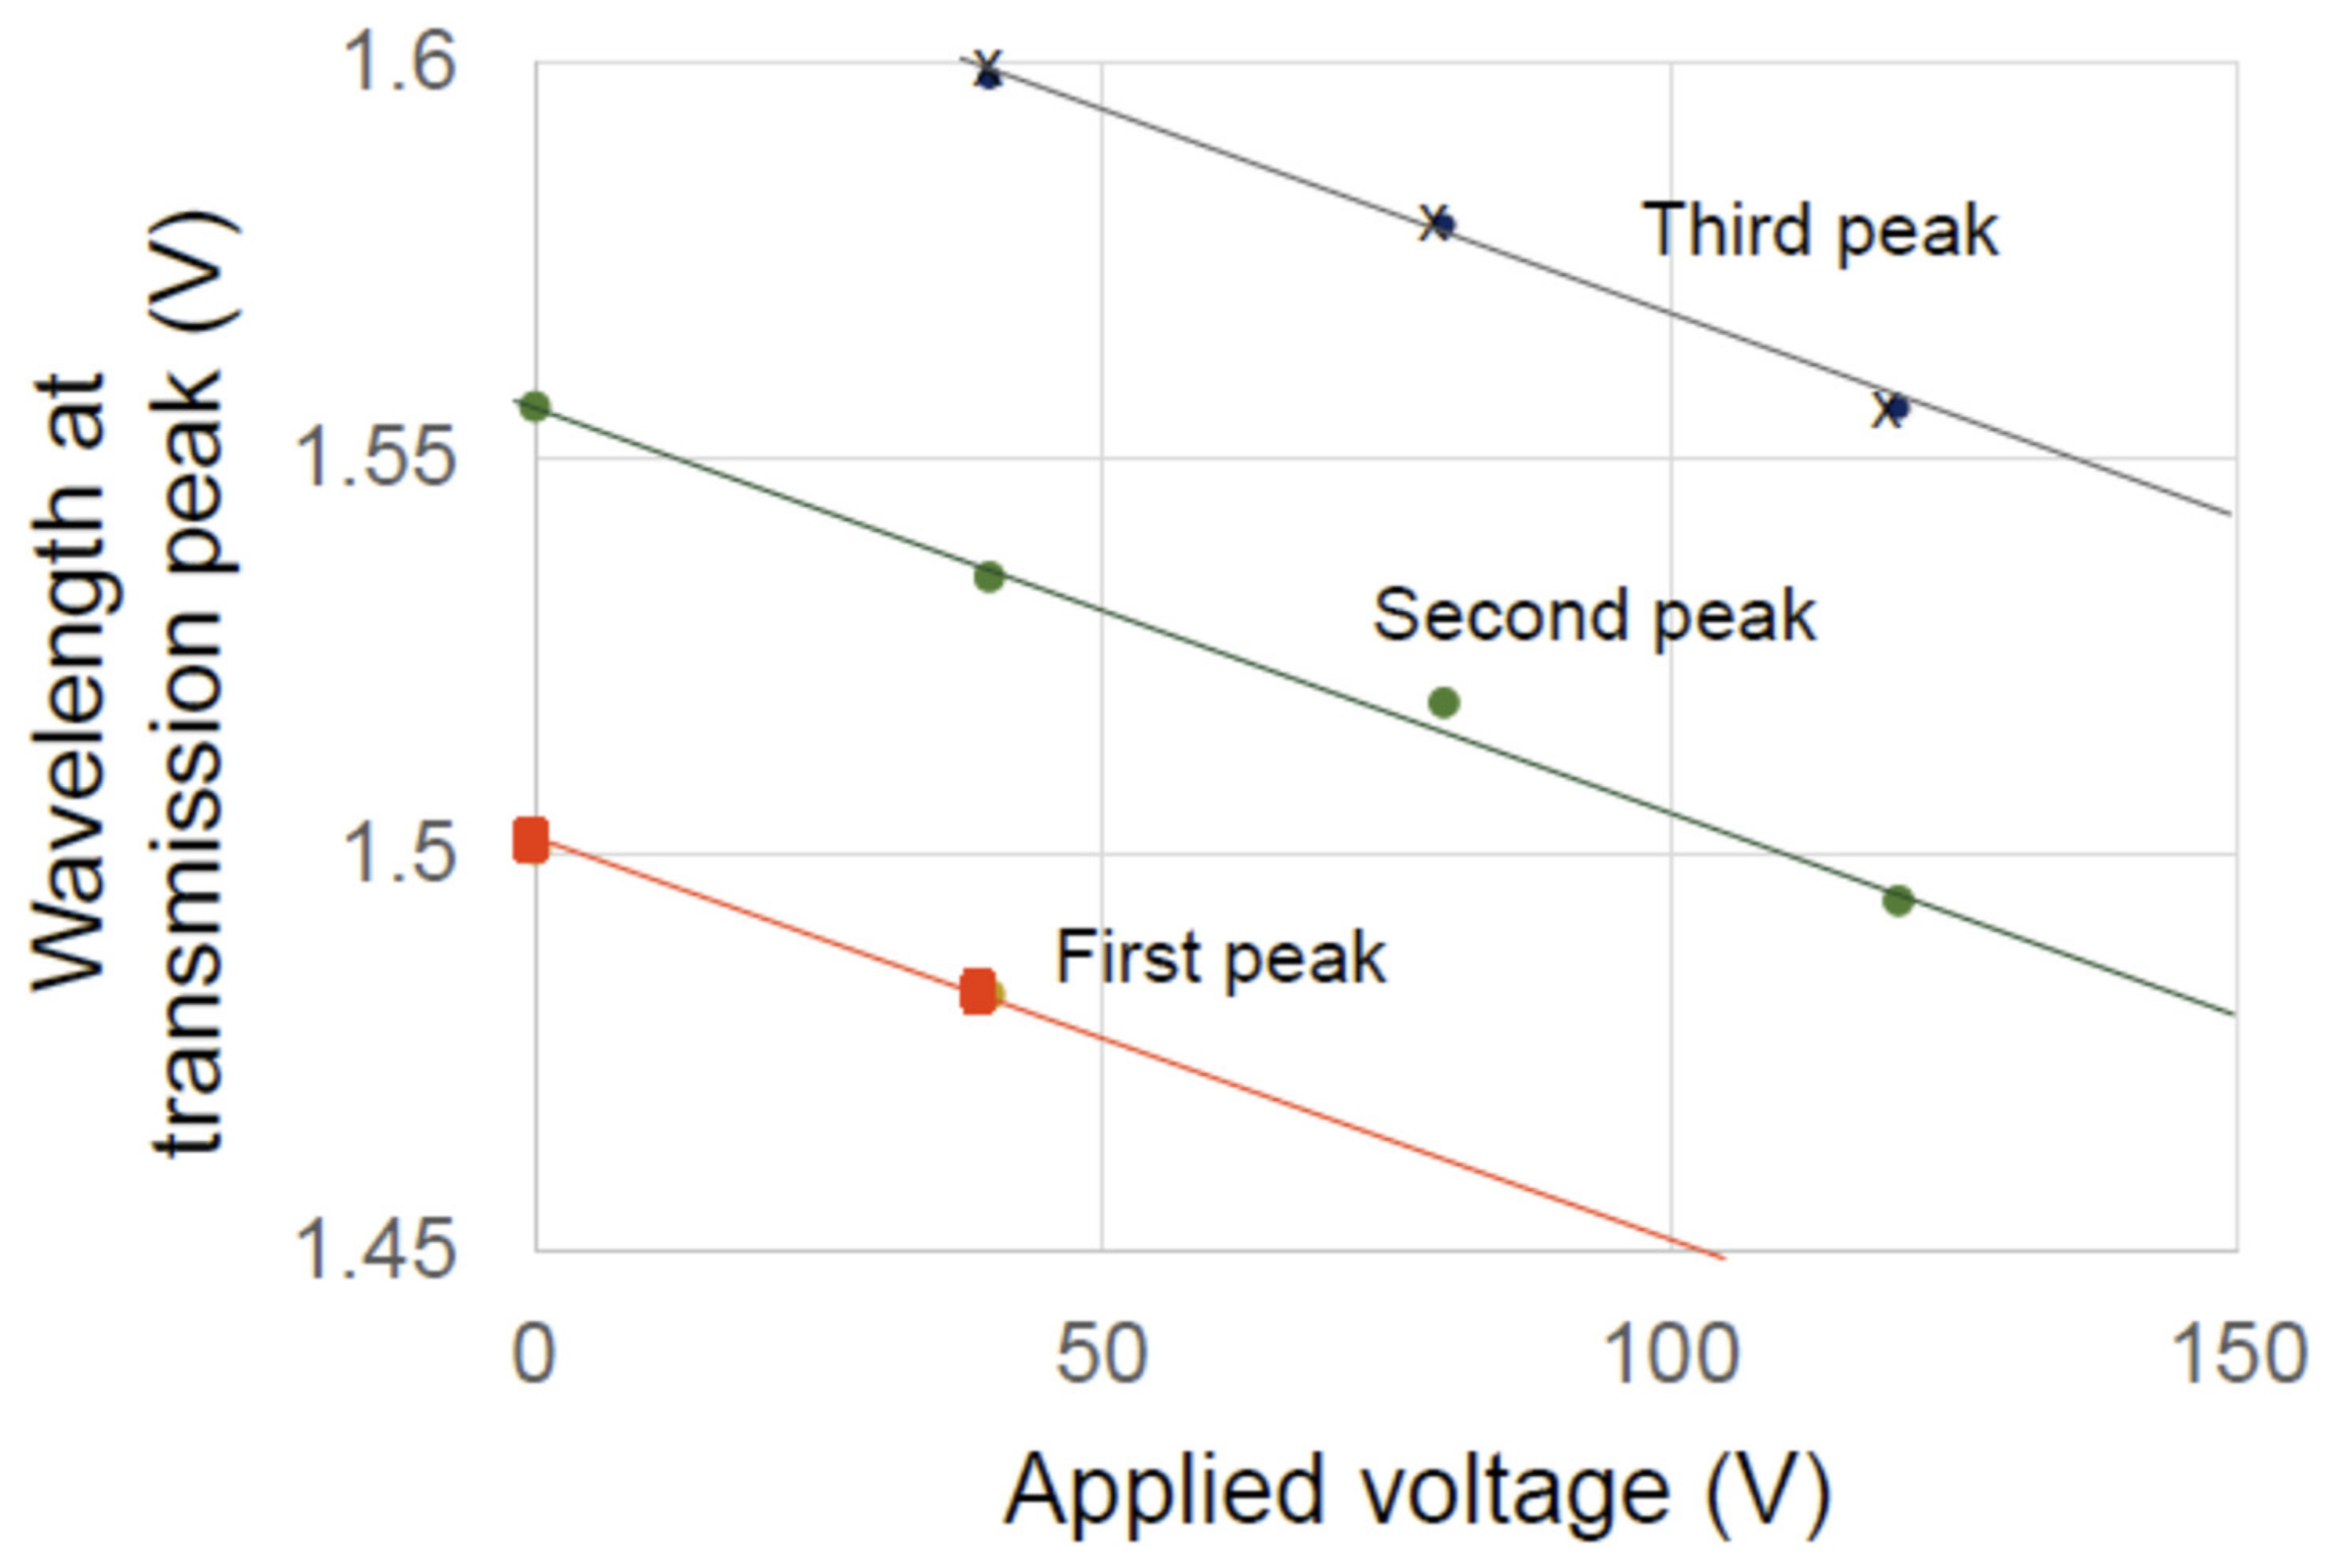
3. Experiments of a Variable Wavelength Filter

A cross-sectional schematic of the WSF is shown in Figure 5. A test cell of WSF was developed as follows: On two glass substrates, we deposited a dielectric mirror of six-pair layers of silicon oxide and titan oxide as high and low refractive index material, respectively, and a layer of indium tin oxide as transparent electrode that was placed inside the mirrors. Each layer of silicon oxide and titan oxide has a thickness (optical length) of quarter of the wavelength of 1.5 µm. We designed the cells, assuming that refractive index of titan oxide is 2.2 and that of silicon oxide is 1.4. The two glass substrates were fixed with 10 µm thick spacers and adhesive, which are not shown in Figure 5 to omit complexity. The precursor mixture was injected into a Fabry–Perot etalon at 110 °C for the TE-2FF:E8 ratio of 1:1 and 1:2 and at 95 °C for the ratio of 1:2.5, 1:3, and 1:4. Then, the cell was irradiated with 365 nm and 1.5 mW/cm2 UV light for 20 min to be polymer-stabilized in the etalon. Finally, we sealed the cell and bonded electric wires for measurements. The PSBP thickness was estimated to be larger than the spacer thickness of 10 µm and its refractive index was approximately 1.4.
To test the cells, we employed an optical spectrum analyzer with a built-in broadband light source. Light from the light source was fed through a single-mode optical fiber to be a parallel beam after passing through a focusing lens. The light beam was incident on the cell and concentrated and fed into the optical spectrum analyzer with another lens and another single-mode optical fiber. The measurement configuration was setup in a box so that the optical measurement was measured stably. No matching oil was employed in the setup. Figure 6 shows measured transmission spectra of the developed device at the applied voltages of 0 (blue), 40 (green), 80 (yellow), and 120 (red) V. The applied electric signal was alternative current at an audio frequency. The light was not polarized and the temperature was 27 °C. We evaluated only the cell with the TE-2FF:E8 of 1:4. At 0 V, the spectrum shows a curve similar to the square of sinusoidal function. The peak transmission wavelength decreases clearly as the applied voltage increases. The developed device functioned successfully as a WSF; however, the maximum transmission is as low as 2.2% and the half-bandwidth is 23 nm. The low transmission suggests that absorption may occur in the etalon, which will be discussed in Section 4.
Peak-transmission wavelength dependence on the applied voltage is shown in Figure 7. It is found from these results that the peak-transmission wavelength shifts to shorter wavelength as the applied voltage increases. The tuning of the resonant wavelength was expected from the Kerr effect by which refractive indexes change due to the applied voltage across the PSBP. A shift was calculated to be approximately −0.5 nm/V. The maximum shift observed was 62 nm for a 120-V voltage change and large enough for the WDM system applications. To achieve a tuning range of 7 nm to be employed in the dense WDM downlink system [4], the developed WSF can be operated at 13.5 V. The sample was capacitive and insulated electrically so that the power consumption was too small to be measured.

4. Discussion

We achieved a 1.5 µm WSF with low-voltage operation and low-power consumption by using PSBP while we should analyze some data in this section. We have to make it clear of what degrades the peak transmission since a theoretical value of transmission of the absorption-free Fabry–Perot etalon is 100%. The absorption in mirror materials, silicon oxide and titan oxide, is negligible at a 1.5 mm wavelength. On the other hand, the transparent electrodes of indium tin oxide are reported to have some absorption in the telecommunication wavelength [12]. Such transparent electrodes are employed in some optical telecommunication devices although they are not used in a cavity. The light has to reflect multiplicatively inside the Fabry–Perot etalon cavity, which weakens the light intensity in general. In addition to the light absorption in the cavity and mirrors, fabrication errors, reflection at the glass substrates, and error in an incident angle are degradation factors of Fabry–Perot etalon performances.
Our current analysis model is based on the internal light absorption. We calculated the theoretical transmission spectrum (blue), as shown in Figure 8, assuming that the transparent electrodes have an extinction coefficient of 0.16. Characteristic matrix was modeled for each layer of the dielectric mirrors and transparent electrodes [13,14,15]. The calculated and experimental spectra (orange) exhibit similar curves with coincidence of low transmission and wide bandwidth. Our model or the calculated spectrum is traced close to the experimental spectrum. The internal light absorption in the transparent electrodes may be one of the candidates to explain the transmission attenuation. Our future research will focus on the improvement of this model by placing the electrodes outside of the cavity. Our preliminary analysis suggests that the maximum transmission will be improved.

5. Conclusions

The use of polymer-stabilized blue phase (PSBP) was investigated to develop a voltage-controlled wavelength selective filter for WDM optical fiber network. It was found that a tolane-type liquid crystal introduction can increase both the blue-phase temperature range and the Kerr coefficient. A Fabry–Perot etalon filled with PSBP functioned as the wavelength selective filter, as expected. The tuning wavelength range was 62 nm at a 1.5 µm wavelength with the applied voltage from 0 to 120 V. The peak transmission was not as high as expected; however, we found the intensity attenuation may come from absorption in the transparent electrodes. We could improve the transmission with a newer structure, where the transparent electrodes are to be placed outside the cavity.

Author Contributions

S.F. carried out most of the optical measurements and wrote the manuscript. K.T. analyzed Fabry–Perot etalon characteristics. T.M., H.H. and Y.O. prepared the sample cells and made some measurements. H.K. supervised the project, especially at the material study. H.T. proposed the device configuration and fabricated the Fabry–Perot etalon substrate with transparent electrodes. All authors have read and agreed to the published version of the manuscript.

Funding

This research was funded by the Cooperative Research Program of Network Joint Research Center for Materials and Devices, grant numbers 20191316, 20201325, and 20211364.

Data Availability Statement

After publication, the data will be uploaded to https://www.eee.kagoshima-u.ac.jp/~fuku-lab/.

Acknowledgments

The authors would like to thank Fukutaro Yonekura for his technical assistance and Toshio Watanabe for fruitful discussion on telecommunication progress.

Conflicts of Interest

The authors declare no conflict of interest.

References

  1. Basch, E.B.; Egorov, R.; Gringeri, S.; Elby, S. Architectural tradeoffs for reconfigurable dense wavelength-division multiplexing systems. IEEE J. Sel. Top. Quantum Electron. 2006, 12, 615–626. [Google Scholar] [CrossRef]
  2. Gringeri, S.; Basch, B.; Shkia, V.; Egorov, R.; Xia, T.J. Flexible architecture for optical transport nodes and networks. IEEE Commun. Mag. 2010, 48, 40–50. [Google Scholar] [CrossRef]
  3. Tasaki, K.; Tokumaru, M.; Watanabe, T.; Nagayama, T.; Fukushima, S. Nested Mach-Zender interferometer optical switch with phase generating couplers. Jpn. J. Appl. Phys. 2020, 59, SOOB04. [Google Scholar] [CrossRef]
  4. Hattori, K.; Nakagawa, M.; Katayama, M.; Kani, J. Passive optical metro network based on NG-PON2 system to support cloud edges. IEICE Trans. Commun. 2019, E102B, 88–96. [Google Scholar] [CrossRef]
  5. Lin, L.Y.; Shen, J.L.; Lee, S.S.; Wu, M.C.; Sergent, A.M. Tunable three-dimensional solid Fabry-Perot etalons fabricated by surface-micromachining. IEEE Photon. Technol. Lett. 1996, 8, 101–103. [Google Scholar] [CrossRef] [Green Version]
  6. Domash, L.; Wu, M.; Nemchuk, N.; Ma, E. Tunable and switchable multiple-cavity thin film filters. J. Lightwave Technol. 2004, 22, 126–138. [Google Scholar] [CrossRef]
  7. Sneh, A.; Johnson, K.M. High-speed continuously tunable liquid crystal filter for WDM networks. J. Lightwave Technol. 1996, 14, 1067–1080. [Google Scholar] [CrossRef]
  8. Yamazaki, H.; Fukushima, S. Holographic switch with a ferroelectric liquid-crystal spatial light modulator for a large-scale switch. Appl. Opt. 1995, 34, 8137–8143. [Google Scholar] [CrossRef] [PubMed]
  9. Fukushima, S.; Ariki, K.; Yoshinaga, K.; Higuchi, H.; Kikuchi, H. Infrared extinction of a dye-doped (polymer/liquid crystal) composite film. Crystals 2015, 5, 163–171. [Google Scholar] [CrossRef] [Green Version]
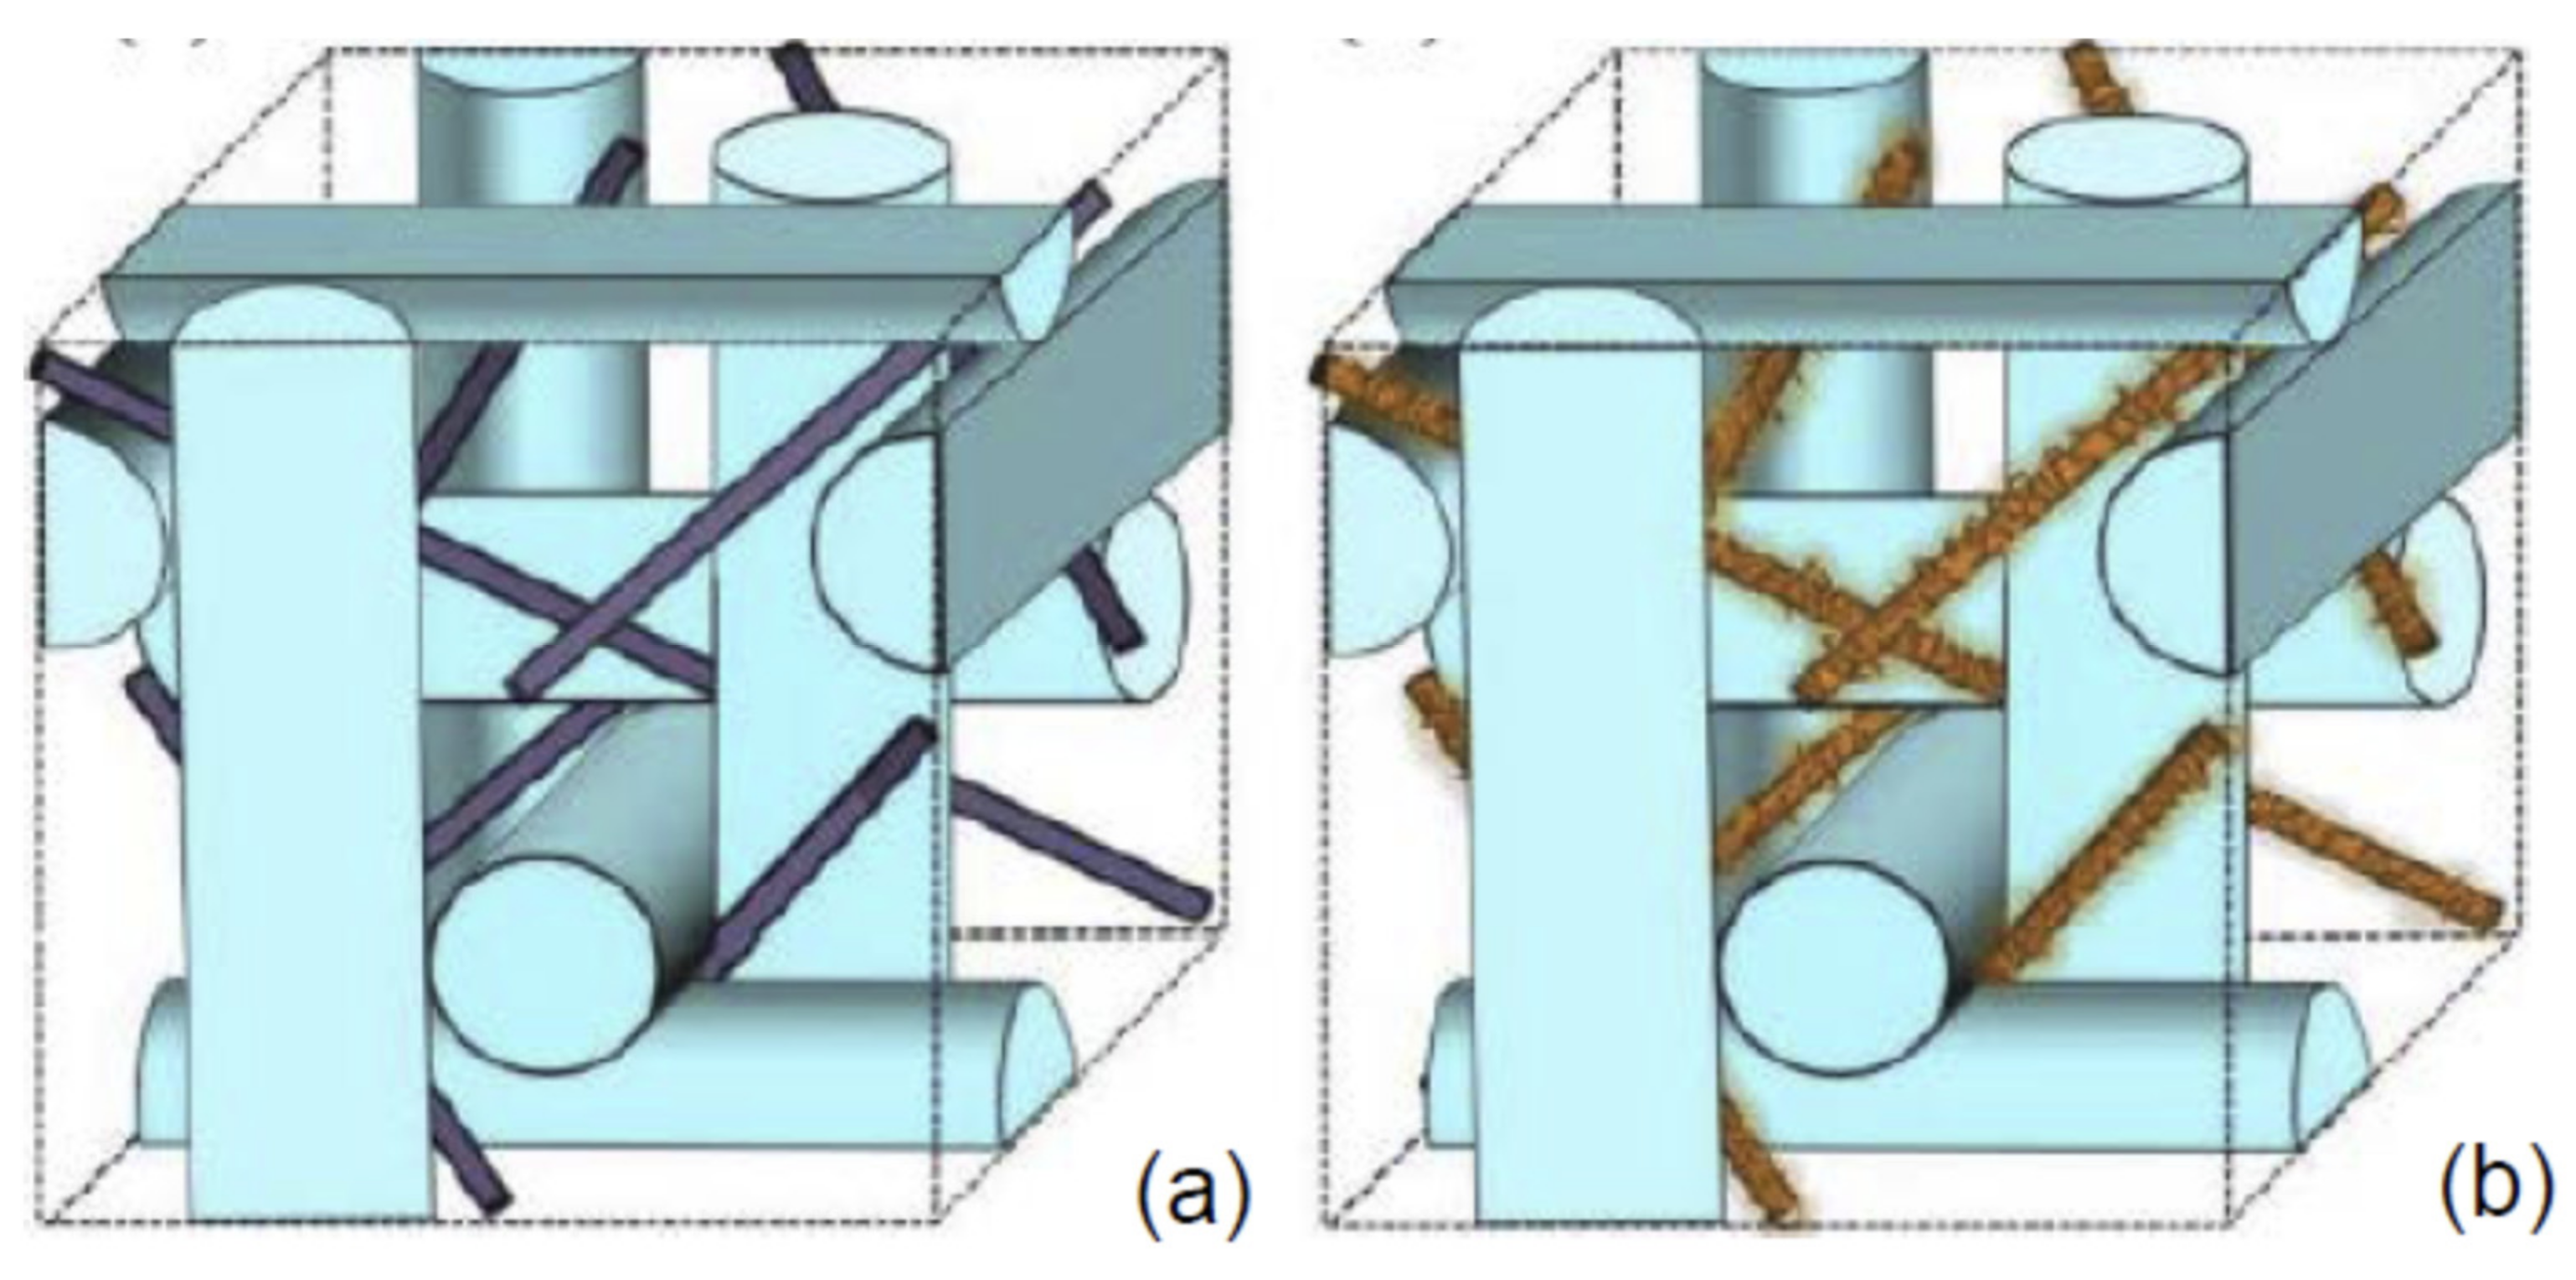
  10. Kikuchi, H.; Yokota, M.; Hisakado, Y.; Yang, H.; Kajiyama, T. Polymer-stabilized liquid crystal blue phases. Nat. Mater. 2002, 1, 64–68. [Google Scholar] [CrossRef] [PubMed]
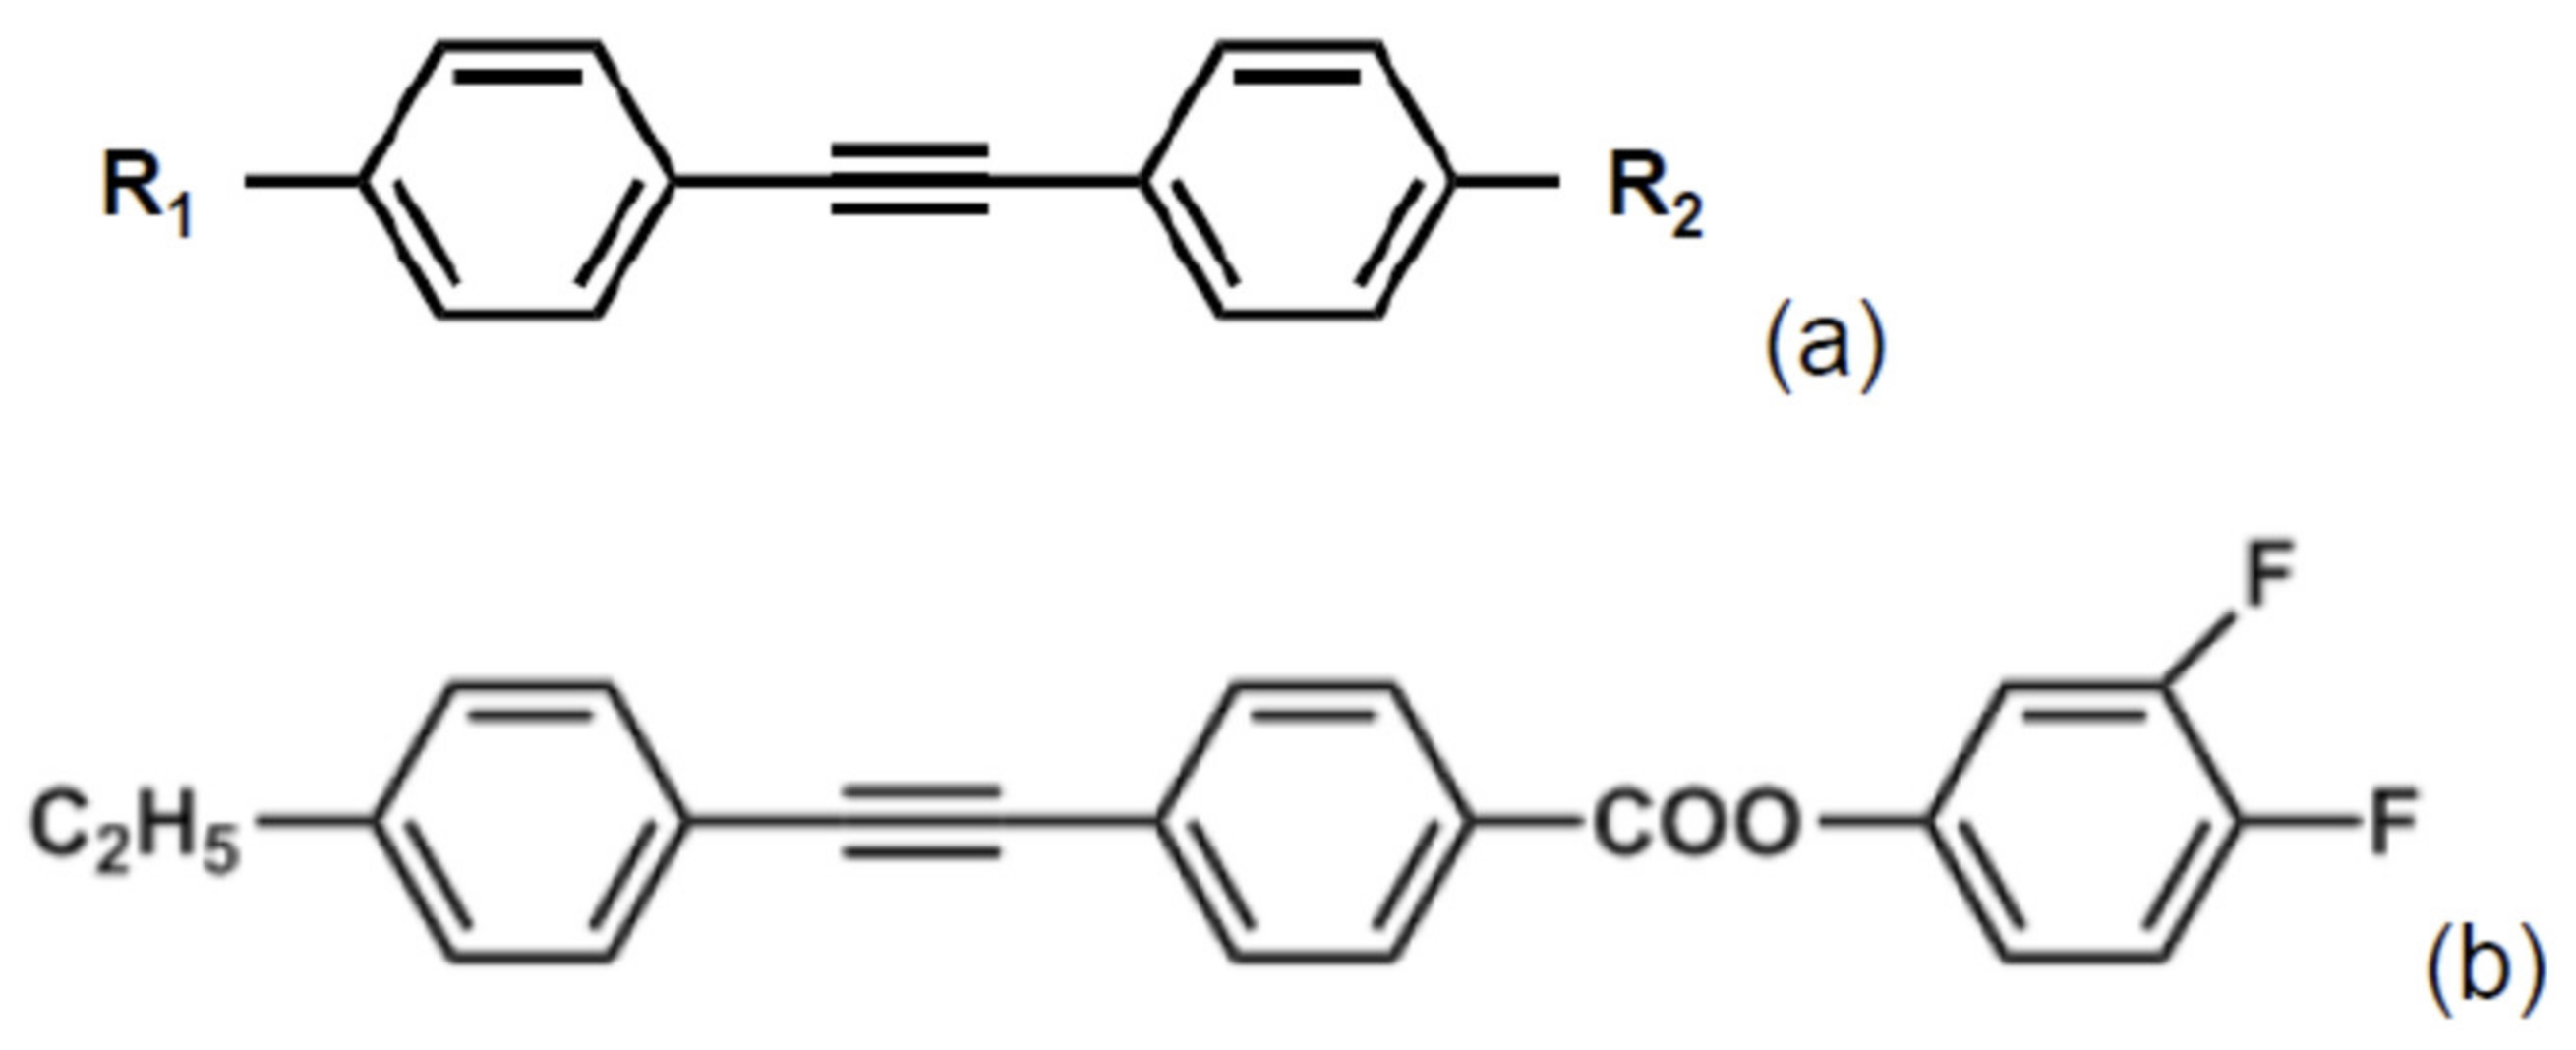
  11. Morishita, T.; Higuchi, H.; Tazawa, H.; Fukushima, S.; Okumura, Y.; Kikuchi, H. Polymer-stablized blue phases including tolane-type liquid crystal molecules for large Kerr effect. In Proceedings of the International Liquid Crystal Conference (ILCC 2018), Kyoto, Japan, 22–27 July 2018. paper PI-C2–38. [Google Scholar]
  12. Hirabayashi, K.; Tsuda, H.; Kurokawa, T. Tunable liquid-crystal Fabry-Perot interferometer filter for wavelength-division multiplexing communication systems. J. Lightwave Technol. 1993, 11, 2033–2043. [Google Scholar] [CrossRef]
  13. Born, M.; Wolf, E. Principles of Optics, 7th ed.; Cambridge University Press: Cambridge, UK, 1999. [Google Scholar]
  14. Tsuda, H.; Fukushima, S.; Kurokawa, T. Optical triode operation characteristics of nonlinear etalons. Appl. Opt. 1991, 30, 5136–5142. [Google Scholar] [CrossRef] [PubMed]
  15. Fukushima, S.; Kurokawa, T.; Ohno, M. Ferroelectric liquid-crystal spatial light modulator achieving bipolar image operation and cascadability. Appl. Opt. 1992, 31, 6859–6868. [Google Scholar] [CrossRef] [PubMed]
Figure 1. (a) Sketch of blue-phase liquid crystal with some disclination lines (blue) and (b) polymer-stabilized blue-phase liquid crystal. Polymer network (brown) is constructed along the disclination lines.
Crystals 11 01017 g001
Figure 2. (a) Molecule sketch of a general tolane-type liquid crystal and (b) TE-2FF.
Crystals 11 01017 g002
Figure 3. (a) Phase diagram of our mixture before UV irradiation and (b) after UV irradiation; that is, the mixture is already polymer-stabilized.
Crystals 11 01017 g003
Figure 4. Normalized transmission versus the applied voltage for the tolane-type mixture and the conventional mixture (5CB:JC1041XX). The latter is simply described as 5CB:JC in the figure.
Crystals 11 01017 g004
Figure 5. Cross-sectional schematic of the proposed variable wavelength filter.
Crystals 11 01017 g005
Figure 6. Transmission spectra of the developed wavelength selective filter.
Crystals 11 01017 g006
Figure 7. Wavelength at transmission versus the applied voltage. Data for three peaks are plotted.
Crystals 11 01017 g007
Figure 8. Transmission spectra of the experimental and calculated results with no applied voltage.
Crystals 11 01017 g008
Table 1. Composition in our blue phases.
MixtureChemical Materialwt%
Host LC (92 wt%)NLC: E8 (Merck)x
NLC: TE-2FF92.5 − x
Chiral dopant: s-[4’-(hexyloxy)-phenyl-4-carbonyl]-1,4;3,6- dianhydride-D-sorbitol(ISO-(6OBA)27.5
Polymer (8 wt%)Mono-functional monomer: Dodecyl acrylate (C12A, Wako)38.4
Bi-functional monomer: 2-methyl-1,4-phenylene-bis(4-(3-(acryloyloxy)propyloxy)benzoate) (RM257, Merck)57.6
Photo initiator: 2,2-dimethoxy-2-phenylacetophenone (DMPAP, Aldrich)4.0
Publisher’s Note: MDPI stays neutral with regard to jurisdictional claims in published maps and institutional affiliations.

