Article

Automatic Identification and Quantitative Characterization of Primary Dendrite Microstructure Based on Machine Learning

1
Beijing Advanced Innovation Center for Materials Genome Engineering, Central Iron & Steel Research Institute, Beijing 100081, China
2
Beijing Key Laboratory of Metal Materials Characterization, NCS Testing Technology Co., Ltd., Beijing 100081, China
3
Qingdao NCS Testing & Corrosion Protection Technology Co., Ltd., Qingdao 266071, China
4
Science and Technology on Advanced High Temperature Structural Materials Laboratory, Beijing Institute of Aeronautical Materials, Beijing 100095, China
*
Author to whom correspondence should be addressed.
Submission received: 5 August 2021 / Revised: 23 August 2021 / Accepted: 24 August 2021 / Published: 2 September 2021
(This article belongs to the Special Issue Advances in Alloys and Intermetallic Compounds)

Abstract

:
Dendrites are important microstructures in single-crystal superalloys. The distribution of dendrites is closely related to the heat treatment process and mechanical properties of single-crystal superalloys. The primary dendrite arm spacing (PDAS) is an important length scale to describe the distribution of dendrites. In this work, the second-generation single crystal superalloy HT901 with a diameter of 15 mm was imaged under a metallurgical microscope. An automatic dendrite core identification and full-field quantitative statistical analysis method is proposed to automatically detect the dendrite core and calculate the local PDAS. The Faster R-CNN algorithm combined with test time augmentation (TTA) technology is used to automatically identify the dendrite cores. The local multi-directional algorithm combined with Voronoi tessellation is used to determine the local nearest neighbor dendrite and calculate the local PDAS and coordination number. The accuracy of using Faster R-CNN combined with TTA to detect the dendrite core of HT901 reaches 98.4%, which is 15.9% higher than using Faster R-CNN alone. The algorithm calculates the local PDAS of all dendrites in H901 and captures the Gaussian distribution of the local PDAS. The average PDAS determined by the Gaussian distribution is 415 μm, which is only a small difference from the average spacing λ ¯ (420 μm) calculated by the traditional method. The technology analyzes the relationship between the local PDAS and the distance from the center of the sample. The local PDAS near the center of HT901 are larger than those near the edge. The results suggests that the method enables the rapid, accurate and quantitative dendritic distribution characterization.

Graphical Abstract

1. Introduction

Dendritic structures, which are mainly caused by the segregation of elements at the solid–liquid surface during the non-equilibrium solidification of the alloy, are the main characteristic structures of single-crystal superalloys [1,2,3]. Additionally, it is closely related to the solidification process [4,5,6] and properties (e.g., creep strength and fatigue life [7,8], mechanical properties [9,10], corrosion properties [11]) of the alloy. The primary dendrite arm spacing (PDAS) is one of the important quantitative characterization parameters of the microstructure in single-crystal superalloys [12,13,14].
The traditional method of calculating PDAS mainly relies on the number of dendritic structures on the plane of a sample and the area of the sample [15,16,17], which can be obtained by:
λ = C S N
where λ is PDAS (μm), S is the area of the sample to be counted (μm2), N is the number of dendrites on the plane of the sample to be counted, and C is a coefficient which depends on the primary dendrite arrangement. Equation (1) obtains an average dendrite spacing, which is a quantification of the overall dendrite distribution in a specified field of view and provides a unified parameter for establishing the mapping between dendrite distribution and process and properties. However, the complex distribution of dendrites will increase the difficulty of selecting the coefficient C. In addition, Equation (1) only gives the average value of PDAS rather than the local PDAs of each dendrite, which can quantify the inhomogeneity of dendrite distribution through statistical analysis. The inhomogeneity of single crystal composition and microstructures may lead to greater changes in properties, which is closely related to the asymmetric heat flux and transients in solidifications [18].
Therefore, in order to design a parameter that can reflect the local distribution uniformity of the dendrite, a variety of local PDAS calculation methods are defined [19,20,21]. Warnken et al. [19] presented a method for measuring the local dendrite arm spacing. The Warnken–Reed method calculates the local PDAS of a single dendrite core by defining a certain initial number of nearest neighbors, and iteratively adding potential nearest neighbors within the cut-off distance defined by the added nearest neighbors. However, when the standard deviation of the selected nearest neighbors is large, the number of nearest neighbors added iteratively may far exceed the number of true nearest neighbors (TNNs). Tschopp et al. [20] proposed the Voronoi tessellation method to calculate PDAS, which solves the problem of unlimited increase in nearest neighbors in Warnken–Reed; however, this provided no means to determine true nearest neighbors. In [21], Tschopp tried to use a four-fold symmetry algorithm to automatically identify the dendrite core. This method requires removing the background and manually defining the threshold, which requires extensive computational time.
The difficulty in calculating PDAS is to accurately identify dendritic cores and abstract it as a point on a two-dimensional image. Different components and different solidification processes will seriously affect the geometric morphology and distribution density of the dendrite structure, which will increase the unpredictable difficulty in identifying the dendrite core. The traditional method to determine the position of the dendrite core requires time-consuming manual identification, which will take 10 minutes to 0.5 h to label 100 dendrite cores, which mainly depends on the complexity of the dendrite.
In [22], Wang used the linear intercept method with concentric circles to calculate dendrite arm spacing. However, the method of estimating dendrite arm spacing by the distance between intercept points and the number of intercept points is an indirect and approximate estimation method of dendrite spacing. Although the method can quickly calculate PDAS, the error of the calculation result is difficult to control.
Miller et al. [23] provide a method for automatically identifying dendrite cores based on a skeletonization technique. The binary dendrite SEM images are eroded into multiple thin lines, and the intersections of the thin lines are judged as the dendrite cores. Although this method can automatically identify the dendrite core, the true accuracy of this algorithm is relatively low. This is mainly because the algorithm not only requires high-quality image segmentation, but also can only handle relatively regular geometric shapes.
Bogdan et al. [24,25,26] applied a DenMap technique which is based on pattern recognition algorithm. The algorithm locates the dendrite core through a Normalized Cross-Correlation (NCC [27]) algorithm and improves the recognition accuracy through a Fast Fourier Transform (FFT) [28] algorithm. DenMap automatically recognizes dendrite cores and can detect 506 dendrite cores with high accuracy within 90 seconds. However, this method requires complex pre-processing of the original SEM image, which requires the use of a variety of computer vision algorithms such as FFT, histogram equalization, noise removal, etc., which will increase a lot of calculation difficulties and calculation time. The calculation of NCC depends on the selection of templates, and the selection of different templates will inevitably bring different calculation results. The dendrites and background textures of different materials or different positions in the same piece of material may have large differences, which may seriously affect the accuracy of the judgment of the position of the dendrite core.
At present, the main automatic identification technologies of dendrite cores mainly rely on manually defining features [23] or templates [24,25,26] and using classic pattern recognition algorithms to identify objects of interest. However, this type of algorithm requires complex pre-processing and post-processing, which increases the difficulty of use and limits the scope of use. The single-crystal superalloy microscopic images have complex backgrounds and features, which are difficult to accurately identify through the pattern-recognition algorithm of manually defined features and templates. Therefore, this paper develops an intelligent end-to-end feature extraction algorithm to replace the template matching algorithm that requires complex pre-processing and post-processing, so as to quickly and accurately identify dendrite cores in complex backgrounds.
In this work, we utilize the test time augmentation (TTA [29]) Faster R-CNN [30] technique, which is an object-recognition algorithm based on deep learning [31,32,33], to quickly and accurately detect dendrite cores, then apply Voronoi tessellation combined with a local multi-directional algorithm to calculate true local PDAS, thereby creating a map of the distance from the center of the circle and local PDAS over the sample surface.
TTA is an application of data augmentation to the test dataset. For the Faster R-CNN model that has been trained, the new method uses TTA to pre-define the input of the model to obtain multiple augmented outputs and calculate the average of the repeated outputs to obtain the recognition result. This method can effectively improve Faster R-CNN’s recognition accuracy of dendrite cores without changing the original model. We use the Voronoi tessellation method combined with local multi-directional algorithm to calculate the local PDAS of all dendritic cores. The Voronoi tessellation method determines the nearest neighbors for each extracted dendrite core, and the local multi-directional algorithm deletes the TNNs misjudged by the Voronoi tessellation method and calculates the local PDAS. Finally, for all local PDAS, statistical analysis is carried out from different directions such as surface distribution, Gaussian distribution, line distribution, etc., and its deep information is excavated.
TTA Faster R-CNN is the first object recognition network used to identify dendrite cores. This deep learning-based method can automatically, quickly and accurately identify dendrite cores. Among them, TTA is an application of data augmentation to the test dataset. In this work, the combination of TTA and Faster R-CNN is used to reduce the misjudgment of similar features (such as dendrite cores and dendrite arms) by Faster R-CNN. The local multi-directional method delineates the area for the neighbors of the dendrite, and at most one neighbor can exist in each area. The combined use of a local multi-directional direction and Voronoi tessellation method can effectively reduce the misjudgment of TNNs.
The method can quickly, accurately, and robustly detect dendrite cores. The most important thing is that the new method can directly process the original image without complicated processing. The quantitative statistics and analysis of the local PDAS distribution of single crystal superalloys provide new information for the distribution of dendrites, which helps researchers to establish a reliable mapping relationship between the process and the organization. Due to the strong self-learning ability and generalization ability of neural network, this method is suitable for the identification of all microstructures with similar dendrite structures. Combined with quantitative statistical analysis, the method has the potential to accurately and quickly collect a large amount of structural data, allowing the optimization and quality control of industrial processes to improve the mechanical and creep properties of materials.

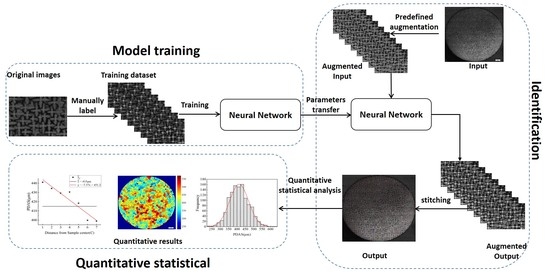
2. Materials and TTA Faster R-CNN Algorithm

2.1. Experimental Data

The research uses nickel-based single crystal superalloys as the research object. In this work, we used an optical microscope (Leica DM6000M, Leica Microsystems CMS GmbH, Germany) to obtain the microscopic images containing dendrites instead of using an electron microscope as in [23,24], which will reduce the time required to collect image data. The elements of HT901 are measured by the following methods: Cr: NACIS/CH 116:2013; CO, Re, Al: NACIS/CH 008:2013; C: ASTM E1019-18; Ta, Mo, W: NACIS/CH 010: 2013; Hf: NACIS/CH 012:2013; B: ASTM E2594-2009(2014). Each element is measured 3 times, and the corresponding standard deviation of the measured value of each element is: C: 0, Cr: 0.01, Mo: 0.01, Al: 0.002, B: 0, Co: 0.002, Hf: 0.0004, Re: 0.003, Ta: 0.03, W: 0.02. The composition of HT901 is shown in Table 1. To collect microscopic images containing the dendrite, metallographic sample preparation, polishing, and chemical etching were first performed to make the surface show the complete dendritic structure. Then, metallographic chemical corrosion was conducted using an alcohol solution with 2.0–5.0% copper sulfate (m/V) and 50–70% hydrochloric acid (V/V), or an aqueous solution with 1.0–30.0% hydrofluoric acid (V/V), 20–40% nitric acid (V/V), and 30–40% glacial acetic acid (V/V) for 0.3 min–2 min.
The dataset contains 225 grayscale images with a pixel size of 1024 × 1024. Figure 1 shows the metallographic images of HT901. We stitched 225 small-field images into the full-field metallographic images of HT901, as shown in Figure 2b. Twenty-three images were randomly selected from the dataset and manually labeled as training data, and the remaining data were used as test data to test the performance of the model.

2.2. TTA Faster R-CNN Algorithm

2.2.1. Faster R-CNN

Currently, the bottleneck of calculating the PDAS is to find a method to locate the dendrite core quickly, accurately, and stably. The manual identification method consumes too much time and is not suitable for processing large amounts of data. At present, the existing technology to automatically locate the dendrite core mainly relies on pattern recognition whose key algorithm is the traditional computer vision algorithms, such as the skeleton extraction algorithm, the template matching algorithm, etc. However, pattern-recognition technology based on traditional computer vision algorithms requires complicated pre-processing and post-processing. The most important thing is that when extracting features of interest, these algorithms need to manually define the template of the feature, and the manually defined template can hardly contain all the characteristics of this type of feature.
In the research, Faster R-CNN, an end-to-end target recognition network based on deep learning, is used as the key algorithm for locating dendrite core. Compared with the traditional pattern recognition algorithm, the advantages of faster R-CNN are as follows: (1) The whole calculation process is carried out inside the network, which can make full use of the parallel computing capability of GPU, thus saving calculation time. (2) End-to-end processing reduces most complicated pre-processing and post-processing. (3) An automatic optimized feature extraction network has better ability in extracting potential features.
The Faster R-CNN consists of three parts: the feature extraction network, regional proposal network (RPN), and fully connected layers, as shown in Figure 3. Object detection consists of two tasks: predicting the target category and calculating the object location. The network achieves these tasks by outputting position information represented by an array and a probability related to the category. To improve the performance of the detection model, back propagation based on gradient descent is used to optimize the network weight.

2.2.2. TTA Faster R-CNN

TTA is a simple and effective data augmentation method which can improve the accuracy of test results. Typically, data augmentation is performed when a model is being trained. However, TTA is a data augmentation strategy used at test time to obtain greater robustness and improved accuracy. The advantage of TTA is that it is simple to put into practice, makes no change to the underlying model, and requires no additional data.
In this work, we use the trained Faster R-CNN combined with TTA to complete the detection task of the dendrite cores, as shown in Figure 4. During the testing process, each input undergoes multiple data augmentation transformations, turning one input into multiple inputs, and Test-Time Augmentation entails pooling predictions from several transformed versions given of a test input to obtain a smoothed prediction. For example, as shown in Figure 5, one could average the predictions from various translation versions, so that the final prediction is robust.

3. Results

The PDAS is closely related to the solution heat treatment times and mechanical properties of the material. Additionally, it is the most important length scale in directionally solidified single-crystal alloys. Current methods of calculating mean primary spacing utilize the counting method, as shown in Equation (1). However, the counting method provides no way of determining the local PDAS or the PDAS distribution. Since the dendrites are only affected by their true nearest neighbors (TNNs), an accurate identification of TNNs is a prerequisite for accurately describing the effects of local solidification conditions on the microstructure. Tschopp et al. [20] provided a technique by applying Voronoi Tessellation to calculate local PDAS, but it provided no means to determine true nearest neighbors. Tschopp et al. [21] used a four-fold symmetry algorithm to automate the dendritic core selection process. However, this method requires complex operations and extensive computational time.

3.1. Automatic Dendrite Core Recognition

A heat-treated single crystal bar sample, with a diameter of 15 mm, was provided as the research object. The bar was sectioned using normal metallographic techniques and imaged on a metallurgical microscope. Current dendrite core detection methods require time-intensive laborious manual determination of the dendrite cores. In this work, simple, fast, and accurate dendrite core detection technology is achieved using neural networks.
Faster R-CNN is an end-to-end neural network algorithm that can directly process complex raw metallographic images, as shown in Figure 6a, and directly return a result marked with a dendrite core, as shown in Figure 6b. It takes only 0.1 s to recognize a picture.
However, since the gray scale of the dendrite core is similar to that of the dendrite arms, and the background of the original image is very complicated, this will directly affect the accuracy of the Faster R-CNN to detect the dendrite core. In fact, the detection results of Faster R-CNN show that there are many dendrite cores that cannot be identified, as shown in Figure 7a. In order to solve this problem, this paper adds the TTA process to the original detection model. Figure 7b shows the dendrite core detection results after using TTA. The detection model after TTA successfully identified most of the dendrite cores that were not recognized by the original detection model.
In this work, we used Faster R-CNN and TTA Faster R-CNN to detect and count the dendrite cores in the full field of view of HT901, as shown in Figure 8. The image in Figure 2b has a size of 15,360 × 15,360 pixels, including a complete circular cross section of HT901 with diameter of 15 mm. The total processing time from loading the image to plotting the result is 24.5 s, run on a PC (IW4202-4G, SITONHOLY, China) with Windows 10 (Intel® Xeon® CPUE5-2690 v4 @ 2.40 GHz; 64 GB RAM; NVIDIA GeForce RTX3090). A total of 1154 dendrite cores were identified, of which 1147 were correct, 7 were wrong, and 12 real dendrite cores were not identified. In order to quantitatively compare the dendrite core recognition accuracy of the two methods, we counted the accurate number of dendrite core recognition (TP, True Positive), the number of missed detections (FN, False Negative), and the number of false detections (FP, False Positive) and calculated the recognition accuracy, as shown in Table 2. The statistical result shows that the improved detection model has a greater improvement than the original model in terms of accuracy and number of dendrite cores.
In order to verify the generalization ability of this method, the research uses the metallographic images of other three nickel-based single crystal superalloy bars as verification data, and counts their identification results, as shown in Table 3. The statistical results show that TTA Faster R-CNN remains a very high accuracy, which proves the robustness of this method.

3.2. Statistical Results

The Voronoi tessellation algorithm provided a method to limit the maximum nearest neighbors; however, it provided no means to determine the true nearest neighbors. In this work, we utilized a local multi-directional algorithm combined with the Voronoi tessellation algorithm to calculate true local nearest neighbors. The two-dimensional space was divided into k sections in the full-field image with the dendrite core as the origin. In this work, k was defined as 8, and the interval division was designed as an equal angle division, as shown in Figure 9. First, the neighbors of each dendrite core were calculated by the Voronoi tessellation, then the true nearest neighbors were selected by multi-directional algorithm.
The results from the application of the Voronoi tessellation method combined with a local multi-directions algorithm to the HT901 single-crystal microstructure are shown in Figure 10. The distribution of dendrite spacing is not uniform, as shown in Figure 10a. The result demonstrates that the smaller PDAS is more likely to appear near the edge of the sample.
Most of the areas in Figure 10b are covered by hexagons (N6) and pentagons (N5), and the remaining areas are filled with a small amount of heptagonal (N7), square (N4), triangular (N3) and octagonal (N8).
The statistical results of local PDAS are shown in Figure 11a. The algorithm calculates the local PDAS of the dendrites and captures the gaussian distribution of all local PDAS. The average local PDAS λ ¯ is determined to be 415 µm. For comparison, the average dendrite spacing λ ¯ calculated by the traditional method is equal to 420 μm, and a C coefficient equal to 1.075 is used in the calculation process. The λ ¯ calculated by the local PDAS is very close to the λ ¯ obtained by the traditional method. The slight difference between the two is likely due to C = 1.075 for an ideally packed hexagonal array [16]. The local multi-directional method and the close match with the classical method mean that the local multi-directional algorithm can successfully remove the first nearest neighbor dendrites that are incorrectly captured by the polygon mosaic method. Therefore, the algorithm can successfully capture the influence of solidification conditions on the local dendrite neighborhood and provide more analyzable data for single crystal research. Figure 11b quantitatively counts the frequency of coordination number determined in Figure 10b. For HT901, the largest detected coordination number frequency is 6 and 5, accounting for 73.2% of all dendrites.
The relationship between local PDAS and coordination number is shown in Figure 12. The location with a small coordination number corresponds to a relatively small local PDAS, and the location with a large coordination number corresponds to a relatively large local PDAS. Figure 11a determines the λ ¯ as 415 μm, and the local dendrite spacing closest to λ ¯ is the dendrite whose coordination numbers are equal to 5 and 6, as shown in Figure 12.
Figure 10a demonstrates that the distribution of dendrite spacing is not uniform. We divided the HT901 sample from the center into seven rings of equal width along the radius direction to quantify this unevenness, as shown in Figure 13. The average local PDAS in each ring in Figure 13 are calculated, and the result is shown in Figure 14. The average PDAS has a downward trend from the center to the edge of the sample, as shown in Figure 14. Figure 14 shows that the closer to the center of the HT901 sample, the sparser the distribution of dendrites. Conversely, the closer to the edge, the denser and more uneven the distribution of dendrites. This is closely related to the first cooling at the edge of the sample bar and the final cooling at the center of the sample bar during the heat treatment process.

4. Discussion

The PDAS is an important length scale of single-crystal superalloys, which is closely related to the solution heat treatment time and cooling rate. The object of our work is to find a simple, accurate, and fast way to calculate and statistically characterize the PDAS.
TTA Faster R-CNN identified 1154 dendritic cores from the circular cross-sectional image of a single-crystal superalloy with a diameter of 15 mm or a size of 15,360 × 15,360 within 24.5 s, with an accuracy rate of 98.4%. The time for DenMap to identify 506 dendritic cores from a single-crystal superalloy image with a size of 8947 × 9271 pixels is 89.41 s [24]. The skeletonization [23] method took 643 s to identify the dendrite cores in the HT901, and the accuracy of the identification was only 37.3%, which was mainly caused by the uneven morphology and distribution of the dendrite structure of the HT901. Considering the accuracy, speed, difficulty of operation, and other related performances of dendrite core recognition, TTA Faster R-CNN has a better performance, mainly because the neural network has strong self-learning and generalization capabilities. However, TTA Faster R-CNN is a supervised learning algorithm, which requires some features to be labeled and learned before it can be used. For features with a small number, it is likely to be detected incorrectly because of too little or no labelling. For example, a small amount of secondary dendrite cores in HT901 will be misjudged as primary dendrite cores. Therefore, the recognition accuracy of dendrite cores can be continuously improved through certain post-processing. In addition, the development of an unsupervised learning-led dendrite core recognition and extraction algorithm is also an important direction to solve the current problem.
The research results of this work prove that the local dendritic core gradually decreases from the center of the sample to the edge area, as shown in Figure 14. This phenomenon may be caused by the uneven cooling rate of single-crystal superalloys during solidification [34]. The rod-shaped single-crystal superalloy has a low cooling rate in the central region, and a larger cooling rate at the edge, which will result in a larger primary dendrite spacing in the central region and a smaller primary dendritic spacing at the edge. This work only performs a statistical analysis of the distribution of the dendrite spacing of HT901. The subsequent work also needs to study the distribution of dendrite spacing in the larger size section and the distribution of the smaller size γ’ phase.

5. Conclusions

(1)
TTA Faster R-CNN was proposed to automatically select dendrite cores. The method detected 1154 dendritic cores in the single-crystal superalloy metallographic image with a size of 15,360 by 15,360 pixels within 24.5 s, and the recognition accuracy reached 98.4%, which was 15.9% higher than using Faster R-CNN alone.
(2)
The local multi-directional algorithm combined with the Voronoi tessellation method is used to calculate the local PDAS of the HT901. There is only a small gap between the average spacing defined by Gaussian distribution of the local PDAS and the average dendritic spacing calculated by the classical counting method, and the difference between the two is only 5 μm.
(3)
The technique can quantify the relationship between the local PDAS and the coordination number, and the result suggests that the local PDAS matched by a large coordination number is large.
(4)
The mapping of local dendrite spacing to the distance from the center of sample is quantitatively represented by this technique. The result suggests that the closer to the edge, the denser and uneven the dendrite distribution.

Author Contributions

Conceptualization: H.W.; Methodology: W.W. and D.L.; Software: W.W.; Validation: H.W. and X.S.; Formal analysis: W.W.; Investigation: W.W.; Resources: J.C. and C.X.; Data curation: W.W., L.Z. and D.S.; Writing—Original Draft preparation: W.W.; Writing—Review and Editing: H.W. and D.L.; Visualization: W.W. and D.S.; Supervision: H.W.; Project administration: L.Z. All authors have read and agreed to the published version of the manuscript.

Funding

His research was funded by National Key Research and Development Program of China, grant number: No. 2017YFB0702100.

Data Availability Statement

The raw/processed data required to reproduce these findings cannot be shared at this time as the data also forms part of an ongoing study.

Acknowledgments

This work was supported by the National Key Research and Development Program of China (Grant No. 2017YFB0702100).

Conflicts of Interest

The authors declare no conflict of interest.

Abbreviations

HT901 The name of a self-made second-generation single crystal superalloy.
PDASPrimary Dendrite Arm Spacing.
R-CNNRegions with CNN features-An object detection and semantic segmentation technique.
TTATest Time Augmentation.
TNNsTrue Nearest Neighbors.
Den MapDendritic Mapping-An automatic dendritic mapping algorithm.
NCCNormalized Cross-Correlation.
FFTFast Fourier Transform.
SEMScanning Electron Microscopy.
RPNRegional Proposal Network.
FCLFully Connected Layer.
ROIRegion of Interest.
TPTrue Positive.
FNFalse Negative.
FPFalse Positive.

References

  1. Strickland, J.; Nenchev, B.; Dong, H. On Directional Dendritic Growth and Primary Spacing—A Review. Crystals 2020, 10, 627. [Google Scholar] [CrossRef]
  2. Zhao, X.; Liu, L.; Yu, Z.; Zhang, W.; Fu, H. Microstructure development of different orientated nickel-base single crystal superalloy in directional solidification. Mater. Charact. 2010, 61, 7–12. [Google Scholar] [CrossRef]
  3. Liang, Z.; Chengbo, X.; Guoqing, Z.; Xin, T.; Dingzhong, T. Solidification and Segregation Behavior of Cast Ni-Base Superalloy IN792. Rare Met. Mater. Eng. 2012, 41, 1457–1462. [Google Scholar]
  4. Brundidge, C.L.; Miller, J.D.; Pollock, T.M. Development of Dendritic Structure in the Liquid-Metal-Cooled, Directional-Solidification Process. Metall. Mater. Trans. A 2011, 42, 2723–2732. [Google Scholar] [CrossRef]
  5. Mortensen, A.; Cornie, J.A.; Flemings, M.C. Columnar dendritic solidification in a metal- matrix composite. Metall. Trans. A 1988, 19, 709–721. [Google Scholar] [CrossRef]
  6. Brundidge, C.L.; Van Drasek, D.; Wang, B.; Pollock, T.M. Structure Refinement by a Liquid Metal Cooling Solidification Process for Single-Crystal Nickel-Base Superalloys. Metall. Mater. Trans. A 2012, 43, 965–976. [Google Scholar] [CrossRef]
  7. Baldan, A.; Magosa, G. Effect of secondary dendrite arm spacing on the section size-dependent creep strength of a nickel-base superalloy. J. Mater. Sci. Lett. 1994, 13, 734–737. [Google Scholar] [CrossRef]
  8. Krovvidi, S.; Goyal, S.; Bhaduri, A.K. Experimental and Numerical Investigation of High-Temperature Low-Cycle Fatigue and Creep-Fatigue Life of Bellows. J. Mater. Eng. Perform. 2021, 30, 2742–2750. [Google Scholar] [CrossRef]
  9. Ding, Q.; Bei, H.; Zhao, X.; Gao, Y.; Zhang, Z. Processing, Microstructures and Mechanical Properties of a Ni-Based Single Crystal Superalloy. Crystals 2020, 10, 572. [Google Scholar] [CrossRef]
  10. Santos, G.A.; Goulart, P.R.; Couto, A.A.; Garcia, A.M.A.U.R.I. Primary Dendrite ARM Spacing Effects upon Mechanical Properties of an AL–3Wt%CU–1Wt%LI Alloy; Springer: Berlin/Heidelberg, Germany, 2017. [Google Scholar]
  11. Osório, W.R.; Célia Marina AFreire Garcia, A. Dendritic solidification microstructure affecting mechanical and corrosion properties of a Zn4Al alloy. J. Mater. Sci. 2005, 40, 4493–4499. [Google Scholar] [CrossRef]
  12. Zhao, X.; Liu, L.; Zhang, W.; Yu, Z.; Fu, H. Microstructure and orientation variation during cell/dendrite transition in directional solidification of a single crystal nickel-base superalloy. Mater. Chem. Phys. 2011, 125, 55–58. [Google Scholar] [CrossRef]
  13. Hui, J.; Tiwari, R.; Wu, X.; Tewari, S.N.; Trivedi, R. Primary dendrite distribution and disorder during directional solidification of Pb-Sb alloys. Metall. Mater. Trans. A 2002, 33, 3499–3510. [Google Scholar] [CrossRef] [Green Version]
  14. Wang, W.; Lee, P.D.; Mclean, M. A model of solidification microstructures in nickel-based superalloys: Predicting primary dendrite spacing selection. Acta Mater. 2003, 51, 2971–2987. [Google Scholar] [CrossRef]
  15. Mccartney, D.G.; Hunt, J.D. Measurements of cell and primary dendrite arm spacings in directionally solidified aluminium alloys. Acta Metall. 1981, 29, 1851–1863. [Google Scholar] [CrossRef]
  16. Flemings, M.C. Solidification processing. Metall. Trans. 1974, 5, 2121–2134. [Google Scholar] [CrossRef]
  17. Jacobi, H.; Schwerdtfeger, K. Dendrite morphology of steady state unidirectionally solidified steel. Metall. Trans. A 1976, 7, 811–820. [Google Scholar] [CrossRef]
  18. Paul, U.; Sahm, P.R.; Goldschmidt, D. Inhomogeneities in single-crystal components. Mater. Sci. Eng. A 1993, 173, 49–54. [Google Scholar] [CrossRef]
  19. Warnken, N.; Reed, R.C. On the Characterization of Directionally Solidified Dendritic Microstructures. Metall. Mater. Trans. A 2011, 42, 1675–1683. [Google Scholar] [CrossRef]
  20. Tschopp, M.A.; Miller, J.D.; Oppedal, A.L.; Solanki, K.N. Characterizing the local primary dendrite arm spacing in directionally-solidified dendritic microstructures. Metall. Mater. Trans. A 2013, 45, 426–437. [Google Scholar] [CrossRef] [Green Version]
  21. Tschopp, M.A.; Groeber, M.A.; Fahringer, R.; Simmons, J.P.; Rosenberger, A.H.; Woodward, C. Automated detection and characterization of microstructural features: Application to eutectic particles in single crystal Ni-based superalloys. Model. Simul. Mater. Sci. Eng. 2010, 18, 025014. [Google Scholar] [CrossRef]
  22. Wang, Q.; Knight, J.W. Method for Automatic Quantification of Dendrite arm Spacing in Dendritic Microstructures. U.S. Patent No. 9,500,594, 22 November 2016. [Google Scholar]
  23. Miller, J.; Strangwood, M.; Steinbach, S.; Warnken, N. Skeletonisation to Find the Centre of Dendrites Traced from a 2D Microstructural Image. Solidif. Process. 2017, 2017, 1–4. [Google Scholar]
  24. Nenchev, B.; Strickland, J.; Tassenberg, K.; Perry, S.; Gill, S.; Dong, H. Automatic Recognition of Dendritic Solidification Structures: Denmap. J. Imaging 2020, 6, 19. [Google Scholar] [CrossRef] [Green Version]
  25. Strickland, J.; Nenchev, B.; Dong, H.B. Applications of pattern recognition for dendritic microstructures. In IOP Conference Series: Materials Science and Engineering; IOP Publishing: Bristol, UK, 2020. [Google Scholar]
  26. Tassenberg, K.; Nenchev, B.; Strickland, J.; Perry, S.; Weston, D. DenMap single crystal solidification structure feature extraction: Automation and application. Mater. Charact. 2020, 171, 110763. [Google Scholar] [CrossRef]
  27. Yoo, J.C.; Han, T.H. Fast Normalized Cross-Correlation. Circuits Syst. Signal Process. 2009, 28, 819. [Google Scholar] [CrossRef]
  28. Haque, M.N.; Uddin, M.S. Accelerating Fast Fourier Transformation for Image Processing using Graphics Processing Unit. J. Emerg. Trends Comput. Inf. Sci. 2011, 2, 367–375. [Google Scholar]
  29. Shanmugam, D.; Blalock, D.; Balakrishnan, G.; Guttag, J. When and Why Test-Time Augmentation Works. arXiv 2020, arXiv:2011.11156. [Google Scholar]
  30. Ren, S.; He, K.; Girshick, R.; Sun, J. Faster R-CNN: Towards Real-Time Object Detection with Region Proposal Networks. IEEE Trans. Pattern Anal. Mach. Intell. 2017, 39, 1137–1149. [Google Scholar] [CrossRef] [PubMed] [Green Version]
  31. Hao, X.; Zhang, G.; Ma, S. Deep Learning. Int. J. Semant. Comput. 2016, 10, 417–439. [Google Scholar] [CrossRef] [Green Version]
  32. Pathirage, C.S.N.; Li, J.; Li, L.; Hao, H.; Liu, W.; Ni, P. Structural damage identification based on autoencoder neural networks and deep learning. Eng. Struct. 2018, 172, 13–28. [Google Scholar] [CrossRef]
  33. Deng, L.; Yu, D. Deep Learning: Methods and Applications. Found. Trends Signal. Process. 2014, 7, 197–387. [Google Scholar] [CrossRef] [Green Version]
  34. Zhang, W.; Liu, L.; Zhao, X.; Huang, T.; Yu, Z.; Qu, M.; Fu, H. Effect of cooling rates on dendrite spacings of directionally solidified DZ125 alloy under high thermal gradient. Rare Met. 2009, 28, 633–638. [Google Scholar] [CrossRef]
Figure 1. HT901 metallographic image.
Crystals 11 01060 g001
Figure 2. (a) Original multi-field images. (b) Stitched full-field image.
Crystals 11 01060 g002
Figure 3. Architecture of Faster R-CNN: FCL represents fully connected layers and RPN represents the region proposal network.
Crystals 11 01060 g003
Figure 4. The process of TTA Faster R-CNN to extract dendrite cores. T1, T2…Tn means augmentation algorithm.
Crystals 11 01060 g004
Figure 5. The extraction result of the dendrite cores in a single field of view by TTA. (a) is the original image; (bd) are the augmented images; (eh) are the results which were extracted by Faster R-CNN; (i) is the final result.
Crystals 11 01060 g005
Figure 6. The extraction results. (a) Original image. (b) Detected result by Faster R-CNN.
Crystals 11 01060 g006
Figure 7. The recognition results of Faster R-CNN and TTA Faster R-CNN. (a) The extraction result of Faster R-CNN, A is the dendrite cores that were missed; (b) the extraction result of TTA Faster R-CNN.
Crystals 11 01060 g007
Figure 8. The full field of view image of the HT901 with dendrite core is recognized by TTA Faster R-CNN. The red star in the figure represents the dendrite core recognized by the detection model, the blue circle represents the result of false detection, and the green circle represents the dendrite core not detected by the detection model.
Crystals 11 01060 g008
Figure 9. Example of interval division and the calculation result for local dendrite spacing: the blue box is the target dendrite core whose local dendrite spacing is to be calculated, and the red boxes are the positions of the dendrite cores closest to the target dendrite core in each interval. The Euclidean distance is defined as the dendrite spacing of the target dendrite core in this interval.
Crystals 11 01060 g009
Figure 10. The distribution of PDAS and coordination number of HT901 in full field of view. (a) PDAS distribution, (b) coordination number distribution.
Crystals 11 01060 g010
Figure 11. The Gaussian distribution of local PDAS and coordination number. (a) PDAS vs. frequency for HT901, λ ¯   = 415 μm, (b) coordination number vs. frequency for HT901.
Crystals 11 01060 g011
Figure 12. The relationship between the coordination number and local PDAS of HT901, λ ¯   = 415 μm is the average local dendrite spacing determined in Figure 11a.
Crystals 11 01060 g012
Figure 13. The 7 rings which are equally spaced from the local PDAS distribution of HT901; C1 is the center of HT901, and C7 is the edge of the sample.
Crystals 11 01060 g013
Figure 14. The relationship between the local PDAS and the distance from the center of the HT901 sample, Where the abscissas 1–7 represent the C1–C7 in Figure 13. λ ¯ C is the average local PDAS corresponding to C1–C7, and λ ¯ is the average local PDAS of HT901 which is defined in Figure 10a.
Crystals 11 01060 g014
Table 1. Chemical composition of single crystal sample (wt%).
Sample CodeCrReTaAlCoMoWCBHfNi
HT9015.842.905.975.598.012.484.470.0170.0110.17Bal.
Table 2. The extraction results of dendrite cores by Faster R-CNN and TTA Faster R-CNN.
MethodTPFNFPAccuracy (%)
Faster R-CNN964195982.5
TTA Faster R-CNN114712798.4
Table 3. The extraction results of dendrite cores of three additional samples.
Sample CodeTPFNFPAccuracy (%)
HT9101360142797.1
HT9121237153496.2
HT9131133172196.8
Publisher’s Note: MDPI stays neutral with regard to jurisdictional claims in published maps and institutional affiliations.

