
Fabrication and Characterization of Clay-Polyethylene Composite Opted for Shielding of Ionizing Radiation

 , ,
, ,  ,
,  ,
,  and
and
Abstract
:1. Introduction
2. Materials and Methods
2.1. Preparation of the Clay Materials
2.2. Recycling and Processing of Waste Low Density Polyethylene
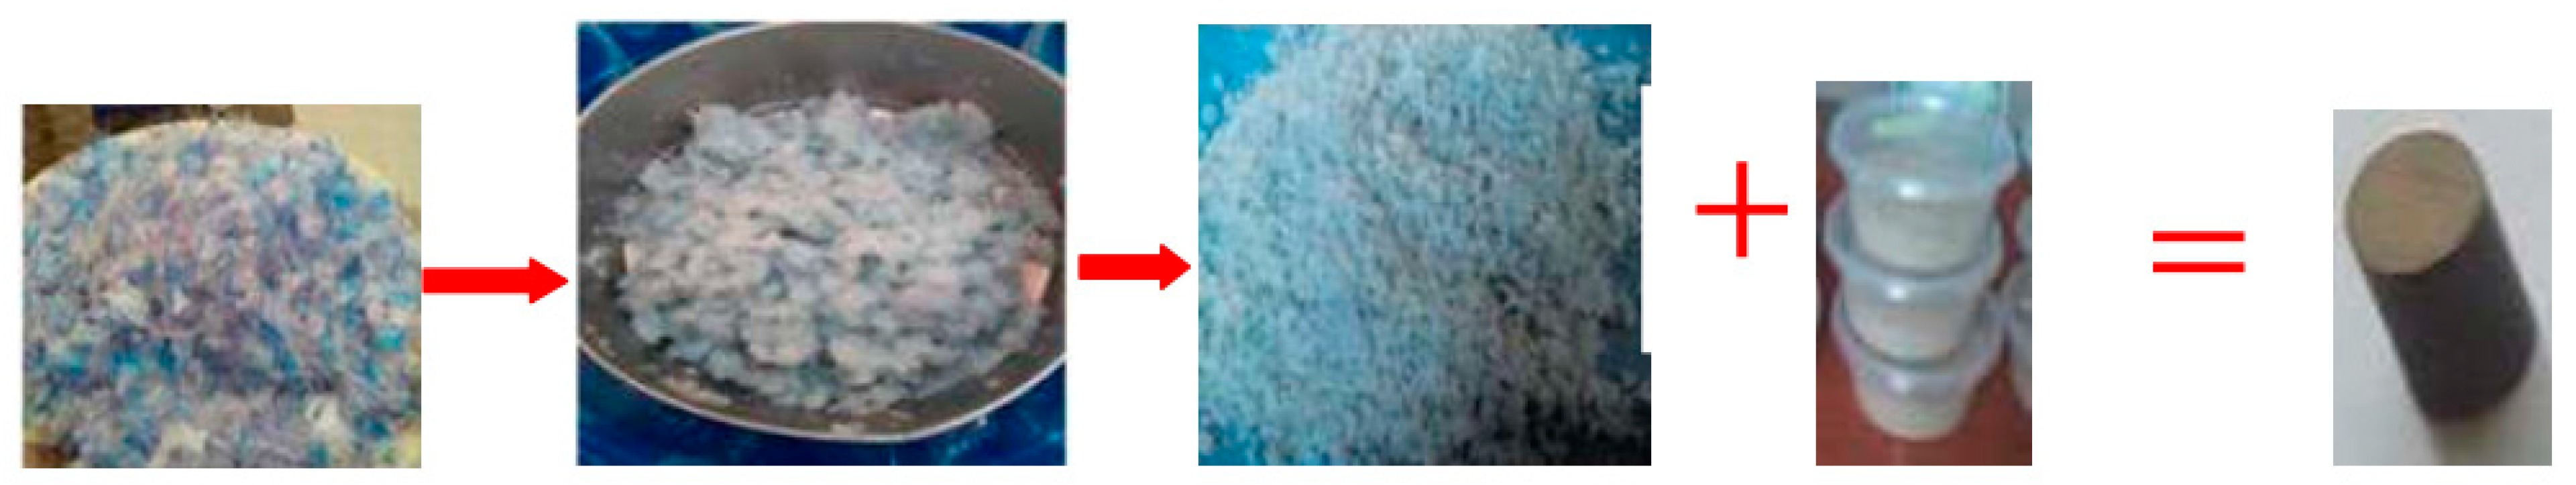
2.3. Fabrication of Clay-Polyethylene Composite
2.4. Characterization of the Fabricated Clay-Polyethylene Composite
- i.
- X-ray diffraction (XRD)
- ii.
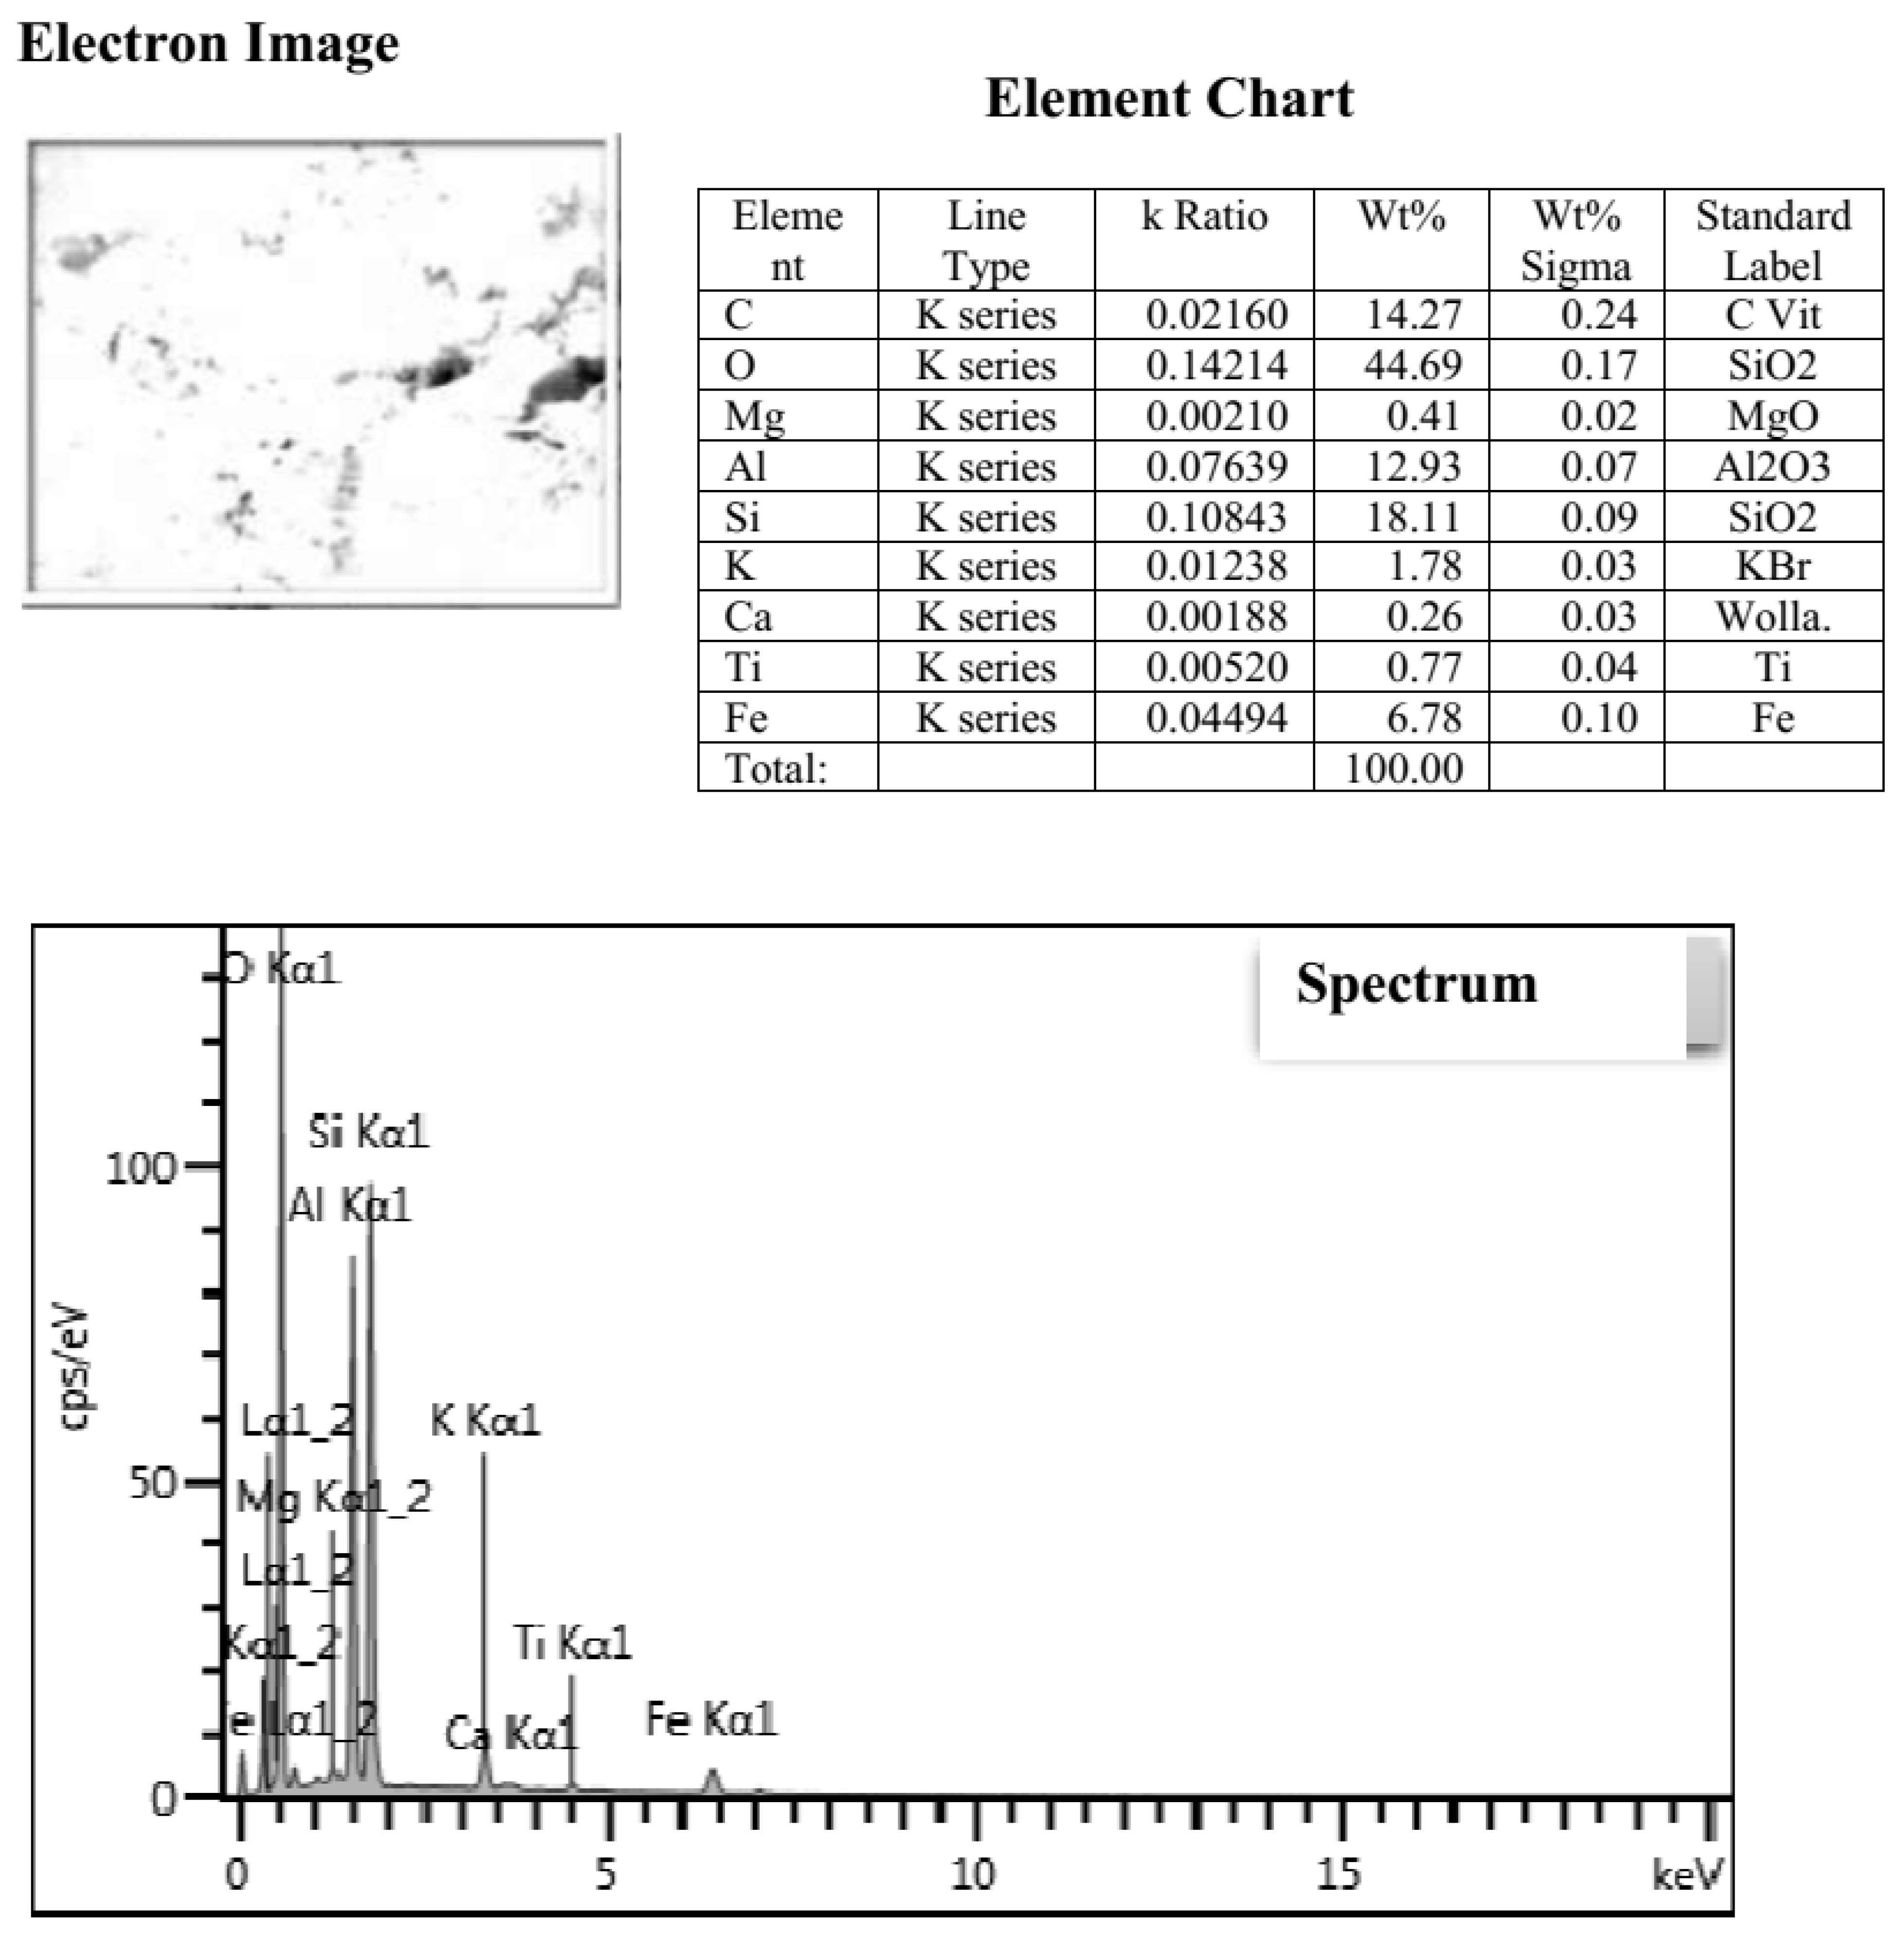
- Scanning electron microscope (SEM) coupled with Energy dispersive X-ray spectroscopy (EDX).
- iii.
- Stoichiometry elemental analysis of the fabricated composites
- iv.
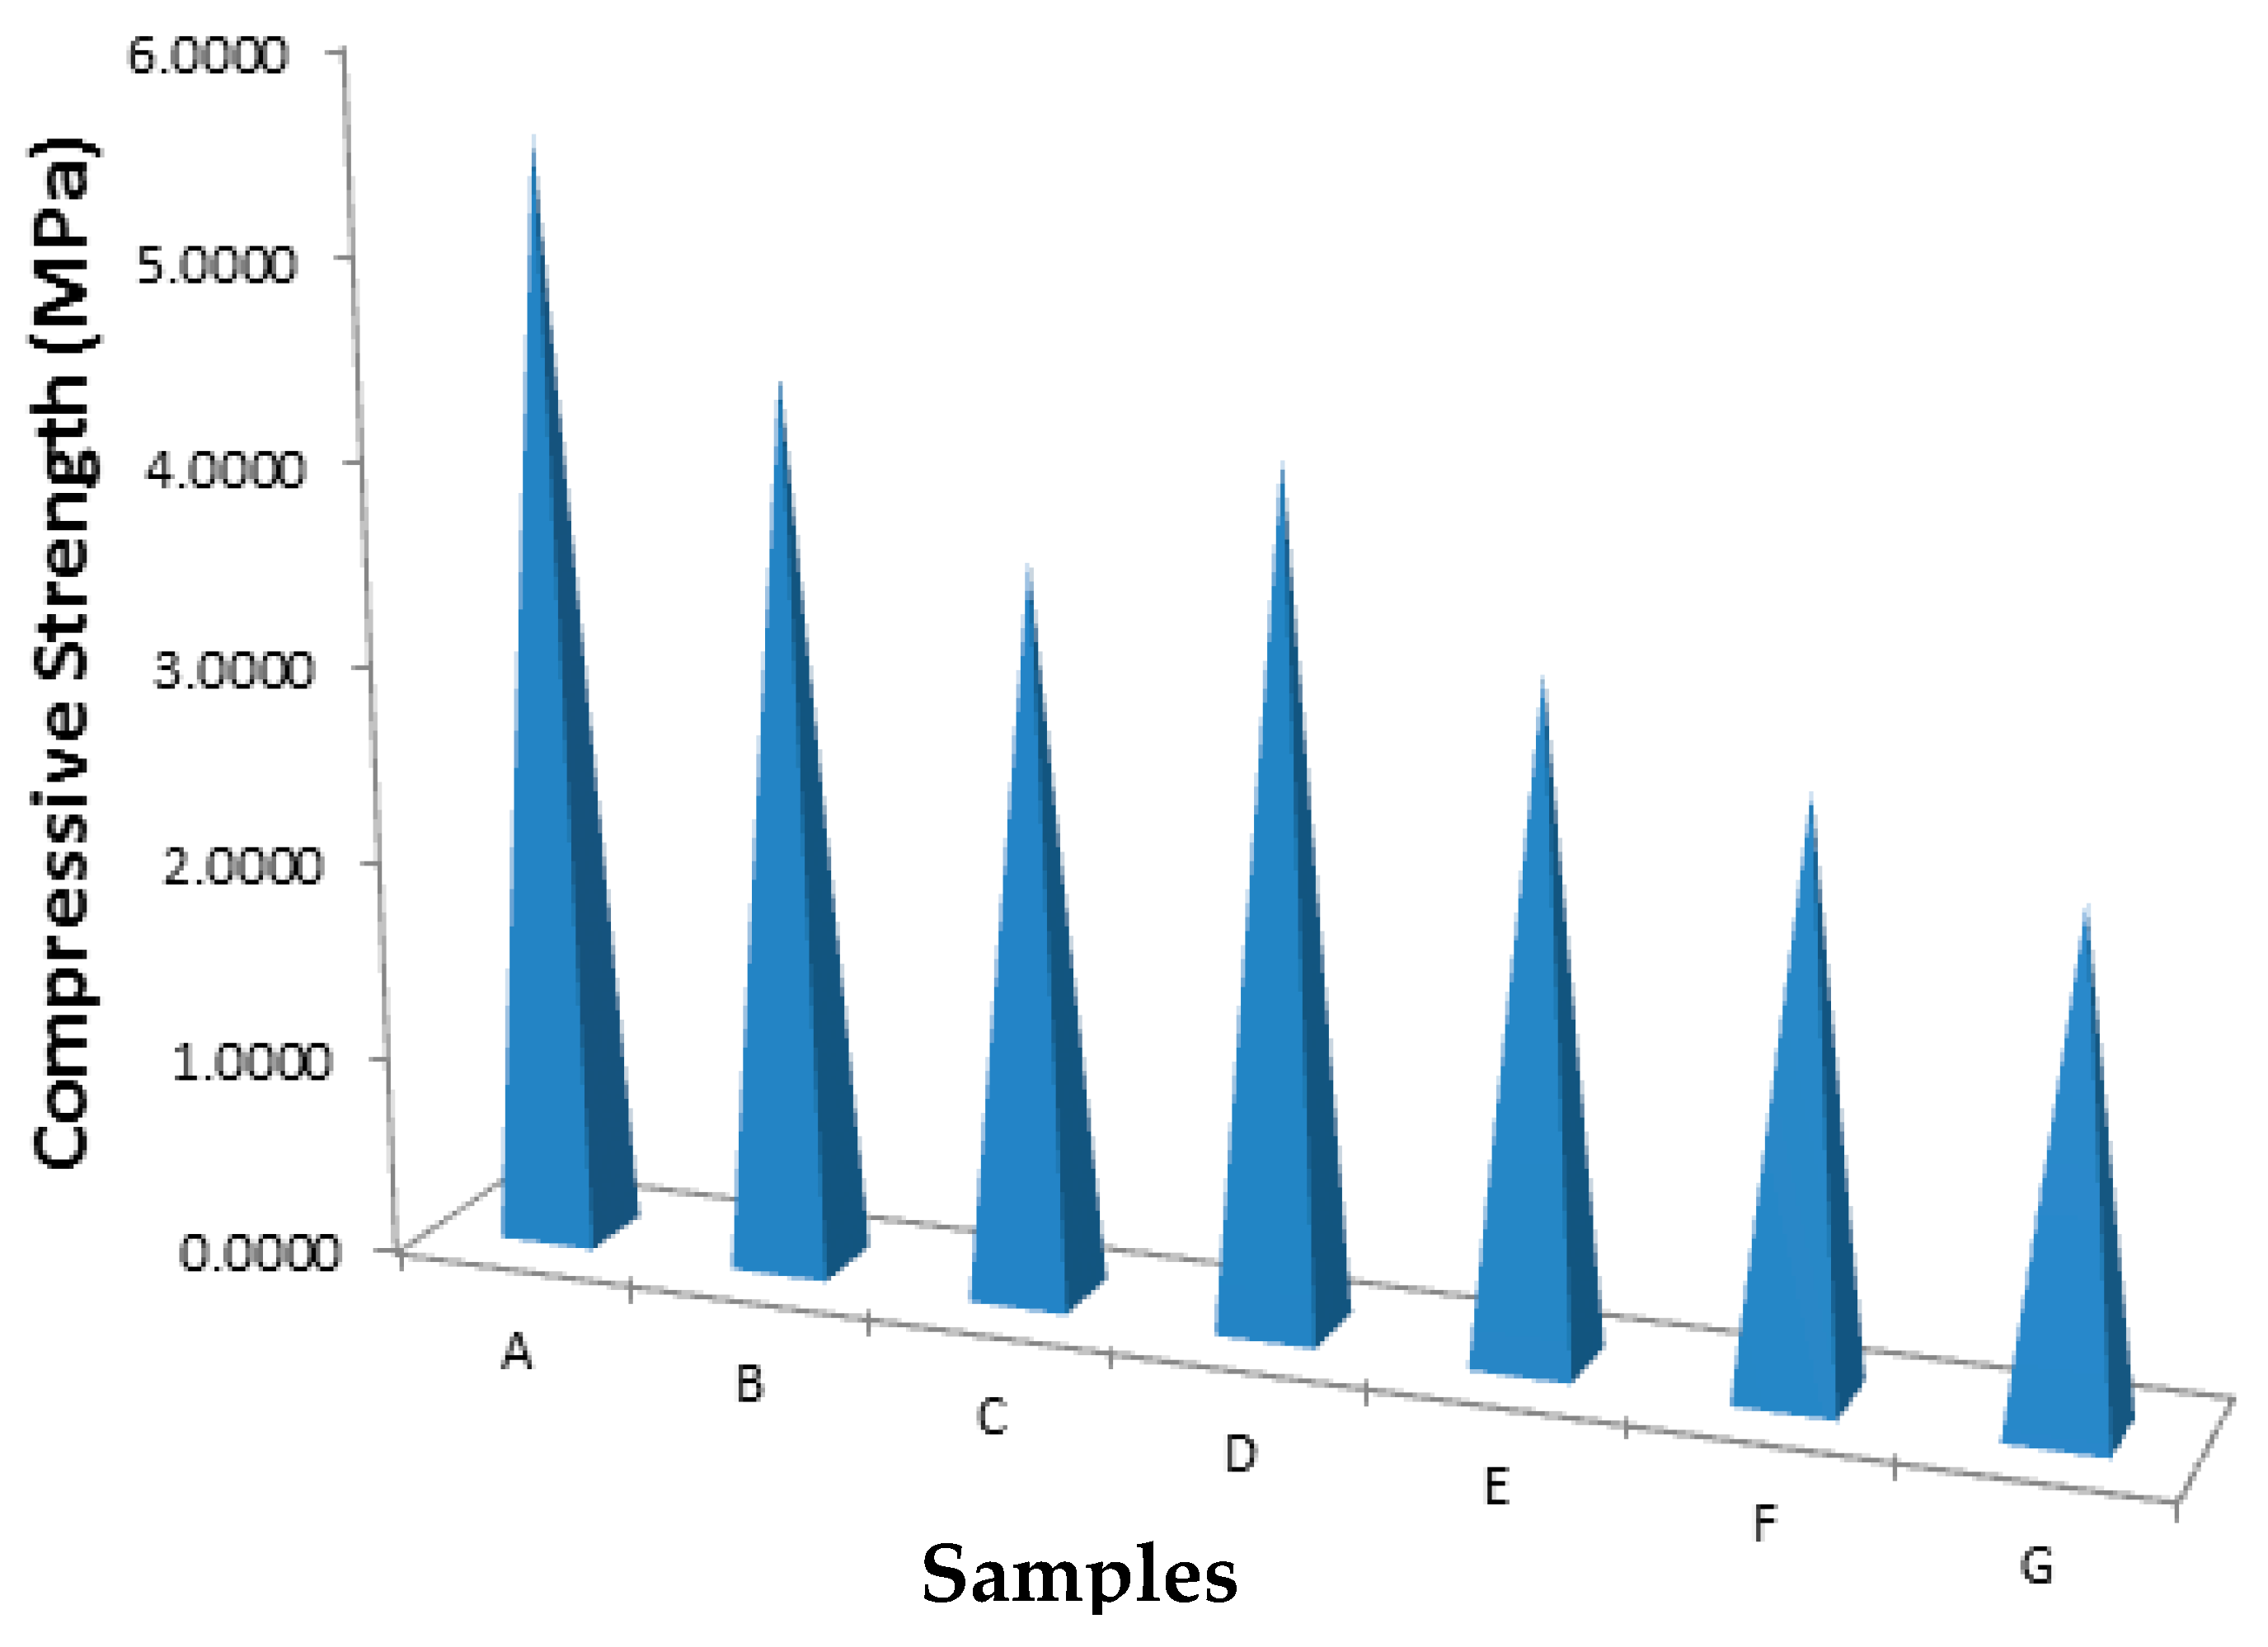
- The compressive strength test
- v.
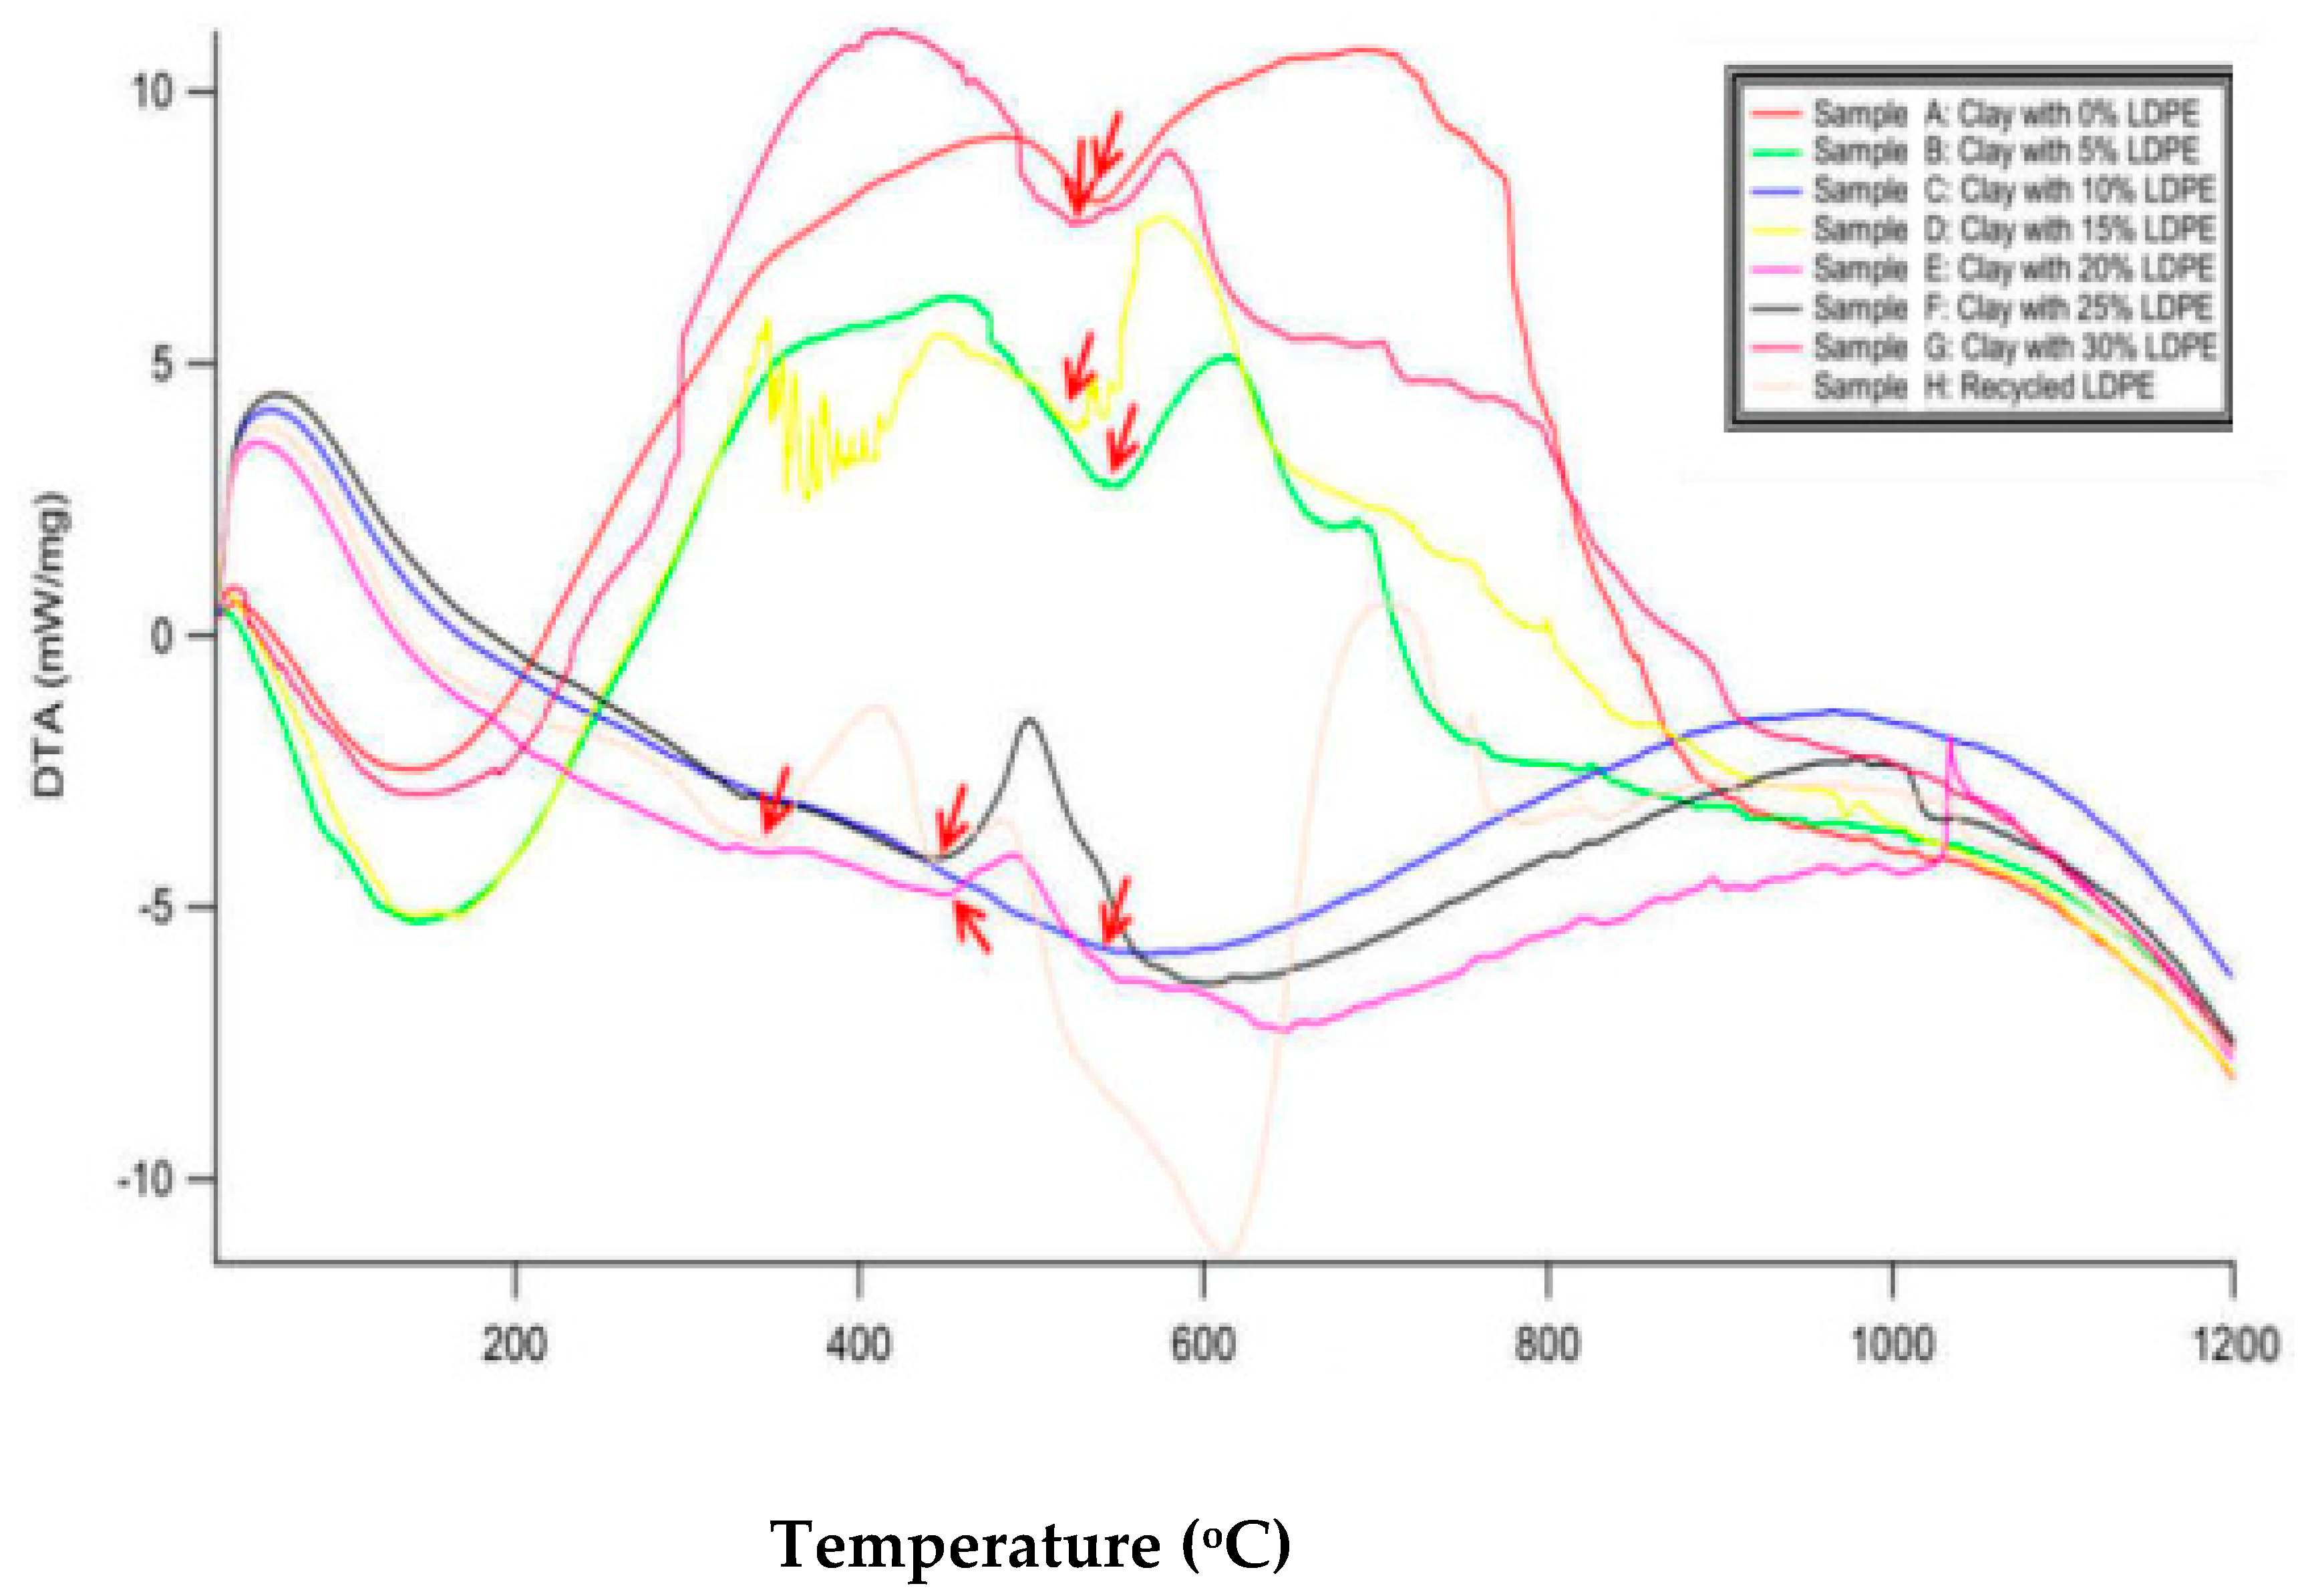
- Differential thermal analysis (DTA)
3. Results
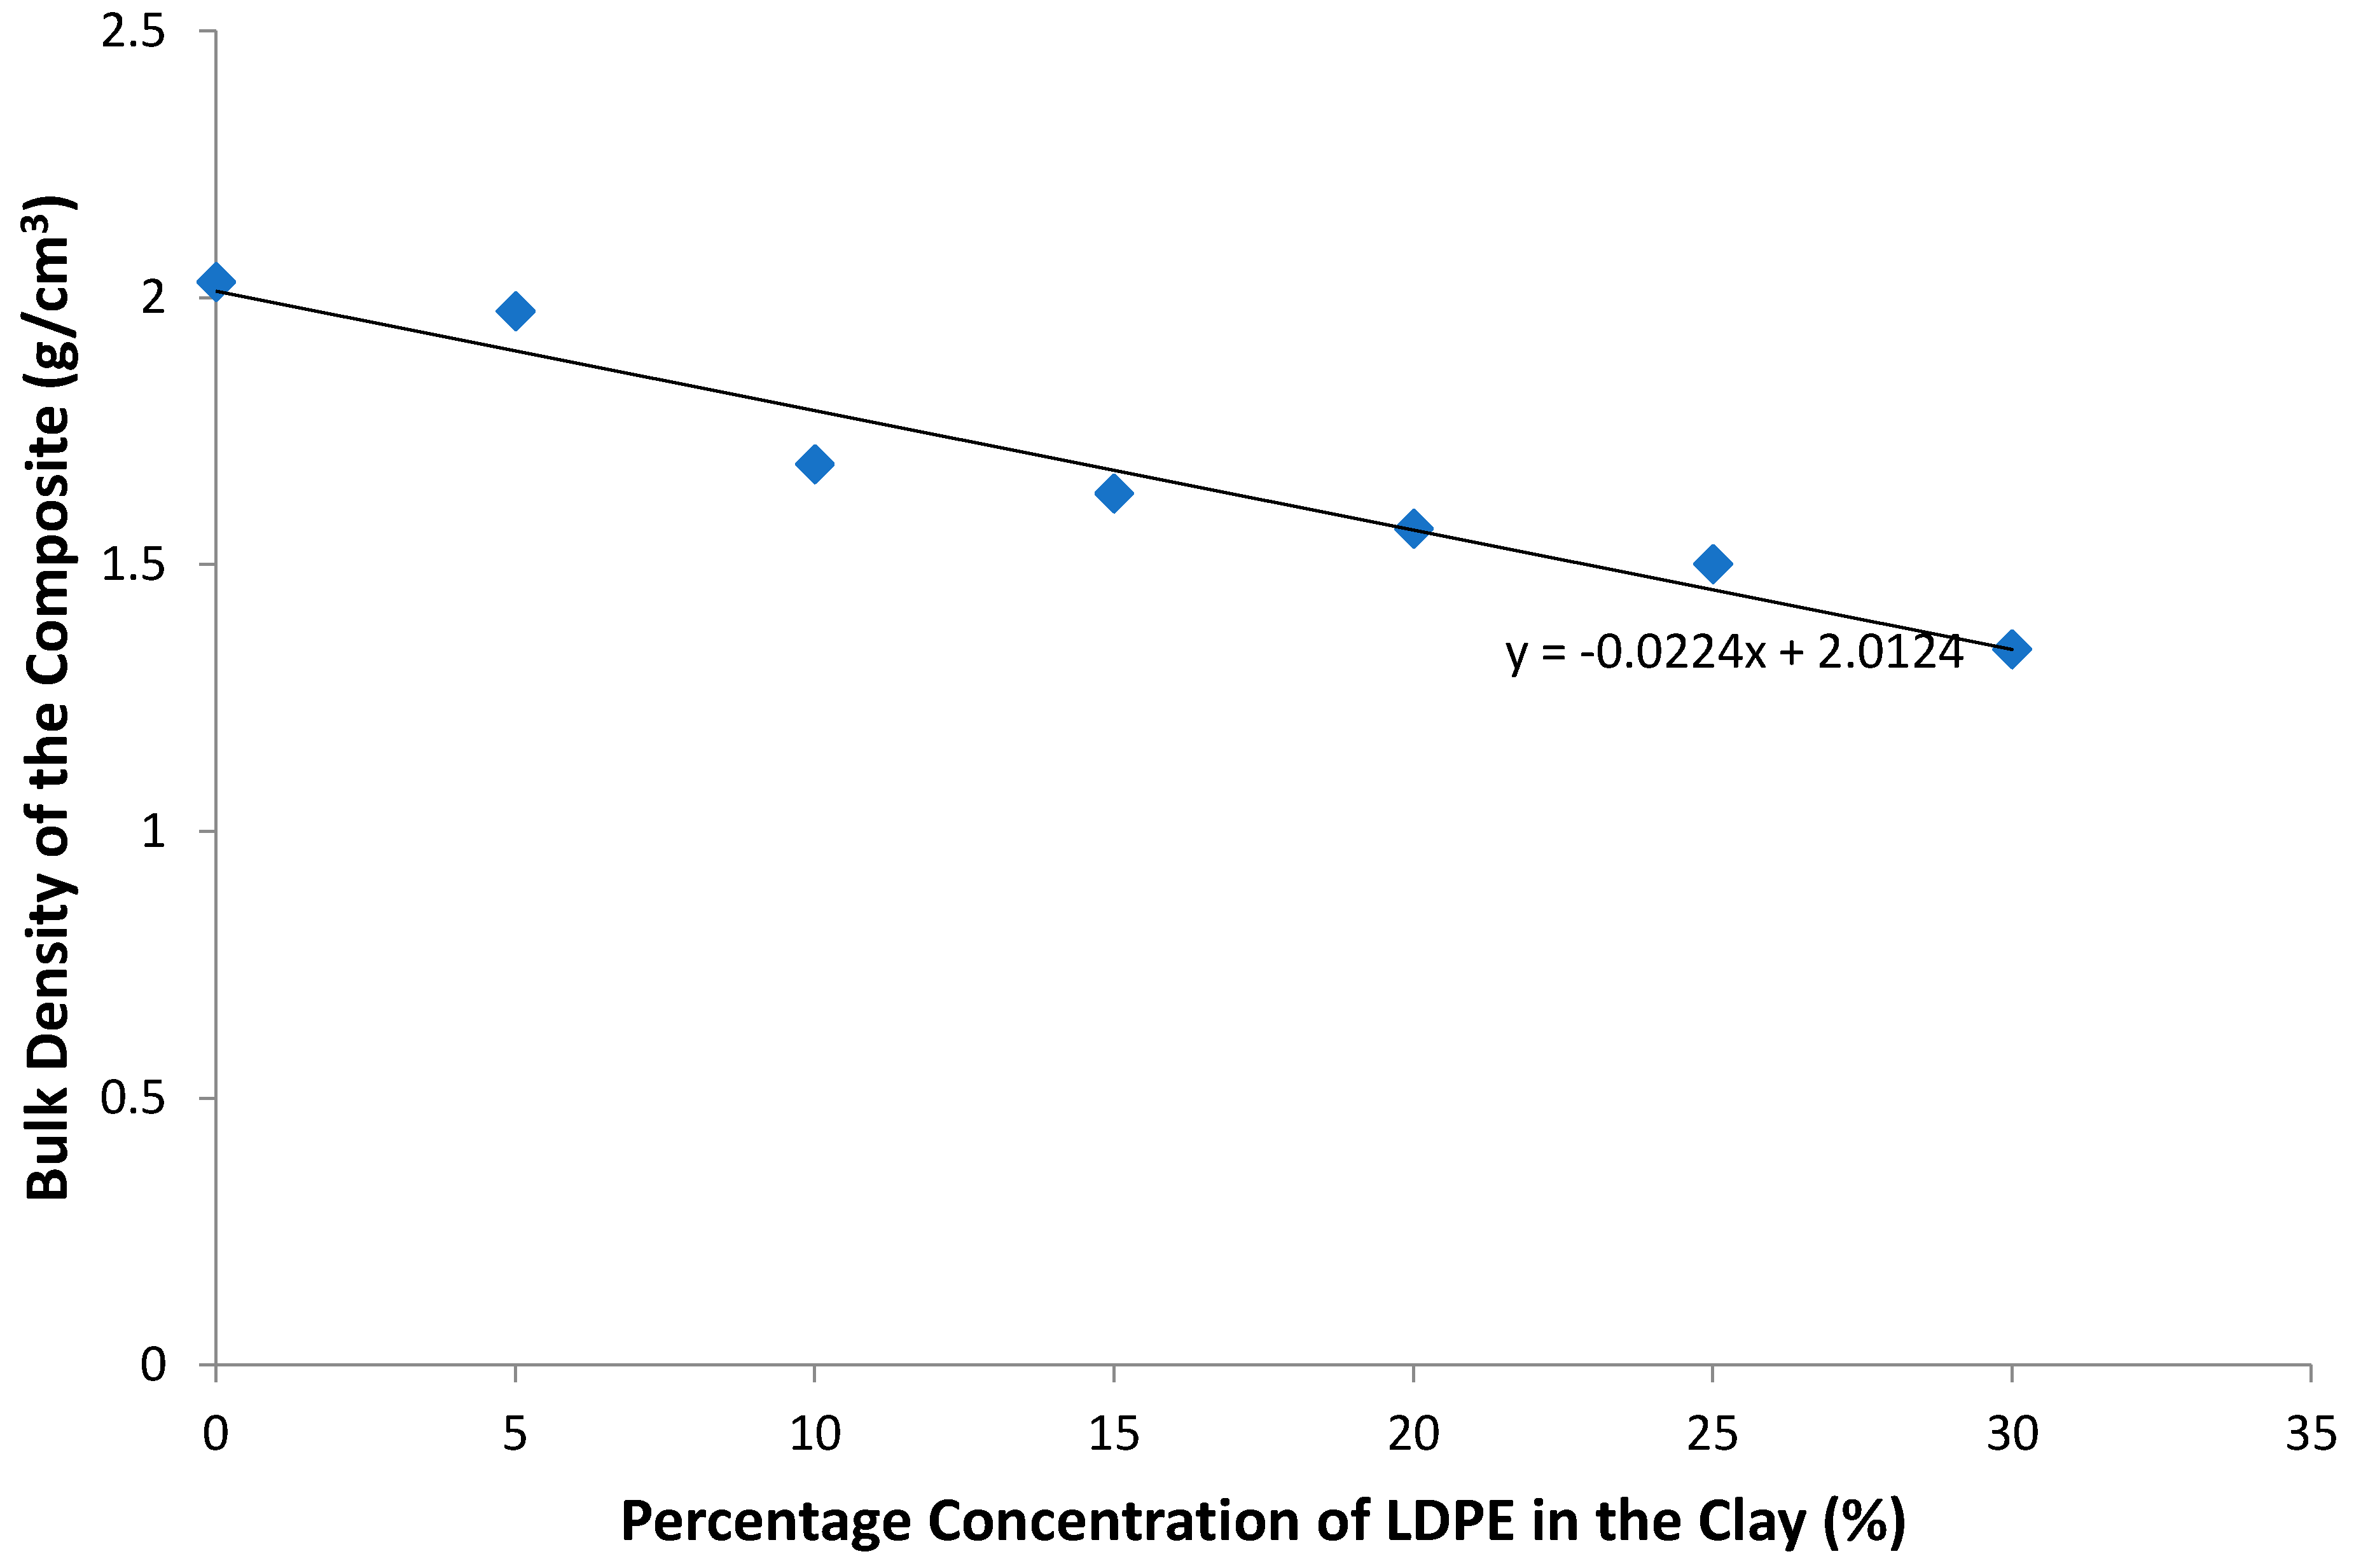
3.1. Bulk Density
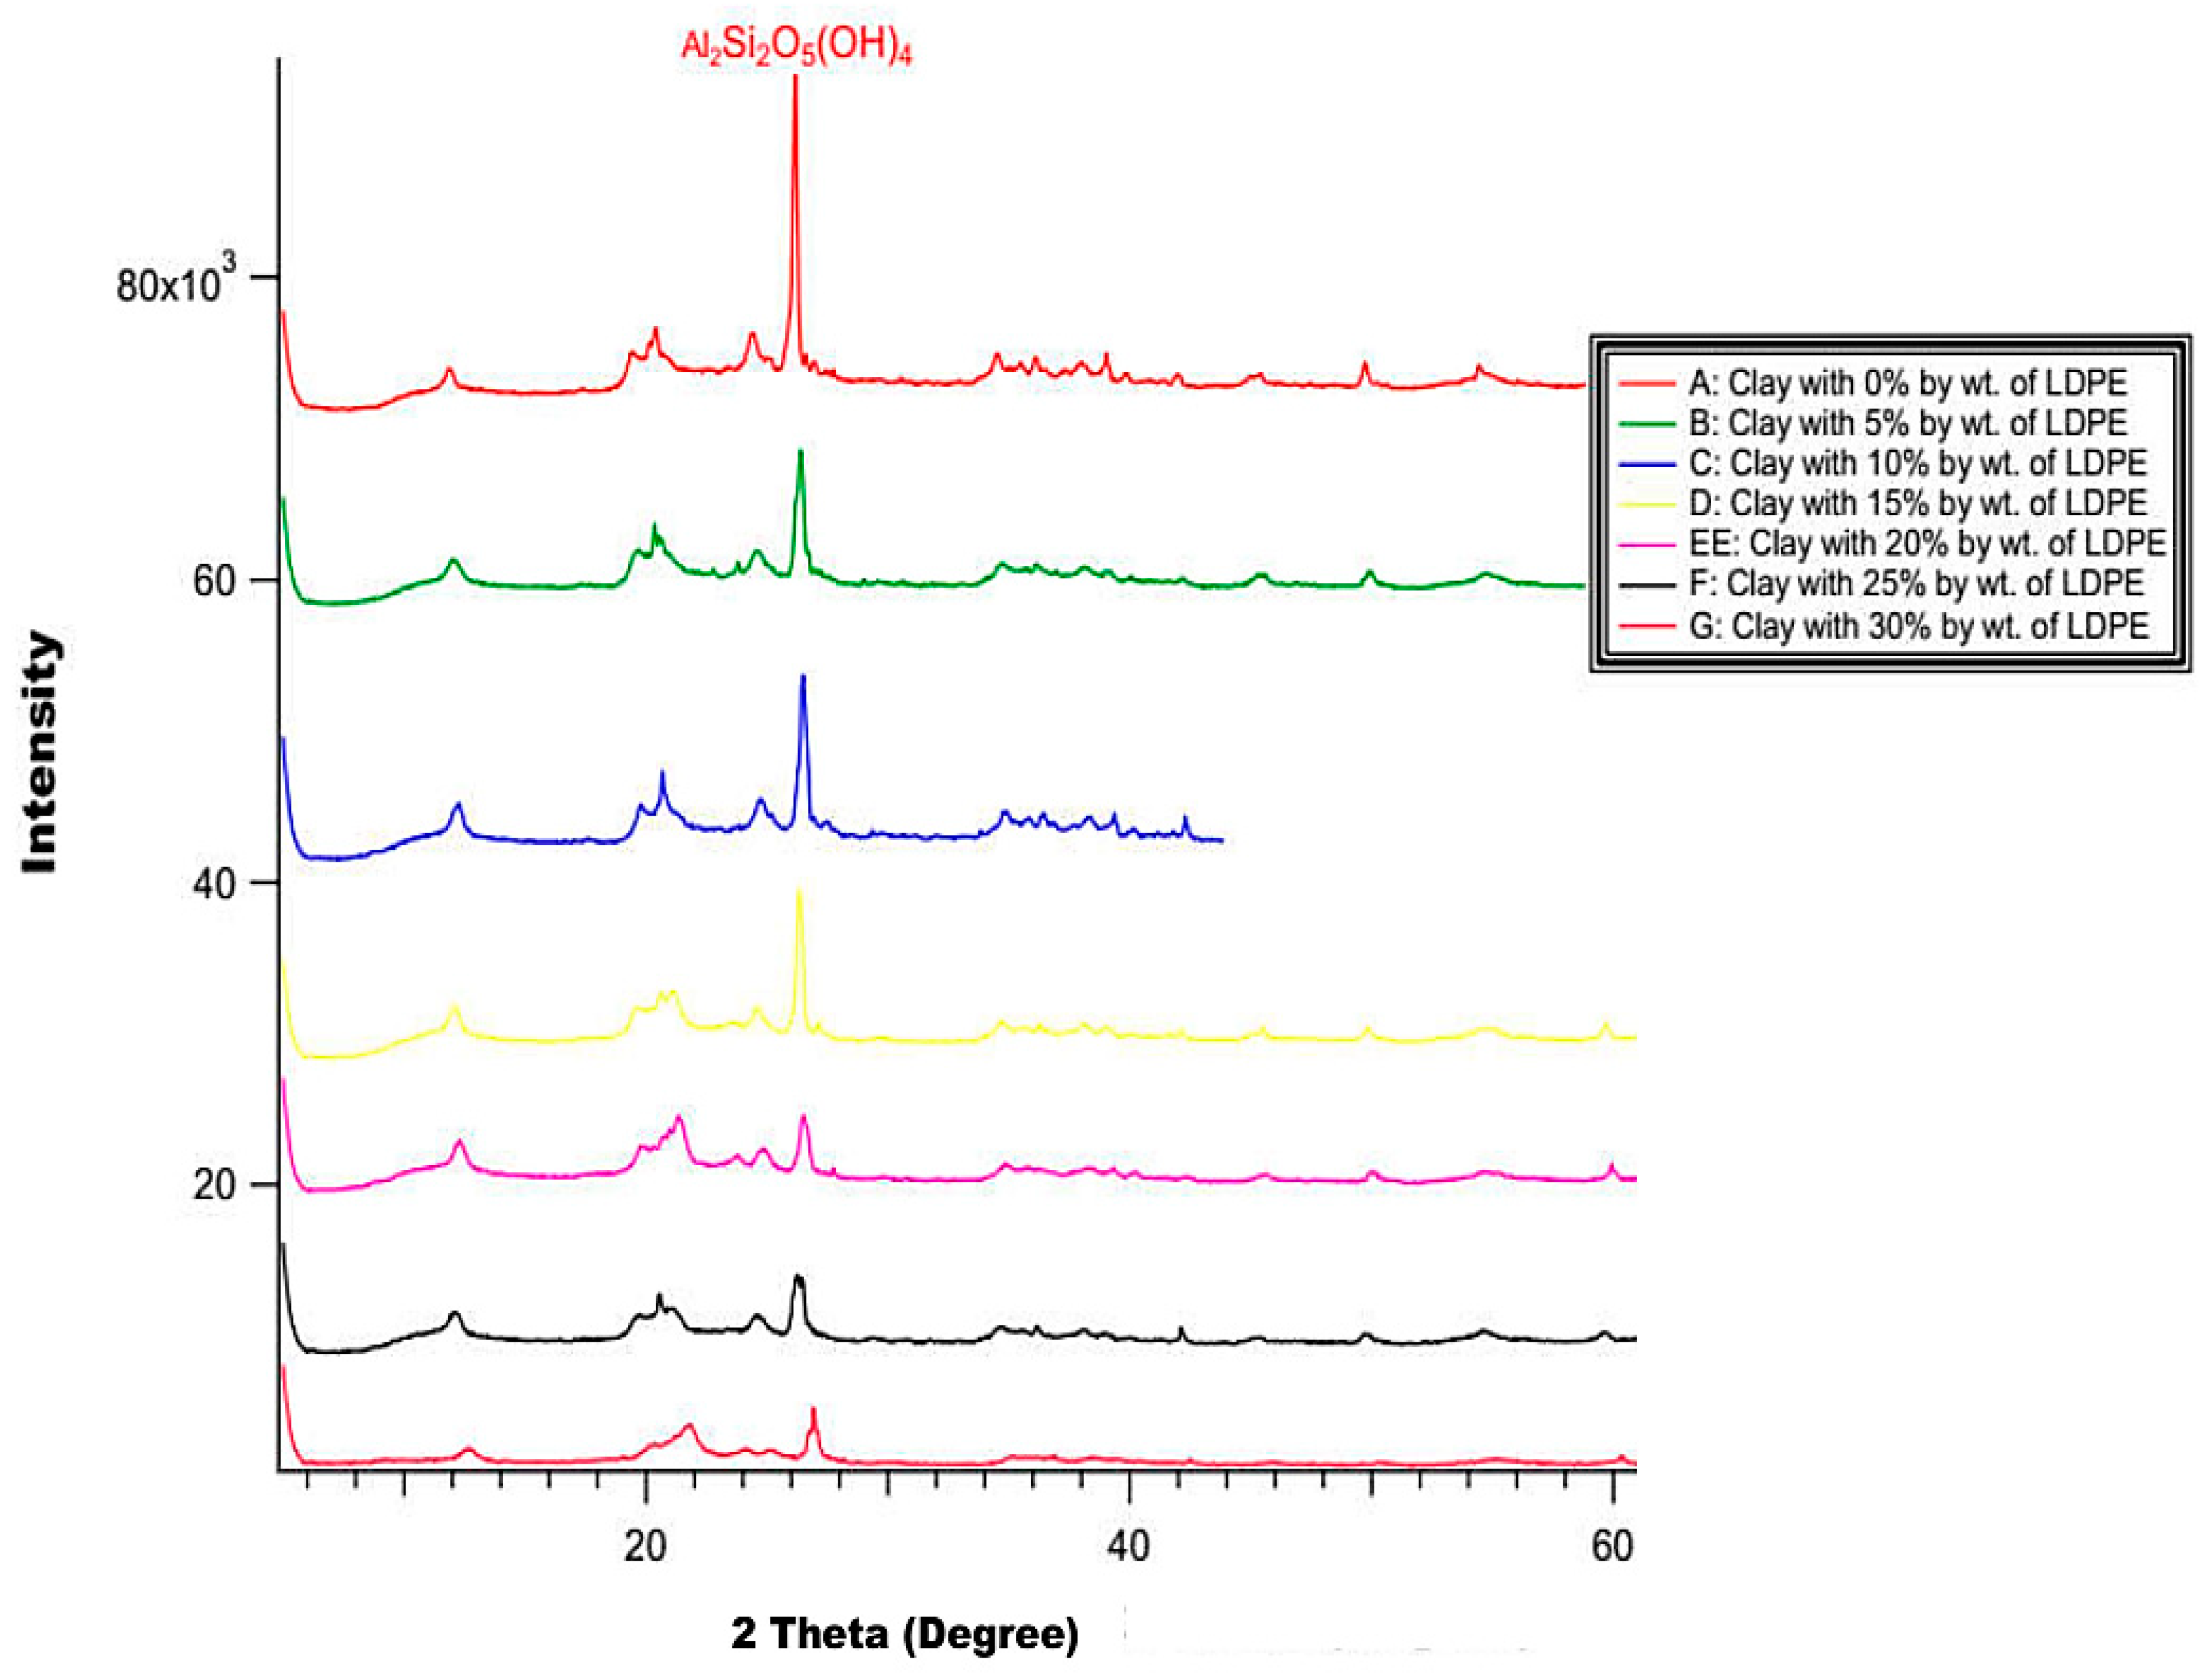
3.2. XRD Pattern of the Samples
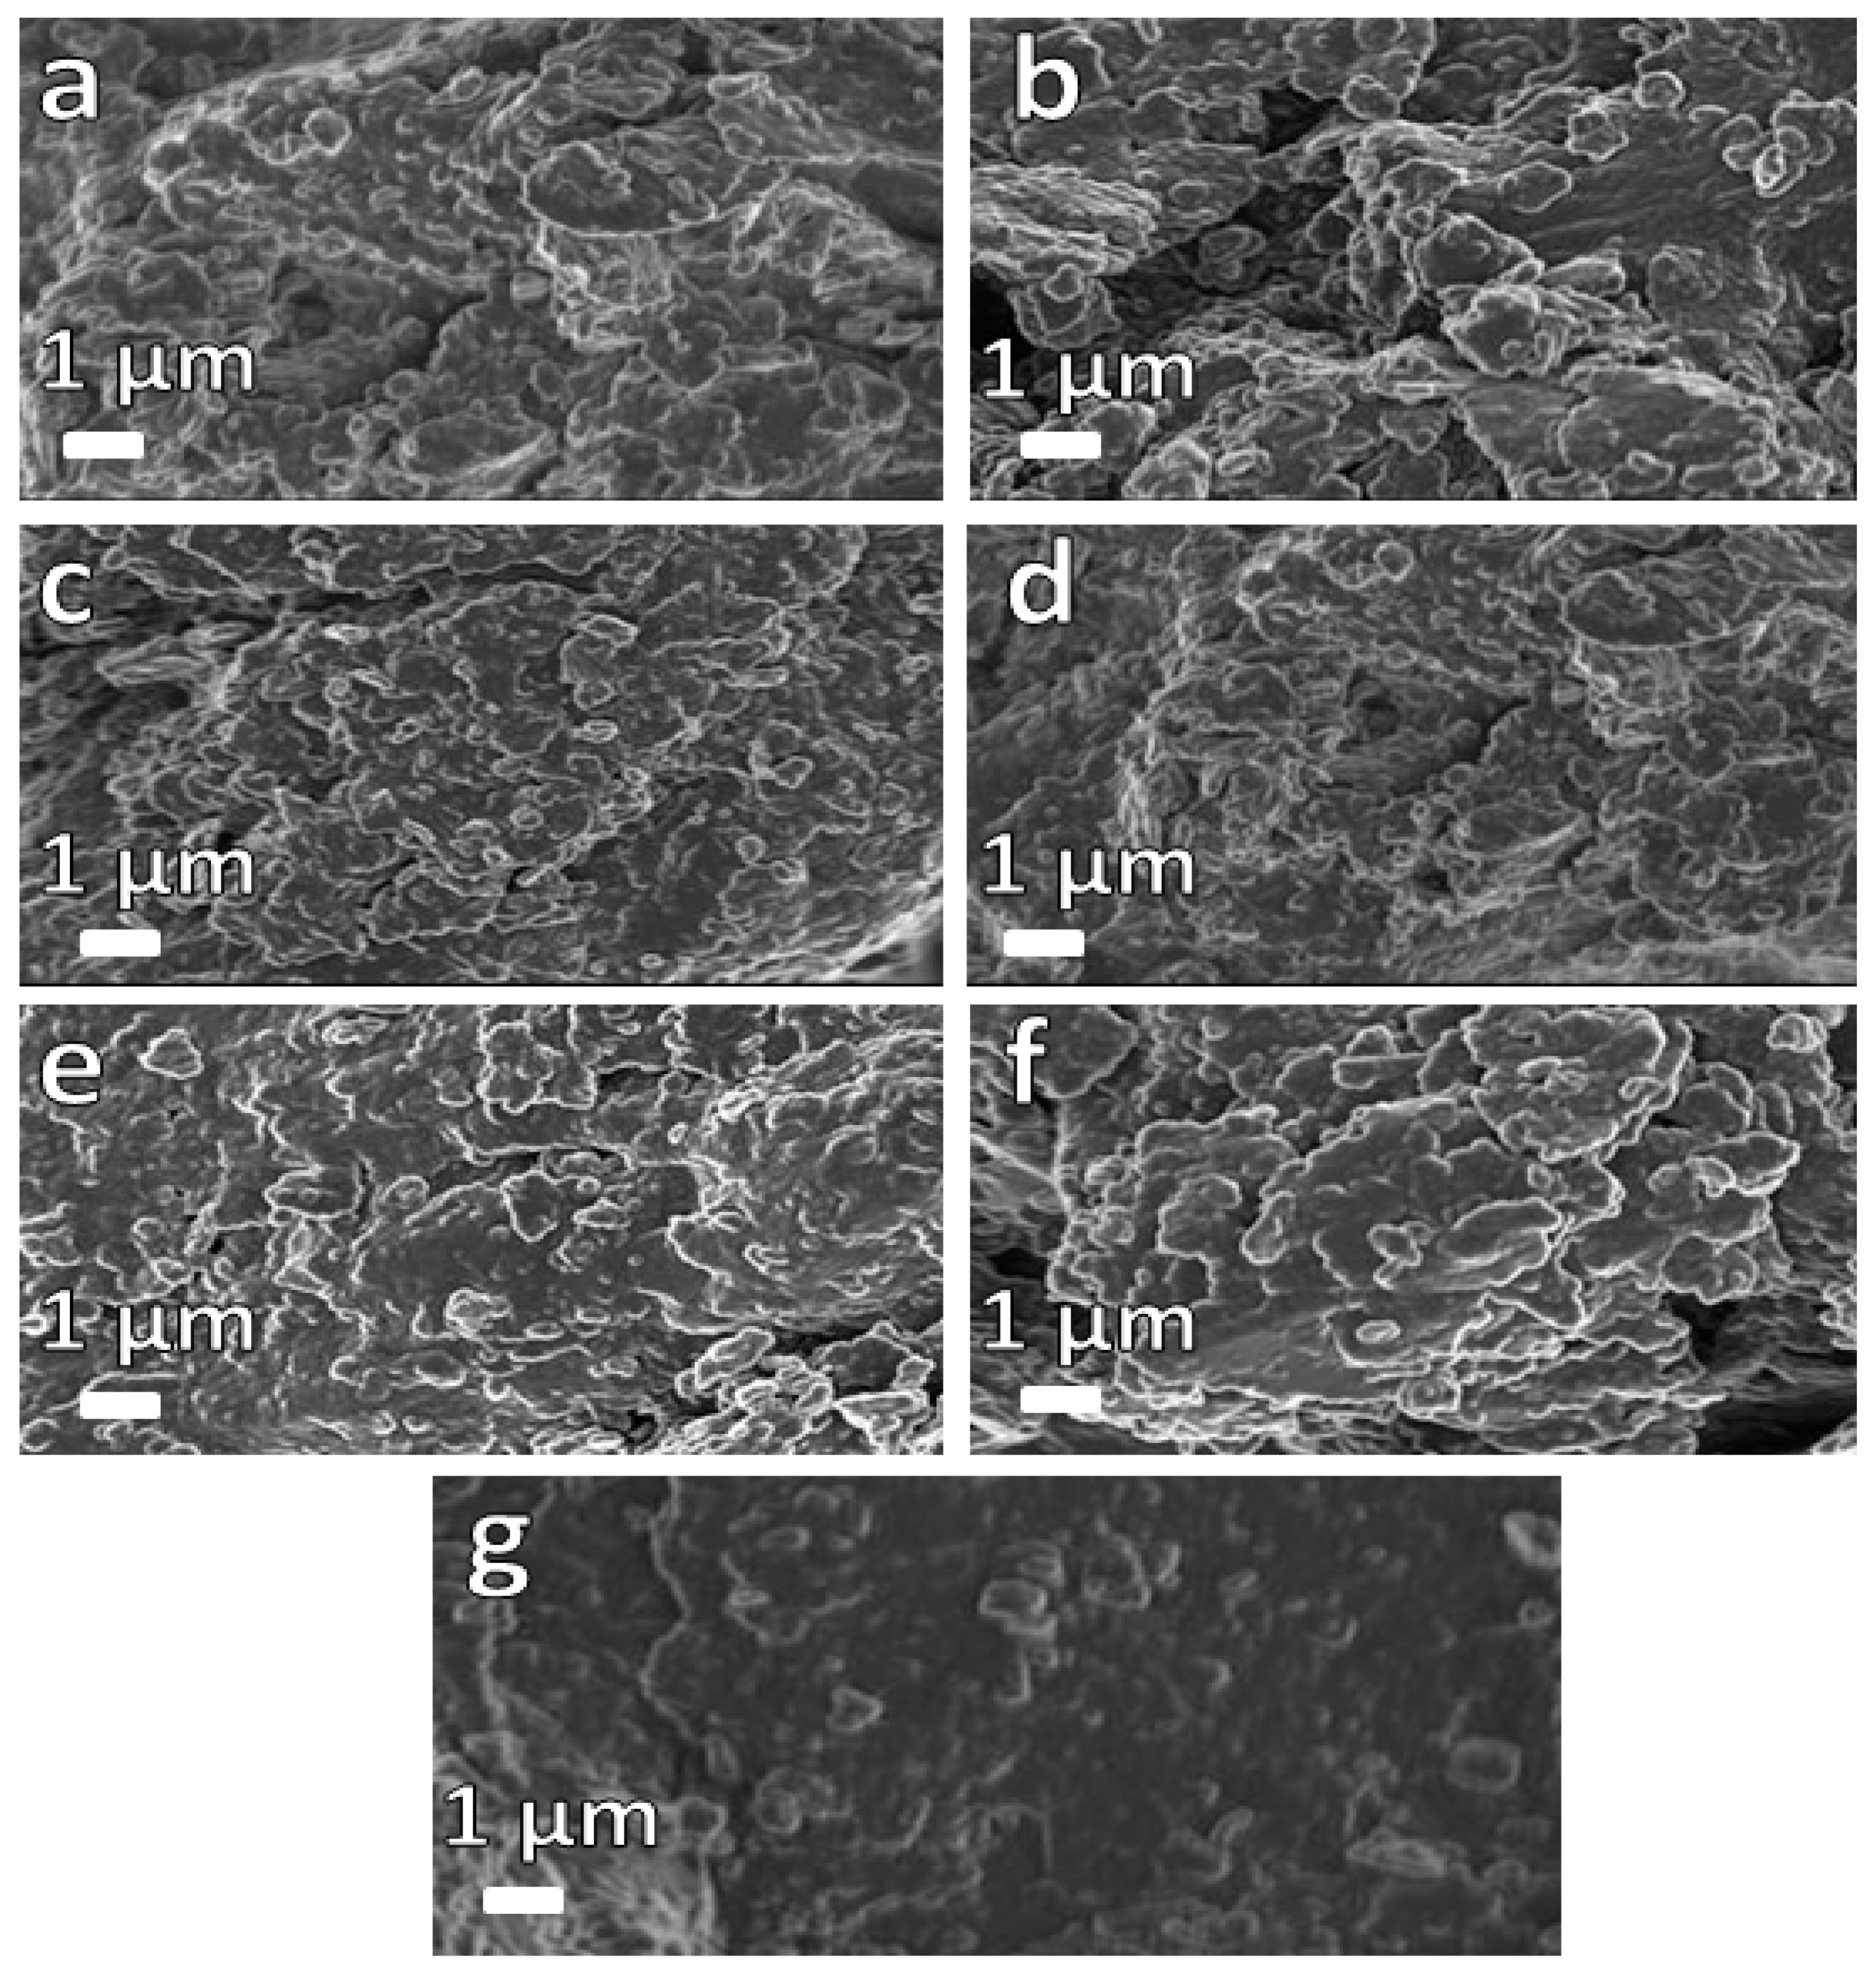
3.3. SEM and EDX Results
3.4. DTA and Compressive Strength Results
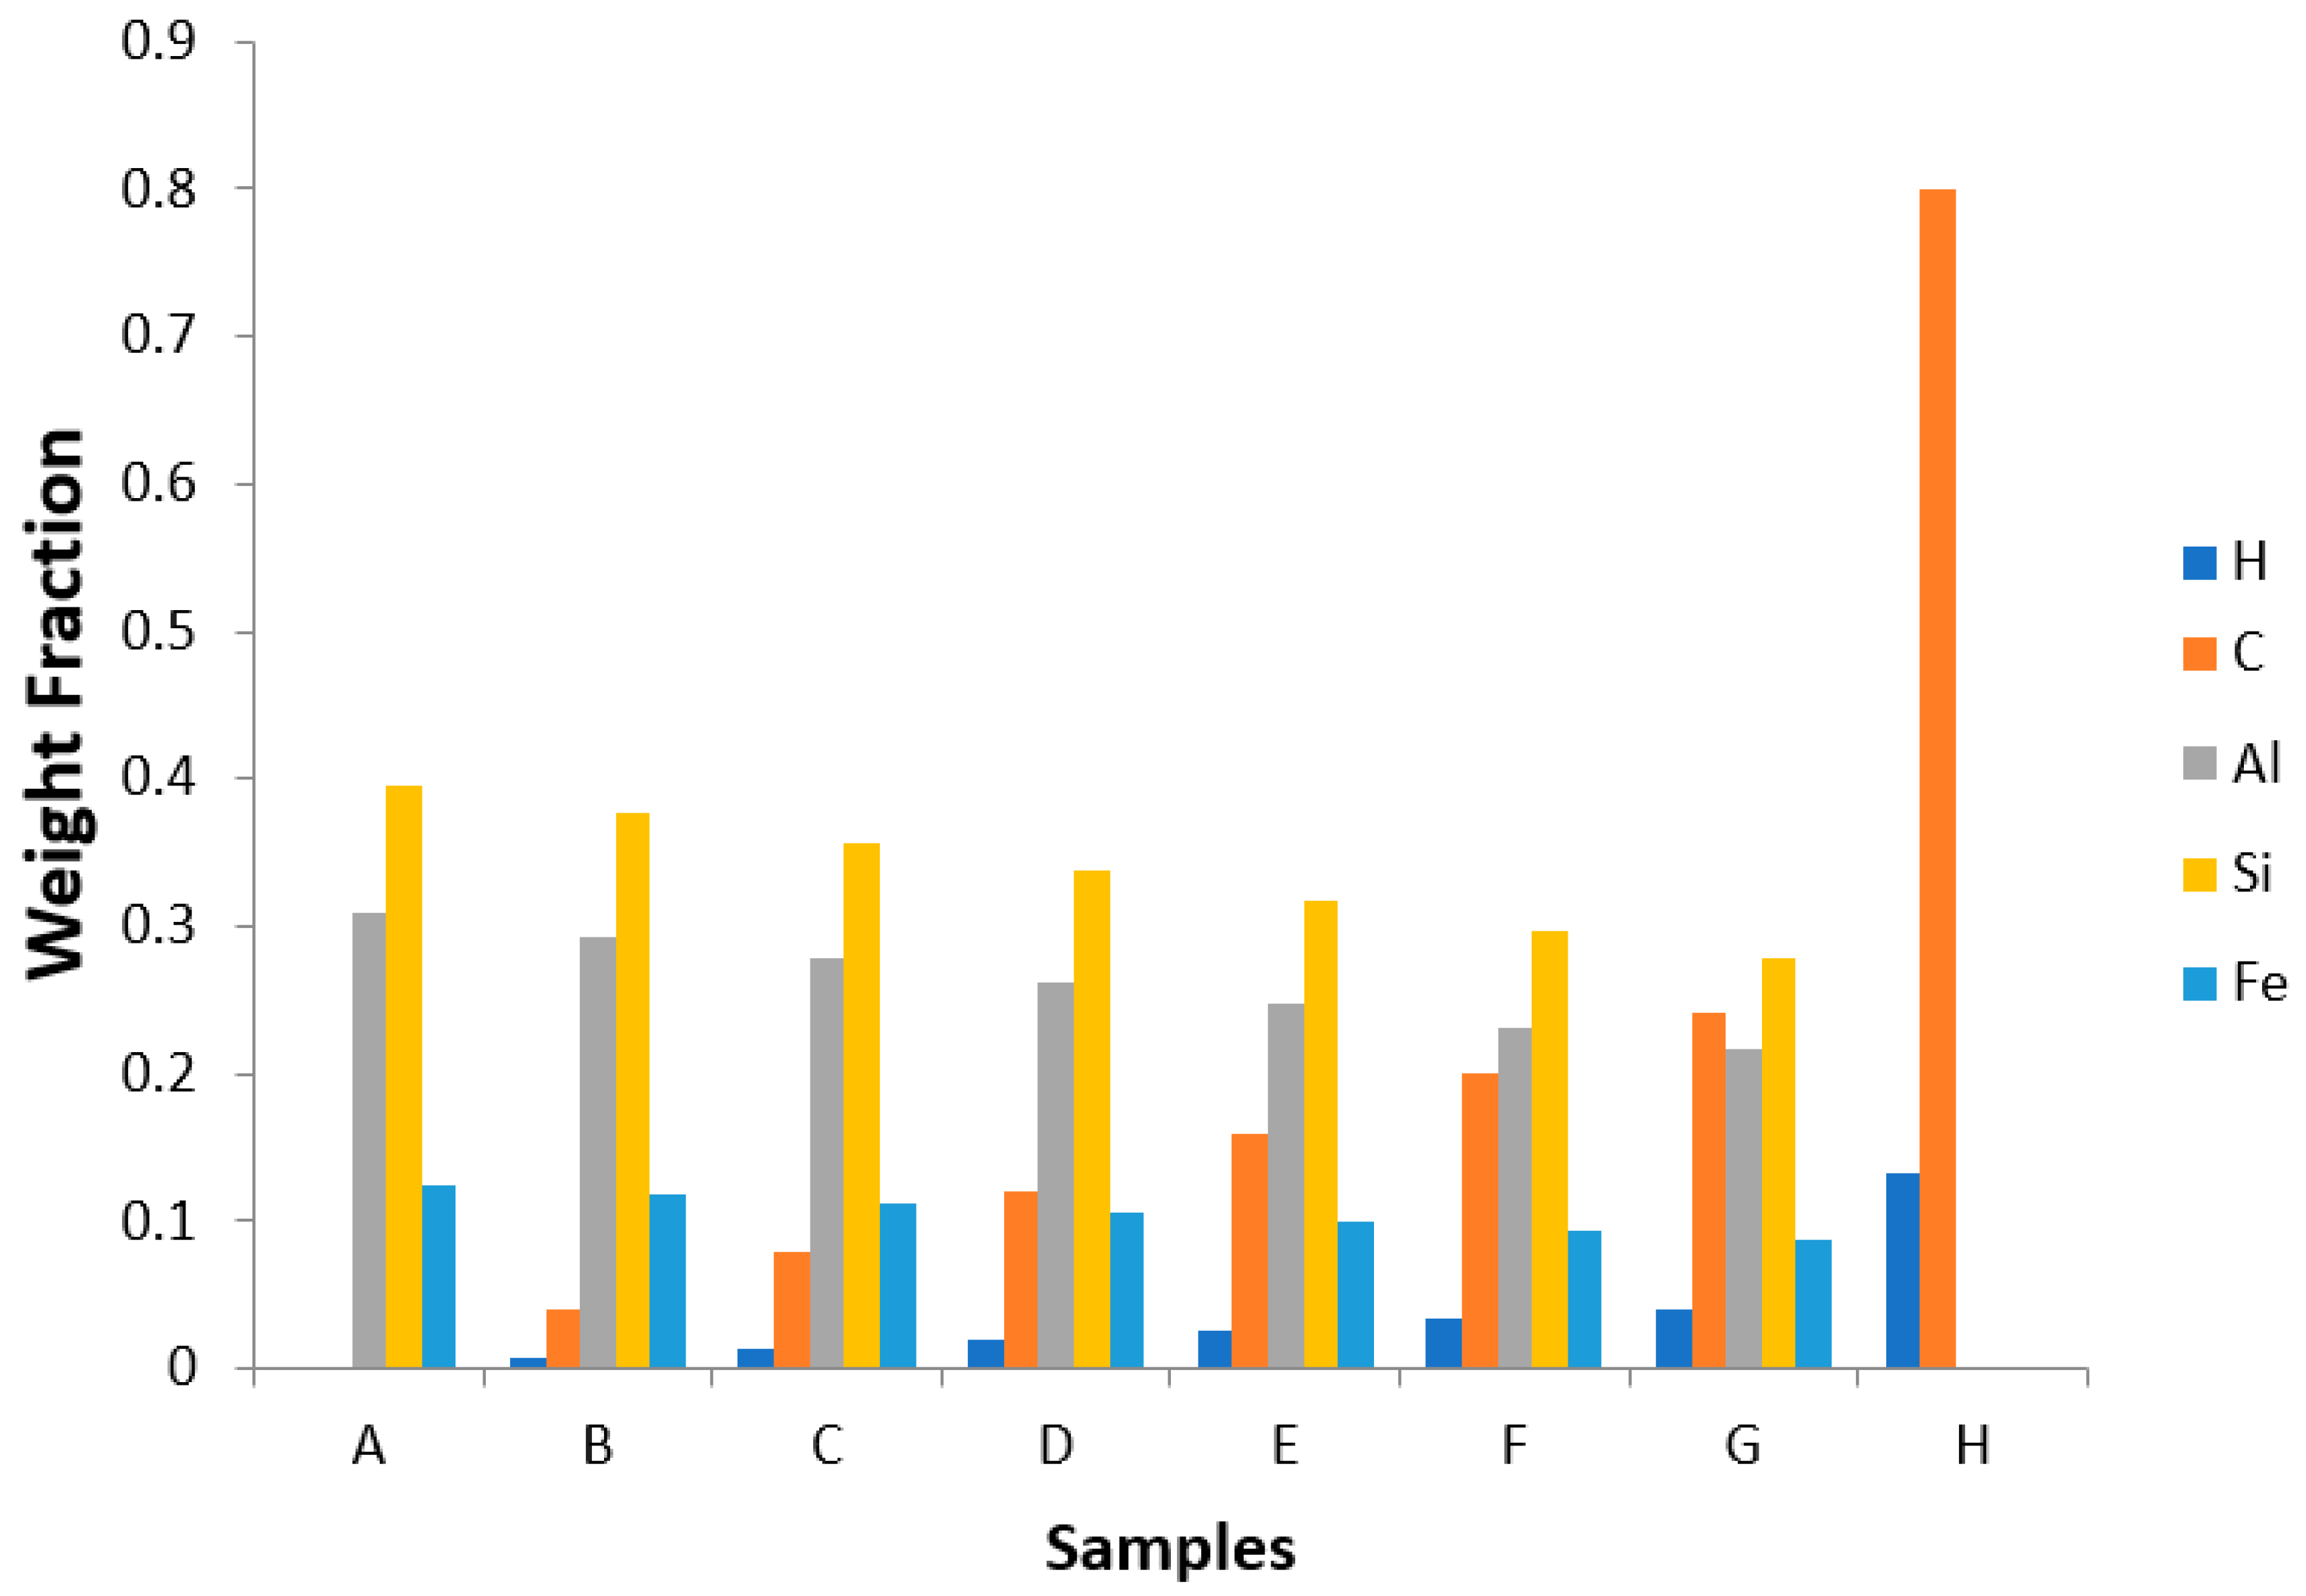
3.5. PIXE and RBS Results: Elemental Composition Analysis of the Samples
4. Conclusions
Author Contributions
Funding
Institutional Review Board Statement
Informed Consent Statement
Data Availability Statement
Acknowledgments
Conflicts of Interest
References
- Robert, E.M. The Interaction of Radiation with Matter. In Nuclear Engineering Fundamentals: A Practical Perspective; CRC Press Taylor & Francis Group: Boca Raton, FL, USA, 2017; pp. 777–814. [Google Scholar]
- Mostafa, A.M.A.; Issa, S.A.M.; Sayyed, M.I. Gamma ray shielding properties of PbO-B2O3-P2O5 doped with WO3. J. Alloys Compd. 2017, 708, 294–300. [Google Scholar] [CrossRef]
- Sayyed, M.I.; Al-Hadeethi, Y.; AlShammari, M.M.; Ahmed, M.; Al-Heniti, S.H.; Rammah, Y.S. Physical, optical and gamma radiation shielding competence of newly boro-tellurite based glasses: TeO2-B2O3-ZnO-Li2O3-Bi2O3. Ceram. Int. 2021, 47, 611–618. [Google Scholar] [CrossRef]
- Sayyed, M.I.; Askin, A.; Zaid, M.H.M.; Olukotun, S.F.; Khandaker, M.U.; Tishkevich, D.I.; Bradley, D.A. Radiation shielding and mechanical properties of Bi2O3-Na2O-TiO2-ZnO-TeO2 glass system. Radiat. Phys. Chem. 2021, 186, 109556. [Google Scholar] [CrossRef]
- Alallak, N.A.; Sarhan, S.S. Factors affecting gamma ray transmission. Jordan J. Phys. 2012, 5, 77–88. [Google Scholar]
- Lamarsh, J.R.; Baratta, A.J. Introduction to Nuclear Engineering, 3rd ed.; Prentice Hall: Hoboken, NJ, USA, 2001. [Google Scholar]
- Abd Elwahab, N.R.; Helal, N.; Mohamed, T.; Shahin, F.; Ali, F.M. New shielding composite paste for mixed fields of fast neutrons and gamma rays. Mater. Chem. Phys. 2019, 233, 249–253. [Google Scholar] [CrossRef]
- Olukotun, S.F.; Mann, K.S.; Gbenu, S.T.; Ibitoye, F.I.; Oladejo, O.F.; Joshi, A.; Tekin, H.O.; Sayyed, M.I.; Fasasi, M.K.; Balogun, F.A.; et al. Neutron-shielding behaviour investigations of some clay-materials. Nucl. Eng. Technol. 2019, 51, 1444–1450. [Google Scholar] [CrossRef]
- Tsoulfanidis, N. Computational Methods in Reactor Shielding. Nucl. Technol. 1984, 64, 102. [Google Scholar] [CrossRef]
- Krane, K.S.; Lynch, W.G. Introductory Nuclear Physics, 3rd ed.; Physics Today; American Institute of Physics: New York, NY, USA, 1989. [Google Scholar] [CrossRef]
- Akkurt, I.; El-Khayatt, A.M. The effect of barite proportion on neutron and gamma-ray shielding. Ann. Nucl. Energy 2013, 51, 5–9. [Google Scholar] [CrossRef]
- Sayyed, M.I. Investigations of gamma ray and fast neutron shielding properties of tellurite glasses with different oxide compositions. Can. J. Phys. 2016, 94, 1133–1137. [Google Scholar] [CrossRef] [Green Version]
- Olukotun, S.F.; Gbenu, S.T.; Ibitoye, F.I.; Oladejo, O.F.; Shittu, H.O.; Fasasi, M.K.; Balogun, F.A. Investigation of gamma radiation shielding capability of two clay materials. Nucl. Eng. Technol. 2018, 50, 957–962. [Google Scholar] [CrossRef]
- Tajudin, S.M.; Sabri, A.H.A.; Aziz, M.Z.A.; Olukotun, S.F.; Ojo, B.M.; Fasasi, M.K. Feasibility of clay-shielding material for low-energy photons (Gamma/X). Nucl. Eng. Technol. 2019, 51, 1633–1637. [Google Scholar] [CrossRef]
- Kim, J.D.; Ahn, S.; Lee, Y.D.; Park, C.J. Design optimization of radiation shielding structure for lead slowing-down spectrometer system. Nucl. Eng. Technol. 2015, 47, 380–387. [Google Scholar] [CrossRef]
- Ituma, C.G.; Etukudoh, A.B.; Abuh, M.A.; Akpomie, K.G.; Obioha, C.I. Utilization of Nkpuma-Akpatakpa clay in ceramics: Characterization and microstructural studies. J. Appl. Sci. Environ. Manag. 2018, 22, 47–53. [Google Scholar] [CrossRef]
- Olukotun, S.F.; Gbenu, S.T.; Oladejo, O.F.; Sayyed, M.I.; Tajudin, S.M.; Amosun, A.A.; Fadodun, O.G.; Fasasi, M.K. Investigation of gamma ray shielding capability of fabricated clay-polyethylene composites using EGS5, XCOM and Phy-X/PSD. Radiat. Phys. Chem. 2020, 177, 109079. [Google Scholar] [CrossRef]
- Olukotun, S.F.; Gbenu, S.T.; Oladejo, O.F.; Balogun, F.O.; Sayyed, M.I.; Tajudin, S.M.; Obiajunwa, E.I.; Fasasi, M.K. The Effect of Incorporated Recycled Low Density Polyethylene (LDPE) on the Fast Neutron Shielding Behaviour (FNSB) of Clay Matrix using MCNP and PHITS Monte Carlo Codes. Radiat. Phys. Chem. 2021, 182, 109351. [Google Scholar] [CrossRef]
- Callister, W.D.; Rethwisch, D.G. Materials Science and Engineering—AnIntroduction, 9th ed.; John Wiley and Sons Inc.: Hoboken, NJ, USA, 2013. [Google Scholar]
- Azeko, S.T.; Mustapha, K.; Annan, E.; Odusanya, O.S.; Soboyejo, A.B.O.; Soboyejo, W.O. Statistical Distributions of the Strength and Fracture Toughness of Recycled Polyethylene-Reinforced Laterite Composites. J. Mater. Civ. Eng. 2016, 28, 04015146. [Google Scholar] [CrossRef]
- ASTM C20. Standard Test Methods for Apparent Porosity, Water Absorption, Apparent Specific Gravity, and Bulk Density of Burned Refractory Brick and Shapes by Boiling Water; ASTM International: West Conshohocken, PA, USA, 2015; pp. 1–3. [Google Scholar] [CrossRef]
- Chesti, A.R. Refractories: Manufacture, Properties and Applications; Prentice-Hall of India Private Ltd.: New Delhi, India, 1986. [Google Scholar]
- Hassan, S.B. Modern Refractories: Production, Properties, Testing and Application; Timo Commercial Printers: Samaru, Zaria, 2005. [Google Scholar]
- Satyanarayana, T. A Review on Chemical and Physical Synthesis Methods of Nanomaterials. Int. J. Res. Appl. Sci. Eng. Technol. 2018, 6, 2885–2889. [Google Scholar] [CrossRef]
- Bouroushian, M.; Kosanovic, T. Characterization of Thin Films by Low Incidence X-Ray Diffraction. Cryst. Struct. Theory Appl. 2012, 1, 35–39. [Google Scholar] [CrossRef] [Green Version]
- Danilatos, G.D. Review and outline of environmental SEM at present. J. Microsc. 1991, 162, 391–402. [Google Scholar] [CrossRef]
- Obiajunwa, E.I.; Osinkolu, G.A.; Ibitoye, F.I.; Pelemo, D.A. Ion beam analysis facility at the centre for energy research & development at Ile-Ife Nigeria and its applications in research. Nucl. Instrum. Methods Phys. Res. Sect. B Beam Interact. Mater. Atoms. 2019, 477, 46–53. [Google Scholar] [CrossRef]
- Aremu, D.A.; Aremu, J.O.; Ibrahim, U.H. Analysis Of Mubi Clay Deposit As A Furnace Lining. Int. J. Sci. Technol. Res. 2013, 2, 182–186. [Google Scholar]
- Edah, A.O.; Kolawole, J.A.; Solomon, A.O.; Shamle, N.; Awode, A.U. Instrumental analysis of Arrinrasho clay for characterization. J. Res. Environ. Sci. Toxicol. 2012, 1, 019–022. [Google Scholar]
- Shen, S.; Zaidi, S.R.; Mutairi, B.A.; Shehry, A.A.; Sitepu, H.; Hamoud, S.A.; Khaldi, F.S.; Edhaim, F.A. Quantitative XRD bulk and clay mineralogical determination of paleosol sections of Unayzah and Basal Khuffclastics in Saudi Arabia. Powder Diffr. 2012, 27, 126–130. [Google Scholar] [CrossRef]
- Folorunso, D.O.; Olubambi, P.; Borode, J.O. Characterization and Qualitative Analysis of Some Nigerian Clay Deposits for Rafractory Applications. IOSR J. Appl. Chem. 2014, 7, 40–47. [Google Scholar] [CrossRef]
- Wang, H.; Li, C.; Peng, Z.; Zhang, S. Characterization and thermal behavior of kaolin. J. Therm. Anal. Calorim. 2011, 105, 157–160. [Google Scholar] [CrossRef]
- Er-ramly, A.; Ider, A. Physicochemical and mineralogical characterization of grey clay resulting from the transformation of brown clay of Safi treated with (HCL) and its use in ceramic. Phys. Chem. News 2012, 66, 100–106. [Google Scholar]
- Er-ramly, A. Physicochemical and Mineralogical Characterization of Moroccan Bentonite of Trebia and Its Use in Ceramic Technology. Am. J. Phys. Chem. 2014, 3, 96–101. [Google Scholar] [CrossRef] [Green Version]
- Abdullahi, S.L.; Audu, A.A. Comparative analysis on chemical composition of bentonite clays obtained from Ashaka and tango deposits in Gombe State, Nigeria. ChemSearch J. 2017, 8, 35–40. [Google Scholar]
- Yahaya, S.; Jikan, S.S.; Badarulzaman, N.A.; Adamu, A.D. Effects of Acid Treatment on the SEM-EDX Characteristics of Kaolin Clay. Path Sci. 2017, 3, 4001–4005. [Google Scholar] [CrossRef] [Green Version]
- Jiraskova, Y.; Bursik, J.; Seidlerova, J.; Kutlakova, K.M.; Safarik, I.; Safarikova, M.; Pospiskova, K.; Zivotsky, O. Microstructural analysis and magnetic characterization of native and magnetically modified montmorillonite and vermiculite. J. Nanomater. 2018, 2018, 3738106. [Google Scholar] [CrossRef] [Green Version]
- Sokol, H.; Sprynskyy, M.; Ganzyuk, A.; Raks, V.; Buszewski, B. Structural, Mineral and Elemental Composition Features of Iron-Rich Saponite Clay from Tashkiv Deposit (Ukraine). Colloids Interfaces 2019, 3, 10. [Google Scholar] [CrossRef] [Green Version]
- Yeskis, D.; Van Groos, A.F.K.; Guggenheim, S. The dehydroxylation of kaolinite. Am. Mineral. 1985, 70, 159–164. [Google Scholar]
- Faieta-Boada, S.M.; McColm, I.J. Preliminary analysis of the thermal behaviour of an industrially used Ecuadorian clay. Appl. Clay Sci. 1993, 8, 215–230. [Google Scholar] [CrossRef]
- Mukasa-Tebandeke, I.Z.; Ssebuwufu, P.J.M.; Nyanzi, S.A.; Schumann, A.; Nyakairu, G.W.A.; Ntale, M.; Lugolobi, F. The Elemental, Mineralogical, IR, DTA and XRD Analyses Characterized Clays and Clay Minerals of Central and Eastern Uganda. Adv. Mater. Phys. Chem. 2015, 5, 67–86. [Google Scholar] [CrossRef] [Green Version]
- Quaranta, N.; Caligaris, M.; Unsen, M.; López, H.; Pelozo, G.; Pasquini, J.; Vieira, C. Ceramic Tiles Obtained from Clay Mixtures with the Addition of Diverse Metallurgical Wastes. J. Mater. Sci. Chem. Eng. 2014, 2, 1–5. [Google Scholar] [CrossRef] [Green Version]
- Khandah, R.K.; Gangopadhyay, P.K.; Rao, T.C. Differential Thermal Analysis of Studies of some Indian Clays; Proc. Indian Natn. Sci. Acad. Clay Science: Calcutta, India, 1984; pp. 234–241. [Google Scholar]
- Omotoyinbo, J.A.; Oluwole, O.O. Working Properties of Some Selected Refractory Clay Deposits in South Western Nigeria. J. Miner. Mater. Charact. Eng. 2008, 7, 233–245. [Google Scholar] [CrossRef]


| Sample Name | wt% of Clay | wt% of LDPE |
|---|---|---|
| A | 100 | 0 |
| B | 95 | 5 |
| C | 90 | 10 |
| D | 85 | 15 |
| E | 80 | 20 |
| F | 75 | 25 |
| G | 70 | 30 |
| Sample A | Sample B | Sample C | Sample D | Sample E | Sample F Bulk Density | Sample G | ||||||||
|---|---|---|---|---|---|---|---|---|---|---|---|---|---|---|
| Element | Wt% | Wt% Sigma | Wt% | Wt% Sigma | Wt% | Wt% Sigma | Wt% | Wt% Sigma | Wt% | Wt% Sigma | Wt% | Wt% Sigma | Wt% | Wt% Sigma |
| C | 11.99 | 0.25 | 15.97 | 0.23 | 17.48 | 0.22 | 13.26 | 0.19 | 27.09 | 0.19 | 18.98 | 0.25 | 14.27 | 0.24 |
| O | 45.91 | 0.18 | 41.24 | 0.16 | 44.20 | 0.16 | 43.74 | 0.16 | 44.47 | 0.14 | 32.43 | 0.16 | 44.69 | 0.17 |
| Mg | 0.36 | 0.02 | 0.54 | 0.02 | 0.29 | 0.02 | 0.39 | 0.02 | 0.36 | 0.02 | 0.44 | 0.02 | 0.41 | 0.02 |
| Al | 13.81 | 0.07 | 12.35 | 0.06 | 9.78 | 0.05 | 12.48 | 0.06 | 9.51 | 0.05 | 11.33 | 0.07 | 12.93 | 0.07 |
| Si | 18.10 | 0.09 | 17.81 | 0.08 | 20.73 | 0.08 | 15.81 | 0.07 | 12.74 | 0.06 | 16.05 | 0.09 | 18.11 | 0.09 |
| S | - | - | - | - | - | - | 0.11 | 0.02 | - | - | - | - | - | - |
| K | 2.88 | 0.04 | 1.17 | 0.03 | 0.86 | 0.03 | 0.89 | 0.02 | 0.80 | 0.02 | 1.93 | 0.04 | 1.78 | 0.03 |
| Ca | 0.27 | 0.03 | 0.38 | 0.03 | 0.23 | 0.02 | 0.22 | 0.02 | 0.20 | 0.02 | 0.41 | 0.03 | 0.26 | 0.03 |
| Ti | 0.69 | 0.04 | 1.40 | 0.04 | 0.54 | 0.03 | 0.64 | 0.03 | 0.47 | 0.02 | 1.66 | 0.06 | 0.77 | 0.04 |
| Fe | 6.00 | 0.10 | 9.14 | 0.11 | 5.89 | 0.09 | 10.72 | 0.10 | 4.37 | 0.06 | 16.76 | 0.16 | 6.78 | 0.10 |
| W | - | - | - | - | - | - | 1.37 | 0.19 | - | - | - | - | - | - |
| Os | - | - | - | - | - | - | 0.37 | 0.09 | - | - | - | - | ||
| Sample A | Sample B | Sample C | Sample D | Sample E | Sample F Bulk Density | Sample G | ||||||||
|---|---|---|---|---|---|---|---|---|---|---|---|---|---|---|
| Element | Wt% | Atomic Fraction% | Wt% | Atomic Fraction% | Wt% | Atomic Fraction% | Wt% | Atomic Fraction% | Wt% | Atomic Fraction% | Wt% | Atomic Fraction% | Wt% | Atomic Fraction% |
| C | 11.99 | 19.05 | 15.97 | 25.32 | 17.48 | 26.59 | 13.26 | 21.55 | 27.09 | 37.80 | 18.98 | 31.55 | 14.27 | 22.38 |
| O | 45.91 | 54.72 | 41.24 | 49.04 | 44.20 | 50.43 | 43.74 | 53.31 | 44.47 | 46.54 | 32.43 | 40.43 | 44.69 | 52.56 |
| Mg | 0.36 | 0.29 | 0.54 | 0.43 | 0.29 | 0.22 | 0.39 | 0.32 | 0.36 | 0.25 | 0.44 | 0.37 | 0.41 | 0.32 |
| Al | 13.81 | 9.75 | 12.35 | 8.70 | 9.78 | 6.61 | 12.48 | 9.01 | 9.51 | 5.90 | 11.33 | 8.37 | 12.93 | 9.01 |
| Si | 18.10 | 12.33 | 17.81 | 12.10 | 20.73 | 13.51 | 15.81 | 11.01 | 12.74 | 7.62 | 16.05 | 11.43 | 18.11 | 12.17 |
| S | - | - | - | - | - | - | 0.11 | 0.07 | - | - | - | - | - | - |
| K | 2.88 | 1.41 | 1.17 | 0.57 | 0.86 | 0.40 | 0.89 | 0.45 | 0.80 | 0.34 | 1.93 | 0.99 | 1.78 | 0.86 |
| Ca | 0.27 | 0.13 | 0.38 | 0.18 | 0.23 | 0.10 | 0.22 | 0.11 | 0.20 | 0.08 | 0.41 | 0.20 | 0.26 | 0.12 |
| Ti | 0.69 | 0.27 | 1.40 | 0.55 | 0.54 | 0.21 | 0.64 | 0.26 | 0.47 | 0.16 | 1.66 | 0.69 | 0.77 | 0.30 |
| Fe | 6.00 | 2.04 | 9.14 | 3.11 | 5.89 | 1.92 | 10.72 | 3.73 | 4.37 | 1.31 | 16.76 | 5.97 | 6.78 | 2.28 |
| W | - | - | - | - | - | - | 1.37 | 0.15 | - | - | - | - | - | - |
| Os | - | - | - | - | - | - | 0.37 | 0.04 | - | - | - | - | - | - |
| Element | H | C | N | O | F | Mg | Al | Si | P | K | Ca | Ti | Cr | Mn | Fe | Zn | As | Sr | Zr | Density g/cm3 |
|---|---|---|---|---|---|---|---|---|---|---|---|---|---|---|---|---|---|---|---|---|
| Sample A | 0.0164 | 0.3092 | 0.3964 | 0.0013 | 0.0301 | 0.0972 | 0.0228 | 0.0006 | 0.0013 | 0.1239 | 0.0003 | 0.0001 | 0.0001 | 0.0003 | 2.030 | |||||
| B | 0.0067 | 0.0401 | 0.0012 | 0.0020 | 0.0001 | 0.0156 | 0.2937 | 0.3766 | 0.0013 | 0.0286 | 0.0924 | 0.0217 | 0.0005 | 0.0012 | 0.1177 | 0.0003 | 0.0001 | 0.0001 | 0.0003 | 1.975 |
| C | 0.0133 | 0.0800 | 0.0025 | 0.0040 | 0.0002 | 0.0148 | 0.2784 | 0.3570 | 0.0012 | 0.0271 | 0.0875 | 0.0206 | 0.0005 | 0.0012 | 0.1115 | 0.0003 | 0.0000 | 0.0001 | 0.0003 | 1.688 |
| D | 0.0200 | 0.1202 | 0.0037 | 0.0060 | 0.0003 | 0.0140 | 0.2629 | 0.3370 | 0.0011 | 0.0256 | 0.0827 | 0.0194 | 0.0005 | 0.0011 | 0.1053 | 0.0003 | 0.0000 | 0.0001 | 0.0002 | 1.633 |
| E | 0.0267 | 0.1600 | 0.0049 | 0.0080 | 0.0004 | 0.0131 | 0.2474 | 0.3171 | 0.0011 | 0.0241 | 0.0778 | 0.0183 | 0.0004 | 0.0010 | 0.0991 | 0.0003 | 0.0000 | 0.0001 | 0.0002 | 1.567 |
| F | 0.0333 | 0.2001 | 0.0062 | 0.0100 | 0.0006 | 0.0123 | 0.2319 | 0.2973 | 0.0010 | 0.0226 | 0.0729 | 0.0171 | 0.0004 | 0.0010 | 0.0929 | 0.0003 | 0.0000 | 0.0001 | 0.0002 | 1.501 |
| G | 0.0401 | 0.2408 | 0.0074 | 0.0120 | 0.0007 | 0.0115 | 0.2165 | 0.2775 | 0.0009 | 0.0211 | 0.0681 | 0.0160 | 0.0004 | 0.0009 | 0.0867 | 0.0002 | 0.0000 | 0.0001 | 0.0002 | 1.341 |
| H | 0.1333 | 0.8000 | 0.0246 | 0.0399 | 0.0022 |
Publisher’s Note: MDPI stays neutral with regard to jurisdictional claims in published maps and institutional affiliations. |
© 2021 by the authors. Licensee MDPI, Basel, Switzerland. This article is an open access article distributed under the terms and conditions of the Creative Commons Attribution (CC BY) license (https://creativecommons.org/licenses/by/4.0/).
Share and Cite
Olukotun, S.F.; Gbenu, S.T.; Oyedotun, K.O.; Fasakin, O.; Sayyed, M.I.; Akindoyin, G.O.; Shittu, H.O.; Fasasi, M.K.; Khandaker, M.U.; Osman, H.; et al. Fabrication and Characterization of Clay-Polyethylene Composite Opted for Shielding of Ionizing Radiation. Crystals 2021, 11, 1068. https://0-doi-org.brum.beds.ac.uk/10.3390/cryst11091068
Olukotun SF, Gbenu ST, Oyedotun KO, Fasakin O, Sayyed MI, Akindoyin GO, Shittu HO, Fasasi MK, Khandaker MU, Osman H, et al. Fabrication and Characterization of Clay-Polyethylene Composite Opted for Shielding of Ionizing Radiation. Crystals. 2021; 11(9):1068. https://0-doi-org.brum.beds.ac.uk/10.3390/cryst11091068
Chicago/Turabian StyleOlukotun, S. F., S. T. Gbenu, K. O. Oyedotun, O. Fasakin, M. I. Sayyed, G. O. Akindoyin, H. O. Shittu, M. K. Fasasi, Mayeen Uddin Khandaker, Hamid Osman, and et al. 2021. "Fabrication and Characterization of Clay-Polyethylene Composite Opted for Shielding of Ionizing Radiation" Crystals 11, no. 9: 1068. https://0-doi-org.brum.beds.ac.uk/10.3390/cryst11091068