Article

Growth of Acetaminophen Polymorphic Crystals and Solution-Mediated Phase Transition from Trihydrate to Form II in Agarose Gel

1
Graduate School of Life and Environmental Sciences, Kyoto Prefectural University, 1-5, Hangi-cho, Shimogamo, Sakyo-ku, Kyoto 606-8522, Japan
2
Graduate School of Engineering, Osaka University, 2-1, Yamadaoka, Osaka 565-0871, Japan
3
Institute for Advanced Co-Creation Studies, Osaka University, 2-1, Yamadaoka, Osaka 565-0871, Japan
4
Department of Chemistry, Saitama University, 255, Shimookubo, Sakura-ku, Saitama 338-8570, Japan
5
Institute of Laser Engineering, Osaka University, 2-6, Yamadaoka, Osaka 565-0871, Japan
*
Authors to whom correspondence should be addressed.
Submission received: 27 July 2021 / Revised: 19 August 2021 / Accepted: 31 August 2021 / Published: 5 September 2021
(This article belongs to the Special Issue Crystallization Processes: Food and Pharmaceutical Crystals)

Abstract

:
The growth of acetaminophen polymorphic crystals and the solution-mediated phase transition from trihydrate to form II in agarose gel were investigated. The form II crystals grown in gels, presumably because of the agarose content, dissolved less rapidly at high temperatures and were more stable than in water. The trihydrate crystals in the gel were also expected to be stabilized by containing agarose, but in fact the fine morphology resulted in reduced stability. The solution-mediated phase transition from trihydrate to form II via form II seeding took longer in the gel because the gel slowed down the dissolution of the trihydrate by hindering the dispersion of the form II seeds and delayed the growth of form II by reducing the diffusion rate of the molecules dissolved from the trihydrate. Delays in solution-mediated phase transition and changes in stability for crystals grown in gels indicate the effectiveness of gels in controlling polymorphisms in pharmaceutical compounds.

Graphical Abstract

1. Introduction

The ability of a chemical compound to have more than one crystalline form is known as polymorphism [1]. Polymorphism is attracting attention in various fields such as pharmaceuticals, foods, pigments, dyes, and semiconductors, because their physicochemical properties differ depending on the polymorphs [2]. Polymorph crystals are classified into the most thermodynamically stable phase (form) and unstable phases including metastable phases. Stable phases have a more stable formation and lower solubility than unstable phases [3,4]. In pharmaceuticals, polymorphism has especially direct medical implications because the dissolution rates depend on the polymorph’s type. Typically, the bioavailability of the stable phase, because of its lower solubility, is lower than that of other metastable phases [5]. However, metastable phases readily transform into a stable phase. Therefore, a stable phase is generally used in commercial formulations of drugs. Suppression of transitions from metastable to stable phases can facilitate the analysis and handling of the metastable phase and may change the current stance on the use of the metastable phase in drug development [6,7].
Recently, it has become clear that protein crystals produced in hydrogels are resistant to osmotic pressure and mechanical impact [8,9,10]. The mechanical strength of crystals is improved by incorporating gel fibers into protein crystals. Similar effects have been reported for nanofibers and papers [11,12]. Moreover, hydrogels influence the growth and phase transition of pharmaceutical compound crystals [13,14]. Therefore, in order to deepen the understanding of crystallization and phase transition for pharmaceutical compounds in gels, it is necessary to accumulate further experimental data by various attempts, such as diverse compounds and a wide variety of conditions.
Agarose gel, owing to its stability and usability, is the most commonly used hydrogel for protein crystallization [15]. Agarose is a neutral polysaccharide with a strong gelling power and is the main component of agar extracted from red algae [16]. Gelation of agarose in solution is thought to occur via a helix formation and is mainly caused by cooling to approximately 40 °C or less [17]. Agarose gel strength at 25 °C was almost zero for concentrations up to 0.4% (w/v) but increased at concentrations higher than 0.4% (w/v) [18]. The pore size of the agarose gel decreases with increasing concentration according to the power of concentration. At agarose concentrations of 0.5–2.0% (w/v), the pore size is in the order of hundreds of nanometers to several micrometers, which is significantly larger than molecules of proteins or pharmaceutical compounds [19]. Thus, although these molecules can diffuse in gels, the diffusion rate is considered to be lower than that in water [20].
Acetaminophen (paracetamol) is a widely used antipyretic and analgesic drug that is also employed as a model compound in crystallization research, especially on polymorphic control [21]. Diverse polymorphs of acetaminophen have been reported: form I (stable phase), form II (metastable phase), and form III (metastable phase) [22,23,24]. Three hydrates (monohydrate, dihydrate, and trihydrate) are also reported [25,26,27]. Form I is adopted in commercial formulations. The crystallization of form II and trihydrate unstable phases has been conducted via, for example, femtosecond laser irradiation, ultrasound irradiation, stirring-ball method, and microflow systems [28,29,30,31,32,33,34,35]. The resulting metastable crystals undergo solution-mediated phase transitions via seeding to a more stable form (transitions of trihydrate to form II and form II to form I) [29,31]. In this study, we attempted to crystallize acetaminophen polymorphs and transform trihydrate into form II in agarose gel.

2. Experiments

2.1. Sample Preparation

Acetaminophen was purchased from Acros with a purity of 98%. This material was confirmed as being form I by powder X-ray diffraction (PXRD) (Rigaku, Tokyo, Japan) previously [29,31]. Acetaminophen solution with concentration of 40.0 mg/mL in a sealed container was prepared by dissolving acetaminophen form I in ultrapure water. The solution was stirred at 60 °C for 3 h in a drying oven. After filtration (0.22 μm), the solution was placed in an incubator at 55 °C for 1 h, then cooled to 0 °C at a constant rate of 3 °C/h and stored. The prepared acetaminophen stock was prepared in ultrapure water to obtain the desired acetaminophen concentrations. The supersaturation of form x, σx, was calculated using the formula σx = (C − Cx)/Cx, where C is the acetaminophen concentration and Cx is the solubility of form x. CI (the solubility of form I) was estimated by using the values obtained from a previous paper [28,32]. The supersaturation of solution prepared here for form I at 0 °C was σI = 4.8. Hereinafter, this is referred to as a supersaturated solution.
We used the SeaPlaque™ agarose from Lonza. Agarose gel was prepared by dissolving agarose in ultrapure water at 80 °C. For crystallization of acetaminophen in agarose gel, dissolved agarose was mixed at 60 °C after filtration of acetaminophen solution to obtain the desired acetaminophen concentrations. The final concentrations of agarose were 0, 0.25, 0.50, and 1.0% (w/v).

2.2. Diffusion of Coomassie Brilliant Blue in Agarose Gels

Coomassie Brilliant Blue R-250 (CBB) was purchased from Nacalai. CBB solution with concentration of 2.5 mg/mL was prepared in ultrapure water. After 0 and 30 min of adding 20 μL CBB to the solutions (2.7 mL) in the presence and absence of agarose, the horizontal color change in the side of the vials (5 mL) was determined by ImageJ [36].

2.3. Acetaminophen Polymorphic Crystals in Agarose Gels

Acetaminophen form I crystals in 1.0% (w/v) agarose gel were obtained by phase transition after standing form II crystals (see below) for about one month standing at 0 °C. The polymorphs were identified by PXRD measurements, as described previously [28]. A form I crystal in agarose gel was cut out of the gel to fit their shape and dissolved in ultrapure water at 75 °C.
Acetaminophen form II crystals in the absence and presence (1.0% (w/v)) of agarose gel were obtained by seeding form II, which was separately prepared in solution using a polymer (3-mm diameter plastic ball made of polypropylene) in the supersaturated solutions at 0 °C [30]. The polymorphs were identified by PXRD measurements, as described previously [28]. Form II crystals in the absence and presence (1.0% (w/v)) of agarose gel were taken out and dissolved in ultrapure water at 75 °C.
Acetaminophen trihydrate crystals in the absence and presence (0.25, 0.5, and 1.0% (w/v)) of agarose gel were obtained by seeding trihydrate, which was separately prepared in solution using a stirring ball in the supersaturated solutions at 0 °C [31]. The polymorphs were identified by Raman spectroscopy, as described previously [33]. Trihydrate crystals in the absence and presence of agarose gel were dissolved in ultrapure water at 30 °C.

2.4. Solubility of Acetaminophen Polymorphic Crystals in Agarose Gels

The solubility of acetaminophen crystals was determined by measuring the weight of the solute by drying the saturated solutions after removing crystals that have stopped growing [28]. That is, in the presence and absence of agarose gels, the solubility can be determined by (MS − M)/V, where MS is the dry weight with the solute including the container, M is the dry weight without solute including the container, and V is the sample volume. The experiment was carried out 3 times each, and the average value was calculated.

2.5. Solution-Mediated Phase Transition from Acetaminophen Trihydrate to Form II in Agarose Gels

For observing trihydrate dissolution by the solution-mediated phase transition, 2.7 and 0.35 mL of the solutions with acetaminophen trihydrate crystals in the absence and presence (0.25, 0.5 and 1.0% (w/v)) of agarose gel in 5 mL vials were prepared. Then, 20 and 10 μL of solutions including form II were seeded into 2.7 and 0.35 mL of acetaminophen trihydrate crystals, respectively. For observing form II growth by the phase transition, 0.5 mL of acetaminophen trihydrate crystals in the absence and presence (1.0% (w/v)) of agarose gel in 10 mL vials were prepared. Then, 5 μL of solution including form II was seeded into the vials. The solution-mediated phase transition experiments were performed at 25 °C.

3. Results and Discussion

3.1. Diffusion of Coomassie Brilliant Blue in Agarose Gels

Prior to crystallizing acetaminophen in the gel, the state of molecular diffusion in the gel was observed using a CBB dye, as shown in Figure 1a,b. The molecular weight of CBB is approximately 826 g/mol, which is larger than that of acetaminophen (approximately 151 g/mol) but smaller than that of protein molecules. In 5 mL vials, 20 μL CBB solution was added to 2.7 mL solutions with and without agarose. The color changes of the solution immediately (dark gray curve) and 30 min (light gray curve) after adding 0.5% (w/v) CBB solution are shown in Figure 1c. Here, the color change represents the migration of the CBB molecules. The apparent diffusion rates were estimated from the difference (distance) between the two curves at a gray value of 140. As shown in Figure 1d, the diffusion rate decreased with increasing agarose concentration. We presumed that this decrease is because the pore size of the agarose gel becomes smaller and more uniform with increasing agarose concentration, thereby inhibiting the hydrodynamic molecule diffusion. The interaction between the molecules and the gel fibers may also affect the diffusion rate.
A previous study has reported that the diffusion coefficient of lysozyme molecules in the presence of agarose (1.0% (w/v)) is approximately 8 × 10⁻¹¹ m2/s. This value is approximately 50–80% of that without agarose [37]. Furthermore, it has been reported that diffusion becomes slower with cluster formation in a supersaturated solution of lysozyme [38]. Although acetaminophen is a smaller molecule than CBB and lysozyme, its diffusion rate is expected to decrease further with the formation of clusters in a supersaturated solution.

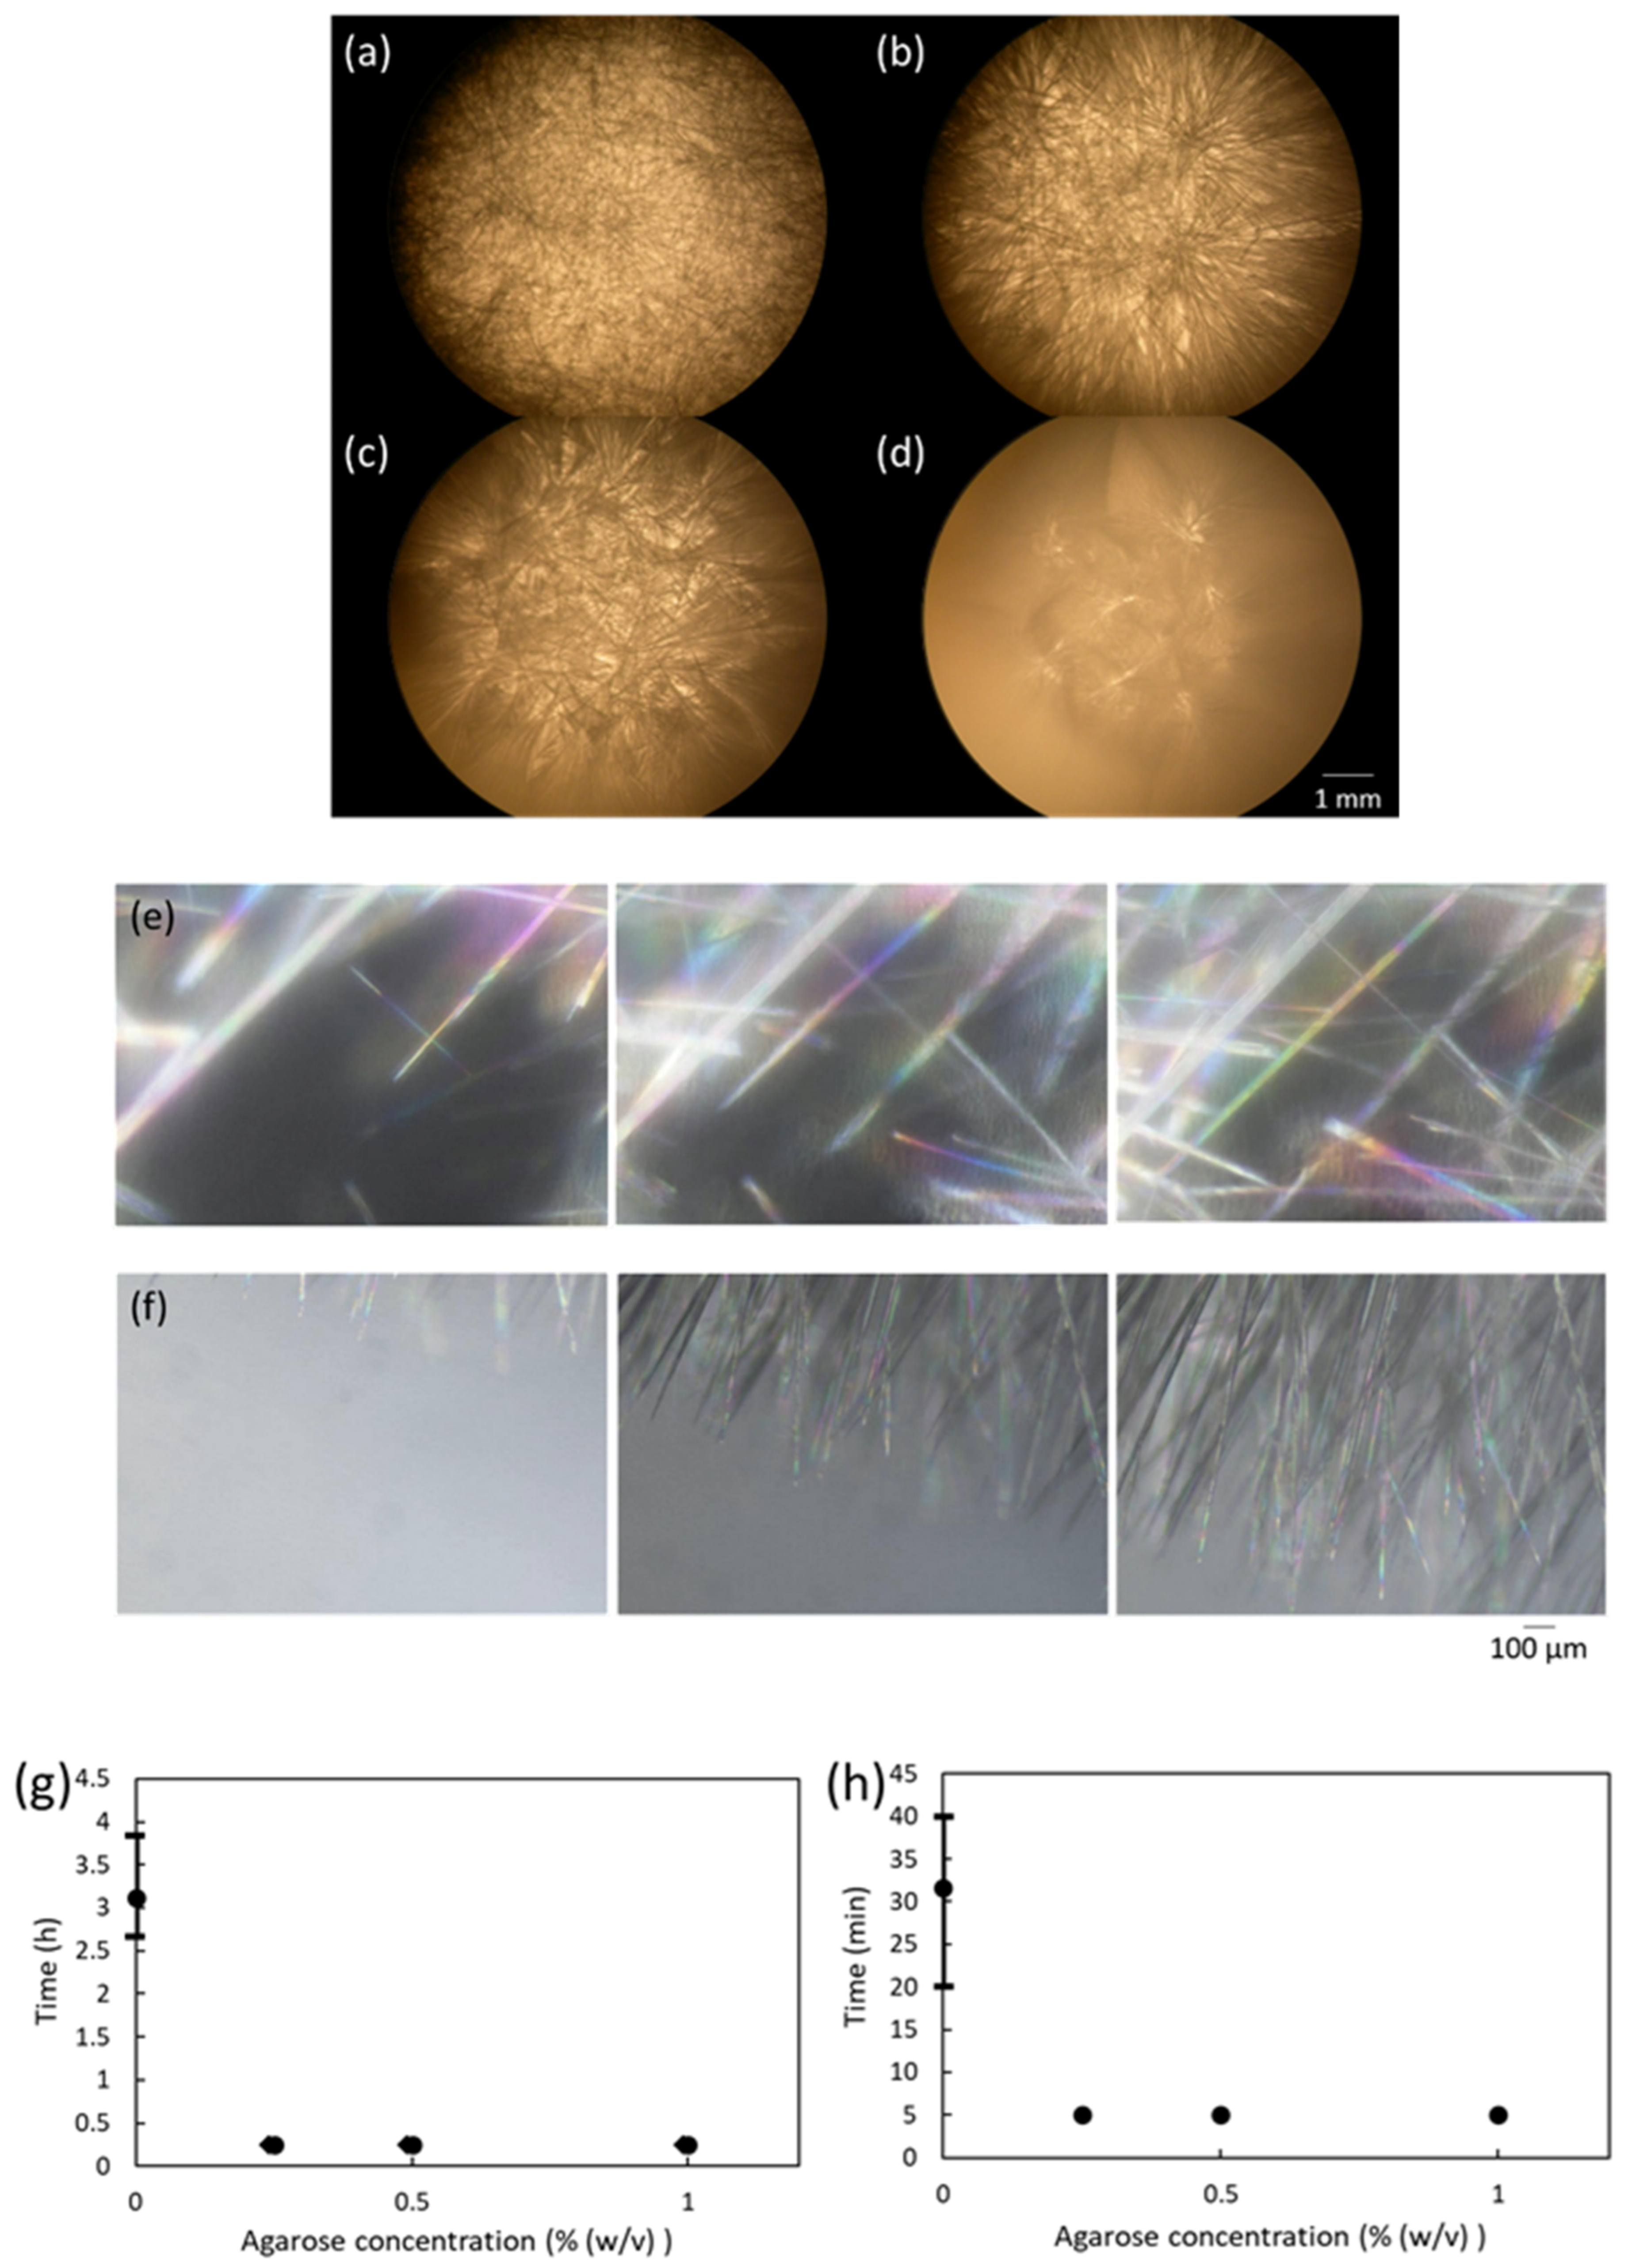
3.2. Acetaminophen Polymorphic Crystals in Agarose Gels

The effect of incorporating agarose into acetaminophen crystals was investigated using a form I crystal grown in 1.0% (w/v) agarose. Form I was chosen because it is larger in size and easier to observe than other polymorphs. The PXRD patterns of the crystals matched well with those of form I [28] (Figure S1a in the Supporting Information). The shape of form I with agarose was not significantly visually different from that without agarose. The crystals with agarose were dissolved in ultrapure water at 75 °C (Figure 2a–c). Under these conditions, the agarose gel also dissolved. Agarose gel formation was observed during the dissolution of the crystal (Figure 2d) because the crystal dissolved faster than the gel and only gels incorporated in the crystal remained. In other words, when the crystal cut out according to the crystal shape is dissolved, the gel is observed, which indicates that the gel is incorporated into the crystal. At this time, it is thought that if the crystal growth proceeds slowly, the change in crystal shape is unlikely to occur.
Form II and trihydrate also crystallized in agarose (see below; Figure 3 and Figure 4). For form II, the presence of the gel was visually confirmed during the dissolution experiment (see below). Unfortunately, owing to the small crystal size of trihydrate, experiments confirming the incorporation of agarose into trihydrate could not be performed. However, similar to the cases of form I and form II, it is speculated that agarose is incorporated into the trihydrate crystals because previous studies have also reported that gel fibers and protein molecules coexist inside protein crystals [8]. In the future, we will need to prove the crystal inclusions and analyze the structure by microscopy and other methods [39,40,41,42,43,44].
In protein crystals grown with agarose, the incorporation of agarose into the crystals increases the strength of the crystals and decreases the dissolution rate [8,45]. Thus, we compared the stabilities of form II grown in a solution with agarose (1.0% (w/v)) and water. Form II formed prism-like structures in both conditions. The PXRD patterns of the prism-like crystals matched well with those of form II [28] (Figure S1b in the Supporting Information). Moreover, the XRD data and molecular structures of the hydrogel-grown protein crystals were almost the same as those of protein crystals without gel [8,9], indicating that agarose did not affect the molecular orientation and structure. Using seven form II crystals with similar widths (approximately 0.3 mm), the change of crystal widths was measured during the melting process (Figure S2 in the Supporting Information). Figure 3 shows the average widths of the crystals grown with and without agarose. The dissolution rate of form II crystals grown with agarose was lower than that of those grown without agarose, suggesting that agarose incorporation improved the stability of form II. As in the case of form I, agarose was visually confirmed during the dissolution process.
To investigate their stability, trihydrate crystals in the gel were grown via their seeding (Figure 4a–d). The Raman spectra of the obtained crystals match those previously reported for trihydrates without the gel [33] (Figure S1c in the Supporting Information). However, the crystals became smaller and thinner as the agarose concentration increased. Therefore, the growth processes of the trihydrate were observed (Figure 4e,f). In agarose, during the crystal elongation process, they branched and became thin and small. This observation may be attributed to a fast crystal growth (<5 min) and slow molecular diffusion in the gel, resulting in a large concentration gradient near the crystals [46]. In other words, in a situation where the crystallization driving force is high, the corner parts with higher concentrations of crystal start to grow faster, which is called the Berg effect [47]. Thus, the crystals grow like trees. With agarose, the growth of form I and form II may not be as fast as that of trihydrates. Thus, they could maintain crystal shapes similar to those in water.
We performed a dissolution experiment at 30 °C to determine the stability of the trihydrate in the gel. Owing to the small size and small thickness of the trihydrate crystals, a large number of trihydrate crystals were sealed in the vial to measure the time taken for them to completely disappear from the vial. The crystals with gels dissolved faster than those without gel for both 2.7 mL and 0.35 mL solutions in 5 mL vials (Figure 4g,h). This result differs from those of proteins and form II, although we speculated that trihydrate also incorporates gel fibers and stabilizes, similarly to proteins, form I and form II. Therefore, we believe that the morphology of the trihydrates in the gel affects its stability. In particular, the fine morphology increases the surface area and promotes the dissolution.

3.3. Solubility of Acetaminophen Polymorphic Crystals in Agarose Gels

The solubilities of form I and form II were measured with (1% (w/v)) and without agarose gel at 40 °C (Table 1). Without agarose, form II was more soluble than form I, with values comparable to those reported previously [28]. There were little changes in both form I and form II with the addition of agarose. Agarose did not affect the solubility of acetaminophen crystals, possibly because agarose molecules formed hydrogen bonds with each other in the gel and did not interact much with water molecules.

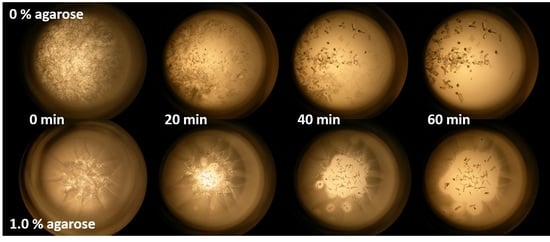
3.4. Solution-Mediated Phase Transition from Acetaminophen Trihydrate to Form II in Agarose Gels

A solution-mediated phase transition from form II seed crystals to trihydrate was observed with and without agarose. In this solution-mediated phase transition [32], form II seed crystals dissolved the trihydrates faster, and form II crystals grew by taking up the dissolved molecules. Because most of the solutions in the vials were covered with trihydrate crystals, it was difficult to observe the growth of form II. Thus, the progress of the solution-mediated phase transition was evaluated by measuring the dissolution time of the trihydrate instead. Figure 5a,b show the time profiles and trihydrate dissolution time, respectively, when 20 μL form II solution was added to 2.7 mL trihydrate solution in a 5 mL vial. With agarose, the dissolution of the trihydrate was slower, but the crystals were fixed in place. Without agarose, the subduction of trihydrate and form II was observed. While the trihydrate and form II maintained their distance in the presence of agarose, they were always in contact on the lower part of the vial in the absence of agarose. This phenomenon may have affected the dissolution time. Next, the amount of trihydrate solution was reduced (0.35 mL), and the dissolution time of trihydrate was measured in the same manner (Figure 5c). The results confirm that although the influence of subduction of trihydrate and form II was reduced, the trihydrate dissolution rate during the solution-mediated phase transition tends to be lower in the presence of agarose. This result is different from that in the case of a simple dissolution of trihydrate grown in the gel, shown above. Therefore, the delay in trihydrate melting during the solution-mediated phase transition involves factors other than the trihydrate stability in agarose. Next, we will explore the factors.
In the solution-mediated phase transition from trihydrate to form II, the effect of distance from the seeding site on the growth of form II was investigated. A 5 μL solution including form II was seeded into the center of 0.5 mL of acetaminophen trihydrate crystals in 10 mL vials in the absence and presence (1.0% (w/v)) of agarose gel. The trihydrates dissolved completely after 50 and 100 min with and without agarose, respectively (Figure 5d,e). Moreover, in the presence of agarose, form II grew around the seeding site. On the other hand, in the absence of agarose, form II grew over a wide area. These results suggest that the dispersion of form II seeds was suppressed with the introduction of agarose, resulting in the growth of small amounts of form II seeds and a delayed dissolution of trihydrates located away from the seeding site. This is quite obvious when comparing the diffusion kinetics of a molecule in a solvent and in a gel. Figure 5f shows the relationship between the distance from the seeding site and size shift (long side) of form II at 50 and 100 min for solutions with (1.0% (w/v) and without agarose. Without agarose, there was not much change in the crystal size with seeding-site distance. In contrast, with agarose, the crystals became larger as they were farther from the seeding site. The reason for this behavior is presumed to be as follows. The form II seeds grew via the incorporation of solute molecules, and the decreased concentration led to the dissolution of trihydrate. The molecules dissolved from trihydrate were then used for the growth of form II. At the seeding site, form II competed for the dissolved molecules for their growth. Without agarose, the solute molecules and molecules dissolved from the trihydrate were already supplied from afar. With agarose, the diffusion of molecules was suppressed, thereby depleting the molecules and hindering the growth of form II at the seeding site. Therefore, although the trihydrates grown with the gel are less stable, the suppressed seed dispersion and decreased diffusion rate of molecules counteracted the effect of the reduced stability, resulting in a slower solution-mediated phase transition in the gel.

4. Concluding Remarks

Polymorphic crystals of acetaminophen were prepared in agarose gels. Like protein crystals, forms I and II grew with the incorporation of agarose fibers, improving the stability but not affecting the crystal morphology. Meanwhile, for trihydrates grown in the gel, the combination of fast growth and slow diffusion resulted in finer and less stable crystals. Our results indicate that hydrogels can make polymorphs more stable or more soluble.
In agarose, form II seeding caused a solution-mediated phase transition from trihydrate to form II. The presence of agarose delayed the dissolution of trihydrate and the growth of form II, slowing the phase transition. This result may be attributed to the suppressed dispersal of form II seeds and the slow diffusion rate of the molecules dissolved in the gel, as illustrated in Figure 6. Moreover, without the destabilization of the trihydrate grown in the gel, the phase transition is expected to be slower. This allows the hydrogel to suppress the phase transition, sustain the duration of the unstable polymorph, and make its characterization more feasible. With these reasons in mind, the polymorphs grown in the gel lead to a new stage in the development of pharmaceutical compounds. We believe that our findings provide useful insights into polymorphism control.

Supplementary Materials

The following are available online at https://0-www-mdpi-com.brum.beds.ac.uk/article/10.3390/cryst11091069/s1, PXRD patterns and Raman spectra of acetaminophen crystals and dissolution of a form II crystal.

Author Contributions

Conceptualization, M.M. and K.T.; Methodology, A.N. and M.M.; Investigation, A.N.; Resources, S.-i.T., H.Y.Y., M.I., M.Y. and Y.M.; Writing—Original Draft Preparation, A.N. and K.T.; Writing—Review and Editing, M.M.; Supervision, M.Y.; Project Administration, K.T.; Funding Acquisition, H.Y.Y., M.M. and Y.M. All authors have read and agreed to the published version of the manuscript.

Funding

This work was supported by Grant-in-Aid for JSPS Fellows (No. 18J40134), Shiseido Female Researcher Science Grant, Caterpillar STEM award 2019 and the Osaka University Program for the Support of Networking among Present and Future Researchers for M.M., and Grant-in-Aid for Challenging Exploratory Research (B) (No. 17H02774) for Y.M. This work was partially supported by Grant-in-Aid for Scientific Research (B) (No. 19H02613) and the joint research project of the Institute of Laser Engineering, Osaka University (under contract subject “2020B2-015”) for H.Y.Y.

Institutional Review Board Statement

Not applicable.

Informed Consent Statement

Not applicable.

Conflicts of Interest

The authors declare that they have no known competing financial interests.

References

  1. Haleblian, J.; McCrone, W. Pharmaceutical applications of polymorphism. J. Pharm. Sci. 1969, 58, 911–929. [Google Scholar] [CrossRef]
  2. Chung, H.; Diao, Y. Polymorphism as an emerging design strategy for high performance organic electronics. J. Mater. Chem. C 2016, 4, 3915–3933. [Google Scholar] [CrossRef]
  3. Bhattachar, S.N.; Deschenes, L.A.; Wesley, J.A. Solubility: It’s not just for physical chemists. Drug Discov. Today 2006, 11, 1012–1018. [Google Scholar] [CrossRef]
  4. Tsuri, Y.; Maruyama, M.; Yoshikawa, H.Y.; Okada, S.; Adachi, H.; Takano, K.; Tsukamoto, K.; Imanishi, M.; Yoshimura, M.; Mori, Y. Intergrowth of two aspirin polymorphism observed with Raman spectroscopy. J. Cryst. Growth 2020, 532, 125430. [Google Scholar] [CrossRef]
  5. Censi, R.; Martino, P.D. Polymorph impact on the bioavailability and stability of poorly soluble drugs. Molecules 2015, 20, 18759–18776. [Google Scholar] [CrossRef] [PubMed] [Green Version]
  6. Gupta, H.; Kumar, S.; Roy, S.; Gaud, R. Patent protection strategies. J. Pharm. Bioallied. Sci. 2010, 2, 2–7. [Google Scholar] [CrossRef]
  7. Thayer, A.M. Centering on chirality. Chem. Eng. News 2007, 85, 11–19. [Google Scholar]
  8. Sugiyama, S.; Maruyama, M.; Sazaki, G.; Hirose, M.; Adachi, H.; Takano, K.; Murakami, S.; Inoue, T.; Mori, Y.; Matsumura, H. Growth of protein crystals in hydrogels prevents osmotic shock. J. Am. Chem. Soc. 2012, 134, 5786–5789. [Google Scholar] [CrossRef]
  9. Sugiyama, S.; Shimizu, N.; Kakinouchi, K.; Hiraoka, O.; Matsumura, H.; Yoshikawa, H.Y.; Takahashi, Y.; Maruyama, M.; Yoshimura, M.; Adachi, H.; et al. Development of protein seed crystals reinforced with high-strength hydrogels. CrystEngComm 2015, 17, 8064–8071. [Google Scholar] [CrossRef]
  10. Yoshikawa, H.Y.; Murai, R.; Sugiyama, S.; Sazaki, G.; Kitatani, T.; Takahashi, Y.; Adachi, H.; Matsumura, H.; Murakami, S.; Inoue, T.; et al. Femtosecond laser-induced nucleation of protein in agarose gel. J. Cryst. Growth 2009, 311, 956–959. [Google Scholar] [CrossRef]
  11. Matsuoka, M.; Kakinouchi, K.; Adachi, H.; Maruyama, M.; Sugiyama, S.; Nakabayashi, I.; Tsuchikura, H.; Kuwahara, A.; Sano, S.; Yoshikawa, H.Y.; et al. Growth of high-strength protein crystals with nanofibers. Appl. Phys. Express 2016, 9, 035503. [Google Scholar] [CrossRef]
  12. Matsuoka, M.; Kakinouchi, K.; Adachi, H.; Maruyama, M.; Sugiyama, S.; Sano, S.; Yoshikawa, H.Y.; Takahashi, Y.; Yoshimura, M.; Matsumura, H.; et al. Protein crystallization with paper. Jpn. J. Appl. Phys. 2016, 55, 050302. [Google Scholar] [CrossRef]
  13. Foster, J.A.; Piepenbrock, M.-O.M.; Lloyd, G.O.; Clarke, N.; Howard, J.A.K.; Steed, J.W. Anion-switchable supramolecular gels for controlling pharmaceutical crystal growth. Nat. Chem. 2010, 2, 1037–1043. [Google Scholar] [CrossRef] [PubMed]
  14. Song, S.; Wang, L.; Yao, C.; Wang, Z.; Xie, G.; Tao, X. Crystallization of sulfathiazole in gel: Polymorph selectivity and cross-nucleation. Cryst. Growth Des. 2020, 20, 9–16. [Google Scholar] [CrossRef]
  15. Maruyama, M.; Hayashi, Y.; Yoshikawa, H.Y.; Okada, S.; Koizumi, H.; Tachibana, M.; Sugiyama, S.; Adachi, H.; Matsumura, H.; Inoue, T.; et al. A crystallization technique for obtaining large protein crystals with increased mechanical stability using agarose gel combined with a stirring technique. J. Cryst. Growth 2016, 452, 172–178. [Google Scholar] [CrossRef]
  16. Jeppson, J.O.; Laurell, C.B.; Franzen, B. Agarose gel electrophoresis. Clin. Chem. 1979, 25, 629–638. [Google Scholar] [CrossRef]
  17. Gustavsson, P.-E.; Son, P.-O. Monolithic polysaccharide materials. J. Chromatogr. Libr. 2003, 67, 121–141. [Google Scholar]
  18. Sugiyama, S.; Tanabe, K.; Hirose, M.; Kitatani, T.; Hasenaka, H.; Takahashi, Y.; Adachi, H.; Takano, K.; Murakami, S.; Mori, Y.; et al. Protein crystallization in agarose gel with high strength: Developing an automated system for protein crystallographic processes. Jpn. J. Appl. Phys. 2009, 48, 075502. [Google Scholar] [CrossRef]
  19. Pernodet, N.; Maaloum, M.; Tinland, B. Pore size of agarose gels by atomic force microscopy. Electrophoresis 1997, 18, 55–58. [Google Scholar] [CrossRef]
  20. Pluen, A.; Netti, P.A.; Jain, R.K.; Berk, D.A. Diffusion of macromolecules in agarose gels: Comparison of linear and globular configurations. Biophys. J. 1999, 77, 542–552. [Google Scholar] [CrossRef] [Green Version]
  21. Maruyama, M.; Yoshimura, M.; Takano, K.; Mori, Y. Development of polymorphic control technology for pharmaceutical compounds. In Kinetic Control in Synthetic and Self-Assembly; Numata, M., Yagai, S., Hamura, T., Eds.; Elsevier: Amsterdam, The Netherlands, 2019; pp. 269–291. [Google Scholar]
  22. Haisa, M.; Kashino, S.; Kawai, R.; Maeda, H. The monoclinic form of p-hydroxyacetanilide. Acta Crystallogr. Sect. B 1976, 32, 1283–1285. [Google Scholar] [CrossRef] [Green Version]
  23. Haisa, M.; Kashino, S.; Maeda, H. The orthorhombic form of p-hydroxyacetanilide. Acta Crystallogr. Sect. B 1974, 30, 2510–2512. [Google Scholar] [CrossRef]
  24. Burger, A. Interpretation of polymorphism studies. Acta Pharm. Technol. 1982, 28, 1–20. [Google Scholar]
  25. Parkin, A.; Parsons, S.; Pulham, C.R. Paracetamol monohydrate at 150 K. Acta Crystallogr. Sect. E 2002, 58, o1345–o1347. [Google Scholar] [CrossRef]
  26. Fabbiani, F.P.A.; Allan, D.R.; David, W.I.F.; Moggach, S.A.; Parsons, S.; Pulham, C.R. High-pressure recrystallisation—A route to new polymorphs and solvates. CrystEngComm 2004, 6, 505–511. [Google Scholar] [CrossRef]
  27. McGregor, P.A.; Allan, D.R.; Parsons, S.; Pulham, C.R. Preparation and crystal structure of a trihydrate of paracetamol. J. Pharm. Sci. 2002, 91, 1308–1311. [Google Scholar] [CrossRef]
  28. Mori, Y.; Maruyama, M.; Takahashi, Y.; Ikeda, K.; Fukukita, S.; Yoshikawa, H.; Okada, S.; Adachi, H.; Sugiyama, S.; Takano, K.; et al. Selective crystallization of metastable phase of acetaminophen by ultrasonic irradiation. Appl. Phys. Express 2015, 8, 065501. [Google Scholar] [CrossRef]
  29. Mori, Y.; Maruyama, M.; Takahashi, Y.; Yoshikawa, H.; Okada, S.; Adachi, H.; Sugiyama, S.; Takano, K.; Murakami, S.; Matsumura, H.; et al. Metastable crystal growth of acetaminophen using solution-mediated phase transformation. Appl. Phys. Express 2017, 10, 015501. [Google Scholar] [CrossRef]
  30. Mori, Y.; Maruyama, M.; Takahashi, Y.; Yoshikawa, H.; Okada, S.; Adachi, H.; Sugiyama, S.; Takano, K.; Murakami, S.; Matsumura, H.; et al. Crystallization of acetaminophen form II by plastic-ball-assisted ultrasonic irradiation. Appl. Phys. Express 2017, 10, 025501. [Google Scholar] [CrossRef]
  31. Nii, K.; Maruyama, M.; Okada, S.; Adachi, H.; Takano, K.; Murakami, S.; Yoshikawa, H.; Matsumura, H.; Inoue, T.; Imanishi, M.; et al. Improvement of metastable crystal of acetaminophen by control of crystal growth rate. Appl. Phys. Express 2018, 11, 035501. [Google Scholar] [CrossRef]
  32. Fujimoto, R.; Maruyama, M.; Mori, Y.; Okada, S.; Adachi, H.; Yoshikawa, H.; Takano, K.; Murakami, S.; Matsumura, H.; Inoue, T.; et al. Growth of high-quality metastable crystal of acetaminophen using solution-mediated phase transformation at low supersaturation. J. Cryst. Growth 2018, 502, 76–82. [Google Scholar] [CrossRef]
  33. Fujimoto, R.; Maruyama, M.; Okada, S.; Adachi, H.; Yoshikawa, H.; Takano, K.; Imanishi, M.; Tsukamoto, K.; Yoshimura, M.; Mori, Y. Large-scale crystallization of acetaminophen trihydrate by a novel stirring technique. Appl. Phys. Express 2019, 12, 045503. [Google Scholar] [CrossRef]
  34. Nishigaki, A.; Maruyama, M.; Numata, M.; Kanzaki, C.; Tanaka, S.-I.; Yoshikawa, H.; Imanishi, M.; Yoshimura, M.; Mori, Y.; Takano, K. Microflow system promotes acetaminophen crystal nucleation. Eng. Life Sci. 2020, 20, 395–401. [Google Scholar] [CrossRef] [PubMed]
  35. Tsuri, Y.; Inaoka, N.; Maruyama, M.; Adachi, H.; Yoshikawa, H.Y.; Takano, K.; Tsukamoto, K.; Imanishi, M.; Yoshimura, M.; Mori, Y. Effects of entrapped gas on the surface of a plastic ball induced by ultrasonic irradiation on the enhancement of crystallization of acetaminophen form II. J. Cryst. Growth 2021, 557, 125994. [Google Scholar] [CrossRef]
  36. Schneider, C.A.; Rasband, W.S.; Eliceiri, K.W. NIH Image to ImageJ: 25 years of image analysis. Nat. Methods 2012, 9, 671–675. [Google Scholar] [CrossRef]
  37. Mattisson, C.; Roger, P.; Jönsson, B.; Axelsson, A.; Zacchi, G. Diffusion of lysozyme in gels and liquids. A general approach for the determination of diffusion coefficients using holographic laser interferometry. J. Chromatogr. B Biomed. Sci. Appl. 2000, 743, 151–167. [Google Scholar] [CrossRef]
  38. Tanaka, S.; Ito, K.; Hayakawa, R. Size and number density of precrystalline aggregates in lysozyme crystallization process. J. Chem. Phys. 1999, 111, 10330. [Google Scholar] [CrossRef]
  39. Jin, X.; Chen, L.; Liu, Y.; Ye, T.; Hu, C.; Ren, J.; Chen, H.; Li, H. Patterning the internal structure of single crystals by gel incorporation. J. Phys. Chem. C 2019, 123, 13147–13153. [Google Scholar] [CrossRef]
  40. Shtukenberg, A.G.; Ward, M.D.; Kahr, B. Crystal growth with macromolecular additives. Chem. Rev. 2017, 117, 14042–14090. [Google Scholar] [CrossRef]
  41. Jin, X.; Xue, J.; Kang, D.H.; Liu, Y.; Ren, J.; Wen, Q.; Hu, D.; Yu, Y.; Yang, W.; Du, B.; et al. Incorporation of fluorescent microgels inside calcite single crystals. Giant 2020, 3, 100023. [Google Scholar] [CrossRef]
  42. Liu, Y.; Zang, H.; Wang, L.; Fu, W.; Yuan, W.; Wu, J.; Jin, X.; Han, J.; Wu, C.; Wang, Y.; et al. Nanoparticles incorporated inside single-crystals: Enhanced fluorescent properties. Chem. Mater. 2016, 28, 7537–7543. [Google Scholar] [CrossRef]
  43. Kahr, B.; Gurney, R.W. Dyeing crystals. Chem. Rev. 2001, 101, 893–952. [Google Scholar] [CrossRef] [PubMed]
  44. Gurney, R.W.; Mitchell, C.A.; Ham, S.; Bastin, L.D.; Kahr, B. Salting benzenes. J. Phys. Chem. B 2000, 104, 878–892. [Google Scholar] [CrossRef]
  45. Sugiyama, S.; Hirose, M.; Shimizu, N.; Niiyama, M.; Maruyama, M.; Sazaki, G.; Murai, R.; Adachi, H.; Takano, K.; Murakami, S.; et al. Effect of evaporation on protein crystals grown in semi-solid agarose hydrogel. Jpn. J. Appl. Phys. 2011, 50, 025502. [Google Scholar] [CrossRef]
  46. Murai, R.; Yoshikawa, H.Y.; Takahashi, Y.; Maruyama, M.; Sugiyama, S.; Sazaki, G.; Adachi, H.; Takano, K.; Matsumura, H.; Murakami, S.; et al. Enhancement of femtosecond laser-induced nucleation of protein in a gel solution. Appl. Phys. Lett. 2010, 96, 043702. [Google Scholar] [CrossRef] [Green Version]
  47. Berg, W.F. Crystal growth from solutions. Proc. R. Soc. A 1938, 164, 79–95. [Google Scholar]
Figure 1. Diffusion of Coomassie Brilliant Blue in agarose gels. (a,b) Side views of the vials at immediately after CBB addition (a) and 30 min later (b). Agarose concentrations of 0, 0.25, 0.5, and 1.0% (w/v) from the left. (c) The changes in color on the horizontal axis in the presence of agarose (0.5% (w/v)) at immediately after CBB addition (black circles) and 30 min later (gray circles) determined using ImageJ. (d) Relationship between agarose concentration and diffusion rate.
Crystals 11 01069 g001
Figure 2. Dissolution of a form I crystal grown in agarose (1.0% (w/v)). (a) Before the experiment. (b) After two hours. (c) After four hours. (d) After two hours and 40 min. The white dotted line shows the outline of the crystal being dissolved, and the red dotted line shows the outline of the agarose gel being dissolved.
Crystals 11 01069 g002
Figure 3. Dissolution of form II crystals in the presence (1.0% (w/v)) and absence of agarose. The average crystal widths as a function of time. Blue and red circles represent the crystals in the absence and presence (1.0% (w/v)) of agarose, respectively.
Crystals 11 01069 g003
Figure 4. Growth and dissolution of trihydrate crystals in agarose gels. (ad) After the growth. Agarose concentrations (% (w/v)) of 0 (a), 0.25 (b), 0.5 (c) and 1.0 (d). (e,f) The growth process. Agarose concentrations (% (w/v)) of 0 (e) and 0.25 (f). After 10 s (middle) and 20 s (right) from the left. (g,h) Relationship between agarose concentration and average dissolution time of trihydrate in 2.7 mL (g) and 0.35 mL (h) solutions.
Crystals 11 01069 g004
Figure 5. Solution-mediated phase transition from trihydrate to form II by form II seeding in agarose. (a) The time profiles in 2.7 mL solutions at 0, 10, 20, and 30 h after seeding from the top. (b) Relationship between agarose concentration and average dissolution time of trihydrate in 2.7 mL solution. (c) Relationship between agarose concentration and average dissolution time of trihydrate in 0.35 mL solution. (d,e) Form II crystals after the solution-mediated phase transition in the presence (1.0% (w/v)) (d) and absence (e) of agarose. The red crosses indicate the seeding sites, and the blue crosses indicate the size-measured form II crystals. (f) The crystal size shift (long side) of form II crystals as a function of the distance from the seeding site. Blue and red circles represent the crystals in the absence and presence (1.0% (w/v)) of agarose, respectively.
Crystals 11 01069 g005
Figure 6. Schematic illustrations of the solution-mediated phase transition from trihydrate to form II by form II seeding. (a) The absence of agarose. (b) The presence of agarose. The dotted arrows represent the supply routes of solute molecules to form II crystals.
Crystals 11 01069 g006
Table 1. Solubilities # of acetaminophen form I and form II in the presence (1.0% (w/v)) and absence of agarose at 40 °C.
Form IForm II
Agarose concentration (%(w/v))01.001.0
Solubility (mg/mL)24.524.625.725.7
# The error is less than 0.1 mg/mL.
Publisher’s Note: MDPI stays neutral with regard to jurisdictional claims in published maps and institutional affiliations.

