
Luminescence Properties of Gd2(MoO4)3 Modified with Sm(III) and Tb(III) for Potential LED Applications


Laboratory for Chemistry of Rare and Rare Earth Elements, Department of Inorganic Chemistry, Faculty of Chemistry and Pharmacy, University of Sofia “St. Kliment Ohridski”, 1164 Sofia, Bulgaria
*
Authors to whom correspondence should be addressed.
Crystals 2022, 12(1), 120; https://0-doi-org.brum.beds.ac.uk/10.3390/cryst12010120
Submission received: 31 December 2021
/
Revised: 13 January 2022
/
Accepted: 14 January 2022
/
Published: 17 January 2022
(This article belongs to the Special Issue Rare Earths-Doped Materials)
Abstract
:Light-emitting phosphors, doped with lanthanide ions of Tb(III) and Sm(III) of the type Gd1.97−y SmyTb0.03(MoO4)3 (y = 0.01–0.11, step 0.02) and Gd1.95−xSm0.05Tbx(MoO4)3 (x = 0.01–0.09, step 0.02), were synthesized and characterized by X-ray diffraction, UV-Vis spectroscopy, scanning and transmitting electron microscopy (SEM, TEM) as well as photoluminescence spectroscopy. The effect of the doping content of Tb/Sm was followed. The unit cell parameters for Gd1.97−ySmyTb0.03(MoO4)3 and Gd1.95−xSm0.05Tbx(MoO4)3 changed with the increase in the Tb/Sm content. The microstrain values also increased, proposing an increased concentration of defects. The mean particle size was estimated to be approximately 0.6 µm. Based on a Williamson–Hall plot, the size of the crystallites was determined to be in the range of 42–60 nm for modified and pure Gd2(MoO4)3 samples, respectively. The samples excited at 406 nm exhibited characteristic emission lines of Sm (485, 555, 646 nm). The host material Gd2(MoO4)3 emission in visible light was explained by the crystal structure defects, namely, oxygen vacancies. The CIE x/y color coordinates of the phosphors were determined and the related points were located in the green-yellow/pale yellow region of the visible light. The excited state lifetimes were determined for both groups of the samples, showing values in the millisecond range and indicating the samples as promising phosphors.
1. Introduction
Phosphors modified with rare earth elements have been of great interest in the last few decades due to their potential applications in various fields such as displays, LEDs, optical fibers, sensors, secret inks and biochemical markers [1]. In addition to their excellent optical properties, the materials based on rare earth elements are also thermally [2] and chemically stable [1]. Their capability has been found to release ozone-depleting substances as well as reducing electricity consumption, which makes them environmentally friendly materials [1]. The most popular method for making white LEDs (wLED) is the combination of a blue LED (InGaN) with yellow phosphor Y3Al5O12: Ce (YAG:Ce), as white light can be obtained by combining blue and yellow emissions. Nevertheless, such wLEDs suffer from insufficient radiation in the red area, which leads to a low color rendering index and a high radiation temperature (7000 K: blue-white light) [3]. This is the reason to look for new materials including new matrices for modification. Among the matrices suitable for the incorporation of lanthanide ions for LEDs, application oxides [4], fluorides and oxofluorides [5], molybdates [6,7], tungstates [8], vanadates and phosphates [9,10] have been studied.
The matrices that attract a particular interest are the molybdates and tungstates, which have an advantage over the other matrices used due to the presence of a wide excitation band in the UV region as well as the presence of a charge transfer in the bonds O-Mo/O-W [1,11,12].
Among molybdates, Gd2(MoO4)3 is of particular interest due to its low toxicity as well as its high thermal and photochemical stability [13,14,15,16,17]. In addition, Gd(III) can be easily replaced by other lanthanide ions due to their similar ionic radii and preferably the same coordination. Gd2(MoO4)3 modified with Eu3+, Tb3+, Tm3+ and Er3+/Yb3+ has been studied for solar cell applications as a spectral converter from UV to NIR [12].
A matrix of CaLa2(MoO4)4 modified with Tb3+/Sm3+ showed a fluorescence that could be turned to white light because of the energy transfer of Tb3+ to Sm3+ [18]. The Tb ion was found to be a sensitizing agent, increasing the luminescent efficiency of Sm3+ in a phosphate-silicate matrix as well [19]. The ion Tb3+ is known for its fluorescence in the green area based on 5D4 → 7FJ (J = 6, 5, 4, 3) whereas Sm3+ has a fluorescence in orange-red based on 4G5/2 → 6HJ (J = 5/2, 7/2, 9/2, 11/2) [20].
A matrix such as Gd2(MoO4)3 modified with Tb3+/Sm3+ can be considered to be a potential candidate for a wLED. In the available literature, the system of Gd2(MoO4)3 as a host with Tb3+/Sm3+ as modifying agents and the fluorescent properties of Tb/Sm-doped Gd2(MoO4)3 have not been studied. In the present work, samples of Gd2(MoO4)3 doped with different Sm3+ and Tb3+ contents were synthesized by a solid state reaction process characterized by different methods to observe their luminescent properties.
2. Materials and Method
MoO3 oxide was produced after MoO2 calcination in air at 600 °C/5 h and the phase purity was confirmed by an XRD analysis (not included). The lanthanide oxides used in the experiments were Sm2O3, Gd2O3 and Tb4O7 as well as NH4F as a flux. All reagents of 99.99% purity were purchased from Sigma-Aldrich (Chemie GmbH, Taufkirchen, Germany). Prior to synthesis, the lanthanide oxides were annealed at 900 °C overnight to remove any physisorbed moisture or carbonate species.
A solid state reaction was applied for the synthesis of the samples. The procedure was followed by grinding for homogenization for 30 min in a corundum mortar. Considering the diffusion limitations in the solid state reaction to speed up the reaction, NH4F acting as flux was added in the last 5 min of grinding (5 wt% of the total mass of the final product). The final thermal calcination was implemented at 800 °C for 5 h in a corundum crucible with a heating rate of 10 °C/min.
Following the procedure, two groups of samples with the general formula Gd2−x−ySmyTbx(MoO4)3 were synthesized. The first one had a fixed y = 0.05 mol and the content of Tb(III) and Gd1.95−xSm0.05Tbx(MoO4)3 was varied where x = 0.01, 0.03, 0.05, 0.07 and 0.09; the second one had a fixed x = 0.03 and the content of Sm(III) and Gd1.97−ySmyTb0.03(MoO4)3 was varied where y = 0.01, 0.03, 0.05, 0.07, 0.09 and 0.11. In the case of x = 0 and y = 0, pure Gd2(MoO4)3 was obtained. Small quantities of Sm(III) and Tb(III) were used, considering the potential quenching of the luminescence.
XRD measurements were performed on a PANalytical Empyrean diffractometer (Malvern PANalytical Empyrean, Almelo, Netherlands) with a PIXcel 3D detector and a Cu Kα tube (λ = 0.1542 nm). The microstructural information was extracted by a full profile Rietveld method using the FullProf Suite software (v01-2021, Grenoble, France) [21].
The fluorescence was measured in the solid state (powder) by a Varian Cary Eclipse spectrometer (Agilent, Santa Clara, California, USA) equipped with a 150 W Xe flash lamp as an excitation source. The measurements were performed at room temperature. Scanning electron microscopy (SEM) was performed using a JEOL 5510 (JEOL, Tokyo, Japan) microscope under different magnifications with an 80 keV accelerating voltage. Transmission electron microscopy (HRTEM) was applied to follow the morphology of the samples using a JEM 2100 (JEOL Tokyo, Japan)) with an accelerator voltage of 200 kV and up to 1,500,000 times magnification. UV-Vis absorption spectroscopy was applied using an Evolution 300 UV-Vis spectrometer (Thermo Scientific, Waltham, Massachusetts, USA) for measuring the absorption in the range of 200–900 nm.
3. Results and Discussion
3.1. Characterization of Polycrystalline Samples by XRD
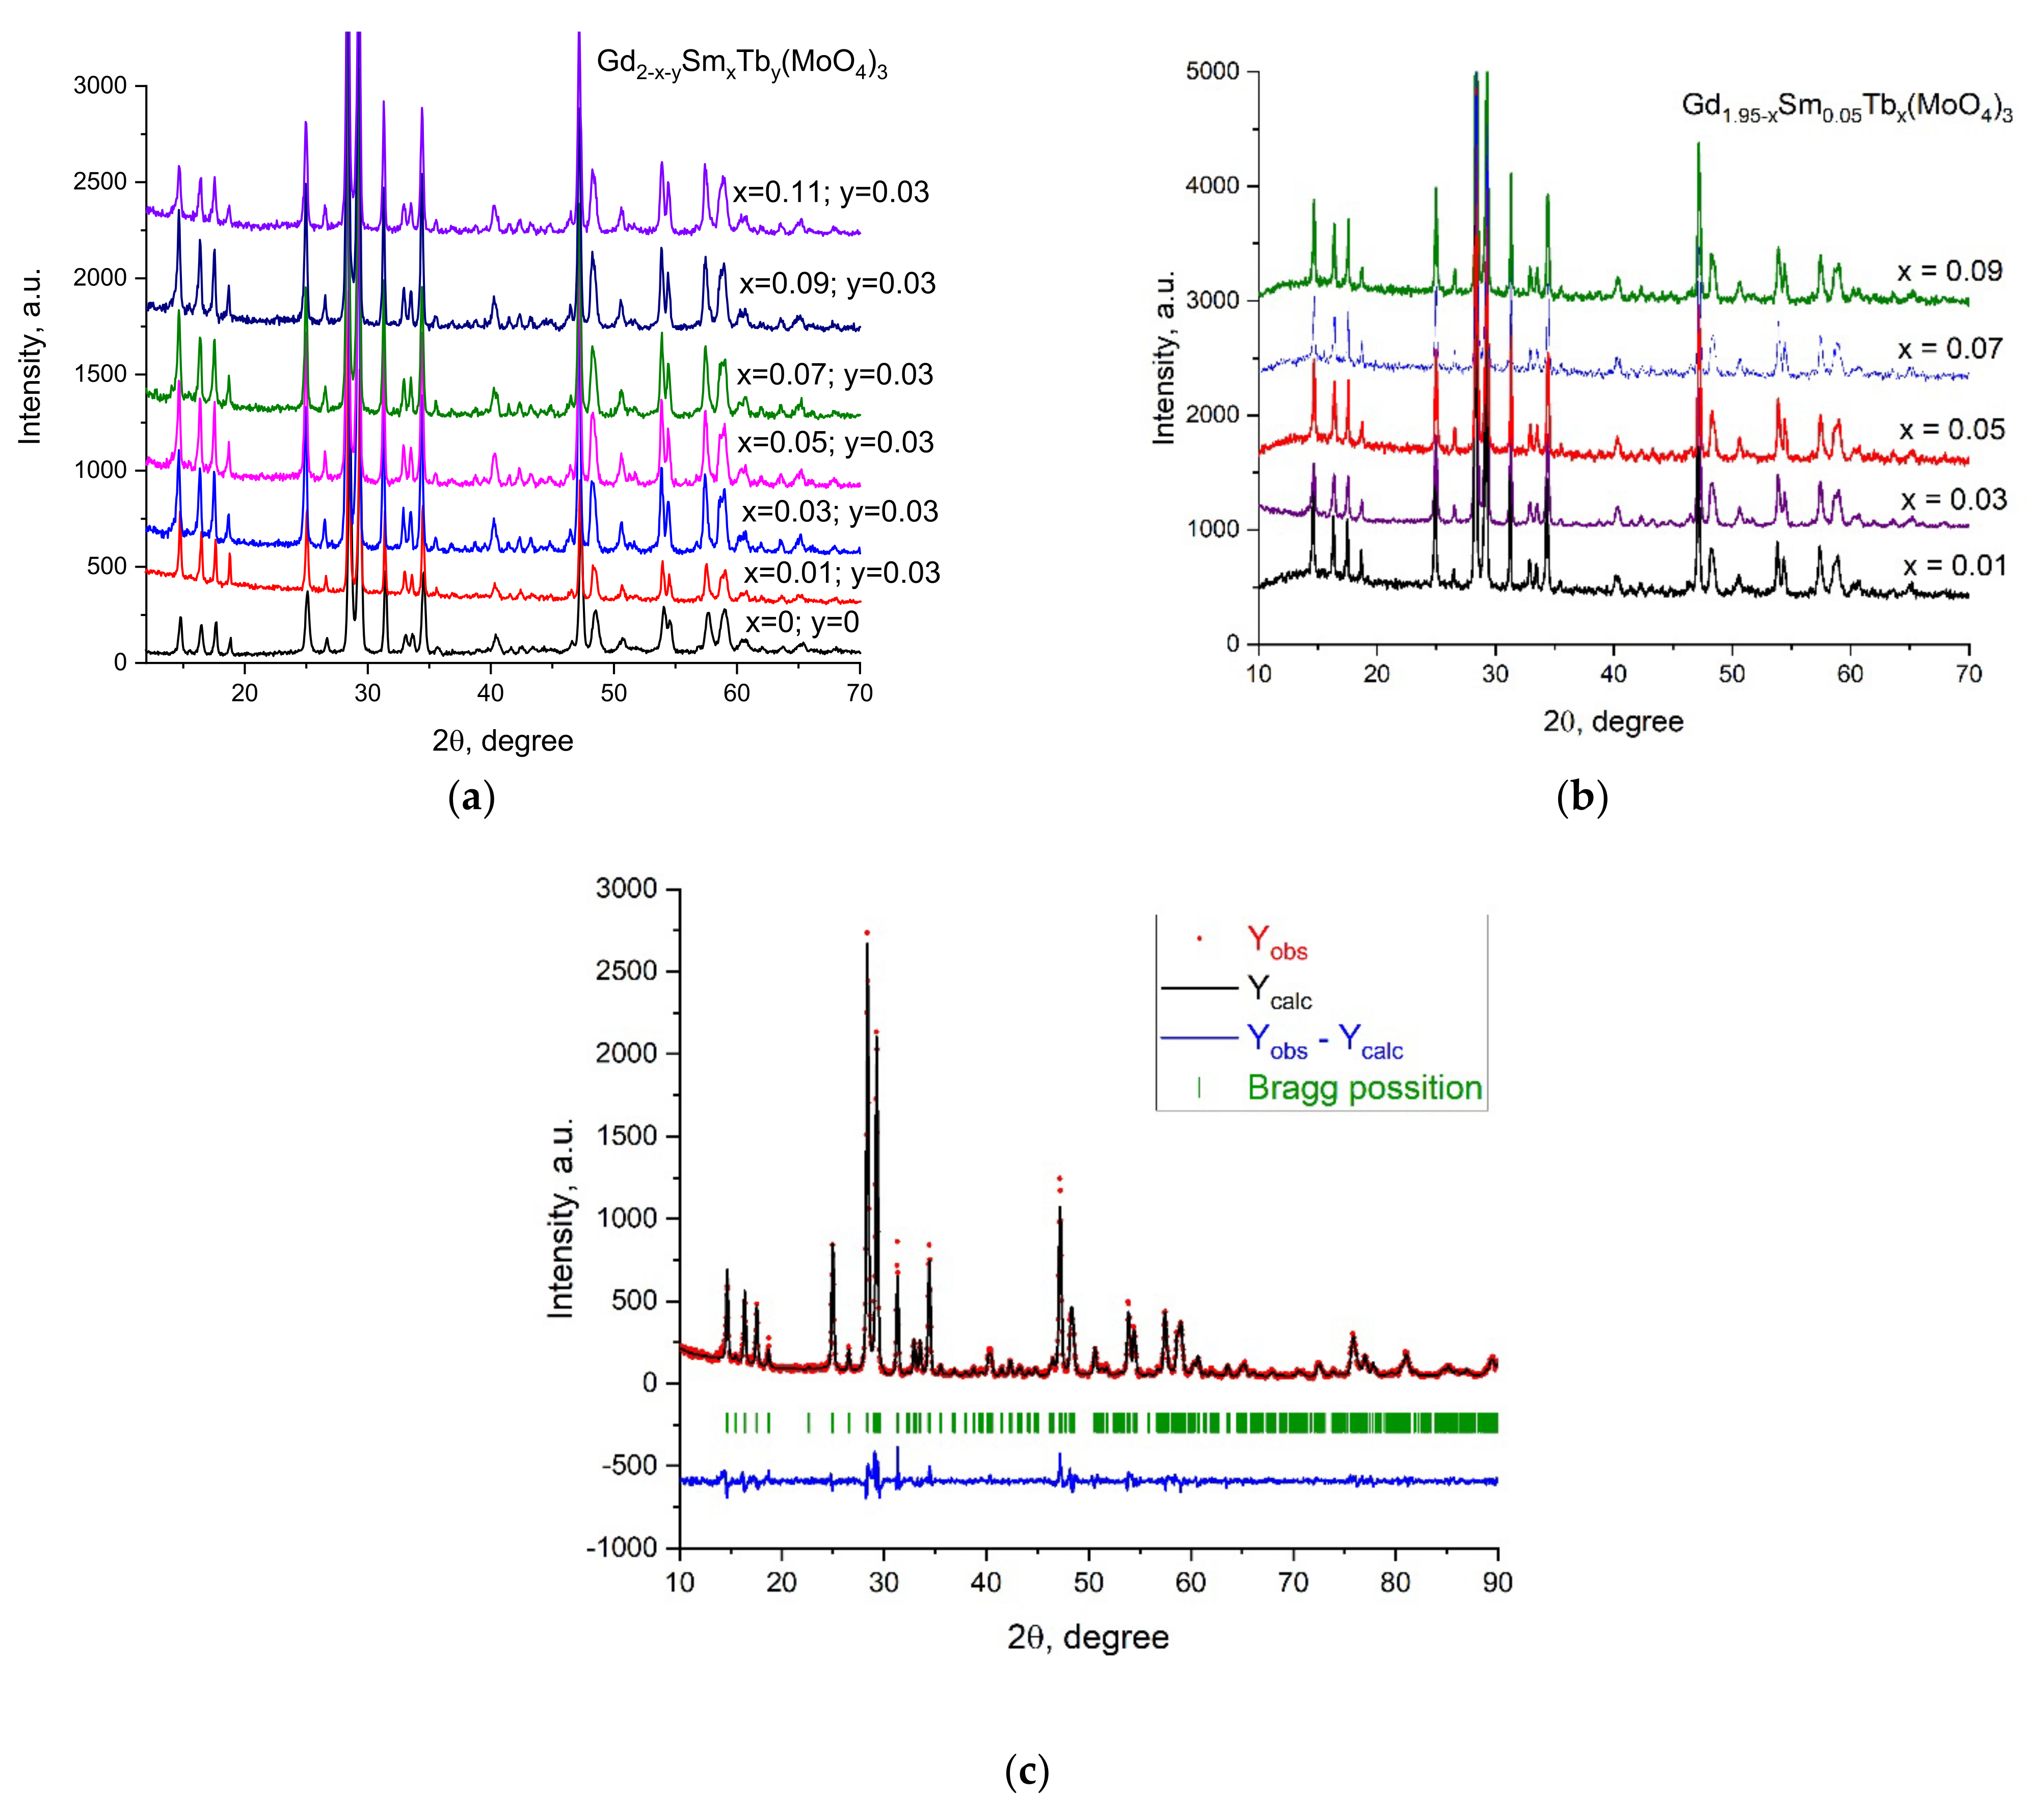
The XRD patterns of the samples Gd1.97−ySmyTb0.03(MoO4)3 and Gd1.95−xSm0.05Tbx(MoO4)3 are presented in Figure 1a,b. The Rietveld analysis of the XRD data for one of the samples, Gd1.92Sm0.05Tb0.03(MoO4)3, is presented in Figure 1c. Significant differences could not be observed in the diffraction patterns of the samples containing different amounts of Sm or Tb. This was expected, taking into account the almost identical ionic radii of Sm, Gd and Tb.
The unit cell parameters of the samples Gd1.97−ySmyTb0.03(MoO4)3 and Gd1.95−xSm0.05Tbx(MoO4)3 are presented in Table 1. It is known that the molybdates of the middle lanthanides (including Sm, Gd and Tb) crystalize in a monoclinic Eu2(WO4)3-type (C2/c) (α-polymorph) structure [22]. According to [23], in Ln2(WO4)3 (Ln = lanthanide) with a monoclinic structure of an Eu2(WO4)3-type, each W atom has 4 oxygen nearest neighbors and each Ln is surrounded by 8 oxygen atoms. The WO4 tetrahedra of tungsten share their 4 vertices with LnO8 trigondodecahedra and several LnO8 trigondodecahedra share an edge with each other. Following this, the structure of the Ln2(MoO4)3 in question (Ln = Sm, Gd, Tb) could be considered to be a framework formed by MoO4 tetrahedrons (Mo atom tetrahedral coordinated by oxygen) and LnO8 polyhedrons linked by corners.
All the unit cell parameters for Gd1.97−ySmyTb0.03(MoO4)3 and Gd1.95−xSm0.05Tbx(MoO4)3 changed with the increase in the Tb/Sm content but there was a difference in the tendency, i.e., excluding the parameter a, the others did not change monotonously in both group samples. The unit cell volume monotonously increased with the Tb/Sm doping content for the samples (Table 1).
As seen in Table 1, the Tb content increased for Gd1.95−xSm0.05Tbx(MoO4)3, which led to significant changes in the lattice parameters and distortion of the unit cell. This could be attributed to the fact that the pure Tb2(MoO4)3 crystallizes mainly in the orthorhombic (space group Pba2) β-phase under these conditions [24] or as a mixture of orthorhombic and monoclinic phases [25] where Tb was 7-coordinated in contrast to 8-coordinated in the Tb-doped α-Gd2(MoO4)3.
A Williamson–Hall (W–H) analysis [26] was used to estimate the effect of Tb(III) and Sm(III) on the XRD peak broadening of the samples (Figure S1). The W–H analysis was governed by the following equation:
where β is the observed peak broadening, K is the shape factor (0.94), λ is the wavelength of the Cu Kα (0.15406 nm), θ is the angle, ε are the microstrains and L is the crystallite size. The crystallite size (intercept = Kλ/L) and the microstrains (slope) were calculated by a linear fit of the plot between β cos(θ) versus 4 sin(θ) (W–H plot).
β = Kλ/L cos(θ) + ε tan(θ)
The slope of the W–H plot of all samples had a positive sign, indicating the presence of tensile strains in the samples. The microstrain level increased with the content of Tb and Sm for both series, indicating an increased concentration of defects in the crystal structure, most likely (Table S1). The presence of defects also played a role in the grain boundaries inhibiting the crystal growth of the samples, leading to smaller crystallites with the increase in the content of Tb/Sm.
3.2. Electron Microscopy (SEM and TEM)
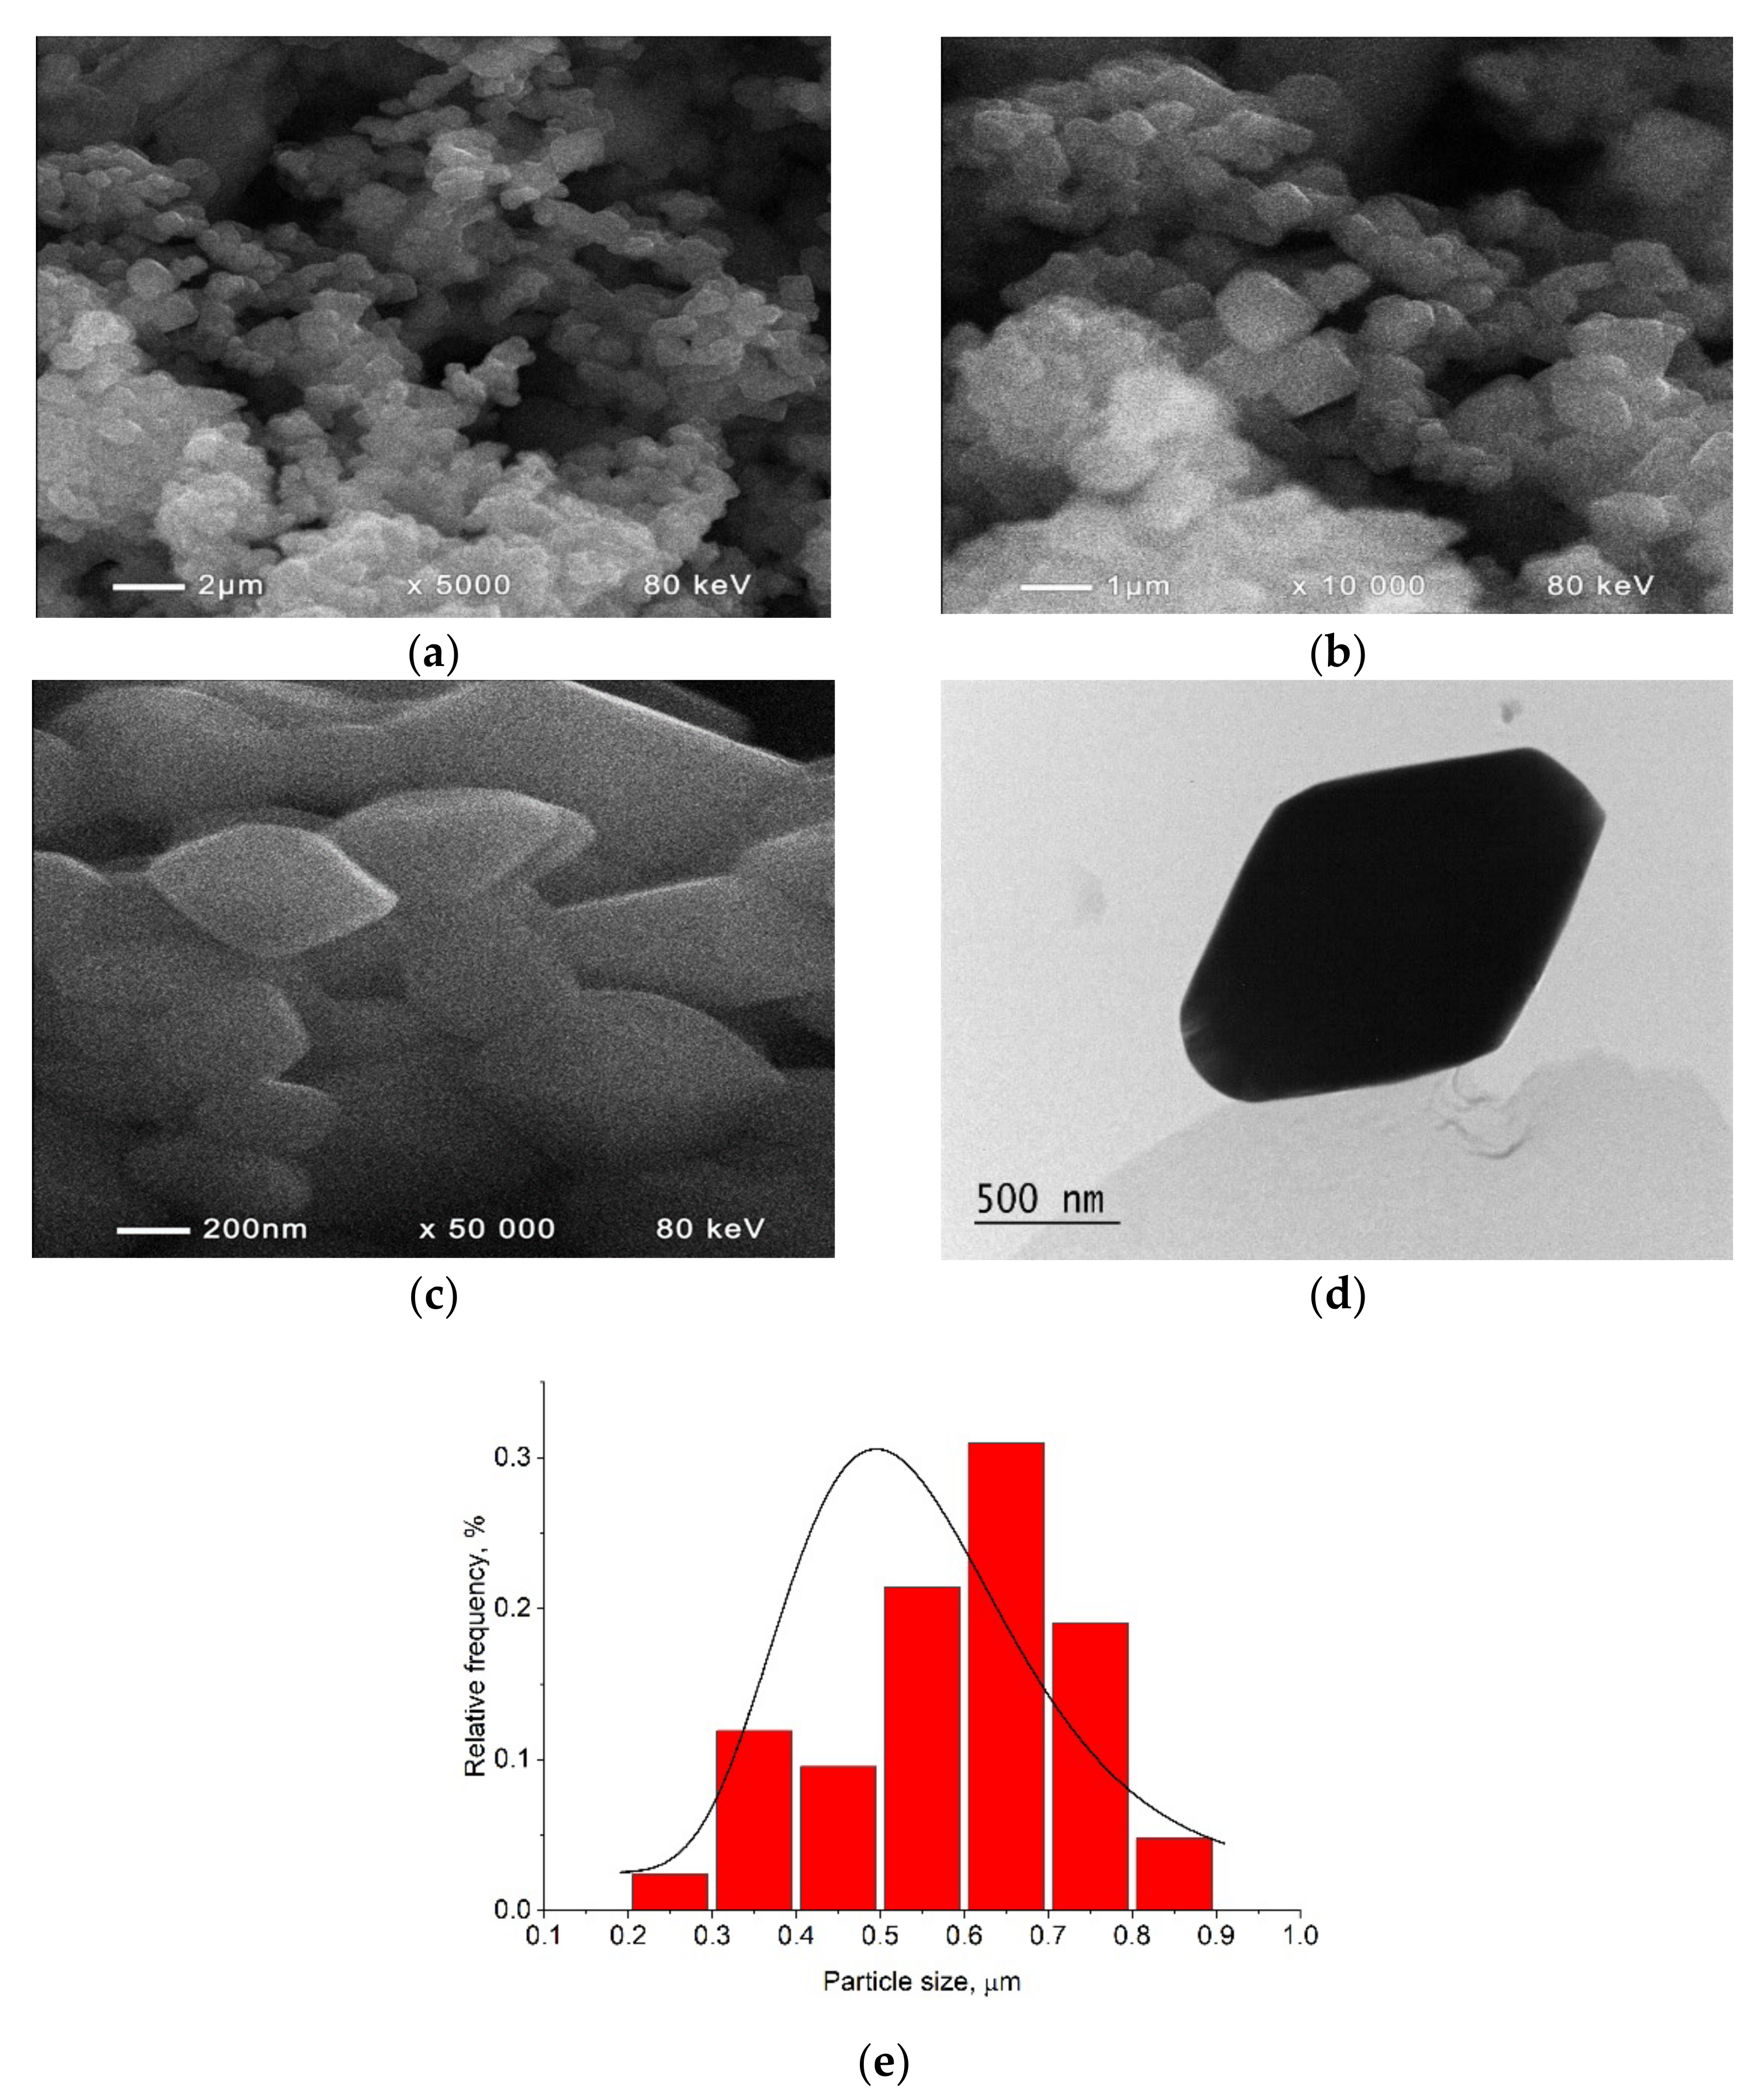
Crystallite size and morphology can influence the luminescent properties of phosphor materials. The SEM and TEM images of Gd1.92Sm0.05Tb0.03(MoO4)3 (Figure 2a–d) showed the formation of rhombohedron-shaped microcrystals with well-formed edges (Figure 2d) and a few of them were glued together (Figure 2a–c). The observation of well-faceted microcrystals was an indication of their high crystallinity and it was in good relation to the sharp diffraction peaks observed in Figure 1. This relation has also been detected for other compounds [27].
3.3. Optical Properties
3.3.1. UV-Vis Absorption
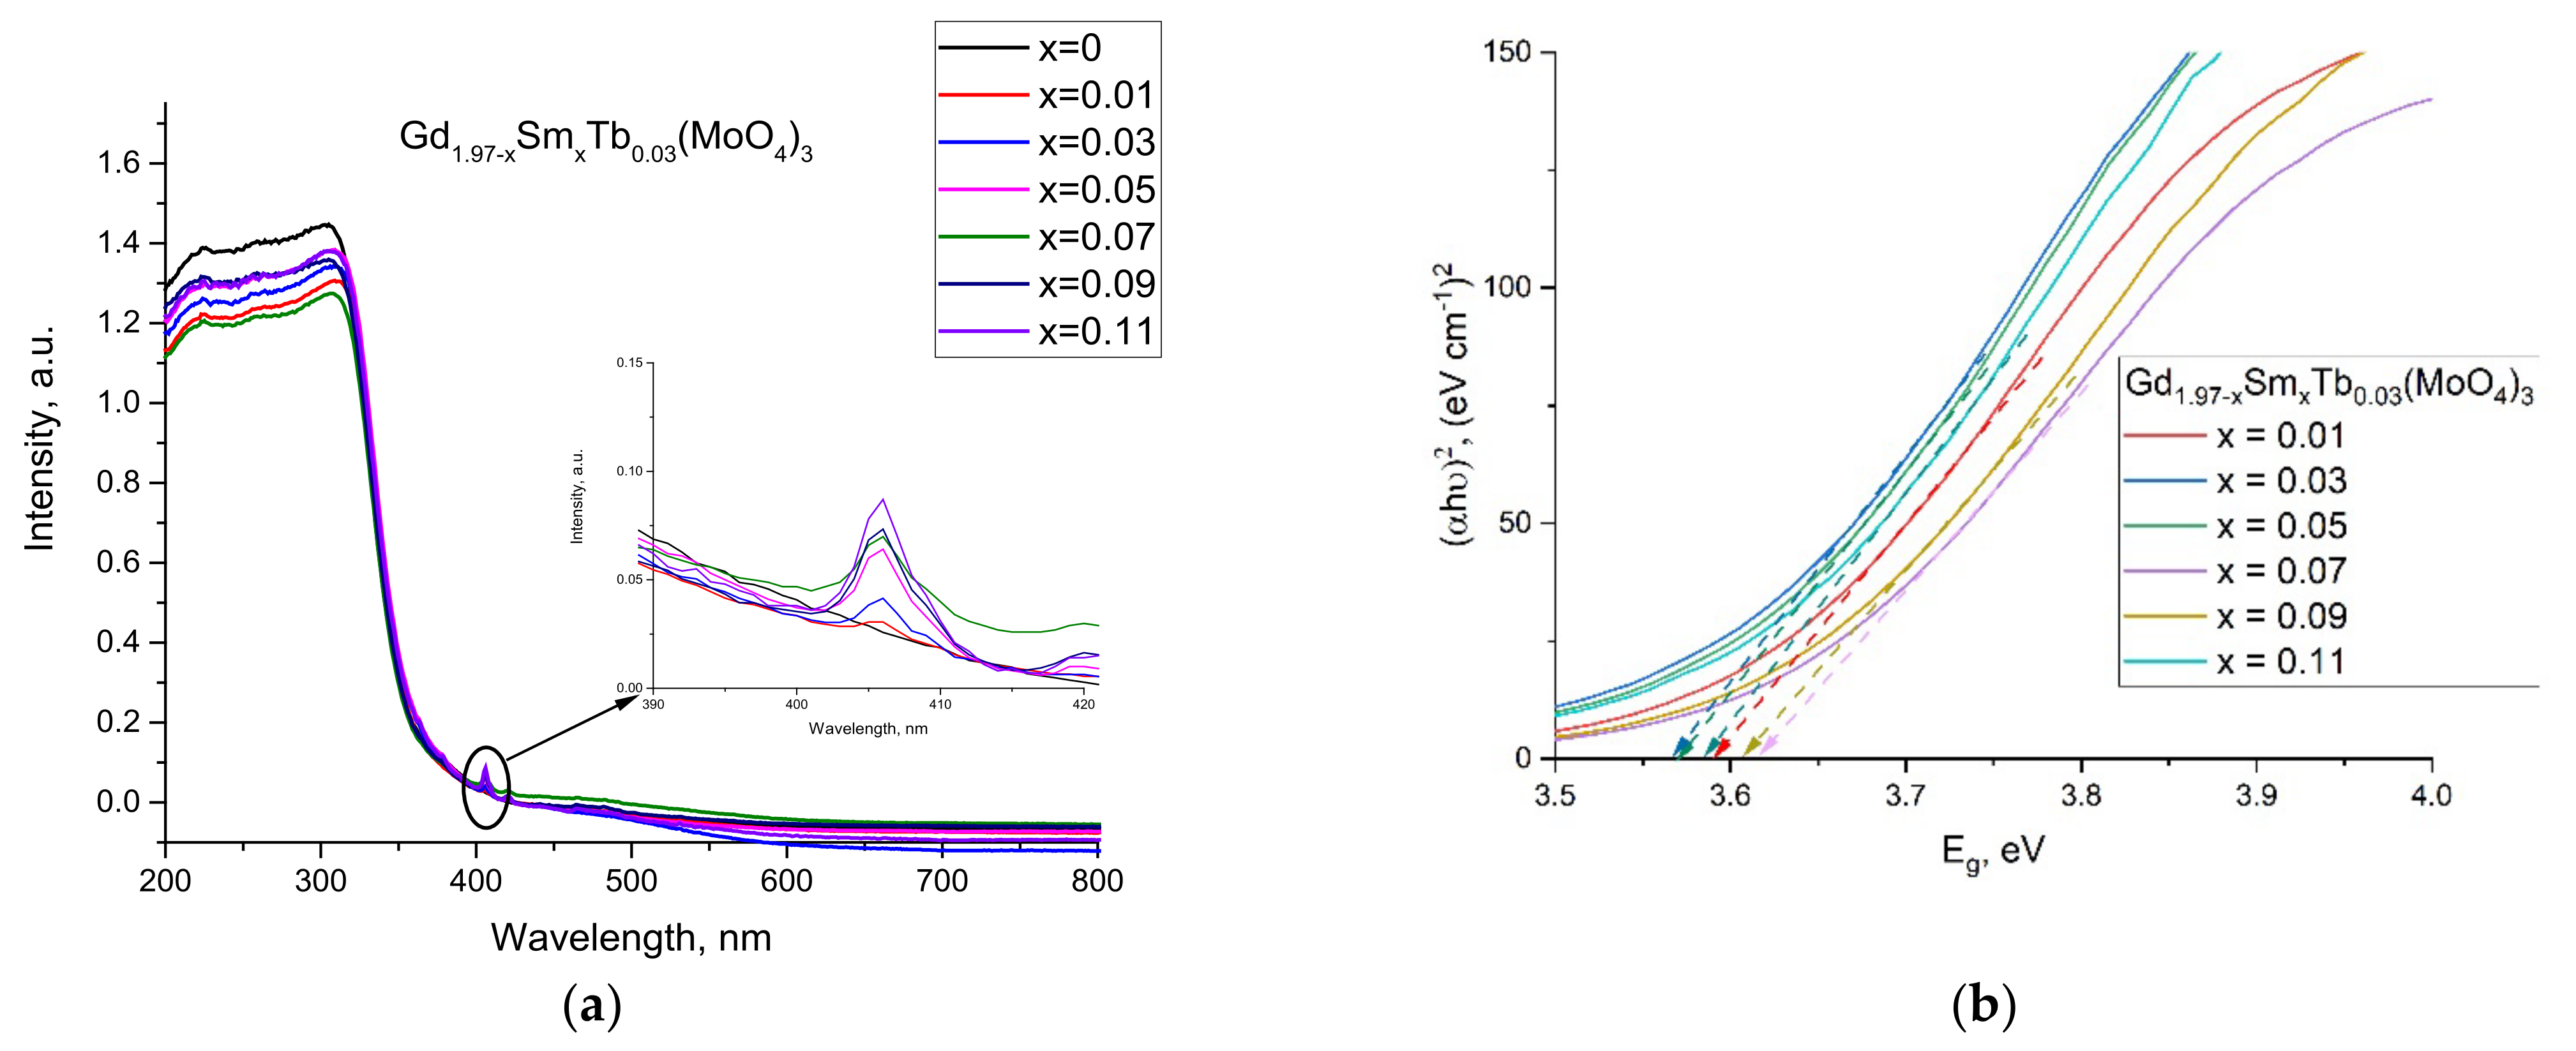
There were two major absorption regions appearing in the absorption spectra of the samples. The absorbance in the UV-Vis range (200–350 nm) showed a clear maximum at approximately 300 nm. A very weak band at approximately 406 nm was also observed (Figure 3a).
Band gap energy calculations were accomplished based on the UV-Vis data (Figure 3b). The UV-Vis data were analyzed for the relation between the optical band gap, absorption coefficient and energy (hν) of the incident photon for the near edge optical absorption. The calculations were performed from the measured curves by fits according to Tauc’s equation [29], αhν = A(hν − Eg)n, where A is a constant independent of hν, Eg is the band gap and n depends on the type of transition. In addition, the well-known approach for Eg determination from the intersection of the linear fits of (αhν)1/n versus hν on the x-axis was used with n being 1/2 and 2 for the direct and indirect band gaps, respectively. A direct band gap of ~3.65 eV was obtained for the pure Gd2(MoO4)3, which was in the range of the Eg values earlier reported for several other molybdates (i.e., 3.74 eV (Eu2(MoO4)3), 3.2 eV (PbMoO4), 3.98 eV (SrMoO4) and 4.3 eV (ZnMoO4)) [30].
The direct band gaps of the Gd1.97−ySmyTb0.03(MoO4)3 samples are presented in Table 2. The band gap values decreased compared with those of the pure Gd2(MoO4)3 sample. The changes were not monotonous with the Sm content increase.
3.3.2. Excitation Spectra
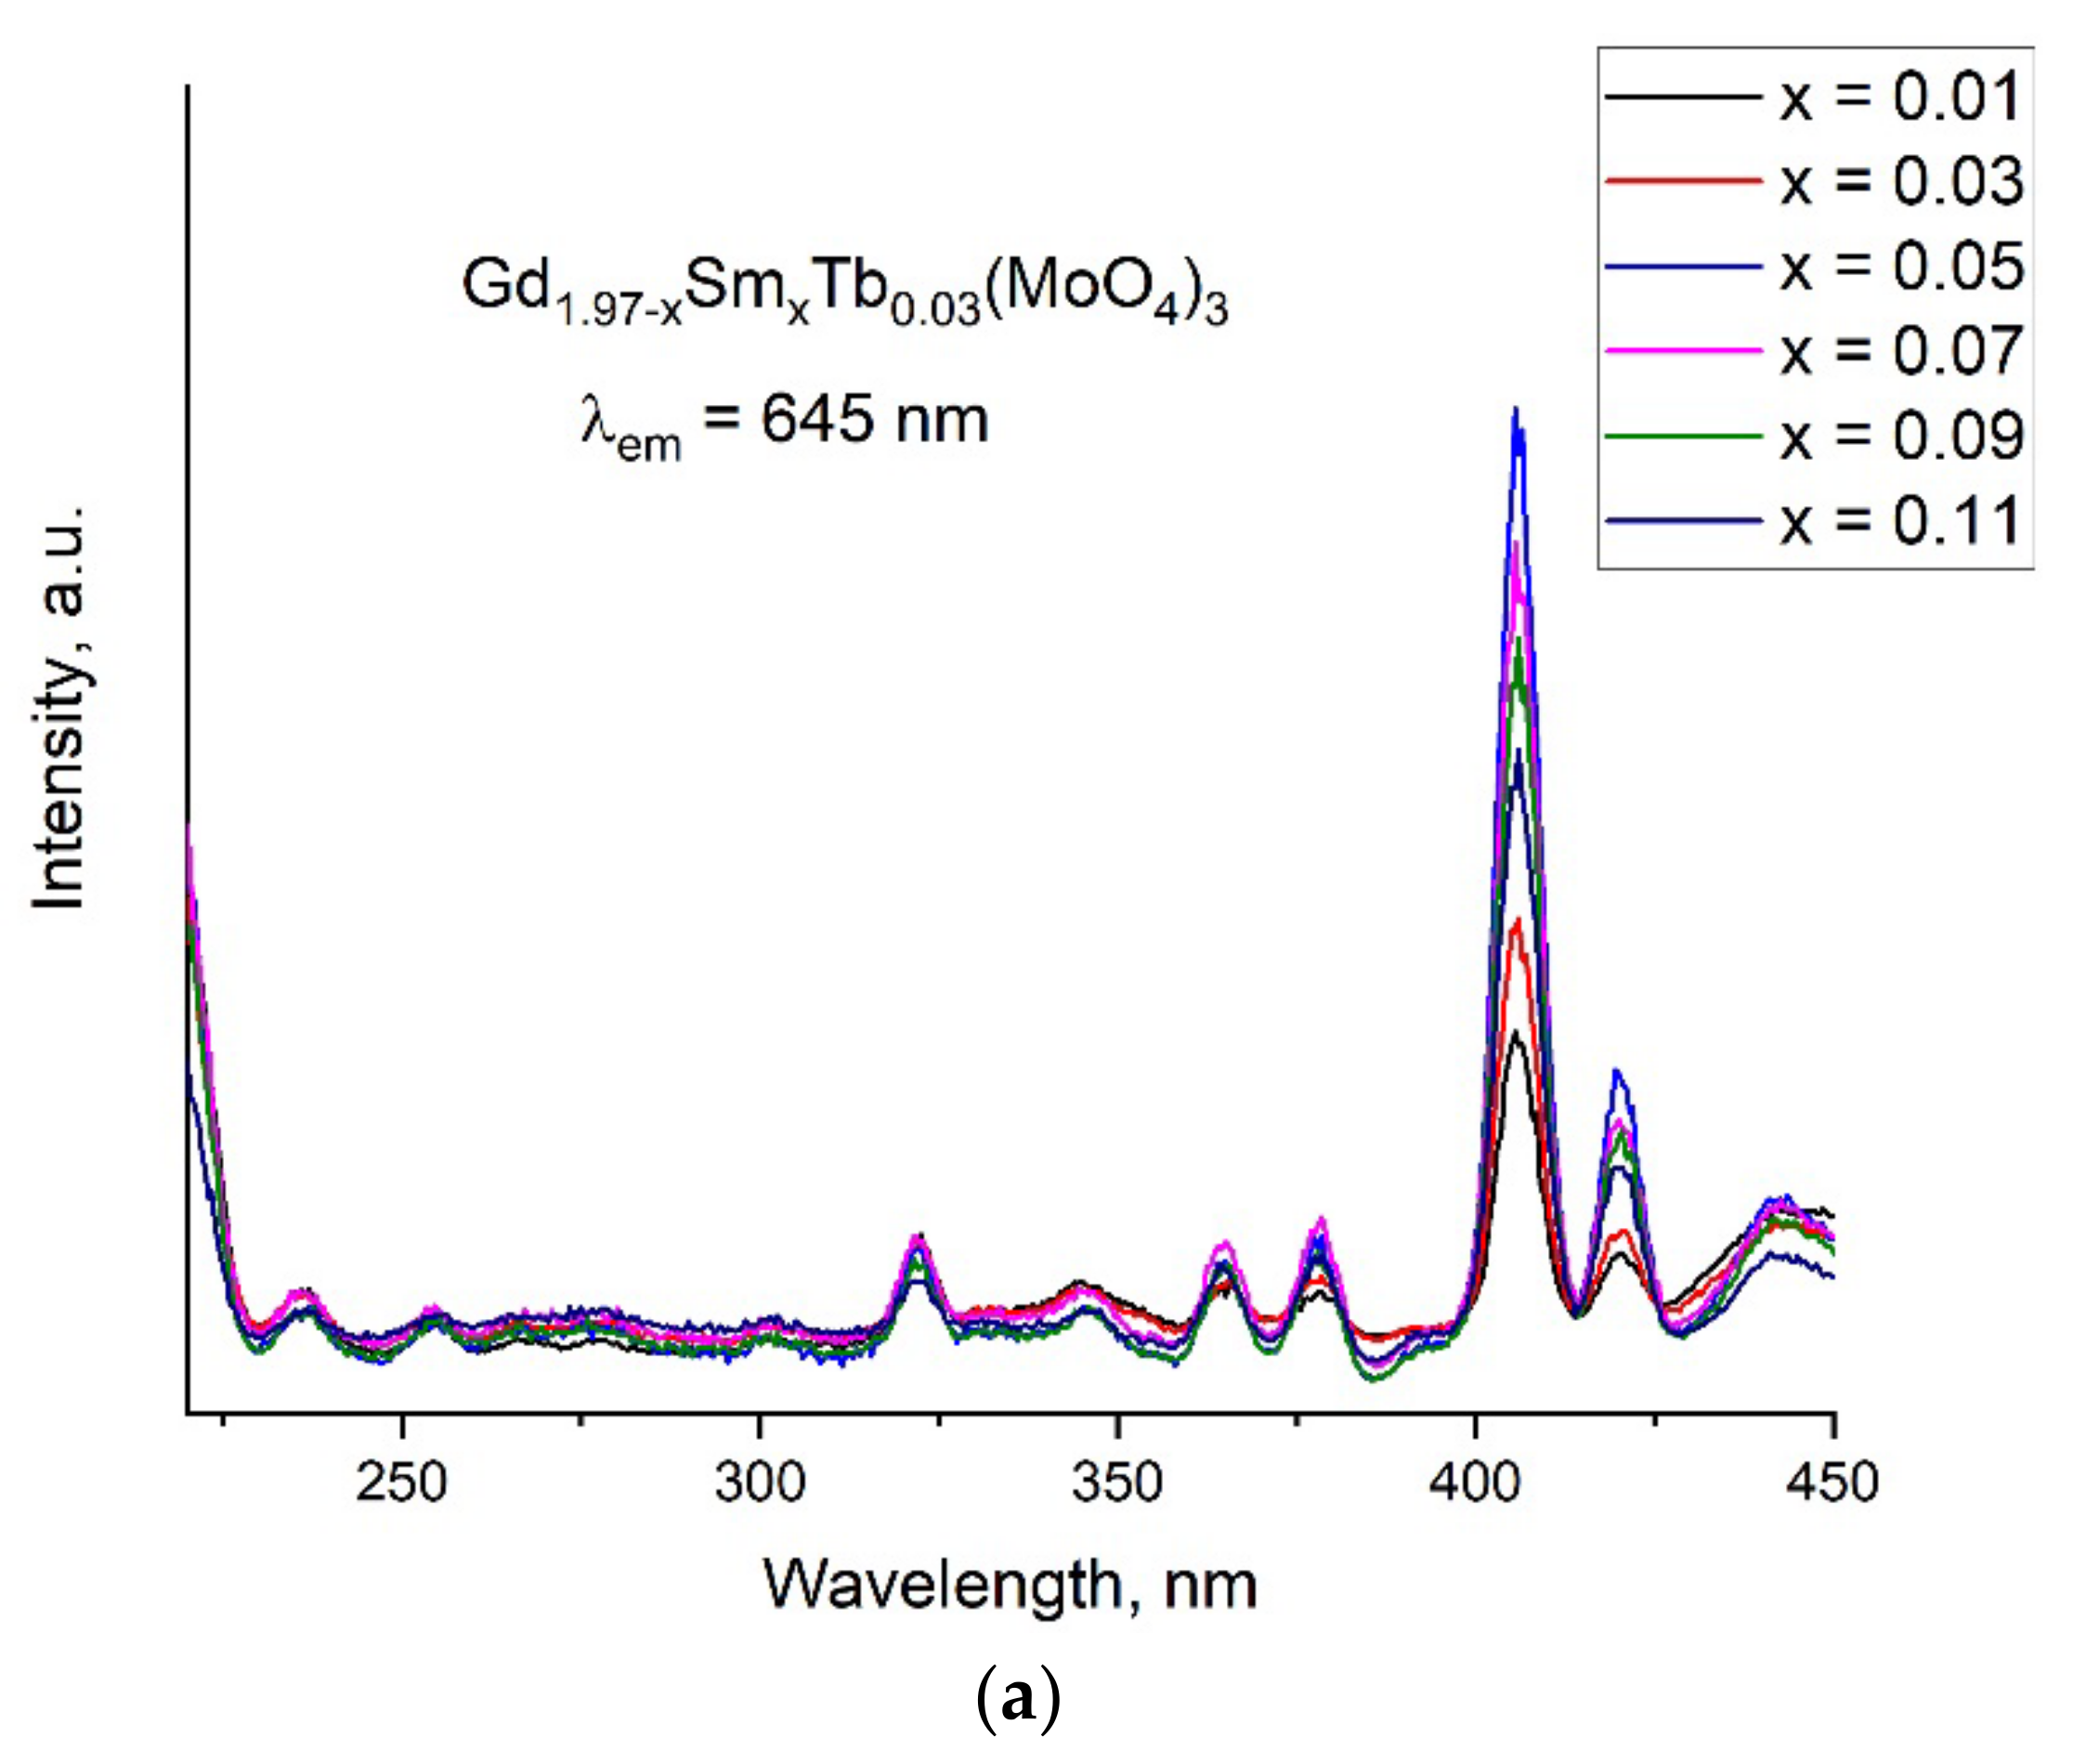
In Figure 4a, the excitation spectra are shown for the samples of Gd1.97−ySmyTb0.03(MoO4)3 monitored by the 645 nm fluorescence emission (electric dipole transition 4G5/2 → 6H9/2), which is one of the characteristic bands of an Sm3+ ion. Very weak broad bands between 225 and 300 nm were considered because bands appeared by the charge transfer due to the O2--Sm3+ interactions [31,32]. A series of excitation bands presented between 225 and 450 nm corresponded with the typical f–f transition of Sm3+ ions centered at 332, 345, 361, 376, 391, 406, 418 and 440 nm. The strongest intensity band was the one at 406 nm, transition 4H5/2 → 4K11/2 [33]. This band intensity increased when the Sm content increased up to x = 0.05 and then it decreased with the further increase in Sm content (x = 0.07, 0.09 and 0.11). It is known that a host matrix containing a transition metal (such as VO43−, NbO43−,WO42− or MoO42−) has an advantage over the host matrices absorbing in the UV region due to the charge transfer between the transition metal ion (electron deficient) and the oxygen ion (electron rich). Thus, the energy transfer between the transition metal atom and oxygen is considered to be an important factor to increase the luminescent properties of inorganic phosphors [12].
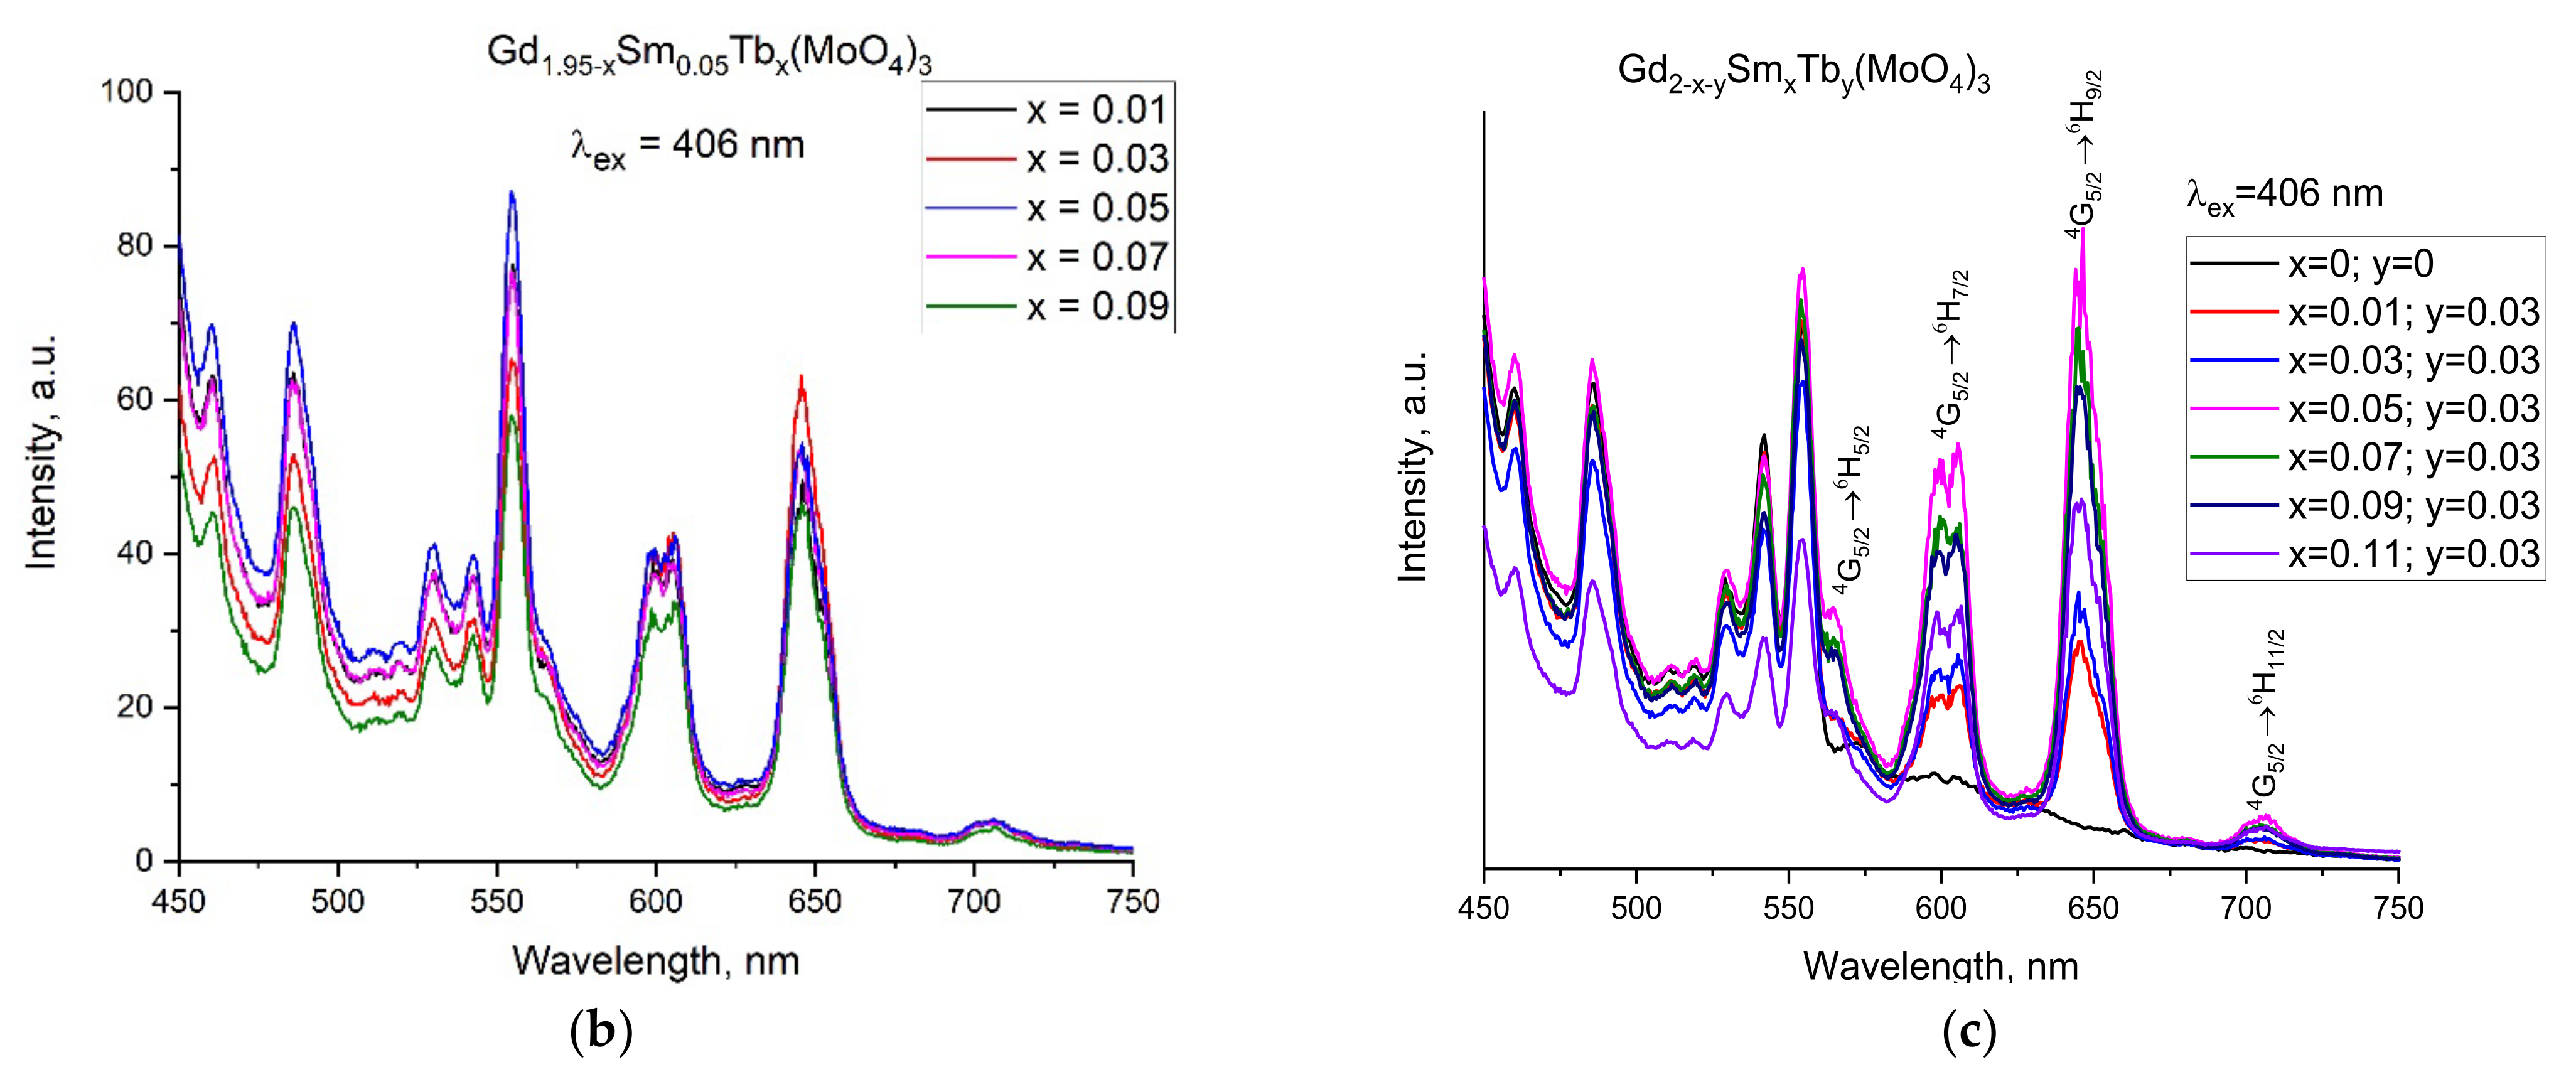
3.3.3. Emission of Gd1.95−xSm0.05Tbx(MoO4)3 and Gd1.97−ySmyTb0.03(MoO4)3 in the Visible Light Region
All samples were activated by irradiation with light at 406 nm. The emission spectra of the samples are presented in Figure 4b,c. The samples possessed three emission bands at 600 (4G5/2 → 6H7/2), 645 (4G5/2 → 6H9/2) and 705 nm, which were not observed in the pure Gd2(MoO4)3 (without Sm and Tb, x = 0.00, y = 0.00). The sequence of the bands in the region of 450–575 nm, observed in all the samples both with and without Tb/Sm, could be due to photoluminescence of the Gd2(MoO4)3 matrix. It was not expected to yield an emission of visible light from the Gd(III) because the lowest excited state of the ion has a very high energy (32,000 cm−1) and Gd(III) complexes usually show a ligand-centered emission. The microstrains and defects in the structure, quite likely oxygen vacancies, could be considered to be a reason for the luminescence of Gd2(MoO4)3 in the visible region. As discussed in Section 3.1, the microstrains and, consequently, the number of defects increased with an increase in the Tb/Sm ion content.
The Sm(III) ion had an emission in the visible area due to its 4G5/2 → 6HJ (J = 5/2, 7/2, 9/2, 11/2) transitions where 4G5/2 (17,800 cm−1) was the main resonance level for Sm(III). The sharp band at 560 nm and the weak shoulder at 570 nm as well as the band at 598 nm corresponded with the Sm(III) intra-4f transition from the excited level to the lower levels 4G5/2 → 6H5/2 and 4G5/2 → 6H7/2 [34,35].
The 4G5/2 → 6H7/2 emission is a magnetic dipole-allowed transition and so its intensity hardly changes with the local structure symmetry of the Sm3+ ions [35]. In our samples, this band was fragmented into two bands of a lower intensity. The higher intensity for the 4G5/2 → 6H7/2 transition could be related to the symmetry of the ion coordination in the lattice [35]. For Gd1.95−xSm0.05Tbx(MoO4)3, the strongest intensity of the band at 645 nm was provided by the sample with the Tb content of 0.03 mol and, accordingly, the most intensive photoluminescence was obtained in Gd1.92Sm0.05Tb0.03(MoO4)3.
The emission spectra analysis of the samples showed that Tb(III) played the role of a sensitizing agent and the energy transfer was in the direction of the Sm3+ emitting levels.
The variation in the luminescence intensity of the emission bands at 600 and 646 nm with the doping concentration of Sm3+ and Tb3+ is presented in Figure S2a,b. The Gd2−x−ySmyTbx(MoO4)3 samples with a higher Sm(III) content (Figure S2a) showed a decrease in the emission intensity at 600 and 646 nm with the highest intensity of the bands for the composition Gd1.92Sm0.05Tb0.03(MoO4)3 (Figure S2a). For the samples with Sm contents of 0.07, 0.09 and 0.11 mol, the intensity of the bands was lower. This was a result from the concentration quenching that took place when the Sm(III) ions became closer in the structure, as also observed for other matrices [35]. For Gd1.95−xSm0.05Tbx(MoO4)3, a decrease in the intensity of the bands in question was observed for the Tb contents 0.05, 0.07 and 0.09 mol (Figure S2b). This was a result from the concentration quenching of the Tb ions, which became close to each other and, thus, the sensitizing of the Sm(III) was low.
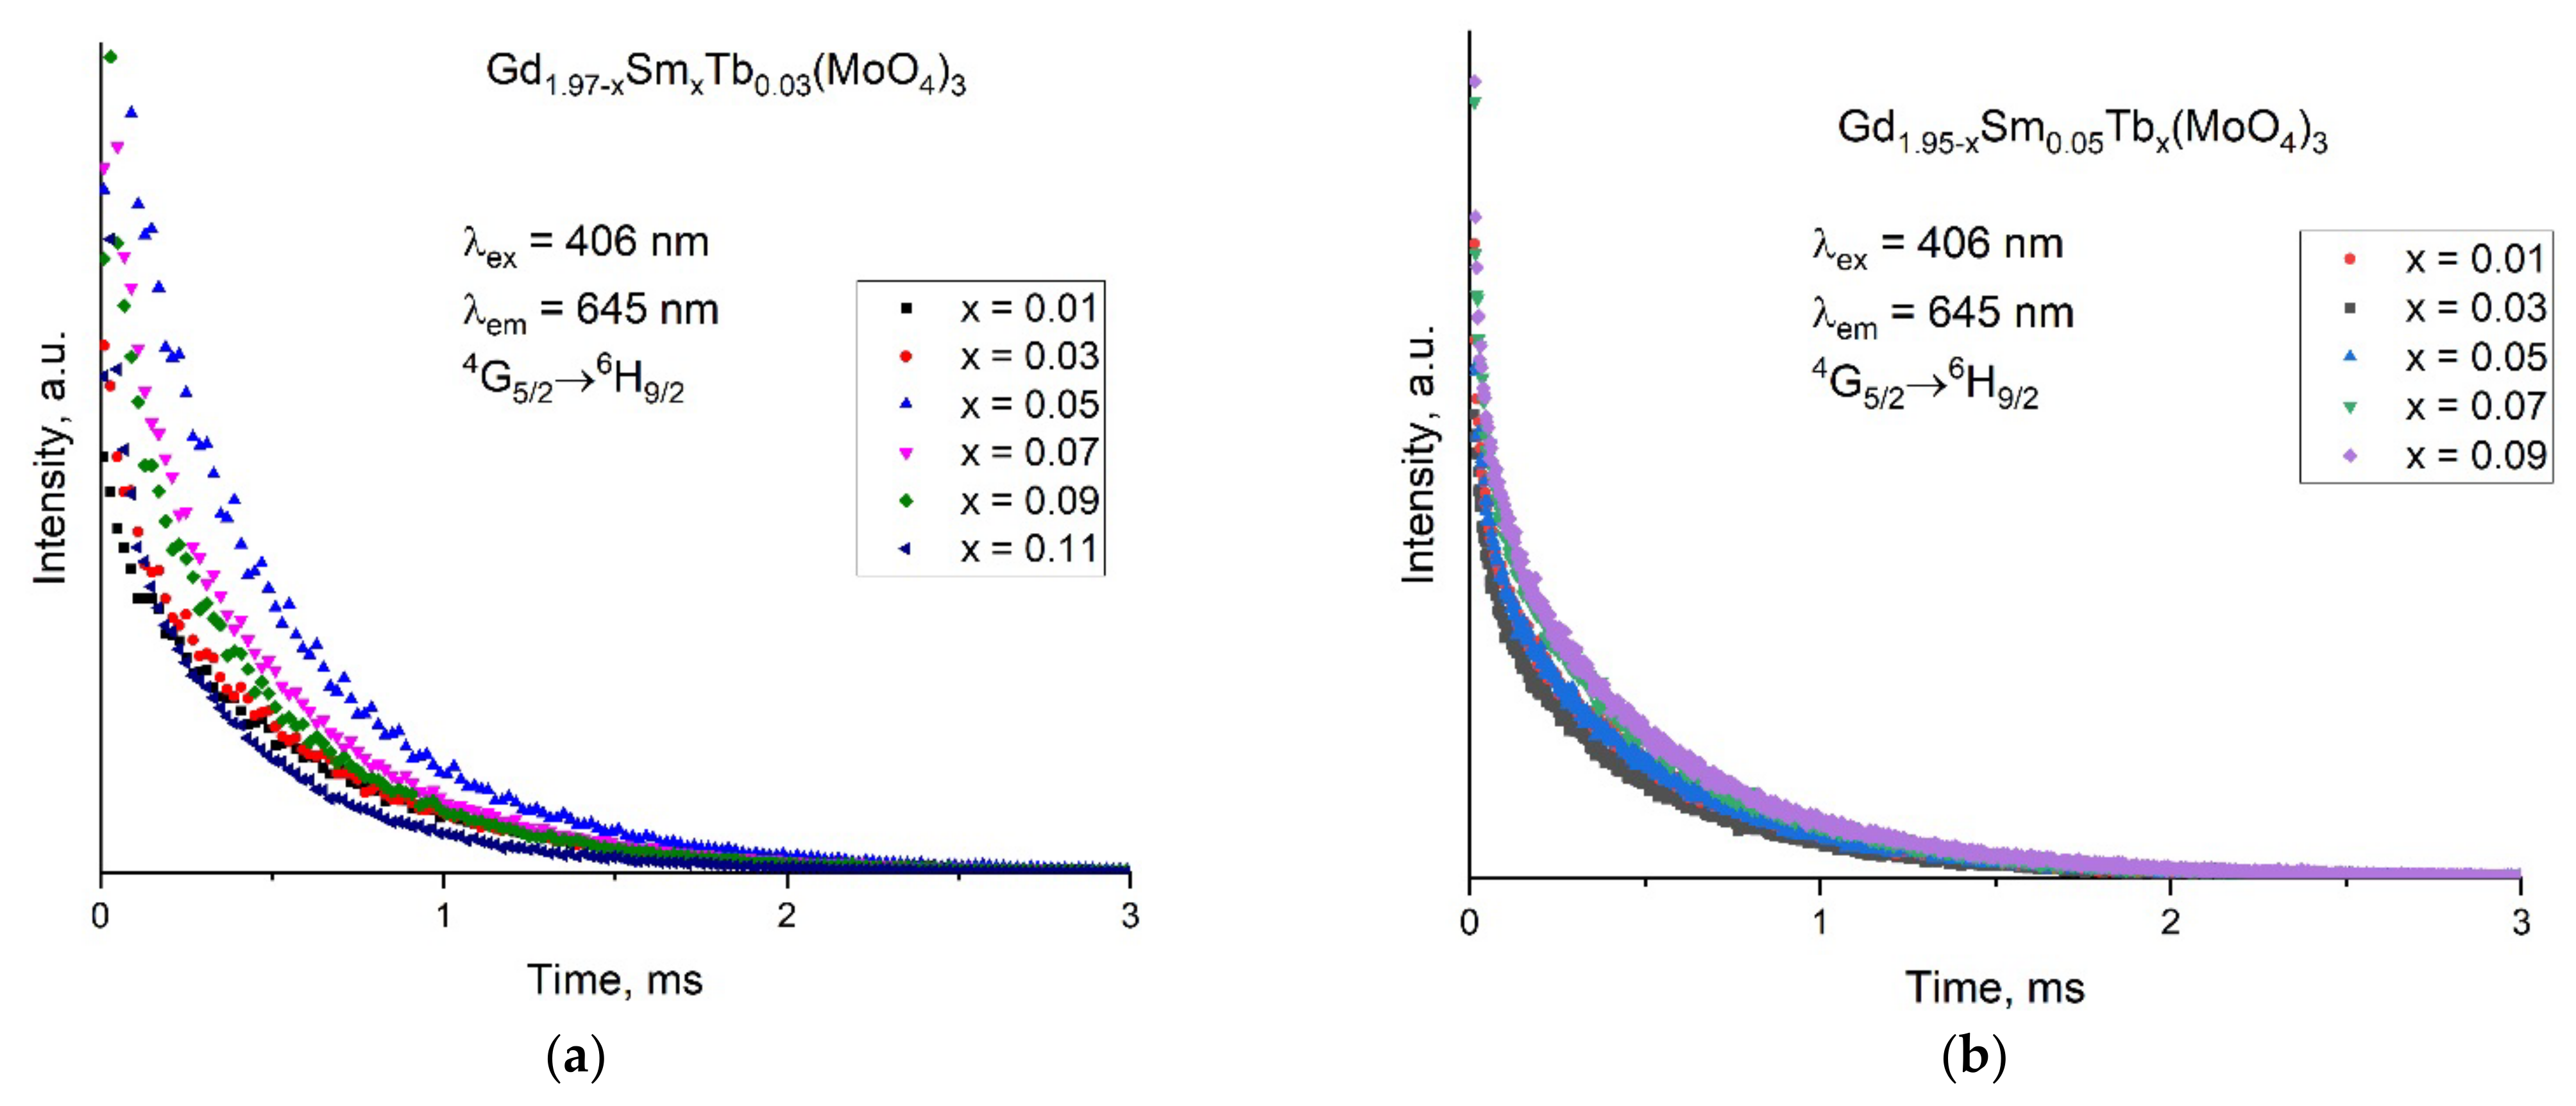
3.3.4. Lifetime (τ), Decay Half-Life (τ1/2) and Decay Rate (k)
The lifetime (τ) was calculated by using the one-component exponential decay function I(t) = I0 exp(−t/τ); the decay rate (k) was calculated by k = 1/τ and the decay half-life by τ1/2 = τ ln2. In Figure 5, the decay curves are presented for the 6G5/2 → 6H9/2 transition of the Sm3+ ion in the Gd1.97−ySmyTb0.03(MoO4)3 and Gd1.95−xSm0.05Tbx(MoO4)3 samples where the excitation and the emission wavelengths were fixed at 406 and 645 nm, respectively.
The lifetime and decay half-life decreased with an increase in the Sm3+ concentration for Gd1.97−ySmyTb0.03(MoO4)3 (Table 3). A similar tendency was also observed for other phosphors [35]. For Gd1.97−ySmyTb0.03(MoO4)3, the lifetime decreased monotonously from 0.515 ms to 0.308 ms as the Sm3+ content increased from 0.01 to 0.11 mol. In the same mode, the decay half-life decreased and the decay rate increased from 1.944 ± 0.023 to 3.247 ± 0.068 ms−1 with an increase in the Sm3+ content. For Gd1.95−xSm0.05Tbx(MoO4)3, a non-monotonous change with an increase in the Tb content as well as very close values for all the parameters were observed. The differences were within the possible error ranges so it could be concluded that Tb influenced the emission intensity of Sm but hardly influenced the lifetime of the excited state.
3.3.5. Chromaticity Diagrams and Coordinates
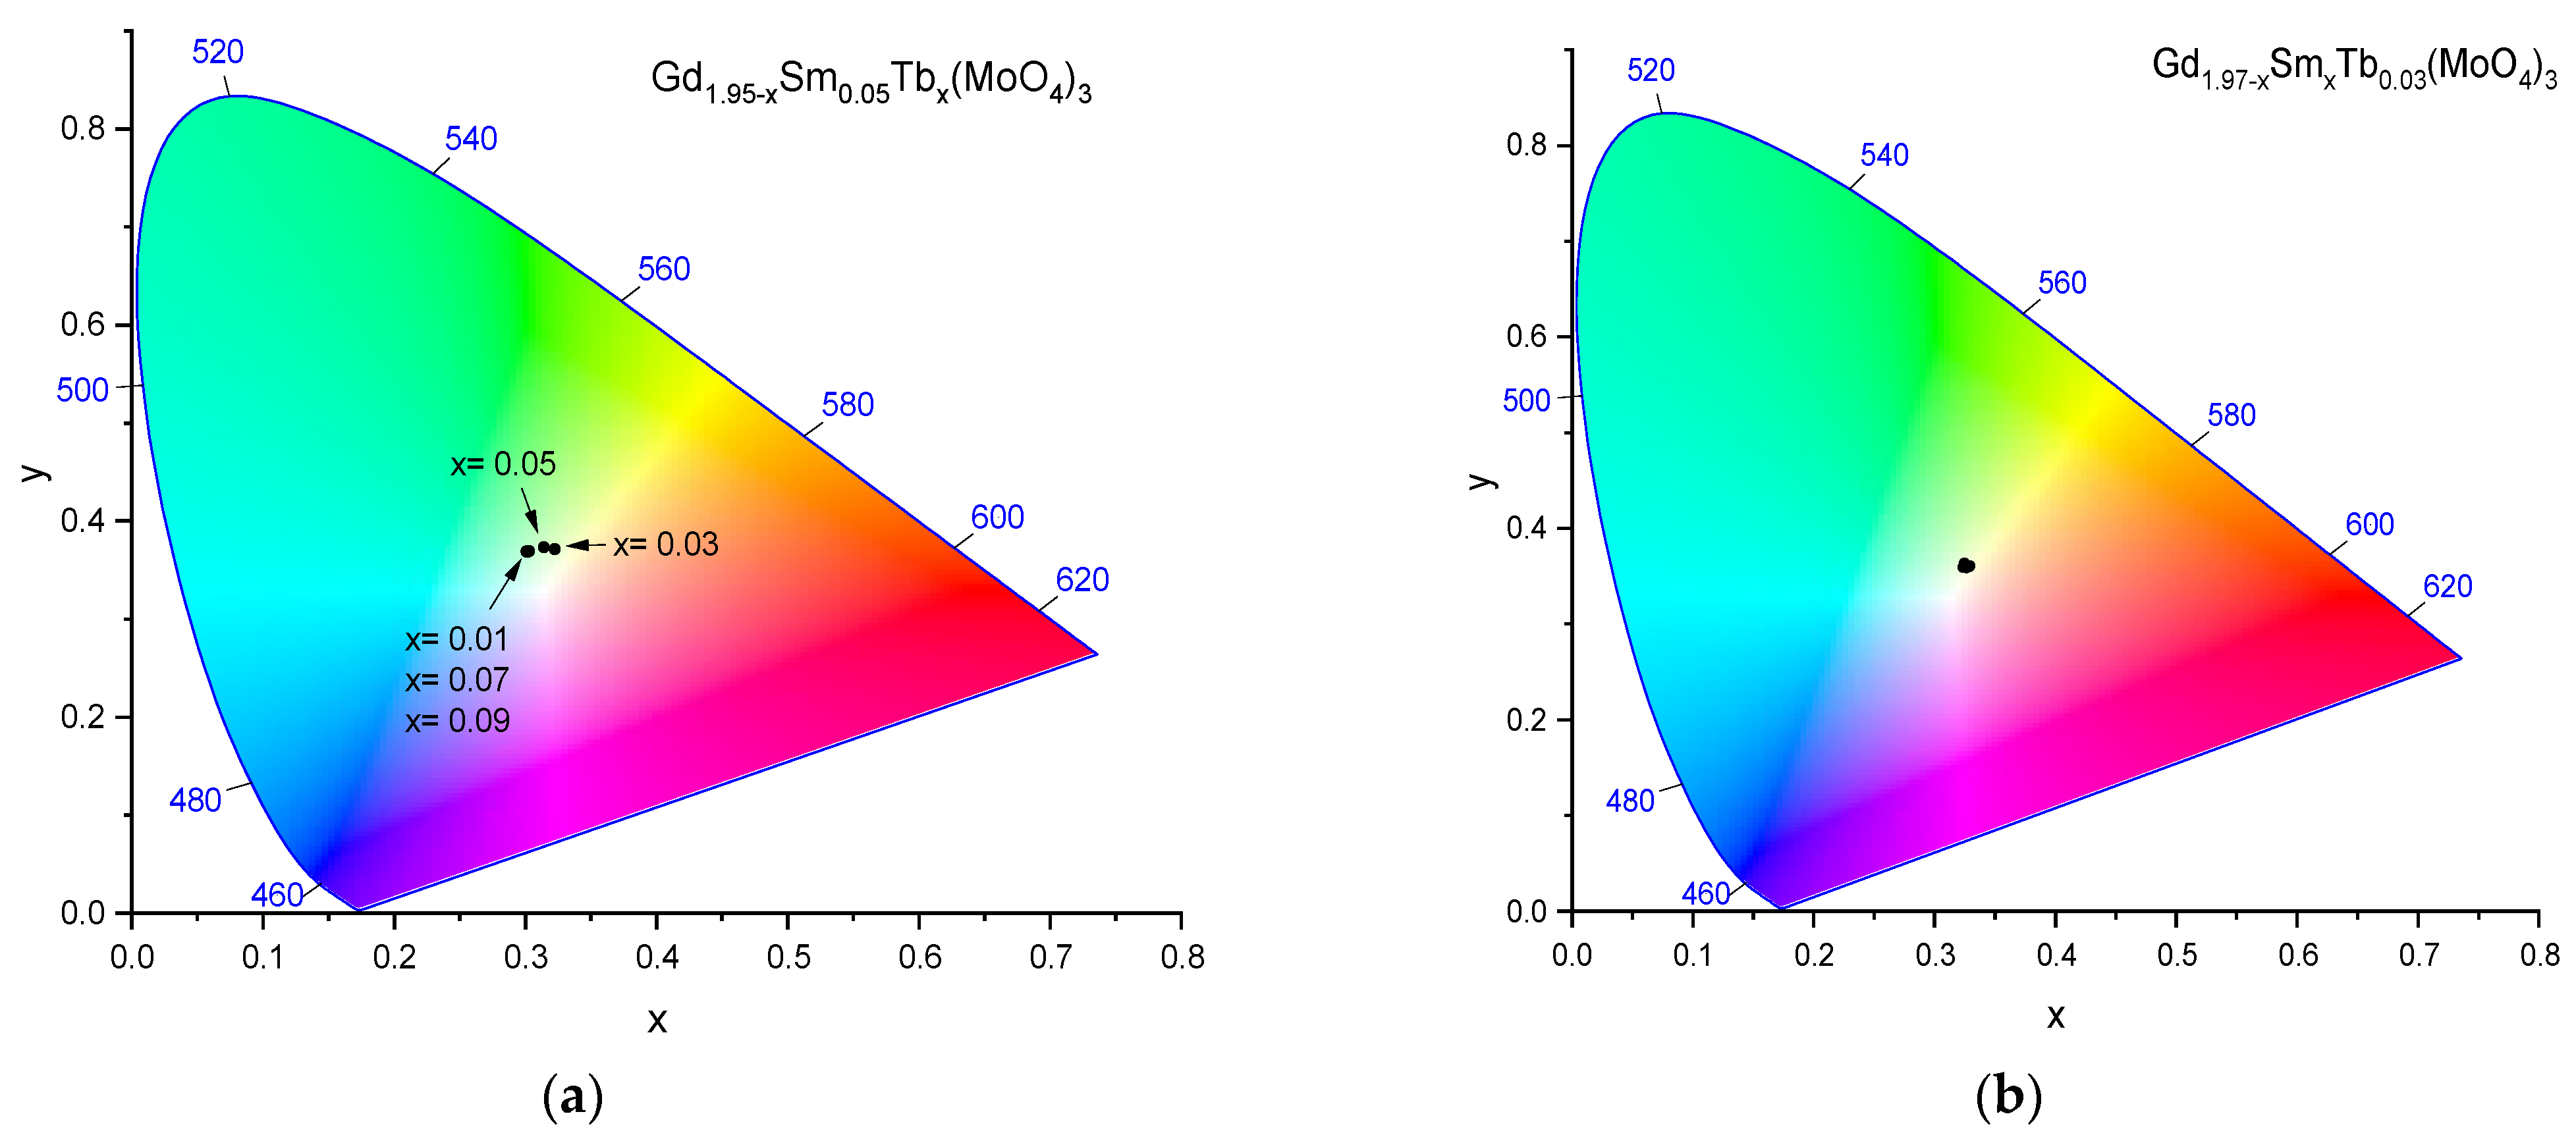
In Figure 6, the CIE 1931 (x, y) chromaticity diagrams for the emission at a 406 nm excitation are presented.
All the obtained data fitted in a small area, ranging from 0.3223 to 0.3008 in the x chromaticity coordinate and from 0.3687 to 0.3732 in the y chromaticity coordinate for Gd1.95−xSm0.05Tbx(MoO4)3; for Gd1.97−ySmyTb0.03(MoO4)3, this was from 0.3223 to 0.3288 in the x chromaticity coordinate and from 0.3598 to 0.3712 in the y chromaticity coordinate, respectively (Table 4). A non-monotonous color point variation with the Tb content variation was observed for Gd1.95−xSm0.05Tbx(MoO4)3. The color points moved within the yellow-green region and among all samples, the Gd1.95−xSm0.05Tb0.05(MoO4)3 color point was the closest to the green light region (Figure 6a). The variations of the x/y coordinates for Gd1.97−ySmyTb0.03(MoO4)3 were insignificant, resulting in the point overlapping so a single point on the diagram was obtained (Figure 6b). The related emission color was pale yellow.
The points of all samples were close to the white light point (x = 0.333, y = 0.333). All the above results revealed that the phosphors have the potential for wLED applications.
4. Conclusions
Gd1.95−xSm0.05Tbx(MoO4)3 and Gd1.97−ySmyTb0.03(MoO4)3 solid solutions were successfully prepared by using the conventional solid state reaction route. All the samples proved to be in the single phase state without crystalline impurities. The UV-Vis and luminescence excitation spectra measurements indicated that the 406 nm excitation wavelength was the appropriate one. The luminescence emission spectra showed an emission close to the white light point. The lifetime of the samples lowered with an increase in the Tb/Sm content. It can be concluded that the samples have the potential for applications in solid state lighting.
Supplementary Materials
The following supporting information can be downloaded at: https://0-www-mdpi-com.brum.beds.ac.uk/article/10.3390/cryst12010120/s1, Table S1: Crystallite size and microstrain of the samples based on Williamson–Hall plot; Figure S1: Williamson–Hall (W–H) plot for a few of the samples of Gd2(MoO4)3 and Gd1.92Sm0.05Tb0.03(MoO4)3. These are available for all the samples but not included; Figure S2: Emission band intensity variation for Sm(III) with the doping content of (a) Sm3+ ion and (b) Tb3+ ion where (a) Gd1.97−ySmyTb0.03(MoO4)3 and (b) Gd1.95−xSm0.05Tbx(MoO4)3.
Author Contributions
Conceptualization, M.T.; methodology, M.T.; software, M.T.; validation, M.T., D.E. and M.M.; formal analysis, D.E., M.T. and M.M.; writing—original draft preparation, M.M.; writing—review and editing, M.M. and M.T. All authors have read and agreed to the published version of the manuscript.
Funding
This research was funded by the Bulgarian Fund for Scientific Investigations, project no. KP-06-M39/3 from 9 December 2019.
Institutional Review Board Statement
Not applicable.
Informed Consent Statement
Not applicable.
Data Availability Statement
Not applicable.
Acknowledgments
The financial support from the BG Fund for Scientific Investigations (project no. KP-06-M39/3 from 9 December 2019) is highly appreciated.
Conflicts of Interest
The authors declare no conflict of interest. The funders had no role in the design of the study; in the collection, analyses or interpretation of data; in the writing of the manuscript or in the decision to publish the results.
References
- Kumari, A.; Mukhopadhyay, L.; Rai, V.K. Er3+/Yb3+/Li+/Zn2+: Gd2(MoO4)3 upconverting nanophosphors in optical thermometry. J. Rare Earths 2019, 37, 242–247. [Google Scholar] [CrossRef]
- Liu, H.; Sun, W.; Zhang, Z.; Lovings, L.N.; Lind, C. Thermal expansion behavior in the A2M3O12 family of materials. Solids 2021, 2, 5. [Google Scholar] [CrossRef]
- Rajendran, M.; Vaidyanathan, S. New red emitting phosphors NaSrLa(MO4)3:Eu3+ [M = Mo and W] for white LEDs: Synthesis, structural and optical study. J. Alloys Compd. 2019, 789, 919–931. [Google Scholar] [CrossRef]
- Rahman, F. Zinc oxide light-emitting diodes: A review. Opt. Eng. 2019, 58, 010901. [Google Scholar] [CrossRef]
- Setlur, A.A.; Radkov, E.V.; Henderson, C.S.; Her, J.H.; Srivastava, A.M.; Karkada, N.; Kishore, M.S.; Kumar, N.P.; Aesram, D.; Deshpande, A.; et al. Energy-efficient, high-color-rendering LED lamps using oxyfluoride and fluoride phosphors. Chem. Mater. 2010, 22, 4076–4082. [Google Scholar] [CrossRef]
- Xie, A.; Yuan, X.; Wang, F.; Shi, Y.; Li, J.; Liu, L.; Mu, Z. Synthesis and luminescent properties of Eu3+-activated molybdate-based novel red-emitting phosphors for white LEDs. J. Alloys Compd. 2010, 501, 124–129. [Google Scholar] [CrossRef]
- Lim, C.S.; Aleksandrovsky, A.; Atuchin, V.; Molokeev, M.; Oreshonkov, A. Microwave-employed sol–gel synthesis of scheelite-type microcrystalline AgGd(MoO4)2:Yb3+/Ho3+ upconversion yellow phosphors and their spectroscopic properties. Crystals 2020, 10, 1000. [Google Scholar] [CrossRef]
- Ambast, A.K.; Kunti, A.K.; Som, S.; Sharma, S.K. Near-white-emitting phosphors based on tungstate for phosphor-converted light-emitting diodes. Appl. Opt. 2013, 52, 8424–8431. [Google Scholar] [CrossRef]
- Meena, M.L.; Lu, C.-H.; Som, S.; Rajneesh, C.; Lin, S.D. Highly Efficient and Thermally Stable Eu3+ Activated Phosphate Based Phosphors for wLEDs: An Experimental and DFT Study. J. Alloys Compd. 2021, 895, 162670. [Google Scholar] [CrossRef]
- Ji, H.; Huang, Z.; Xia, Z.; Molokeev, M.S.; Jiang, X.; Lin, Z.; Atuchin, V.V. Comparative investigations of the crystal structure and photoluminescence property of eulytite-type Ba3Eu(PO4)3 and Sr3Eu(PO4)3. Dalton Trans. 2014, 43, 9669–9676. [Google Scholar] [CrossRef] [PubMed]
- Dorzhieva, S.G.; Sofich, D.O.; Bazarov, B.G.; Shendrik, R.Y.; Bazarova, J.G. Optical properties of molybdates containing a combination of rare-earth elements. Inorg. Mater. 2021, 57, 54–59. [Google Scholar] [CrossRef]
- Kumar, P.; Gupta, B.K. New insight into rare-earth doped gadolinium molybdate nanophosphor assisted broad spectral converter from UV to NIR for silicon solar cell. RSC Adv. 2015, 5, 24729–24736. [Google Scholar] [CrossRef] [Green Version]
- Prewitt, C.T. X-ray diffraction study of Gd2(MoO4)3. Solid State Commun. 1970, 8, 2037–2040. [Google Scholar] [CrossRef]
- Meng, F.; Zhang, X.; Kim, S.; Yu, Y.M.; Seo, H.J. Luminescence properties of Eu3+ in gadolinium molybdate Gd2Mo3O12 phosphors. Optik-Int. J. Light Electron. Opt. 2014, 125, 3578–3582. [Google Scholar] [CrossRef]
- Zhao, X.; Wang, X.; Chen, B.; Meng, Q.; Yan, B.; Di, W. Luminescent properties of Eu3+ doped Gd2(MoO4)3 phosphor for white light emitting diodes. Opt. Mater. 2007, 29, 1680–1684. [Google Scholar] [CrossRef]
- Cho, Y.S.; Kim, D.; Lee, Y.J.; Yang, H.; Huh, Y.D. Preparation and photoluminescence properties of red-emitting Gd2(MoO4)3:Eu phosphors for a three-band white LED. Bull. Korean Chem. Soc. 2010, 31, 2992–2994. [Google Scholar] [CrossRef] [Green Version]
- He, X.; Guan, M.; Li, Z.; Shang, T.; Lian, N.; Zhou, Q. Luminescent properties and application of Eu3+-activated Gd2(MoO4)3 red-emitting phosphor with pseudo-pompon shape for solid-state lighting. J. Rare Earths 2010, 28, 878–882. [Google Scholar] [CrossRef]
- Xie, W.; Liu, G.; Dong, X.; Wang, J.; Yu, W. A direct warm-white-light CaLa2(MoO4)4: Tb3+, Sm3+ phosphor with tunable color tone via energy transfer for white LEDs. RCS Adv. 2015, 5, 77866–77872. [Google Scholar] [CrossRef]
- Zhou, T.; Mei, L.; Zhang, Y.; Liao, L.; Liu, H.; Guo, Q. Color-tunable luminescence properties and energy transfer of Tb3+/Sm3+ co-doped Ca9La(PO4)5(SiO4)F2 phosphors. Opt. Laser Technol. 2019, 111, 191–195. [Google Scholar] [CrossRef]
- Denisenko, Y.G.; Sedykh, A.E.; Basova, S.A.; Atuchin, V.V.; Molokeev, M.S.; Aleksandrovsky, A.S.; Krylov, A.S.; Oreshonkov, A.S.; Khritokhin, N.A.; Sal’nikova, E.I.; et al. Exploration of the structural, spectroscopic and thermal properties of double sulfate monohydrate NaSm(SO4)2·H2O and its thermal decomposition product NaSm(SO4)2. Adv. Powder Technol. 2021, 32, 3943–3953. [Google Scholar] [CrossRef]
- Rodriguez-Carvajal, J. Recent Developments of the Program Fullprof. Newsl. Comm. Powder Diffr. 2001, 26, 12–19. [Google Scholar]
- Huang, Q.; Xu, J.-Z.; Li, W. Preparation of tetragonal defect scheelite-type RE2(MoO4)3 (RE = La TO Ho) by precipitation method. Solid State Ion. 1989, 32–33, 244–249. [Google Scholar] [CrossRef]
- Dong, C. Crystal Structures of Dy2(WO4)3 and GdY(WO4)3. Rare Metals 2003, 22, 49–56. [Google Scholar]
- Kamal, M.P.; Vimal, G.; Biju, P.R.; Joseph, C.; Unnikrishnan, N.V.; Ittyachen, M.A. Spectroscopic investigation on tunable luminescence by energy transfer in Tb2−xSmx(MoO4)3 nanophosphors. Opt. Mater. 2015, 42, 237–244. [Google Scholar] [CrossRef]
- Popov, V.V.; Menushenkov, A.P.; Yastrebtsev, A.A.; Molokova, A.Y.; Rudakov, S.G.; Svetogorov, R.D.; Tsarenko, N.A.; Ponkratov, K.V.; Ognevskaya, N.V.; Seregina, O.N. The effect of the synthesis conditions on the structure and phase transitions in Ln2(MoO4)3. Solid State Sci. 2021, 112, 106518. [Google Scholar] [CrossRef]
- Williamson, G.K.; Hall, W.H. X-ray line broadening from filed aluminum and wolfram. Acta Metall. 1953, 1, 22–31. [Google Scholar] [CrossRef]
- Atuchin, V.V.; Chimitova, O.D.; Adichtchev, S.V.; Bazarov, J.G.; Gavrilova, T.A.; Molokeev, M.S.; Surovtsev, N.V.; Bazarova, Z.G. Synthesis, structural and vibrational properties of microcrystalline β-RbSm(MoO4)2. Mater. Lett. 2013, 106, 26–29. [Google Scholar] [CrossRef]
- Schneider, C.A.; Rasband, W.S.; Eliceiri, K.W. NIH Image to ImageJ: 25 years of image analysis. Nat. Methods 2012, 9, 671–675. [Google Scholar] [CrossRef]
- Tauc, J.; Grigorovici, R.; Vancu, A. Optical Properties and Electronic Structure of Amorphous Germanium. Phys. Status Solidi 1966, 15, 627–637. [Google Scholar] [CrossRef]
- Reshak, A.H.; Alahmed, Z.A.; Bila, J.; Atuchin, V.V.; Bazarov, B.G.; Chimitova, O.D.; Molokeev, M.S.; Prosvirin, I.P.; Yelisseyev, A.P. Exploration of the Electronic Structure of Monoclinic α-Eu2(MoO4)3: DFT-based study and X-ray photoelectron spectroscopy. J. Phys. Chem. C 2016, 120, 10559–10568. [Google Scholar] [CrossRef]
- Poulios, D.P.; Spoonhower, J.P.; Bigelow, N.P. Influence of oxygen deficiencies and hydrogen-loading on defect luminescence in irradiated Ge-doped silica glasses. J. Lumin. 2003, 101, 23–33. [Google Scholar] [CrossRef]
- Yang, L.Z.; Yu, X.B.; Yang, S.P.; Zhou, C.L.; Zhou, P.G.; Gao, W.J.; Ye, P. Preparation and luminescence properties of LED conversion novel phosphors SrZnO2:Sm. Mater. Lett. 2008, 62, 907–910. [Google Scholar] [CrossRef]
- Zhang, H.; Fu, X.; Niu, S.; Xin, Q. Synthesis and luminescent properties of nanosized YVO4: Ln (Ln = Sm, Dy). J. Alloys Compd. 2008, 457, 61–65. [Google Scholar] [CrossRef]
- Denisenko, Y.G.; Sal’nikova, E.I.; Basova, S.A.; Molokeev, M.S.; Krylov, A.S.; Aleksandrovsky, A.S.; Oreshonkov, A.S.; Atuchin, V.V.; Volkova, S.S.; Khritokhin, N.A.; et al. Synthesis of samarium oxysulfate Sm2O2SO4 in the high-temperature oxidation reaction and its structural, thermal and luminescent properties. Molecules 2020, 25, 1330. [Google Scholar] [CrossRef] [PubMed] [Green Version]
- Shih, H.-R.; Chang, Y.-S. Structure and photoluminescence properties of Sm3+ ion-doped YInGe2O7 phosphor. Materials 2017, 10, 779. [Google Scholar] [CrossRef] [Green Version]
Figure 1.
XRD of the samples: (a) Gd2−x−ySmxTby(MoO4)3 and (b) Gd1.95−xSm0.05Tbx(MoO4)3. (c) Experimentally observed (dots), Rietveld-calculated (continuous line) and difference (continuous bottom line) profiles, obtained after Rietveld analysis of the Gd1.92Sm0.05Tb0.03(MoO4)3 sample. Peak positions are shown on the base line as small markers.

Figure 2.
SEM images (a–c) and TEM image (d) of the sample Gd1.92Sm0.05Tb0.03(MoO4)3. (e) Particle size distribution as obtained from the SEM images.
Figure 2.
SEM images (a–c) and TEM image (d) of the sample Gd1.92Sm0.05Tb0.03(MoO4)3. (e) Particle size distribution as obtained from the SEM images.

Figure 3.
(a) UV-Vis spectra of Gd1.97−xSmxTb0.03(MoO4)3 and (b) band gap energy calculated for the samples.
Figure 3.
(a) UV-Vis spectra of Gd1.97−xSmxTb0.03(MoO4)3 and (b) band gap energy calculated for the samples.

Figure 4.
(a) Excitation spectra of the Gd1.97−xSmxTb0.03(MoO4)3 sample monitored at 645 nm and emission spectra of the samples (b) Gd1.95−xSm0.05Tbx(MoO4)3 and (c) Gd2−x−ySmxTby(MoO4)3 upon excitation with a 406 nm light.
Figure 4.
(a) Excitation spectra of the Gd1.97−xSmxTb0.03(MoO4)3 sample monitored at 645 nm and emission spectra of the samples (b) Gd1.95−xSm0.05Tbx(MoO4)3 and (c) Gd2−x−ySmxTby(MoO4)3 upon excitation with a 406 nm light.


Figure 5.
Decay curves recorded for (a) Gd1.97−xSmxTb0.03(MoO4)3 and (b) Gd1.95−xSm0.05Tbx(MoO4)3.

Figure 6.
The CIE chromaticity diagrams for the emission under an excitation of 406 nm for (a) Gd1.95−xSm0.05Tbx(MoO4)3 (the content of Tb(III) is shown by x in the Figure field) and (b) Gd1.97−xSmxTb0.03(MoO4)3 (the x/y coordinates for the samples overlap).
Figure 6.
The CIE chromaticity diagrams for the emission under an excitation of 406 nm for (a) Gd1.95−xSm0.05Tbx(MoO4)3 (the content of Tb(III) is shown by x in the Figure field) and (b) Gd1.97−xSmxTb0.03(MoO4)3 (the x/y coordinates for the samples overlap).


Table 1.
Unit cell parameters of the samples of Gd2−x−ySmyTbx(MoO4)3.
| Sample | a, Å | b, Å | c, Å | β, ° | Volume, Å3 |
|---|---|---|---|---|---|
| x = 0; y = 0 | 7.529 (1) | 11.429 (1) | 11.460 (1) | 109.09 (3) | 931.01 (1) |
| Gd1.97−ySmyTb0.03(MoO4)3 | |||||
| y = 0.01 | 7.536 (1) | 11.434 (1) | 11.463 (2) | 109.14 (4) | 932.10 (1) |
| y = 0.03 | 7.538 (1) | 11.428 (2) | 11.452 (1) | 109.11 (7) | 932.58 (1) |
| y = 0.05 | 7.538 (2) | 11.431 (2) | 11.453 (2) | 109.08 (2) | 932.73 (2) |
| y = 0.07 | 7.538 (1) | 11.432 (1) | 11.454 (1) | 109.07 (1) | 933.21 (1) |
| y = 0.09 | 7.538 (2) | 11.433 (1) | 11.457 (2) | 109.08 (2) | 933.59 (2) |
| y = 0.11 | 7.540 (3) | 11.437 (3) | 11.458 (3) | 109.07 (1) | 933.63 (3) |
| Gd1.95−xSm0.05Tbx(MoO4)3 | |||||
| x = 0.01 | 7.537 (2) | 11.428 (3) | 11.451 (4) | 109.08 (3) | 932.12 (2) |
| x = 0.05 | 7.540 (2) | 11.427 (1) | 11.450 (2) | 109.06 (3) | 932.44 (6) |
| x = 0.07 | 7.542 (1) | 11.430 (2) | 11.448 (3) | 109.05 (4) | 932.83 (5) |
| x = 0.09 | 7.544 (2) | 11.433 (3) | 11.450 (2) | 109.01 (1) | 933.71 (10) |
Table 2.
Band gap values of the Gd1.97−ySmyTb0.03(MoO4)3 samples.
| Sample | Band Gap, eV |
|---|---|
| Gd2(MoO4)3 | 3.65 |
| Gd1.96Sm0.01Tb0.03(MoO4)3 | 3.60 |
| Gd1.94Sm0.03Tb0.03(MoO4)3 | 3.57 |
| Gd1.92Sm0.05Tb0.03(MoO4)3 | 3.57 |
| Gd1.90Sm0.07Tb0.03(MoO4)3 | 3.62 |
| Gd1.88Sm0.09Tb0.03(MoO4)3 | 3.61 |
| Gd1.86Sm0.11Tb0.03(MoO4)3 | 3.59 |
Table 3.
Lifetime (τ), decay half-life (τ1/2) and decay rate (k).
| Gd1.97−ySmyTb0.03(MoO4)3 | |||
| Sample | t, ms | t1/2, ms | k, ms−1 |
| y = 0.01 | 0.515 ± 0.005 | 0.357 ± 0.004 | 1.944 ± 0.023 |
| y = 0.03 | 0.443 ± 0.006 | 0.307 ± 0.004 | 2.257 ± 0.031 |
| y = 0.05 | 0.380 ± 0.003 | 0.263 ± 0.004 | 2.641 ± 0.025 |
| y = 0.07 | 0.371 ± 0.006 | 0.257 ± 0.004 | 2.684 ± 0.046 |
| y = 0.09 | 0.359 ± 0.007 | 0.250 ± 0.005 | 2.778 ± 0.051 |
| y = 0.11 | 0.308 ± 0.006 | 0.214 ± 0.004 | 3.247 ± 0.068 |
| Gd1.95−xSm0.05Tbx(MoO4)3 | |||
| Sample | t, ms | t1/2, ms | k, ms−1 |
| x = 0.01 | 0.379 ± 0.004 | 0.262 ± 0.003 | 2.642 ± 0.028 |
| x = 0.03 | 0.380 ± 0.003 | 0.263 ± 0.004 | 2.641 ± 0.025 |
| x = 0.05 | 0.385 ± 0.004 | 0.268 ± 0.002 | 2.640 ± 0.023 |
| x = 0.07 | 0.378 ± 0.004 | 0.261 ± 0.003 | 2.644 ± 0.029 |
| x = 0.09 | 0.384 ± 0.005 | 0.267 ± 0.003 | 2.648 ± 0.027 |
Table 4.
Chromaticity coordinates (x, y) based on the emission spectra of Gd1.95−xSm0.05Tbx(MoO4)3 and Gd1.97−ySmyTb0.03(MoO4)3.
Table 4.
Chromaticity coordinates (x, y) based on the emission spectra of Gd1.95−xSm0.05Tbx(MoO4)3 and Gd1.97−ySmyTb0.03(MoO4)3.
| Gd1.95−xSm0.05Tbx(MoO4)3 | ||
| Sample | x-Coordinate | y-Coordinate |
| x = 0.01 | 0.3014 | 0.3687 |
| x = 0.03 | 0.3223 | 0.3712 |
| x = 0.05 | 0.3140 | 0.3732 |
| x = 0.07 | 0.3029 | 0.3694 |
| x = 0.09 | 0.3008 | 0.3688 |
| Gd1.97−ySmyTb0.03(MoO4)3 | ||
| Sample | x-Coordinate | y-Coordinate |
| y = 0.01 | 0.3291 | 0.3608 |
| y = 0.03 | 0.3288 | 0.3608 |
| y = 0.05 | 0.3223 | 0.3712 |
| y = 0.07 | 0.3234 | 0.3598 |
| y = 0.09 | 0.3246 | 0.3634 |
| y = 0.11 | 0.3288 | 0.3608 |
Publisher’s Note: MDPI stays neutral with regard to jurisdictional claims in published maps and institutional affiliations. |
© 2022 by the authors. Licensee MDPI, Basel, Switzerland. This article is an open access article distributed under the terms and conditions of the Creative Commons Attribution (CC BY) license (https://creativecommons.org/licenses/by/4.0/).
Share and Cite
MDPI and ACS Style
Tsvetkov, M.; Elenkova, D.; Milanova, M. Luminescence Properties of Gd2(MoO4)3 Modified with Sm(III) and Tb(III) for Potential LED Applications. Crystals 2022, 12, 120. https://0-doi-org.brum.beds.ac.uk/10.3390/cryst12010120
AMA Style
Tsvetkov M, Elenkova D, Milanova M. Luminescence Properties of Gd2(MoO4)3 Modified with Sm(III) and Tb(III) for Potential LED Applications. Crystals. 2022; 12(1):120. https://0-doi-org.brum.beds.ac.uk/10.3390/cryst12010120
Chicago/Turabian StyleTsvetkov, Martin, Denitsa Elenkova, and Maria Milanova. 2022. "Luminescence Properties of Gd2(MoO4)3 Modified with Sm(III) and Tb(III) for Potential LED Applications" Crystals 12, no. 1: 120. https://0-doi-org.brum.beds.ac.uk/10.3390/cryst12010120
Note that from the first issue of 2016, this journal uses article numbers instead of page numbers. See further details here.