Article

Solvent-Induced Cobalt(II) Cyanoguanidine Bromides: Syntheses, Crystal Structure, Optical and Magnetic Properties

1
Institute of Inorganic Chemistry, RWTH Aachen University, 52056 Aachen, Germany
2
Hoffmann Institute of Advanced Materials, Shenzhen Polytechnic 7098 Liuxian Blvd, Nanshan District, Shenzhen 518055, China
*
Author to whom correspondence should be addressed.
Submission received: 18 August 2022 / Revised: 24 September 2022 / Accepted: 24 September 2022 / Published: 28 September 2022

Abstract

:
Two different phase-pure cobalt(II) cyanoguanidine bromide coordination compounds, Co(C2N4H4)2(H2O)4·2Br·2H2O (1) and Co3(C2N4H4)8(H2O)8·6Br (2), were precipitated from aqueous and methanol solutions, respectively, and their structures were solved and refined from X-ray single-crystal data at 100 K. Both 1 and 2 crystallize in the triclinic system with space group P 1 ¯ . The structure of 1 consists of two crystallographically distinct isolated CoO4N2 octahedral units plus bromide anions and crystal water molecules, whereas 2 is built from both isolated octahedra and discrete binuclear cluster units made from edge-sharing octahedra. Diffuse reflectance spectra and IR analysis then go on to highlight optical and vibrational differences between these two compounds. The magnetic susceptibility of 1 is consistent with either isolated or very weakly interacting Co2+ centers whereas the magnetic susceptibility of 2 evidences the potential weak antiferromagnetic exchange interactions that may arise from superexchange within the binuclear clusters.

1. Introduction

Over the last two decades, a large number of cyanoguanidine coordination compounds have been reported, such as Zn(C2N4H4)2Cl2 [1,2,3], [Ag(C2N4H4)2]F, [Ag(C2N4H4)2](BF4) [4], Cu(C2N4H4)2Br2·2H2O [5] and others [6,7,8,9]. As a nitrogenous ligand, cyanoguanidine was discovered by Beilstein and Geuther at the end of the 19th century [10], and since then it has attracted widespread attention because of its interesting structure and important role in medicinal and industrial applications [11,12,13]. Cyanoguanidine is known to exist in two planar tautomeric forms, one with the cyano group at the imine nitrogen (Figure 1a) [14] and the other at the amine nitrogen (Figure 1b) [15]. Furthermore, cyanoguanidine is not only capable of acting as a monodentate ligand bonded to the metal by the cyano nitrogen alone, but also as a bridging ligand when it coordinates to two metal centers via the terminal (cyano) and inner (imine) nitrogens.
As a late transition metal, divalent cobalt possesses an abundant coordination chemistry. In previous studies, many coordination compounds composed of cobalt and ligands of guanidine derivatives were found [16,17,18] but no coordination compound composed of cobalt and simple cyanoguanidine has been reported.
The structural motifs of coordination compounds are affected by several factors, not only the nature of the central metal atoms and the performance of ligands, but also the coordinated counter ions or small neutral molecules, the solvent system, temperature, pressure and so on [19,20]. Even if the same ligand reacts with the same metal salt in different solvents, the ligands, neutral molecules and the solvent often play an important role in the structural formation of the crystal such that different crystal structures will be obtained [21,22].
In order to investigate the combination of the coordination ability of cyanoguanidine with magnetic cobalt(II), we have designed two cobaltous bromide (CoBr2) cyanoguanidine coordination complexes, Co(C2N4H4)2(H2O)4·2Br·2H2O (1) and Co3(C2N4H4)8(H2O)8·6Br (2), in distilled water and methanol, respectively. Single-crystal X-ray diffraction revealed the structural differences of these two crystals, as also mirrored from diffuse reflectance and IR spectra in terms of optical differences. As is well-known, cobalt(II) compounds are particularly interesting as regards their magnetic properties [23,24,25], due to the 3d7 electron configuration of Co(II) and three unpaired electrons per ion (S = 3/2). The magnetic susceptibility of 1 was in agreement with either isolated or very weakly interacting Co2+ centers whereas the magnetic susceptibility of 2 evidenced the potential weak antiferromagnetic exchange interactions in terms of a superexchange model.

2. Materials and Methods

2.1. Synthetic Procedures: All Reagents Were Commercially Bought (Alfa, Kandel, Rheinland-Pfalz, Germany) and Used without Further Purification

1 Co(C2N4H4)2(H2O)4·2Br·2H2O: stoichiometric 1:2 molar ratios of CoBr2 (1 mmol) and C2N4H4 (2 mmol), according to the empirical formula, were dissolved separately in 10 mL of distilled water. The solutions were then mixed in a 100 mL beaker and stirred for 30 minutes. After filtration, the clarified rose-red solution was left in a fume hood to evaporate naturally, yielding light-red crystals at the bottom of the beaker. After all of the solution was evaporated, the remaining crystals gave a 92% yield. (Figure S1).
2 Co3(C2N4H4)8(H2O)8·6Br: A similar method was used for synthesis; that is, CoBr2 (1.5 mmol) and C2N4H4 (4 mmol) with 3 to 8 ratios were dissolved separately in 10 mL of methanol. The solutions were then mixed in a 100 mL beaker and stirred for 30 minutes. After filtration, the clarified blue solution was left in a fume hood to evaporate naturally, resulting in dark-red crystals in the bottom of the beaker. The remaining crystals corresponded to a 90% yield (Figure S1). For illustration, in a methanol solvent, cyanoguanidine reacts with solvent molecules, displaying a clarified blue solution, and this reaction is reversible [26]. As the methanol solution evaporates, the reaction runs in reverse, so 2 is eventually formed. In contrast, the preparation of copper(II) and nickel(II) complexes under reflux conditions results in substituted cyanoguanidine ligands cnge-OCH3 [12,27].

2.2. PXRD Measurements

The PXRD patterns of 1 and 2 were recorded on a STOE STADI-P powder diffractometer with a flat sample holder (Cu Kα1, linear PSD, 2θ range 5−60°, with individual steps of 0.01°) at room temperature. The powder X-ray diffraction (PXRD) patterns match well with the simulated data generated from the single-crystal models, thereby demonstrating the purity of 1 (Figure S2) and 2 (Figure S3).

2.3. CHN Measurements and Thermogravimetric Analysis (TGA)

The CNH analysis for 1 and 2 was carried out using a CHN Rapid VarioEI analyzer from Heraeus. The TGA was performed on a STA1600 from Linseis, a combined system that measures HDSC and TGA simultaneously.

2.4. IR Spectra

The infrared spectra of the two samples were performed on a SHIMADZU IR Spirit QATR-S spectrometer in ATR mode using a diamond crystal.

2.5. UV-Vis Spectra

The UV-Vis diffuse reflectance spectra for 1 and 2 were recorded on a UV-2600 Shimadzu spectrophotometer in the range of 200–800 nm at room temperature, with barium sulfate pellets as background standard.

2.6. Single-Crystal Diffraction

The single-crystal X-ray diffraction data for 1 and 2 were collected on a Bruker D8 goniometer at 100 K (Oxford Cryostream 700), equipped with an Incoatec microsource (Mo Kα radiation, λ = 0.71073 Å, multilayer optics). The crystal structures were solved by intrinsic phasing as implemented in SHELXT, and SHELXL-2018 was used for full-matrix least-squares refinements on F2. All non-hydrogen atoms were refined with anisotropic thermal parameters, and all hydrogen atoms were isotropically refined as riding on the parent atoms. In addition, the N−H, O−H bond lengths and H−N−H, H−O−H angles were restrained according to neutron-diffraction data [28,29]. All data reported in this paper were deposited in the Cambridge Crystallographic Data Centre (CCDC, numbers 2196005 for 1 and 2196006 for 2) and can be obtained from there (12 Union Road, Cambridge CB2 1EZ, UK; fax: +44 1223 336033).

2.7. Magnetic Measurement

Magnetic data of 1 and 2 were collected on a Quantum Design MPMS-5XL SQUID magnetometer. A cylindrical PTFE capsule was used to immobilize the microcrystalline sample. Experimental data were collected in different sets, namely, at 2.0 K in the magnetic field scale 0.1–5.0 T and in the temperature range 2–290 K at 0.1 and 1.0 T. All experimental data were collected for the diamagnetic contributions of both sample holder and compound [χm,dia (10−4 cm3 mol−1) = −2.48 for 1 and −7.37 for 2].

3. Results and Discussion

3.1. Stability and Structure

After slow evaporation of the solutions in a fume hood for several weeks, light-red (1) and dark-red (2) crystals were obtained (Figure S1, Supporting Information, SI). In the thermogravimetric analysis curve of 1 (Figure S4), one finds several steps for thermal decomposition. With increasing temperature, crystal water and coordinated water molecules (20.20%) are first lost between room temperature and 600 K. Then the ligands (35.54%) are sequentially removed (Table S1). As regards 2 depicted in Figure S5, the presence of a first step at 373 K is attributed to the loss of absorbed solvent [30]. The second step in the 400–600 K range corresponds to coordinated water molecules (9.51%). The final loss between 600–850 K indicates removal of ligands.
To reveal the structural differences, single-crystal X-ray diffraction data were collected at 100 K (Table S3). Both 1 and 2 crystallized in the triclinic system with space group P 1 ¯ (No. 2, Table S3) but differed structurally. For 1 (Co(C2N4H4)2(H2O)4·2Br·2H2O, in accordance with the CHN analysis (Table S4)), the cell parameters were a = 6.946(2) Å, b = 11.173(3) Å, c = 12.485(3) Å, α = 114.642(4)°, β = 98.284(4)°, γ = 100.028(4)°, Z = 2 and V = 841.5(3) Å3. As shown in Figure 2, 1 was composed of two isolated Co-centered octahedra, bromide anions and additional crystal water molecules. The two crystallographically distinct octahedra were located at the centers of the (100) and (010) faces. In both octahedral units, the cobalt ion was coordinated by two N-containing cyanoguanidine ligands and four water molecules. It is also noteworthy that the two different octahedral units in every cell were both slightly distorted, as inferred from the divergence of the bond lengths. For example, the bond lengths for the Co1-centered octahedra were 2.046(2) Å for Co1−O1, while the Co1−O2 bond was 2.180(2) Å and Co1−N4 was 2.087(2) Å (Table S5). A similar situation could be observed in the other isolated Co2-centered octahedral unit (Co2−O4 = 2.056(2) Å, Co2−O3 = 2.142(2) Å and Co2−N8 = 2.091(2) Å). Moreover, the isolated octahedra, crystal water molecules and bromide ions were connected by weak O−H⋅⋅⋅O, O−H⋅⋅⋅N, O−H⋅⋅⋅Br and N−H⋅⋅⋅Br hydrogen bonds (Figure S6).
In contrast, 2 Co3(C2N4H4)8(H2O)8·6Br, in accordance with the CHN analysis (Table S6)) crystallized with a = 10.731(2) Å, b = 11.658(2) Å, c = 12.318(2) Å, α = 94.173(3)°, β = 114.733(3)°, γ = 108.593(3)°, Z = 1 and V = 1288.0(3) Å3 (Table S3). In Figure 3, there are two types of structural moieties with distinct crystallographic configurations in the structure of 2, namely, isolated octahedra and discrete binuclear clusters made from edge-sharing octahedra. For convenience, the binuclear cluster units and octahedra were labelled type A and type B, respectively. In type A, the framework consisted of edge-sharing octahedra, in which the adjacent central cobalt atoms are connected by two bridging oxygen atoms. In addition, every cobalt atom is coordinated to two ligands and two terminal oxygen water molecules. Interestingly, the edge-sharing octahedra could be considered almost regular, deduced from the statistically irrelevant divergence of the bond lengths (Co1−O2 = 2.073(4) Å, Co1−N4 = 2.064(6) Å, Co1−O1 = 2.048(5) Å and Co1−N5 = 2.062(6) Å, (Table S7)). In the isolated type B octahedra, the central atom, Co2, was coordinated to four ligands and two water molecules in a trans fashion along c. A modest distortion of the Co2 octahedra was also observed with distinct bond lengths of Co2−N12 = 2.118(6) Å and Co2−N13 = 2.072(6) Å. Moreover, the isolated octahedra, discrete binuclear clusters and bromide ions were bonded through weak O−H⋅⋅⋅O, O−H⋅⋅⋅N, O−H⋅⋅⋅Br and N−H⋅⋅⋅Br hydrogen bonds (Figure S7). As previously stated in the introduction, the presence of two hydrogen atoms at the terminal nitrogen atoms (1: N1, N2, N5, N6; 2: N1, N2, N7, N8, N9, N10) in 1 and 2 prove these to be amino nitrogen atoms. This indicates that in both 1 and 2 the cyanoguanidine ligand favors the cyanoimine form. In addition, 1 and 2 differ from compounds that were structurally characterized before such as Zn(C2N4H4)2Cl2 [1,2,3], [Ag(C2N4H4)2]F, [Ag(C2N4H4)2](BF4) [4], Cu(C2N4H4)2Br2·2H2O [5] and similar compounds [6,7,8,9]. In these earlier examples, the metal cations were coordinated by cyanoguanidine (cnge) and anions, whereas the cobalt cations in 1 and 2 were bonded to cnge and aqua ligands while the counter anions remained uncoordinated.
Compounds 1 and 2 are based on the same constituents but adopt different structures, in particular, with respect to their water content. The water capacity for 1 was 21.82%, much higher than for 2 with 9.78%. The reason is that compound 1 was synthesized in an aqueous solution, whereas compound 2 was obtained from methanol as a solvent. The presence of coordinated water in 2 presumably arose because the preparation was performed in ambient atmosphere and moisture was not excluded. The effects of solvent were obviously observed in the deviation of the coordination polyhedra from ideal octahedral symmetry. Notably, in 1, the bond lengths subtended a wider range (Co1–O2 = 2.180(2) Å, Co1–N4 = 2.087(2) Å) than in 2 (Co2–O4 = 2.136(5) Å, Co2–N13 = 2.072(6) Å).

3.2. UV−Vis and IR Optical Properties

The UV-Vis absorption spectra for compounds 1 and 2 were measured on a UV-2600 Shimadzu spectrophotometer. As shown in Figure 4a, both spectra displayed two well-resolved bands, one at 266 nm, which was attributed to the π⋅⋅⋅π* transitions of the cyanoguanidine ligand, and another one at 484 nm (1) and 505 nm (2) characteristic for d-d transitions in hexa-coordinate complexes [23,24], indicating that the ligands adopted an octahedral arrangement [31,32] around Co(II). In addition to that, Figure 4a reveals that the absorption peaks of 2 (505 nm) occured at a slightly higher wavelength than that in 1 (484 nm), coinciding with their divergent colors. Due to the presence of discrete binuclear clusters in 2, there were four peaks in the range of 640 to 740 nm, whereas no peaks were observed in 1.
The IR spectra of both compounds (Figure 4b) showed an appreciable hypochromatic shift of the nitrile group (Table S8), compared to the free cyanoguanidine ligand, because of the coordination to the cobalt atoms [33]. Moreover, the separations of υ(C≡N) vibrations (45 cm−1) were observed with a doublet character, which resulted from a Fermi resonance through the Sukhorukov and Finkel’shtein analyses [34,35]. The peaks at 1655 cm−1 (1) and 1637 cm−1 (2) were assigned to be υ(C=N) vibrations, while those at 3529 cm−1 and 3432 cm−1 were attributed to the υ(NH) vibrations [9,36,37].

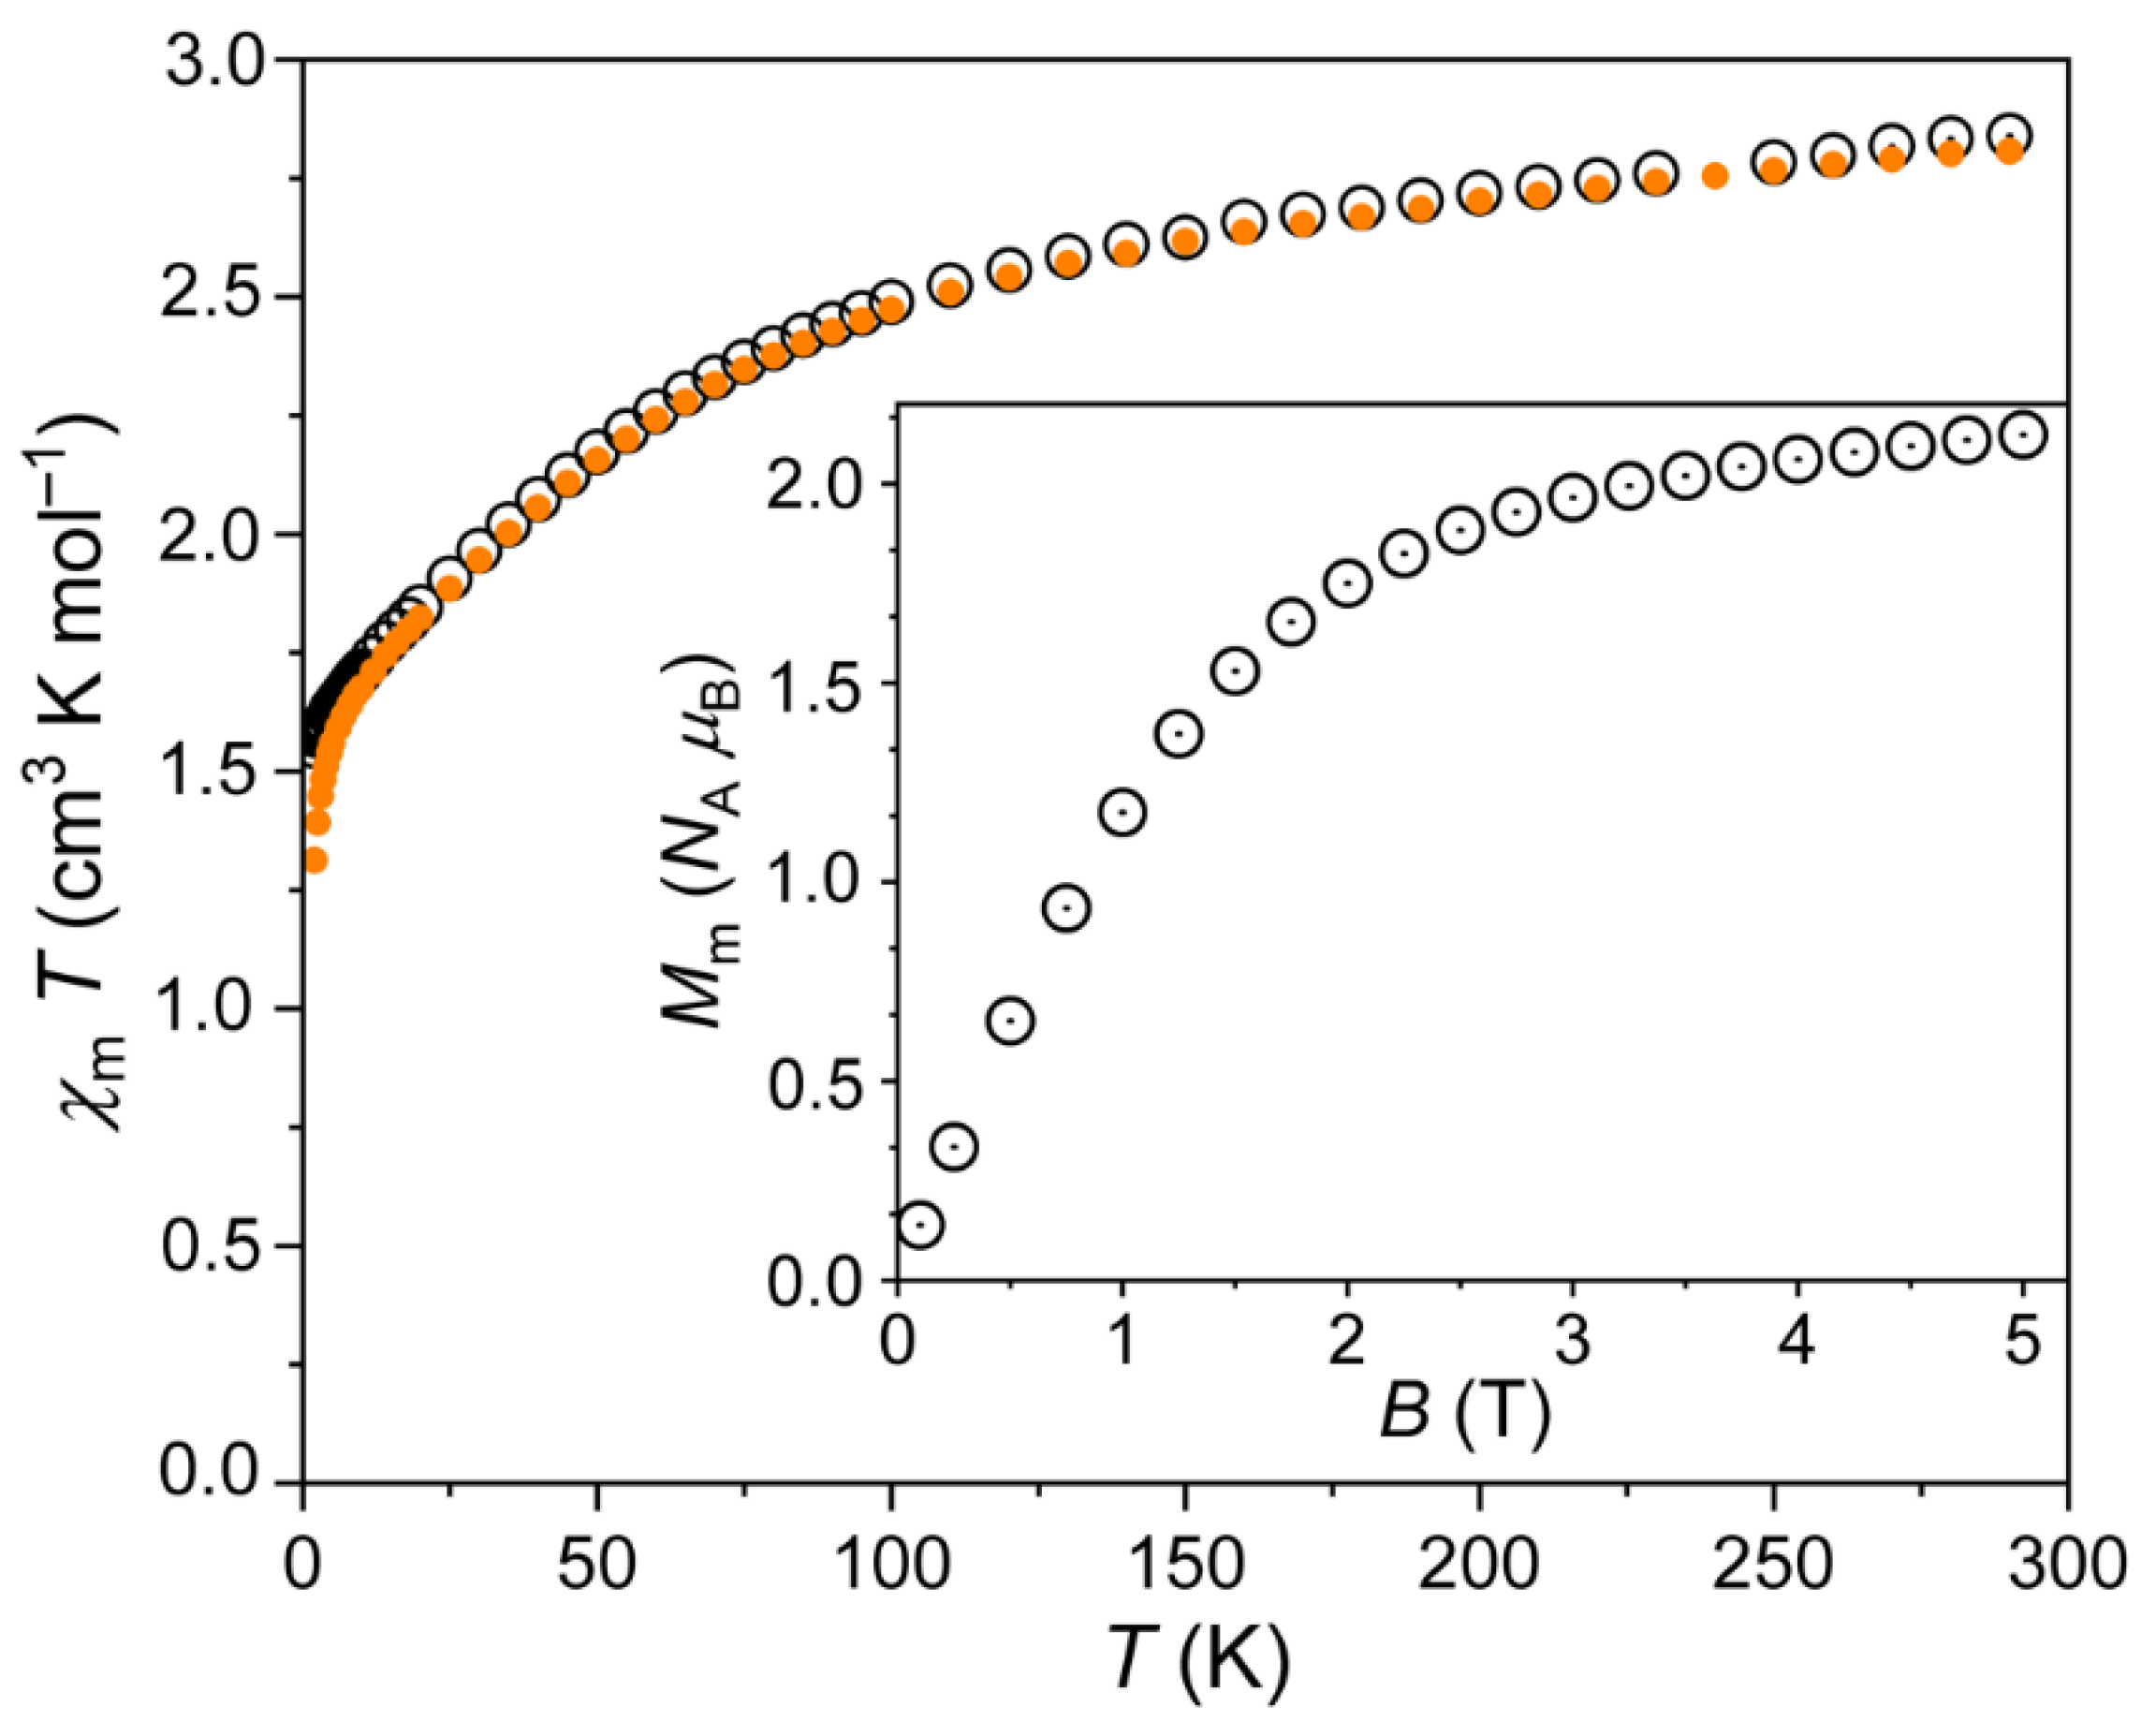
3.3. Magnetic Properties

The magnetic data of 1 are shown in Figure 5 as χmT vs. T and Mm vs. B plots. At 290 K, the χmT value was 2.84 cm−1 K mol−1 at 0.1 T, and slightly smaller (2.81 cm−1 K mol−1) at 1.0 T. These values were well within the range 2.3–3.4 cm−1 K mol−1 that is expected [38] for an isolated octahedral high-spin Co2+ center. Note that this range is above the spin-only value (1.876 cm−1 K mol−1) due to relevant contributions of the orbital momentum that is typical of octahedral 3d7 metal centers. Upon cooling the compound, the values continuously decreased, significantly falling off at values below 100 K. At 2.0 K, χmT = 1.55 cm−1 K mol−1 at 0.1 T, and 1.31 cm−1 K mol−1 at 1.0 T. The observation regarding the decreasing values, in particular below 100 K, was due to the thermal depopulation of the energy states that originate from the 4T1g ground term, which is accordingly split due to the combined effects of spin-orbit coupling, electron–electron inter-repulsion and the ligand field. In addition to the energy splitting, the corresponding energy states are usually considerably mixed with respect to the mJ eigenstates. Below 10 K, χmT data at 0.1 and 1.0 T diverged due to the Zeeman effect, which becomes a relevant contribution at larger fields. At 2.0 K, the molar magnetization Mm rapidly grew with increasing fields up to about 2 T, and subsequently slightly increased up to 2.1 NA μB at 5.0 T without reaching saturation (see inset in Figure 5). This value was also well below the saturation value of about 3.7 NA μB (estimated from the χmT value at 290 K) due to the mixed nature of the ground state. Besides the latter, the cobalt centers were characterized by a medium magnetic anisotropy. Such anisotropy resulted in smaller values in powder measurements, since the data represent the mean value over randomly oriented crystallites.
Therefore, the data are in agreement with either isolated or very weakly interacting Co2+ centers, and, thus, with the structural model.
For 2, the χmT vs. T and Mm vs. B plots are shown in Figure 6. At 290 K, the value of χmT was 8.51 cm−1 K mol−1 at 0.1 and 1.0 T. This was in agreement with the range 6.9–10.2 cm−1 K mol−1 expected [38] for three non-interacting octahedral high-spin Co2+ centers. Upon decreasing temperature, χmT continuously decreased. Below 100 K, the values distinctly decreased, and dropped off below 5 K. At 2.0 K, χmT was 4.94 cm−1 K mol−1 at 0.1 T, and 4.20 cm−1 K mol−1 at 1.0 T. The shape of the curve, in particular, below 100 K, was—as for 1—due to the thermal depopulation of the energy states originating from the 4T1g ground term. In addition to the Zeeman effect resulting in diverging χmT vs. T curves at 0.1 and 1.0 T below 10 K, the drop off observed below 5 K even at 0.1 T hints at antiferromagnetic exchange interactions. However, their magnitude was weak due to the rather small impact on the curves.
The molar magnetization Mm at 2.0 K rapidly increased with increasing field up to about 2 T (see inset in Figure 6). At higher fields, Mm increased with a distinctly smaller rate reaching at 5.0 T a value of 6.3 NA μB without being saturated. This value was well below the saturation value of about 11.1 NA μB (estimated from the χmT value at 290 K) due to the reasons mentioned in the discussion of 1.
Therefore, the data are in agreement with the structural information that shows in good approximation an isolated Co2+ center besides a dimeric unit of two Co2+ centers. In this unit, the two Co2+ ions were bridged by two oxygen atoms from water molecules forming Co–O–Co angles of 100.6° [39,40,41], which could explain the potential weak antiferromagnetic exchange interactions in terms of a superexchange model.

4. Conclusions

Two solvent-induced Co(II) cyanoguanidine bromides were synthesized and characterized. X-ray crystal structure determinations revealed different structural features, as 1 consisted of isolated octahedral units around Co with additional bromide anions and crystal water molecules whereas 2 contained both isolated octahedral units and discrete binuclear clusters. In the UV-vis absorption spectra, the absorption maximum of 2 (505 nm) was at lower energy than of 1 (484 nm), which was reflected in divergent crystal colors. The IR spectra displayed an appreciable hypochromatic shift of the C≡N nitrile groups because of the coordination to Co(II). Magnetic susceptibility measurements of 1 were consistent with the presence of isolated or very weakly interacting Co2+ centers, in accordance with the crystal structure, whereas 2 evidenced potential weak antiferromagnetic exchange interactions, which may have resulted due to superexchange between Co2+ centers via the bridging O in the binuclear clusters.
  • Synopsis Two solvent-induced Co(II) cyanoguanidine bromides (1 and 2) were synthesized in water and methanol, respectively. X-ray crystal structure, UV-vis absorption spectra and IR spectra analysis highlighted similarities and differences between these two compounds. Magnetic susceptibility measurements were consistent with the presence of cobalt(II) and evidence for weak antiferromagnetic interactions observed in 2.
  • TOC Figure
Crystals 12 01377 i001

Supplementary Materials

The following supporting information can be downloaded at: https://0-www-mdpi-com.brum.beds.ac.uk/article/10.3390/cryst12101377/s1, Figure S1: The bulk crystals of 1 and 2; Figure S2: Experimental and simulated powder X-ray diffraction patterns for 1; Figure S3: Same as before but for 2; Figure S4: TGA curve of 1; Figure S5: Same as before but for 2; Figure S6: Hydrogen-bonding interactions between O, N and Br atoms for 1; Figure S7: Same as before but for 2; Table S1: Thermal mass loss steps of 1; Table S2; Same as before but for 2; Table S3: Crystal data and structure refinement for 1 and 2; Table S4: Elemental CHN analysis for 1; Table S5: Bond lengths for 1; Table S6: Elemental CHN analysis for 2; Table S7: Bond lengths for 2; Table S8: IR bands of cyanoguanidine, 1 and 2.

Author Contributions

All authors contributed to this manuscript. Conceptualization, J.Z.; methodology, J.Z.; validation, J.Z.; formal analysis, J.Z., A.J.C., J.v.L. and U.E.; investigation, J.Z.; resources, R.D.; data curation, R.D., J.Z. and A.J.C.; writing—original draft preparation, J.Z. and J.v.L.; writing—review and editing, R.D., A.J.C. and J.Z.; visualization, J.Z. and A.J.C.; supervision, R.D.; project administration, R.D.; funding acquisition, R.D. All authors have read and agreed to the published version of the manuscript.

Funding

This research received funding from the China Scholarship Council.

Data Availability Statement

Not applicable.

Acknowledgments

We thank the China Scholarship Council for offering the stipend to Jing Zhang. We appreciate Tobias Storp collecting the single-crystal and powder X-ray diffraction data and Christina Houben measuring the magnetic susceptibility data. We thank Anne Frommelius for measuring the TGA data. Last but not least, we very much thank Simon Steinberg and Xiaoying Huang for help in the single-crystal structure analysis.

Conflicts of Interest

The authors declare no conflict of interest.

References

  1. Pickardt, J.; Kühn, B. Crystal structure of dichlorobis(cyanoguanidine)zinc(II), Zn(C2N4H4)2Cl2. Z. Kristallogr. Cryst. Mater. 1995, 210, 901. [Google Scholar] [CrossRef]
  2. Fowkes, A.; Harrison, W.T.A. A monoclinic polymorph of dichlorobis-(cyanoguanidine)zinc(II). Acta Cryst. E 2005, 61, m2021–m2022. [Google Scholar] [CrossRef]
  3. Ritche, L.K.; Harrison, W.T.A. catena-poly[[dichlorozinc(II)]-μ-cyanoguanidine]. Acta Cryst. E 2007, 63, m617–m618. [Google Scholar] [CrossRef]
  4. Bessler, K.E.; de Sousa, A.T.; Deflon, V.M.; Niquet, E. Silver complexes with cyanoguanidine: Preparation and crystal structures of [Ag(cgn)2]F and [Ag(cgn)2][BF4]. Z. Anorg. Allg. Chem. 2003, 629, 1091–1095. [Google Scholar] [CrossRef]
  5. Zhang, J.; Corkett, A.J.; van Leusen, J.; Nelson, R.; Dronskowski, R. Cu(C2N4H4)2Br2·2H2O: An antiferromagnetic cyanoguanidine coordination compound and its characterization. Z. Naturforsch. B 2022, 77, 411–417. [Google Scholar] [CrossRef]
  6. Dronskowski, R.; Liu, X.-H. Bis(cyanoguanidine)silver(I) nitrate–cyanoguanidine (1/1). Acta Cryst. C 2003, 59, m243–m245. [Google Scholar] [CrossRef] [PubMed]
  7. Qiao, X.; Corkett, A.J.; Luo, D.; Dronskowski, R. Silver cyanoguanidine nitrate hydrate: Ag(C2N4H4)NO3·1⁄2H2O, a cyanoguanidine compound coordinating by an inner nitrogen atom. Inorganics 2020, 8, 64. [Google Scholar] [CrossRef]
  8. Pickardt, J.; Kühn, B. Metallkomplexe mit Cyanoguanidin als Liganden: Kristallstrukturen von [Cd(cnge)2F2]·3H2O, Cd(cnge)2Br2 und Hg(cnge)Cl2 (enge = Cyanoguanidin). Z. Naturforsch. B 1996, 51, 1701–1706. [Google Scholar] [CrossRef]
  9. Irzoqi, A.A.; Salih, M.M. Synthesis and characterization complexes of Ni(II) that contain cyanoguanidine and phosphines Ligands. Tikrit J. Pure Sci. 2018, 23, 93–101. [Google Scholar] [CrossRef]
  10. Beilstein, F.; Geuther, A. Ueber das Natriumamid. Liebigs Ann. Chem. 1858, 108, 88–102. [Google Scholar] [CrossRef]
  11. Barrio, J.; Volokh, M.; Shalom, M. Polymeric carbon nitrides and related metal-free materials for energy and environmental applications. J. Mater. Chem. A 2020, 8, 11075–11116. [Google Scholar] [CrossRef]
  12. Williams, P.A.; Ferrer, E.G.; Baeza, N.; Piro, O.E.; Castellano, E.E.; Baran, E.J. Transition metal promoted addition of methanol to cyanoguanidine. Molecular structure and properties of the generated Copper (II) and Nickel (II) complexes. Z. Anorg. Allg. Chem. 2005, 631, 1502–1506. [Google Scholar] [CrossRef]
  13. Kose, M.; Duman, S.E.; McKee, V.; Akyol, I.; Kurtoglu, M. Hydrogen bond directed 1D to 3D structures of square-planar Ni(II) complexes and their antimicrobial studies. Inorg. Chim. Acta 2017, 462, 281–288. [Google Scholar] [CrossRef]
  14. Bamberger, E.E. Ueber Dicyandiamid(I). Ber. Dtsch. Chem. Ges. 1883, 16, 1074–1078. [Google Scholar] [CrossRef]
  15. Pohl, F. Zur Kenntnis des Dicyandiamids. J. Prakt. Chem. 1908, 77, 533–548. [Google Scholar] [CrossRef]
  16. Bourosh, P.; Bologa, O.; Deseatnic-Ciloci, A.; Tiurina, J.; Bulhac, I. Synthesis, structure, and biological properties of mixed cobalt (III) dioximates with guanidine derivatives. Russ. J. Coord. Chem. 2017, 43, 591–599. [Google Scholar] [CrossRef]
  17. Aremu, J.A.; Durosinmi, L.M.; Oluyemi, E.A.; Ojo, I.A.O. Synthesis and Characterization of Guanidine derivatives of Benzothiazole and their Cobalt(II), Nickel(II), Zinc(II), Copper(II) and Iron(II) Complexes. IOSR J. Appl. Chem. 2018, 11, 53–71. [Google Scholar]
  18. Uzǎrević, K.; Halasz, I.; Frisčǐc, T. Real-time and in situ monitoring of mechanochemical reactions: A new playground for all chemists. J. Phys. Chem. Lett. 2015, 6, 4129–4140. [Google Scholar] [CrossRef]
  19. Desiraju, G.R. Crystal gazing: Structure prediction and polymorphism. Science 1997, 278, 404–405. [Google Scholar] [CrossRef]
  20. Nimax, P.R.; Reimann, D.; Sünkel, K. Solvent effects on the crystal structure of silver pentacyanocyclopentadienide: Supramolecular isomerism and solvent coordination. Dalton Trans. 2018, 47, 8476–8482. [Google Scholar] [CrossRef] [PubMed]
  21. Dong, W.K.; He, X.N.; Yan, H.B.; Lv, Z.W.; Chen, X.; Zhao, C.Y.; Tang, X.L. Synthesis, structural characterization and solvent effect of copper(II) complexes with a variational multidentate Salen-type ligand with bisoxime groups. Polyhedron 2009, 28, 1419–1428. [Google Scholar] [CrossRef]
  22. Bi, W.Y.; Lü, X.Q.; Chai, W.L.; Jin, W.J.; Song, J.R.; Wong, W.K. Synthesis, structure and near-infrared (NIR) luminescence of three solvent-induced pseudo-polymorphic complexes from a bimetallic Zn–Nd Schiff-base molecular unit. Inorg. Chem. Commun. 2008, 11, 1316–1319. [Google Scholar] [CrossRef]
  23. Hchicha, K.; Korb, M.; Kliuikov, A.; Čižmár, E.; Naïli, H. A cobalt(II)-based semiconductor complex with two-channel slow magnetic relaxation. J. Magn. Magn. Mater. 2021, 536, 168140. [Google Scholar] [CrossRef]
  24. Brader, M.L.; Kaarsholm, N.C.; Harnung, S.E.; Dunn, M.F. Ligand perturbation effects on a pseudotetrahedral Co(II)(His)3-Ligand Site: A Magnetic circular dichroism study of the Co(II)-substituted insulin hexamer. J. Biol. Chem. 1997, 272, 1088–1094. [Google Scholar] [CrossRef] [PubMed]
  25. Rueff, J.M.; Masciocchi, N.; Rabu, P.; Sironi, A.; Skoulios, A. Structure and magnetism of a polycrystalline transition metal soap− CoII[OOC (CH2)10COO](H2O)2. Eur. J. Inorg. Chem. 2001, 11, 2843–2848. [Google Scholar] [CrossRef]
  26. Baker, W.A., Jr.; Daniels, M. Dicyandiamide-copper (II) complexes and the metal ion catalysed addition of alcohols to a nitrile. J. Inorg. Nucl. Chem. 1963, 25, 1194–1196. [Google Scholar] [CrossRef]
  27. Quinzani, O.V.; Tarulli, S.; Marcos, C.; Granda, S.G.; Baran, E.J. Crystal structure, spectroscopic and thermal behaviour of bis (saccharinato) tetrakis (pyridine) nickel (II) dipyridine. Z. Anorg. Allg. Chem. 1999, 625, 1848–1852. [Google Scholar] [CrossRef]
  28. Sawinski, P.K.; Meven, M.; Englert, U.; Dronskowski, R. Single-Crystal Neutron Diffraction Study on Guanidine, CN3H5. Cryst. Growth Des. 2013, 13, 1730–1735. [Google Scholar] [CrossRef]
  29. Ceccarelli, C.; Jeffrey, G.A.; Taylor, R. A survey of OH⋯O hydrogen bond geometries determined by neutron diffraction. J. Mol. Struct. 1981, 70, 255–271. [Google Scholar] [CrossRef]
  30. Gašparovič, L.; Koreňová, Z.; Jelemenský, Ľ. Kinetic study of wood chips decomposition by TGA. Chem. Pap. 2010, 64, 174–181. [Google Scholar] [CrossRef]
  31. Lever, A.B.P. Inorganic Electronic Spectroscopy. In Studies in Physical and Theoretical Chemistry, 2nd ed.; Elsevier: New York, NY, USA, 1984; Volume 33, pp. 480–490. [Google Scholar]
  32. Papadopoulos, C.; Cristóvão, B.; Ferenc, W.; Hatzidimitriou, A.; Ciprioti, S.V.; Risoluti, R.; Lalia-Kantouri, M. Thermoanalytical, magnetic and structural investigation of neutral Co(II) complexes with 2,20-dipyridylamine and salicylaldehydes. J. Therm. Anal. Calorim. 2016, 123, 717–729. [Google Scholar] [CrossRef]
  33. Witschard, G.; Griffin, C.E. Infrared absorption characteristics of alkyl and aryl substituted phosphonium salts. Spectrochim. Acta 1963, 19, 1905–1910. [Google Scholar] [CrossRef]
  34. Sukhorukov, B.I.; Finkel’shtein, A.I. Optical Investigation of the Molecular Structure of Cyanamide and its Derivatives. 1. The Molecular Structure of Dicyandiamide. Opt. Spektrosk. 1959, 6, 637–641. [Google Scholar]
  35. Sheludyakova, L.A.; Sobolev, E.V.; Kozhevina, L.I. Concerning the nature of the doublet at 2200 cm−1 in the vibrational spectra of cyanoguanidine. J. Appl. Spectrosc. 1991, 55, 661–665. [Google Scholar] [CrossRef]
  36. Nakamoto, K. Infrared Spectra of Inorganic and Coordination Compounds; Wiley: New York, NY, USA, 1963. [Google Scholar]
  37. Begley, M.J.; Hubberstey, P.; Walton, P.H. Bis(μ-2-cyanoguanidine)-bis ((2-cyanoguanidine) copper (I)), a planar dimeric cation containing co-ordinatively unsaturated copper (I). J. Chem. Soc. Dalton Trans. 1995, 6, 957–962. [Google Scholar] [CrossRef]
  38. Lueken, H.; Magnetochemie, B. Teubner Stuttgart. Leipzig 1999. [Google Scholar] [CrossRef]
  39. Kanamori, J. Superexchange interaction and symmetry properties of electron orbitals. J. Phys. Chem. Solids 1959, 10, 87–98. [Google Scholar] [CrossRef]
  40. van Leeuwen, G.C.M. Investigation of the angular dependency of Co-O-Co superexchange by means of magnetic susceptibility measurements in dilute systems. Rec. Trav. Chim. Pays-Bas 1973, 92, 1249–1266. [Google Scholar] [CrossRef]
  41. Weihe, H.; Güdel, H.U. Angular and distance dependence of the magnetic properties of oxo-bridged iron (III) dimers. JACS 1997, 119, 6539–6543. [Google Scholar] [CrossRef]
Figure 1. The two forms of cyanoguanidine with the cyano group at (a) imine (cyanoimine) nitrogen and (b) amine (cyanoamine) nitrogen.
Crystals 12 01377 g001
Figure 2. Crystal structure of 1 with Co in rose-red, O in red, N in green, C in black and H in white.
Crystals 12 01377 g002
Figure 3. Crystal structure of 2 with Co in rose-red, O in red, N in green, C in black and H in white.
Crystals 12 01377 g003
Figure 4. (a) Diffuse powder reflectance spectra for 1 (ochre line) and 2 (blue line); (b) IR spectrum of free cyanoguanidine (red line), 1 (ochre line) and 2 (blue line).
Crystals 12 01377 g004
Figure 5. Temperature dependence of χmT of 1 at 0.1 (open circles) and 1.0 T (full circles); inset: molar magnetization Mm vs. applied magnetic field B at 2.0 K.
Crystals 12 01377 g005
Figure 6. Same as before but for 2.
Crystals 12 01377 g006
Publisher’s Note: MDPI stays neutral with regard to jurisdictional claims in published maps and institutional affiliations.

