Article

Effects of a Water-Glass Module on Compressive Strength, Size Effect and Stress–Strain Behavior of Geopolymer Recycled Aggregate Concrete

1
School of Materials Science and Engineering, Shenyang Jianzhu University, Shenyang 100168, China
2
State Key Laboratory of Silicate Materials for Architectures, Wuhan University of Technology, Wuhan 430200, China
*
Authors to whom correspondence should be addressed.
Submission received: 23 December 2021 / Revised: 26 January 2022 / Accepted: 28 January 2022 / Published: 1 February 2022
(This article belongs to the Special Issue Advances in Recycled Aggregate Concrete)

Abstract

:
Geopolymer recycled aggregate concrete (GRAC) was prepared by replacing cement with geopolymer and natural aggregate with waste concrete. The effect of the water-glass module on the mechanical properties of GRAC was studied. It was found that water-glass has a double-layer structure. The low module water-glass leads to a thicker diffusion layer and more Na+ and OH in the solution, which activates more CaO, SiO2, and Al2O3 in the raw material, and improves the strength of GRAC. Moreover, two kinds of gel structures, namely layered C-A-S-H (calcium silicate hydrate) and networked N-A-S-H (zeolite), were found in the products of geopolymer. As the water-glass module changed, the phase of zeolite changed significantly, whereas the calcium silicate hydrate did not change, indicating that the decrease in the water-glass module contributes to the formation of more N-A-S-H gel. The compressive strengths of GRAC with the sizes of 200, 150, and 100 mm3 were in line with Bazant’s size effect theoretical curve. Through the segmented fitting method, the relationship of the size conversion coefficient of GRAC (α), the critical strength (fcr), the critical dimension (Dcr), and the water-glass module (ε) were determined. It was found that ε = 1.5 is the segmented point of the three equations. The elastic modulus and peak stress of GRAC are inversely proportional to the water-glass module, and the peak strain is proportional to the water-glass module, indicating that by reducing the water-glass module, the strength of GRAC can be improved, but the brittleness is increased. The constitutive equation of GRAC with only the water-glass module as a variable was also established. It was found that the polynomial mathematical model and rational fraction mathematical model are optimal for the rising-stage and falling-stage, respectively, and the relationship between the parameters of the rising-stage (a) and the falling-stage (b), and the water-glass module, is given.

1. Introduction

The concept of the geopolymer was proposed by French materials scientist Joseph Davidovits [1]. It is thought to be the ideal substitute for cement because its raw materials are mainly industrial by-products and residues, such as granulated blast furnace slag [2,3], steel slag [4,5], fly ash [6,7,8], incinerated ash of municipal solid waste [9,10,11], silica fume [12,13], and red mud [14,15,16]. The nature and properties of geopolymer have been widely studied. Deventer found that ions having chemical activity in the raw material, such as Si4+ and Al3+, can be dissolved in an alkaline environment. Monomers, such as [SiO4] and [AlO4], were generated in the solution and joined together, forming a three-dimensional network structure. Provis [17] proposed that geopolymer can be divided into two systems according to the different structures of its geopolymerization product, which are the C-A-S-H system (containing CaO) and the N-A-S-H system (no or low contained CaO). The common alkali-activators of geopolymer were sodium hydroxide [18,19], potassium hydroxide [20], and water-glass [21]. Among these, sodium hydroxide plus a water-glass solution was thought to be the best alkali activator for the mechanical property of geopolymer, for which activation was higher than the others [22,23]. Current research shows that the water-glass module is the critical factor that generates high strength [24,25].
Geopolymer recycled aggregate concrete (GRAC) was prepared by replacing cement with geopolymer and natural aggregate with demolished concrete. GRAC does not consume natural resources and also reuses industrial wastes, including waste concrete. It is a new type of green building material. Compared with the compressive behavior of geopolymer recycled concrete and cement recycled concrete, Zhang found [26] that geopolymer recycled concrete possesses higher compressive strength than cement recycled concrete under the same experimental conditions, due to the strengthening effect of fresh geopolymer binding material. Moreover, a modified method for predicting the compressive strength of geopolymer recycled concrete cubic and cylindrical specimens was proposed. Avinash Ojha [27] focused on the impact of recycled aggregates on mechanical properties of fly ash-based geopolymer concrete and found that the compressive strength and splitting strength of geopolymer recycled aggregate concrete are well within the permissible range. When studying the effects of recycled aggregates in geopolymer pervious concrete, Anandh Babu Malayali [28] found the mechanical and durability properties were reduced due to the incorporation of recycled concrete in geopolymer concrete; at the same time, the reduction always lies within the acceptable ranges of the Indian standards. P. Saravanakumar [29] studied the engineering and durability properties of fly ash-based geopolymer recycled aggregate concrete; the results indicated that GRAC has a longer set time than ordinary recycled aggregate concrete, and exhibits better strength and durability performance than ordinary recycled aggregate concrete. This was explained by micro-structure analysis, which showed that the geopolymerization products of geopolymer filled the void space in the binding material. However, the research of alkali activators on GRAC has been rarely reported, particularly regarding the effect of water-glass modules on the geopolymerization product of GRAC and the relationship between the various mechanical properties of GRAC and different water-glass modules. Therefore, in this paper, diverse properties, such as compressive strength, size effect, peak strain, peak stress, elastic modulus, and stress–strain behavior of GRAC, on the water-glass module were studied. Its constitutive equation was also established, thus providing the theoretical basis and data support for the engineering application of GRAC.

2. Materials and Methods

2.1. Materials

Blast furnace slag (BFS) from Angang, China, and fly ash from Benxi, China, were used in this study; their chemical composition is detailed in Table 1. Their specific surface area measured by N2 sorption using the Brunauer–Emmett–Teller (BET) method are 427 and 2478 m2/kg, respectively. Water-glass with a module of 3.3, Baume degree of 40, and composition of 7.9% Na2O, 26.2% SiO2, and 66% H2O by mass were supplied by Shikoku Chemical Corporation. Sodium hydroxide was used as laboratory reagents, including 98% pure NaOH pellets supplied by Techcomp Chemical Reagent Co. Ltd. Water-glass modules have SiO2/Na2O mole ratios. The original ratio of water-glass modules when it purchased was 3.3. The water-glass module can be adjusted by altering NaOH particles in water-glass solution; for 1 g water-glass, the quantities of added NaOH (x) and water-glass modules (y) conform to Equation (1). Seven different modules of water-glass were prepared according to Equation (1), which are 0.6, 0.9, 1.2, 1.5, 1.8, 2.1, and 2.4.
y = 26.1 / 60 7.96 / 62 + x / 80
Natural river sand was used as fine aggregates, fineness modules 2.7, mud content <2%, apparent density 2615 kg·m−3. Recycled concrete from the structural laboratory of Shenyang Jianzhu University, original strength grade C40, was used as coarse aggregate (recycled aggregate). The recycled aggregate was crushed by a manual and jaw crusher, cleaned, and sieved, with a maximum particle size 25 mm, and conforming to GB/T 25177-2010 [30] and Pebble and GB/T 14685-2011 [31]. The properties of recycled aggregate are shown in Table 2. Figure 1 shows the grading curves of aggregates.

2.2. Mixture Proportion and Preparation Process

Mix proportion: This research mainly focused on the influence of the water-glass module on the mechanical properties of GRAC, so the water-glass module was selected as the test variable, and other test parameters were constant. The optimum values for the other test parameters were adopted from the preliminary research [32], of which the sand coarse aggregate ratio was 0.38, the liquid-to-binder ratio was 0.4, water-glass accounted for 30% of the total mass of the liquid, and slag accounted for 70% of the total mass of the cementitious material. The mixed proportion of GRAC with the different water-glass modules are shown in Table 3.
Preparation method: First, the water-glass was adjusted by adding NaOH particles according to Equation (1). It was required that the water-glass solution that was adjusted was stood for 20 min because it released heat when the NaOH particles dissolved in the water-glass solution. During these 20 min, the solution was continually stirred to ensure the NaOH particles were dissolved completely. As the water-glass solution cooled, slag, fly ash, and sand were poured into a concrete mixing pot and slowly stirred for 2 min to make it evenly mixed. Then, water was poured into the mixing pot and stirred for 5 min to make the full material pre-wet. The water-glass solution, which was already cooled, was slowly added to the mixture and quickly stirred for 3 min to obtain the geopolymer mortar slurry. Finally, the recycled aggregate was poured into the geopolymer mortar slurry, and the mixing operation was slowly stirred for 2 min and quickly stirred for 3 min; then the fresh GRAC mixture was prepared. The fresh GRAC mixture was quickly placed into a mold and vibrated for 60 s on a vibrating machine. Plastic wrap was used to seal the surface of the GRAC mixture, by which water was kept inside the GRAC mixture. Finally, GRAC mixture with its mold was moved into a standard curing room, of which the relative temperature was 20 ± 2 °C and the relative humidity was 95%.

2.3. Test Method

Compressive strength: Compressive strength of GRAC at 3, 7, and 28 d were tested; six samples were tested for each age, the final value was the average value.
  • 150 mm3 cube molds were used.
  • For each mix proportion, nine samples were prepared.
  • One hundred twenty-six samples were prepared (7 water-glass modules, 18 samples for each).
Size effect: Compressive strength at 28 d was measured; the final value was the average value for the six samples.
  • Three different size molds were used (100, 150, and 200 mm3).
  • For each mixed proportion, six samples were prepared.
  • Ninety samples all together were prepared (5 water-glass modules, six samples for each).
Stress–strain curve: The stress–strain curve was obtained by averaging the three individual stress–strain curves when the curing age was 28 d and the loading speed was 0.01mm/min.
  • A prism mold with the size 150 mm × 150 mm × 300 mm was used in this test.
  • For each mix proportion, three samples were made.
Micro characterization:
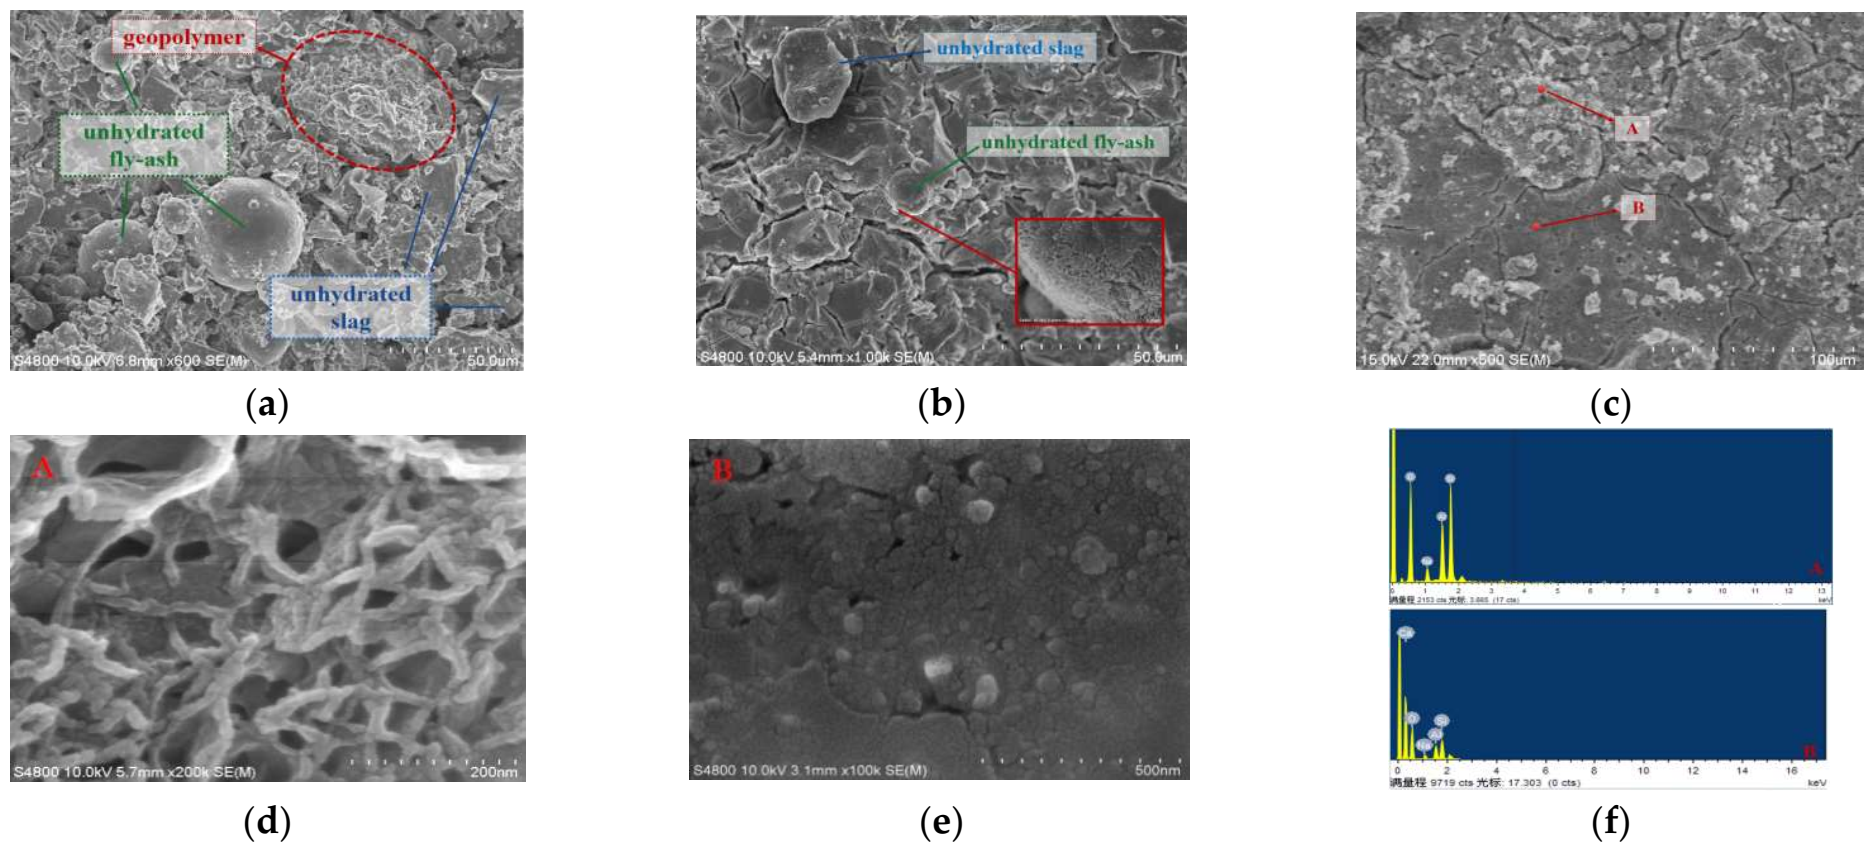
  • The morphology and microstructure of GRAC were observed with Scanning Electron Microscopy (SEM, S-4800, Hitachi, Japan).
  • The chemical element composition and distribution of GRAC was analyzed with an Energy Spectrometer (EDS, X-Max N, Horiba, Japan).
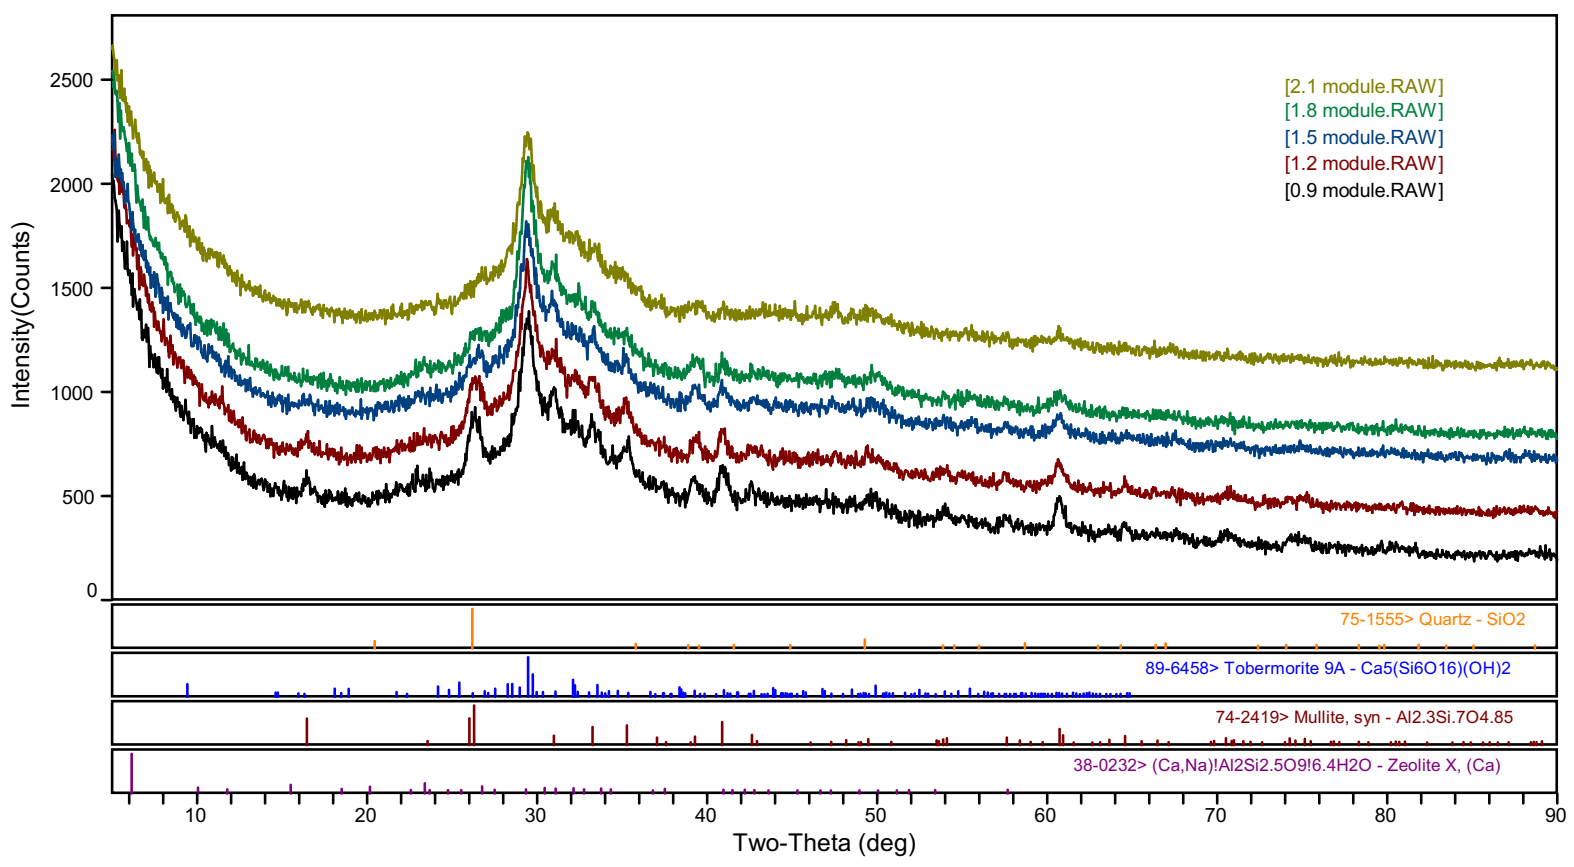
  • X-ray diffraction analysis was performed by an X-ray diffractometer (XRD,7000, Shimadzu, Japan) to analyze the composition and structure of geopolymerization products.

3. Results

3.1. Water-Glass Structure and Its Influence on Compressive Strength of GRAC

Water-glass is a kind of silicate gel that can dissolve in water. Its internal structure is are described in [33]: the core is an amorphous spherical silica glue-ball (mSiO2), and there are a large number of silicate anions such as H2SiO42− and H3SiO4 adsorbed on its surface. The outer layer is called the dense layer, in which there is a mass of sodium (zNa+). The outermost layer is called the diffusion layer, and hydroxyl ions ((y-z)OH) occupy this layer. The double-layer structure of water-glass is shown in Figure 2.
It was found that the loss of water can cause the hardening of the water-glass solution [34]. This is because as the water content decreases, the thickness of the diffusion layer is thinner, and the concentration of OH is lowered. Therefore, to achieve electrical charge balance, Na+ in the dense layer is compressed onto the silica cores’ surface and reacts with the silicate anions. The changes in structure and electrovalence of the silica cores lead to an unstable state of water-glass solution; the colloidal particles in the solution lose their stability and condense to a gel state [34]. During the mixing process of GRAC, water was quickly absorbed by the powder materials (slag and fly ash) and recycled aggregates (mainly the old cement mortar phase), which led the water-glass to first solidify, forming a gelatinous siliceous and aluminiferous framework, which is also called the precursor [35]. Furthermore, slag and fly ash were activated in the alkaline solution and released abundant monomers, such as [SiO4] and [AlO4]; these monomers were very quickly combined with the precursors. As the reaction continued, the frameworks grew gradually and were connected. Finally, a complete three-dimensional network framework was formed. It can be deduced that the mechanical properties of GRAC are directly affected by the quantities and qualities of precursors formed in the water-glass solution.
The influence of the water-glass module on the compressive strength of GRAC is shown in Figure 3. It can be seen that the compressive strength of GRAC is inversely proportional to the water-glass module in the range of 0.9 to 2.1.
The change in the water-glass module is essentially a change in the electric double-layer structure in the water-glass [33]. As can be seen from Equation (1), NaOH content is proportional to the water-glass module; that is, as NaOH content is high, the water-glass module is low, and the diffusion layer is thick. Therefore, there are more dissociative Na+ and OH in the solution. According to Purdon’s “alkali activation” theory [36] and Davidovits’s “depolymerization-condensation” theory [37], Ca, Si, and Al ions in the raw materials can be activated by OH and Na+ in an alkaline environment, among which Si ions and Al ions form [SiO4] monomers and [AlO4] monomers, that is, the depolymerization stage. As the concentration of the monomers reaches saturation, these monomers agglomerate together and converge on the precursor, forming geopolymerization products, that is, the condensation stage. Ca ions also react with free Si ions forming the hydrated calcium silicate gel. According to Provis’s research, geopolymer can be divided into two branches, shown in Figure 4: one is the zeolite structure modified by ionic substitutions wholly or largely composed of silicon and aluminum with a three-dimensional network structure (N-A-S-H, Figure 4a); the other is a layered calcium silicate hydrate structure modified in composition and crystal structure by ionic substitutions mainly formed by calcium and silicon (C-A-S-H, Figure 4b) [38]. It also can be seen from Figure 3 that, as the water-glass module is too high (n = 2.4), the electric double-layer structure of water-glass is very thin, and there is not enough Na+ and OH to activate the mineral raw materials; thus, it does not condense and has no strength. However, as the water-glass module is very low (n = 0.6), the condensation reaction occurs in advance, flashing occurs, the strength is extremely low, and there is GRAC lacks strength. When the water-glass module is gradually reduced from 2.1 to 0.9, the compressive strength of the GRAC gradually increases. This is because, as the water-glass module decreases, the concentration of hydroxide and sodium ions in the system gradually increases. As a result, more Ca, Si, and Al ions are activated in the system, generating more N-A-S-H and C-A-S-H gel, leading to compact and complete geopolymerization products. Thus, the strength of GRAC gradually increases.
Figure 5 presents the XRD patterns of geopolymer cementing materials with different water-glass modules (0.9, 1.2, 1.5, 1.8, and 2.1). The main geopolymerization products are Ca5(Si6O16)(OH)2 (calcium silicate hydrate) and (Ca, Na)Al2Si2.5O9 6.4H2O (calcium zeolite). Mullite and quartz are from the raw material. This indicates there are two products that differ in the structure that existed in geopolymer, thus matching Provis’ theory. Incorporating Provis’s theory, calcium silicate hydrate and zeolite are considered as a layered structure (C-A-S-H) and a network structure (N-A-S-H). As the water-glass module changes, the phase of zeolite in the geopolymer changes significantly, whereas the calcium silicate hydrate does not change, indicating that the strength of the geopolymer mainly depends on the N-A-S-H gel phase as the water-glass module changes. Moreover, the N-A-S-H gel content increases with the decrease in the water-glass modules. The higher the N-A-S-H gel content, the more complete the geopolymer network structure and the higher the overall strength of geopolymer.
Figure 6 shows the SEM images of GRAC when the water-glass modules are 2.1, 1.5, and 0.9, respectively. It can be seen from Figure 6a (n = 2.4) that there are a large number of unreacted or partially reacted spherical fly ash particles and blocky slag particles, and only a small amount of geopolymerization products. The overall structure is loose and porous. The diffusion layer of water-glass is very thin under a high module. As a result, the content of free Na+ and OH is low, which can only activate a small quantity of Ca2+, Si4+, and Al3+ on the surface of mineral raw materials. Therefore, the few geopolymerization products formed by the condensation stage result in the binding material of GRAC having a loose structure and a low mechanical strength.
When the water-glass module is 1.5, as shown in Figure 6b, it was found that the raw materials that did not participate in the reaction are greatly reduced, forming a relatively dense geopolymer geopolymerization product phase. Furthermore, a network structure is formed on the surface of the fly ash particles (detail view in the red box in Figure 6b). This indicates that more raw materials are decomposed and form geopolymer geopolymerization products due to the increase in the electric double-layer structure of water-glass, which strengthens the mechanical properties of GRAC.
With the reduction in the water-glass module to 0.9, shown in Figure 6c, it can be seen that there are no unreacted or partially reacted raw material particles on the surface of GRAC. Instead, the entire surface is filled with geopolymer geopolymerization products, and the porosity is significantly reduced. As a result, GRAC has high compressive strength. It is worth noting that not all geopolymers have the same morphology; there are two kinds of gels that differ in morphology and structure observed in Figure 6c, such as at points A and B. The enlarged detailed SEM pictures of points A and B are shown in Figure 6d,e; Figure 6f is the energy dispersive spectroscopy (EDS) analysis of point A and point B. Through EDS analysis (Figure 6f), point A is composed of Si, Al, O, and Na elements, and point B is Ca, Si, Al, O, and Na. That shows the geopolymerization product at point A is different from that at point B in chemical composition: the geopolymerization product at point A contains the Ca element, whereas point B does not. In Figure 6d (point A, magnification is 200,000 times), it is shown that the geopolymerization product is a network-like structure, which is similar to Provis’s N-A-S-H structure (Figure 4a). The structure of the geopolymerization product in point B (Figure 6e, magnification is 100,000 times) is very dense and completely different from that of point A. Combining EDS and XRD analysis, a layered calcium silicate hydrate structure is modified in composition by ionic substitutions mainly formed by calcium and silicon, which is consistent with Provis’s C-A-S-H structure (Figure 4b). Therefore, it can be concluded that there are different gel structures in the geopolymer geopolymerization product, i.e., layered C-A-S-H gel containing calcium and network-like N-A-S-H gel containing no calcium; the two gels intertwine with each other and contribute to the mechanical property of GRAC together.

3.2. Influence of Water-Glass Modules on Compressive Strength Standard Deviation

The binding material and the coarse aggregate of the GRAC are industrial waste and waste concrete, and their performance is not as stable as that of cement and natural aggregate, which leads to an increase in the discreteness of the strength of the GRAC. The compressive strength standard deviation (σ) from different sizes and water-glass modules of GRAC is shown in Figure 7.
According to the current Chinese national standard “Concrete Strength Inspection and Evaluation Standard” GB/T 50107-2010 [39], for concrete with a strength level of C20 or higher, σ ≤ 3.5 is excellent, 3.5 ≤ σ ≤ 5 is general, and σ > 5 is poor; for concrete with a strength class below C20, σ ≤ 3 is excellent, 3 ≤ σ ≤ 4 is general, and σ > 5 is poor. The compressive strength standard deviation of GRAC gradually increases with the decreasing water-glass modules, as shown in Figure 7. When the water-glass module is 0.9 to 1.5, the compressive strength of GRAC is greater than 20 MPa. In this range, the σ of the 200 mm3 specimen is far less than 3.5. σ of the 150 mm3 specimen is slightly less than 3.5, and the average value is 3.2; σ of the 100 mm3 specimen is in the range of 4–5. This means that the larger the size, the smaller the compressive strength standard deviation of GRAC; furthermore, the compressive strength standard deviation of GRAC is excellent only when the side length of the cube specimen is not less than 200 mm3. When the size is 150 mm3, the compressive strength standard deviation is general, and it still can be used; when the size is 100 mm3 or below, GRAC cannot be used in actual projects due to its poor compressive strength standard deviation. When the water-glass module is in the range of 1.2 to 2.4, the compressive strength standard deviation gradually decreases. There is no data set containing values greater than 5, indicating that within this strength range, GRAC can be used.

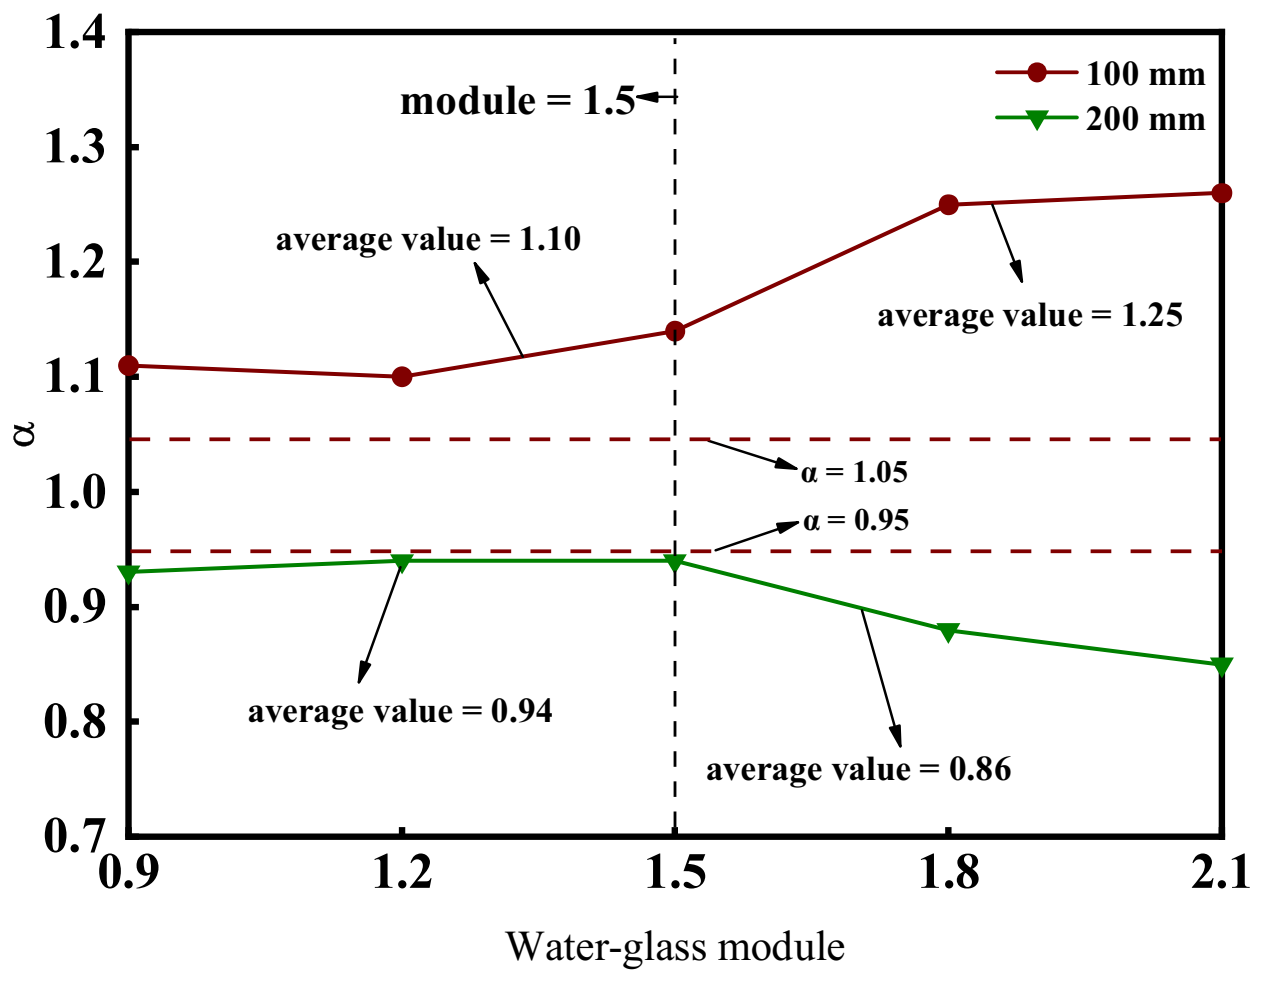
3.3. Influence of Water-Glass Modules on Size Conversion Factor of GRAC

The influence of the water-glass module on the compressive strength of GRAC with different sizes (100, 150, and 200 mm3) is shown in Figure 8. The general rule is that the cube size is inversely proportional to compressive strength, which is fcu,100 > fcu,150 > fcu,200 (where fcu,100, fcu,150, fcu,200 represent the compressive strength values of cube specimens with the sizes of 100, 150, and 200 mm3 respectively). The average strength of cube specimens with dimensions of 150 and 200 mm3 is 12.7% and 18.2% lower, respectively, than that of 100 mm3 cube specimens. This may be attributed to the selected recycled aggregates having original cracks during the breaking processing. Hence, larger specimens require more recycled aggregates, and there are more original cracks inside, resulting in reduced compressive strength [40].
According to the current Chinese national standard “Standard for Test Methods for Mechanical Properties of Ordinary Concrete” GB/T 50081-2002, the standard specimen refers to a cube specimen with the size of 150 mm3, and the size conversion factor (α) of other non-standard specimens is as shown in Equations (2) and (3):
α 100 = f c u , 150 / f c u , 100
α 200 = f c u , 150 / f c u , 200
The influence of the water-glass module on the size conversion factor of GRAC is given in Figure 9. GB/T 50081 stipulates the size conversion factor of a 200 mm cube specimen is 1.05, and the size conversion factor of a 100 mm cube is 0.95 for ordinary Portland cement concrete (OPCC), as shown by the horizontal dashed line in Figure 9. There are no data for GRAC between 0.95 and 1.05, which indicates that the OPCC standard does not apply to the size conversion factor of GRAC. This is attributed to the fact that the nature of geopolymer is different from that of cement, and the properties of recycled aggregate are also different from those of the natural aggregate. It also can be seen from Figure 9 that when the water-glass module is in the range of 0.9–1.5, the size conversion factors change relatively smoothly. On the contrary, they change drastically in the range of 1.5–2.1. Therefore, in this research, the segmentation method was adopted to calculate the size conversion factor of GRAC. The segment point selects the water-glass module = 1.5. The water glass modules (ε) and the size conversion coefficient (α) are linearly fitted, and the result is:
0.6 ≤ ε < 1.5, α200 = 0.79063 + 0.23305 × ε (R2 = 0.9564), α100 = 1.0293 + 0.0737 × ε (R2 = 0.8886);
1.5 ≤ ε < 2.4, α200 = 0.845−0.0833 × ε (R2 = 0.9740), α100 = 1.22951 − 0.19296 × ε (R2 = 0.9699).

3.4. Bazant Size Effect Fitting for GRAC

GRAC is a typical quasi-brittle material. The strain energy released by crack propagation under load leads to the size effect. According to Bazant’s size effect theory [41], the relationship between the nominal compressive strength (fN) and size (D) for concrete materials is shown in Equation (4):
f N = f ( 1 + D b D )
where f is the nominal compressive strength with infinite dimensions, Db is the effective thickness of boundary layer cracking. Equation (5) is the expanded form of Equation (4), shown as:
f N = f + f × 1 D × D b
Let X = 1/D, Y = fN, C = f, A = f × Db. Then, Equation (5) becomes a linear equation as shown in Equation (6):
Y = AX + C
The X and Y values can be directly calculated from the compressive strength test value and sample size; values of A and C are deduced by Equation (6), where A is the slope and C is the intercept. Therefore, the theoretical formula parameters of the size effect are obtained, as shown in Table 4.
Figure 10 shows the relationship between the measured strength values of GRAC of various sizes and the Bazant’s size effect theoretical curve. It can be seen that, under different water glass module conditions, the measured values of compressive strength of GRAC are all on the theoretical curve, indicating the compressive strength of GRAC can be calculated by Bazant’s size effect theory.

3.5. Critical Size and Critical Strength

Equation (4) is non-dimensionalized, as shown in Equation (7). Then, the test data of compressive strength of GRAC on different sizes and water-glass modules are brought into Equation (7) for mathematical regression analysis. The undetermined correlation coefficient of Equation (7) is derived, shown in Equation (8). The dimensionless relationship between the water-glass module and Bazant’s size effect theoretical curve is shown in Figure 11.
f N f 150 = f f 150 ( 1 + b D )
where f150 is the measured compressive strength of GRAC when the size is 150 mm3, and b is the undetermined coefficient of the equation.
f N f 150 = 0.61454 × ( 1 + 92.1185 D ) R 2 = 0.9759
It can be seen from Figure 11 that when the specimen size is 100 mm3, as the water-glass module is greater than 1.5 (1.8 and 2.1), the size effect positively deviates from the theoretical curve; as the water-glass module is less than 1.5 (0.9 and 1.2), the size effect deviates negatively from the theoretical curve. When the specimen size is 200 mm3, the deviation in the test data is opposite to that of 100 mm3. From the above analysis, it can be seen that the water-glass module of 1.5 is the demarcation point for the change in the size effect of GRAC. Therefore, a piece-wise function was proposed to fit the relationship between the water-glass module (ε) and f/f150 and Db. Figure 11 shows the relationship between the water-glass module and f/f150 and Db. Equations (9)–(12) are the fitting equations.
As 0.9 ≤ ε < 1.5,
f f 150 = 0.90269 0.16721 × ε R 2 = 0.9624
D b = 8.6967 + 29.519 × ε R 2 = 0.9731
As 1.5 < ε ≤ 2.1,
f f 150 = 1.63077 0.5927 × ε R 2 = 0.9741
D b = 687.442 + 493.031 × ε R 2 = 0.7998
According to the analysis of Equations (9)–(12) and Figure 12, the piece-wise function proposed for the relationship between the water-glass module and f/f150 and Db has high applicability. Therefore, putting Equations (9)–(12) into Equation (7) respectively, the GRAC compressive strength prediction equation considering the coupling of size effect and water-glass modules can be obtained, shown in Equations (13) and (14).
0.9 ≤ ε < 1.5
D b = 8.6967 + 29.519 × ε R 2 = 0 . 9731
1.5 < ε ≤ 2.1
f N f 150 = ( 1.63077 0.5927 × ε ) × ( 1 + 493.031 × ε 687.442 D ) R 2 = 0.9731

3.6. Critical Size and Critical Strength

According to Equations (13) and (14), the critical strength (fcr) of GRAC under different water-glass modules when the size is infinitely large can be calculated; the data are: fcr(ε = 0.9) = 23.16 MPa, fcr(ε = 1.2) = 17.07 MPa, fcr(ε = 1.5) = 11.28 MPa, fcr(ε = 1.8) = 7.45 MPa, fcr(ε = 2.1) = 4.39 MPa. Considering the applicable scope of the engineering size effect, when the compressive strength is within 5% of the characteristic value of the critical dimension, the size of GRAC corresponding to the compressive strength can be considered as the critical dimension (Dcr). The critical size of GRAC under different water-glass modules are: Dcr(ε = 0.9) = 705 mm, Dcr(ε = 1.2) = 882 mm, Dcr(ε = 1.5) = 1059 mm, Dcr(ε = 1.8) = 4000 mm, Dcr(ε = 2.1) = 6958 mm. The relationship between the water-glass module and the critical size and critical strength of GRAC is shown in Figure 13. The prediction equations proposed by Equations (13) and (14) can be used to effectively deduce the critical strength and critical size of GRAC under different water-glass modules. It also has a wider range of applicability, which is mainly reflected in two aspects: A. The equations are highly adaptable for considering the combined effect of the amount of recycled aggregate and the coupling effect of the size effect. B. The non-dimensional method has a certain reference significance for predicting the GRAC compressive strength of other strength grades and water-glass modules.

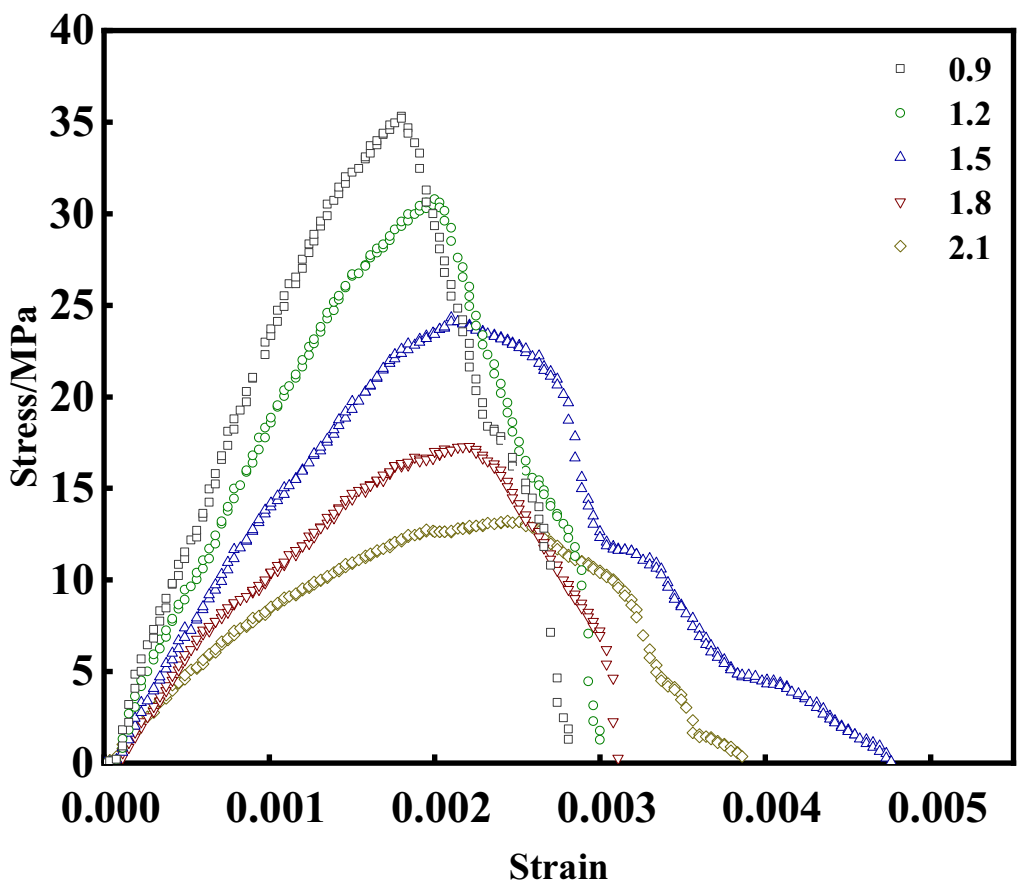
3.7. Stress–Strain Curves of GRAC

Figure 14 presents stress–strain curves of GRAC on the different water-glass modules. It can be observed that the five stress–strain curves are all similar to a straight line when the stress is lower than 30% of the peak stress, indicating that, in this stage, the internal stress of GRAC is relatively low, and fails to cause the generation and expansion of cracks. This stage is the elastic stage of GRAC, in which the slope of the stress–strain curve is inversely proportional to the water-glass module. This can be explained because the decrease in the water-glass module increases the density of the structure of GRAC (shown and analyzed in Figure 6). As the density of GRAC increases, the absorbed energy increases, the elastic modulus increases, and the ductility of the material increases. When the stress is 30–80% of the peak stress, it reaches the elastic-plastic stage, plastic deformation begins to occur, cracks appear on the surface, and the cracks grow rapidly with the increase in stress. In this stage, the slope of the stress–strain curve of GRAC begins to decrease.
Moreover, as the water-glass module decreases, the decreasing slope rate gradually decreases, which shows that the decrease in the water-glass module can effectively slow the plastic deformation inside GRAC. When stress reaches 80–100% of the peak stress, it is the pure plastic stage, and the slope of the stress–strain curve further decreases. In this stage, stress–strain curves begin to drop, and the slopes become a negative number. As shown in Figure 14, as the water-glass module decreases, the peak stress of GRAC gradually increases, and the decrease in its slope is also proportional to the water-glass module. This shows that reducing the water-glass module can increase the maximum stress of GRAC and reduce plastic deformation. After the stress develops to the peak point, GRAC undergoes brittle failure, which indicates the falling stage of the stress–strain curve. The curves of the falling stage are steep at first and then gentle, and with different specific shapes under different water-glass modules, they have large dispersion and no obvious regularity.
Figure 15 shows the influence of the water-glass module on the elastic modulus, peak stress, and corresponding peak strain of GRAC. The secant modulus from the origin of the rising stage of the stress–strain curve to the 30% peak stress point is the elastic modulus of GRAC; as the water-glass module is reduced from 2.1 to 0.9, the elastic modulus of GRAC increases by 28%. This is because the increase in the water-glass module reduces the porosity inside the geopolymer cementitious material, forming a denser structure and increasing the rigidity of GRAC, in turn enhancing the elastic modulus. In the elastic stage, the ability of GRAC to resist deformation is directly proportional to its elastic modules and inversely proportional to the water-glass module. It also can be seen from Figure 14 that the peak stress and peak strain of GRAC is inversely proportional and proportional to the water-glass module, respectively. Compared with the water-glass module = 2.1, as the water-glass module is reduced to 0.9, the peak stress of GRAC increases by 1.38 times, and the peak strain decreases by 26%. From the analysis of compressive strength of GRAC, it is known that the content of Na+ and OH in the system increases with the decrease in the water-glass module, and the free silicon-oxygen tetrahedral monomers [SiO4] and aluminum-oxygen tetrahedron monomers [AlO4] are also increased. As a result, the structure formed by the geopolymer cementing material is complete, the compressive strength of GRAC is also higher, the deformation capacity is improved, the peak stress is increased, and the peak strain is reduced.

3.8. Establishment of Constitutive Equation of GRAC

Figure 16 shows the geometric characteristics of the normalized stress–strain curve of GRAC under uniaxial compression. Table 5 shows the boundary conditions of the geometric characteristics. The piece-wise polynomial mathematical model and the rational fraction mathematical model are used to fit the normalized stress–strain curve of GRAC. The specific model is shown in Table 6.
Figure 17 presents the fitting results of the normalized stress–strain curve of GRAC using different mathematical models. Figure 18 shows the determination coefficients (R2) obtained using two mathematical models to fit the test data. R2 for both models is close to 1. In the falling stage, R2 for the polynomial model is 0.9763 and is 0.9647 for the rational model; in the falling stage, R2 are 0.8256 and 0.8561 for polynomial and rational models, respectively. Therefore, it is reasonable to fit the stress–strain curve of GRAC using the polynomial mathematical model in the rising stage and the rational fraction mathematical model for the falling stage, which is shown in Equation (15).
y =   a x + ( 5 4 a ) x 4 + ( 3 a 4 ) x 5 0 x 1 x b ( x 1 ) 2 + x x 1
where x is the abscissa variable ε/εpr and y is the ordinate variable σ/fpr, εpr is the peak compressive strain, and fpr is the axial compressive strength.
In order to verify the rationality of the model selection, the stress–strain curves of GRAC with different water-glass modules were fitted and compared with the experimental data. The fitting results are given in Figure 19. These results show that the fitting curve can better describe the real data, indicating that the model selected in this article can be used for nonlinear analysis of the stress–strain curve of GRAC. The parameters a, b obtained by fitting and the fitting determination coefficient R2 are listed in Table 7.
In order to obtain the constitutive equation of GRAC with only the water-glass module as a variable, it is necessary to fit the water-glass module (m) with the falling stage parameter a and the falling stage parameter b of the constitutive equation. The fitting process is shown in Figure 20, and the fitting results are given in Equations (16) and (17).
a = 2.2026 0.7466 m + 0.1340 m 2
b = 10.3277 m 5.5359
Putting Equations (16) and (17) into Equation (15), and then introducing x = ε/εpr, y = σ/fpr into the equation, the constitutive equation of the compressive strength of GRAC with water-glass modules as a variable was obtained, as shown in Equation (18):
σ = f pr × [ ( 2.0203 0.7466   m + 0.1340   m 2 ) × ( ε ε p r 4 ε 4 ε p r 4 + 3 ε 5 ε p r 5 ) + 5 ε 4 ε p r 4 4 ε 5 ε p r 5 ] ( ε ε p r ) f pr × ε / ε p r ( 10.3277   m 5.5359 ) × ( ε / ε p r 1 ) 2 + ε / ε p r ( ε ε p r )

4. Conclusions

The compressive strength, size conversion factor, compressive strength standard deviation, stress–strain relationships, and constitutive equation for alkali-activated GRAC on different modules were studied experimentally. The following conclusions were drawn from the results of this study:
Water-glass has a double-layer structure. Low module water-glass leads to a thicker diffusion layer, which activates more CaO, SiO2, and Al2O3 in the raw material, and improves the strength of GRAC. There are two kinds of gel structures of the geopolymer products (N-A-S-H and C-A-S-H). The decrease in the water-glass module contributes to the formation of more N-A-S-H gel.
The compressive strengths of GRAC are all in line with Bazant’s size effect theoretical curve. Through the segmented fitting method, the relationship of the size conversion coefficient of GRAC (α), the critical strength (fcr), and the critical dimension (Dcr) and water-glass module (ε) was determined, of which, ε = 1.5 was found to be the segmented point of the three equations.
The stress–strain behavior of GRAC is similar to that of OPCC. The elastic modulus and peak stress of GRAC are inversely proportional to the water-glass module, and the peak strain is proportional to the water-glass module. In the process of constructing the GRAC constitutive equation, it was found that the polynomial mathematical model and rational fraction mathematical model are optimal for the rising stage and falling stage, respectively.

Author Contributions

Conceptualization, Q.W. and Z.D.; Formal analysis, M.D. and Y.C.; Investigation, Q.W.; Methodology, H.B., M.L. and J.H.; Project administration, Q.W.; Resources, Q.Z. and Z.D.; Software, M.D. and H.J.; Supervision, M.D.; Validation, H.B. and Z.D.; Visualization, M.D.; Writing—review & editing, Q.W., Q.Z., F.D. and Z.D. All authors have read and agreed to the published version of the manuscript.

Funding

State Key Laboratory of Silicate Materials for Architectures (Wuhan University of Technology), grant number SYSJJ2021-13; the Science and Technology Program of the Ministry of Housing and Urban-Rural Development of China, grant number 2019-K-48; Shenyang “Double Hundred Project” Major Scientific and Technological Achievement Transformation Project, grant number Z19-4-11.

Institutional Review Board Statement

Not applicable.

Informed Consent Statement

Not applicable.

Data Availability Statement

Not applicable.

Conflicts of Interest

The authors declare no conflict of interest.

References

  1. Davidovits, J. 30 years of successes and failures in geopolymer applications. In Proceedings of the Geopolymer 2002 Conference, Melbourne, Australia, 1 October 2002. [Google Scholar]
  2. Zawrah, M.F.; Gado, R.A.; Feltin, N.; Ducourtieux, S.; Devoille, L. Recycling and utilization assessment of waste fired clay bricks (Grog) with granulated blast-furnace slag for geopolymer production. Process Saf. Environ. Prot. 2016, 103, 237–251. [Google Scholar] [CrossRef]
  3. Severin, I.; Vlad, M. Properties of alkali activated ground granulated blast furnace slag based geopolymers. Adv. Mater. Res. 2017, 1143, 114–119. [Google Scholar] [CrossRef]
  4. Guo, X.; Pan, X. Effects of Steel Slag on Mechanical Properties and Mechanism of Fly Ash-Based Geopolymer. J. Mater. Civ. Eng. 2020, 32, 04019348.1–04019348.9. [Google Scholar] [CrossRef]
  5. Sun, K.; Peng, X.; Chu, S.H.; Wang, S.; Zeng, L.; Ji, G. Utilization of BOF steel slag aggregate in metakaolin-based geopolymer. Constr. Build. Mater. 2021, 300, 124024. [Google Scholar] [CrossRef]
  6. Hosseini, S.; Brake, N.A.; Nikookar, M.; Günaydın-Şen, Ö.; Snyder, H.A. Mechanochemically activated bottom ash-fly ash geopolymer. Cem. Concr. Compos. 2021, 118, 103976. [Google Scholar] [CrossRef]
  7. Lăzărescu, A.V.; Szilagyi, H.; Baeră, C.; Ioani, A. The Effect of Alkaline Activator Ratio on the Compressive Strength of Fly Ash-Based Geopolymer Paste. IOP Conf. Ser. Mater. Sci. Eng. 2017, 209, 012064. [Google Scholar] [CrossRef] [Green Version]
  8. Bayuaji, R.; Wibowo, B.; Subekti, S.; Santoso, S.E.; Hardiyanto, E.; Kaelani, Y.; Mallu, L.L. The High Teperature Influence on Geopolymer Fly Ash Mixture’s Compressisive Strength with Insudtrial Waste Material Substitution. IOP Conf. Ser. Mater. Sci. Eng. 2017, 267, 12–15. [Google Scholar] [CrossRef]
  9. Wongsa, A.; Boonserm, K.; Waisurasingha, C.; Sata, V.; Chindaprasirt, P. Use of municipal solid waste incinerator (MSWI) bottom ash in high calcium fly ash geopolymer matrix. J. Clean. Prod. 2017, 148, 49–59. [Google Scholar] [CrossRef]
  10. Kim, Y.; Kang, S. Characterization of geopolymer made of municipal solid waste incineration ash slag. J. Korean Cryst. Growth Cryst. Technol. 2014, 24, 15–20. [Google Scholar] [CrossRef] [Green Version]
  11. Tang, Z.; Li, W.; Tam, V.W.Y.; Xue, C. Advanced progress in recycling municipal and construction solid wastes for manufacturing sustainable construction materials. Resour. Conserv. Recycl. X 2021, 19, 830–846. [Google Scholar] [CrossRef]
  12. Okoye, F.N.; Prakash, S.; Singh, N.B. Durability of fly ash based geopolymer concrete in the presence of silica fume. J. Clean. Prod. 2017, 149, 1062–1067. [Google Scholar] [CrossRef]
  13. Daniel, A.J.; Sivakamasundari, S.; Nishanth, A. Study on Partial Replacement of Silica Fume Based Geopolymer Concrete Beam Behavior under Torsion. Procedia Eng. 2017, 173, 732–739. [Google Scholar] [CrossRef]
  14. Nmiri, A.; Duc, M.; Hamdi, N.; Yazoghli-Marzouk, O.; Srasra, E. Replacement of alkali silicate solution with silica fume in metakaolin-based geopolymers. Int. J. Miner. Metall. Mater. 2019, 175, 27–36. [Google Scholar] [CrossRef]
  15. Qin, L.; Nie, Q.; Zhang, H. Laboratory experimental study on red mud geopolymer used as road subgrade materials. E3S Web Conf. 2021, 261, 02043. [Google Scholar] [CrossRef]
  16. Liang, X.; Ji, Y. Mechanical properties and permeability of red mud-blast furnace slag-based geopolymer concrete. SN Appl. Sci. 2021, 3, 1–10. [Google Scholar] [CrossRef]
  17. Provis, J.L. Geopolymers and other alkali activated materials: Why, how, and what. Mater. Struct. 2014, 47, 11–25. [Google Scholar] [CrossRef]
  18. Vafaei, M.; Allahverdi, A. High strength geopolymer binder based on waste-glass powder. Adv. Powder Technol. 2017, 28, 215–222. [Google Scholar] [CrossRef]
  19. Suwan, T.; Paphawasit, B.; Jitsangiam, P. Influence of Sodium Hydroxide Grade on the Strength of Fly Ash-Based Geopolymer Cement. Mater. Sci. Forum 2020, 998, 317–322. [Google Scholar] [CrossRef]
  20. Kumar, M.; Saxena, S.K.; Singh, N.B. Influence of some additives on the properties of fly ash based geopolymer cement mortars. SN Appl. Sci. 2019, 1, 481. [Google Scholar] [CrossRef] [Green Version]
  21. Tchakouté, H.K.; Rüscher, C.H. Mechanical and microstructural properties of metakaolin-based geopolymer cements from sodium waterglass and phosphoric acid solution as hardeners: A comparative study. Appl. Clay Sci. 2017, 140, 81–87. [Google Scholar] [CrossRef]
  22. Qing, X.; Qiu, L.I.; Chen, W.; Xiao, C.; Zhi, L.L.; Hao, S.M. Effect of Modulus of Alkali-activator on the Properties of GGBS-Based Geopolymer Pervious Concrete. Bull. Chin. Ceram. Soc. 2018, 37, 3575–3580. (In Chinese) [Google Scholar]
  23. Bature, A.S.; Khorami, M.; Ganjian, E.; Tyrer, M. Influence of alkali activator type and proportion on strength performance of calcined clay geopolymer mortar. Constr. Build. Mater. 2020, 267, 120–446. [Google Scholar] [CrossRef]
  24. Vikas, G.; Rao, T. Setting Time, Workability and Strength Properties of Alkali Activated Fly Ash and Slag Based Geopolymer Concrete Activated with High Silica modules Water Glass. Iran. J. Sci. Technol.-Trans. Civ. Eng. 2021, 45, 1483–1492. [Google Scholar] [CrossRef]
  25. Li, Y.; Wang, S.; Xue, M.; Yuxiang, L.; Jin, W. Effect of Water Glass on Compressive Strength and Pore Structure of Geopolymers. Non-Met. Mines 2017, 40, 46–49. (In Chinese) [Google Scholar]
  26. Zhang, H.; Liu, J.; Wu, B.; Zhang, Z. Axial Compressive Behavior of Geopolymer Recycled Lump Concrete. Materials 2020, 13, 533. [Google Scholar] [CrossRef] [PubMed] [Green Version]
  27. Ojha, A.; Gupta, L. Comparative study on mechanical properties of conventional and geo-polymer concrete with recycled coarse aggregate. Mater. Today: Proc. 2020, 28, 1403–1406. [Google Scholar] [CrossRef]
  28. Malayali, A.B.; Chokkalingam, R.B.; Muthukannan, M. Strength Properties of Geopolymer Concrete Modified with Recycled Aggregates. Iran. J. Sci. Technol.-Trans. Civ. Eng. 2021. [Google Scholar] [CrossRef]
  29. Saravanakumar, P. Strength and Durability Studies on Geopolymer Recycled Aggregate Concrete. Int. J. Eng. Technol. 2018, 7, 370–375. [Google Scholar] [CrossRef] [Green Version]
  30. GB/T 25177-2010; Recycled Coarse Aggregate for Concrete. Chinese National Standard. Standards Press of China: Beijing, China, 2010. (In Chinese)
  31. GB/T 14685-2011; Pebble and Crushed Stone for Construction. Chinese National Standard. Standards Press of China: Beijing, China, 2011. (In Chinese)
  32. Ding, Z.Y.; Zhou, J.H.; Su, Q.; Sun, H.; Zhang, Y.C.; Wang, Q.; Bian, H.G.; Dong, F.X. Hydration Kinetics for Alkaline Activation of Slag from Color Variation Data. Molecules 2021, 26, 3764. [Google Scholar] [CrossRef]
  33. Zhu, C.X.; Lu, C. The progress to recognize the hardening mechanism of waterglass. Inorg. Chem. Ind. 2001, 33, 22–25. (In Chinese) [Google Scholar]
  34. Zhu, C.X. Process of understanding the hardening mechanism of CO2 sodium silicate sand. Hot Work. Technol. 1998, 6, 46–47. (In Chinese) [Google Scholar]
  35. Rahier, H.; Wastiels, J. Reaction mechanism, kinetics and high temperature transformations of geopolymers. J. Mater. Sci. 2007, 42, 2982–2996. [Google Scholar] [CrossRef]
  36. Purdon, A.O. The action of alkalis on bast-furnace slag. Soc. Chem. Ind. 1940, 59, 191–202. [Google Scholar]
  37. Davidovits, J. Geopolymers: Inorganic polymeric new materials. J. Therm. Anal. Calorim. 1991, 37, 1633–1656. [Google Scholar] [CrossRef]
  38. Provis, J.L.; Rupert, J. X-ray microtomography shows pore structure and tortuosity in alkali-activated binders. Cem. Concr. Res. 2012, 42, 855–864. [Google Scholar] [CrossRef]
  39. Zhao, Y.Q. Concrete Compressive Strength Test and Evaluation-Common Learning GB/T50107-2010. Coal Technol. 2012, 31, 115. (In Chinese) [Google Scholar]
  40. Ding, Z.Y.; Zhou, J.H.; Su, Q. Study on mechanical properties of geopolymer recycled aggregate concrete. J. Shenyang Jianzhu Univ. (Nat. Sci.) 2021, 37, 138–146. (In Chinese) [Google Scholar]
  41. Bazant, Z.P. Size effect. Int. J. Solids Struct. 2000, 37, 69–80. [Google Scholar] [CrossRef]
Figure 1. Grading curves of aggregates: (a) natural river sand; (b) recycled concrete aggregate.
Crystals 12 00218 g001
Figure 2. Double electron layer structure of water-glass. An amorphous spherical silica glue-ball (mSiO2) is in the center, and OH and Na+ are in the diffusion layer and the outer of the dense layer, respectively. Water-glass has a high pH value and sodium concentration.
Crystals 12 00218 g002
Figure 3. Compressive strength effect of the water-glass module on GRAC. The compressive strength is inversely proportional to the module of water-glass (0.9–2.1).
Crystals 12 00218 g003
Figure 4. Two main geopolymerization products of geopolymer: (a) theoretical model of N-A-S-H gel; (b) theoretical model of C-A-S-H gel.
Crystals 12 00218 g004
Figure 5. XRD patterns of geopolymer on different water-glass modules [calcium silicate hydrate (Tobermorite 9A, PDF card number: 89-6458), calcium zeolite (Zeolite X(Ca), PDF card number: 38-0232), mullite (Mullite syn, PDF card number: 74-2419), SiO2 (Quartz, PDF card number: 75-1555)].
Crystals 12 00218 g005
Figure 6. SEM micrographs of different water-glass modules of GRAC: (a) n = 2.4; (b) n = 1.5; (c) n = 0.9; (d) enlarged image of point A (N-A-S-H gel); (e) enlarged image of point B (C-A-S-H gel); (f) EDS analysis of point A and point B.
Crystals 12 00218 g006
Figure 7. Compressive strength standard deviation for different water-glass modules and sizes.
Crystals 12 00218 g007
Figure 8. Compressive strength of GRAC for different sizes.
Crystals 12 00218 g008
Figure 9. Size conversion factor for water-glass module.
Crystals 12 00218 g009
Figure 10. Comparison diagram of measured strength and Bazant’s theoretical strength.
Crystals 12 00218 g010
Figure 11. Comparison diagram of dimensionless strength and Bazant’s theoretical strength.
Crystals 12 00218 g011
Figure 12. Effect of the water glass module on f/f150 and Db. The vertical black dotted line is when the water glass module is 1.5.
Crystals 12 00218 g012
Figure 13. Effect of water glass module on critical strength and critical size.
Crystals 12 00218 g013
Figure 14. Stress–strain curves of GRAC on different water-glass module.
Crystals 12 00218 g014
Figure 15. Elastic modulus, peak stress, and peak strain of GRAC on different water-glass modules. The green line is the elastic modulus; the red line is peak stress; the blue line is peak strain.
Crystals 12 00218 g015
Figure 16. Geometric characteristics of the normalized stress–strain full curve of GRAC under uniaxial compression.
Crystals 12 00218 g016
Figure 17. Normalized stress–strain fitting curve of GRAC: (a) polynomial fitting results of normalized stress-strain curve: (b) results of fitting normalized stress-strain curve by rational fraction.
Crystals 12 00218 g017
Figure 18. Determination coefficient of curve fitting of two mathematical models. The number in each bar indicates the determination coefficients obtained using the two mathematical models.
Crystals 12 00218 g018
Figure 19. Fitting curve and test curve: (a) rising stage fitting curve and test curve; (b) falling stage fitting curve and test curve.
Crystals 12 00218 g019
Figure 20. Relation curve of parameters a, b, and water-glass module.
Crystals 12 00218 g020
Table 1. Chemical composition of slag and fly ash.
CaO4
(wt.%)
SiO2
(wt.%)
Al2O3
(wt.%)
Fe2O3
(wt.%)
MgO
(wt.%)
Na2O
(wt.%)
K2O
(wt.%)
Ignition Loss (wt.%)
Slag43.1032.2614.692.066.19--0.97
Fly ash5.5148.5428.356.372.423.013.900.96
Table 2. Properties of the recycled aggregate.
Particle Size
(mm)
Bulk Density
(kg·m−3)
Apparent Density
(kg·m−3)
Water Absorption
(%)
Crushing Index
(%)
5~31.5118025608.7514.20
Table 3. Mix proportion of the test specimens.
No.Water-Glass ModuleSlag
(kg·m−3)
Fly Ash
(kg·m−3)
Water-Glass
(kg·m−3)
Water
(kg·m−3)
Sand
(kg·m−3)
Recycled Aggregate
(kg·m−3)
WG060.6315135541266811075
WG090.9315135541266811075
WG121.2315135541266811075
WG151.5315135541266811075
WG181.8315135541266811075
WG212.1315135541266811075
WG242.4315135541266811075
Table 4. Factors of size effect theory.
Water-Glass Module0.91.21.51.82.1
slope (A)24.39619.11512.8416.6555.069
intercept (C)899.571765.000680.571988.285928.714
determination coefficient (R2)0.95460.9950.99730.99940.9964
Table 5. Boundary conditions.
No.PositionBoundary Condition
1Original pointx = 0, y = 0
2rising stage0 < x < 1, dy/dx > 0
3Peak pointx = 1, y = 1, and dy/dx = 0
4falling stagex > 1, dy/dx < 0
5Whole curvex ≥ 0, 0 ≤ y ≤ 1
Table 6. Stress–strain full curve mathematical model.
Functional Form0 ≤ x ≤ 1x ≥ 1
Polynomial y = a 0 + a 1 x + a 4 x 4 + a 5 x 5 y = b 1 x + b 2 x 1 + b 3 x 2
Rational fraction y = a 1 x + a 2 x 2 + a 3 x + a 4 y = x b 1 x 2 + b 2 x + b 3
Table 7. Parameters of GRAC’s normalized stress –strain curve.
Water-Glass ModuleaR2(a)bR2(b)
0.91.5970.992515.7590.8360
1.21.3660.995213.8920.9170
1.51.2580.99429.1220.9293
1.81.1750.99787.5830.9227
2.11.1660.99753.4220.9210
Publisher’s Note: MDPI stays neutral with regard to jurisdictional claims in published maps and institutional affiliations.

