
Studies on the Crystal Growth and Characterization of Large Size Sr:LCB Single Crystals

Tianjin Key Laboratory of Functional Crystal Materials, Institute of Functional Crystal, School of Materials Science and Engineering, Tianjin University of Technology, Tianjin 300384, China
*
Author to whom correspondence should be addressed.
Crystals 2022, 12(4), 442; https://0-doi-org.brum.beds.ac.uk/10.3390/cryst12040442
Submission received: 28 February 2022
/
Revised: 12 March 2022
/
Accepted: 16 March 2022
/
Published: 22 March 2022
(This article belongs to the Special Issue Advances in Optoelectric Functional Crystalline Materials)
Abstract
:Extending the shortest second harmonic generation output wavelength of nonlinear optical crystals into the deep ultraviolet (UV) range is important for their application as frequency conversion devices for an advanced laser. The doping of ions with a large atomic number is believed to be an effective way to realize a shorter SHG output wavelength. In this work, large-sized Sr2+-doped La2CaB10O19 (Sr:LCB) crystals with nominal ratios of 10%, 15% and 30% were grown by the top-seeded solution growth method. The measured lattice parameters of the grown Sr:LCB are nearly the same as that of the LCB crystal, and the rocking curves reveal that the grown Sr:LCB crystals are of high quality. Sr: LCB crystals have a UV cut-off edge of 168 nm. The refractive index of the Sr:LCB crystals was measured, based on which the Sellmeier equations of the Sr:LCB crystals were fitted. The calculated shortest SHG output wavelength for Type I phase matching is 270.5 nm, which is 17.5 nm shorter than that of LCB crystals (288 nm). The characterization results demonstrate that Sr:LCB is a potential nonlinear optical crystal for the deep UV range.
1. Introduction
La2CaB10O19(LCB) is a nonlinear optical crystal with a relatively large effective nonlinear optical coefficient (deff = 1.05 pm/V), stable mechanical and chemical properties, and a high laser damage threshold (11.5 GW/cm2 for 8 ns pulses at 1064 nm) [1,2,3]. Transparent crystals were grown by top-seeded solution growth (TSSG) [4,5]. Compared with a wide optical transparency range (173–3000 nm), the shortest second harmonic generation (SHG) output wavelengths of 288 nm for type I and 408 nm for type II due to the moderate birefringence values limited LCB’s application in the ultraviolet (UV) and deep UV (DUV) ranges [6,7].
The doping of ions with a large atomic number is believed to be an effective way to change the refractive index of a crystal to increase the birefringence values of nonlinear optical crystals, realizing a shorter SHG output wavelength [8,9,10,11]. Furuya et al. [9] studied GdCOB crystals in 1997 and found that the substitution of Y3+ for Gd3+ increased their birefringence value from 0.033 to 0.041, enabling the crystal to achieve triple frequency laser output at room temperature. By utilizing this technique with La atoms, YCOB [10] realized non-critical phase-matching (NCPM) SHG and third-harmonic-generation (THG) wavelengths along the Y-axis at ambient temperature. In 2016, Yang Lei et al. [11] doped the BABF crystal with Ga3+, so that the birefringence value at 266 nm was increased from 0.0522 to 0.0573, and achieved an output of UV light at 266 nm. The cationic lattice sites in an LCB crystal are occupied by La3+ ions and Ca2+ ions, while La3+ is easily substituted by rare earth ions. Most of the doping studies in LCB crystals have focused on rare earth [12,13,14,15,16] for self-frequency-doubled applications [17], while the doping of Sr2+ in LCB crystals has been less studied. Because the difference between the ionic radius of Sr2+ and Ca2+ is small, substitution can easily be carried out. On the other hand, Sr2+ and Ca2+ are in the same main group with similar chemical properties, so that the substitution of Ca2+ ions with Sr2+ ions brings the least damage to the lattice.
In this work, large-size Sr:LCB crystals were grown by the TSSG method. The lattice parameters were measured by X-ray diffraction, and are nearly the same as that of a LCB crystal. The UV transmission spectra and rocking curves demonstrate the high quality of the crystals grown in this manner. The thermal properties and refractive index of Sr:LCB crystals were measured, and are better than those of pure LCB crystals. The calculated shortest SHG output wavelength for type I phase matching is 17.5 nm shorter than that of LCB crystals (288 nm) due to the increasing birefringence value after Sr2+ doping. From our characterization results, Sr: LCB is a promising nonlinear optical crystal for frequency conversion in the deep UV range.
2. Materials and Methods
2.1. Crystal Growth
The raw materials used for crystal growth were CaCO3, Li2CO3, H3BO3 and SrCO3 with a high purity of 99.99%. The atomic ratio for pure LCB is La2O3:CaO:Li2O:B2O3 = 1:2:2.3:14 [5,18]. Sr:LCB crystals (La2SrxCa1−xB10O19) with different Sr concentrations were grown by changing the atomic ratios of SrCO3 and CaCO3 in the raw materials, while the other raw materials were kept the same. During the synthesis of the charge materials, excessive CaO, Li2O and B2O3 with an atomic ratio of Sr:LCB:CaO:Li2O:B2O3 = 1:1:2.3:9 were employed as the flux for LCB crystal growth. After calcination at 450 °C, 950 °C and 650 °C, the polycrystalline Sr:LCB and flux were ground into powders. The charge materials were melted in a Φ 90 × 100 mm3 platinum crucible, then kept at 1030 °C for 24 h. After stirring with a platinum stirring paddle for 48 h, the Sr:LCB crystal was grown with TSSG. Starting from the saturation temperature, the growth temperature decreased at a rate of 0.5–1 °C/d. The crystal growth lasted 20–40 days. After being pulled out of the solution, the Sr:LCB crystals slowly cooled down to room temperature at a rate of 10 °C/d.
2.2. Characterization
The doping concentration was analyzed by an ICAP RQ inductively coupled plasma mass spectrometer (ICP-MS) from ThermoFisher Scientific (Waltham, MA, USA). The measurements were performed at room temperature with a resolution of 0.3–1.0 amu, a mass spectral range of 4–250 amu, a two-channel detector and a linear dynamic range of ≥10 orders of magnitude.
The XRD measurement was performed with a high-resolution X-ray diffractometer (Bruker-AXS D5005HR, Billerica, MA, USA) at room temperature. The transmittance measurements were performed from ultraviolet (UV) to IR bands, where the 200–2000 nm band was measured on a Cary 5000 UV-VIS-NIS spectrophotometer ((Agilent Technologies, Inc., CA, USA) and the deep UV band 165–270 nm was measured on a VS7550-VUV transmittance tester (Resonance Ltd, Canada) in a vacuum environment. The results are integrated to show the transmittance of Sr:LCB. The thermal properties of Sr:LCB crystals with 10% and 30% ratios were measured at temperatures between 30 °C and 500 °C with a NETZSCH LFA 457 Nano Flash (NETZSCH Taurus Instruments GmbH, Weimar, Germany).
The refractive index was measured by the minimum deviation method with a broad-band high-precision refractive index meter (SpectroMaster UV-VIS-IR, Wedel, Germany) with mercury and helium lamps as the light sources. The vertex angle of the prism was accurately measured at room temperature and the refractive indices at eight wavelengths of 365.015, 404.656, 435.835, 546.075, 587.562, 643.847, 706.519 and 852.11 nm were probed by rotating the goniometer. The refractive indices of Sr:LCB crystals were experimentally measured from the UV to IR bands.
3. Results and Discussion
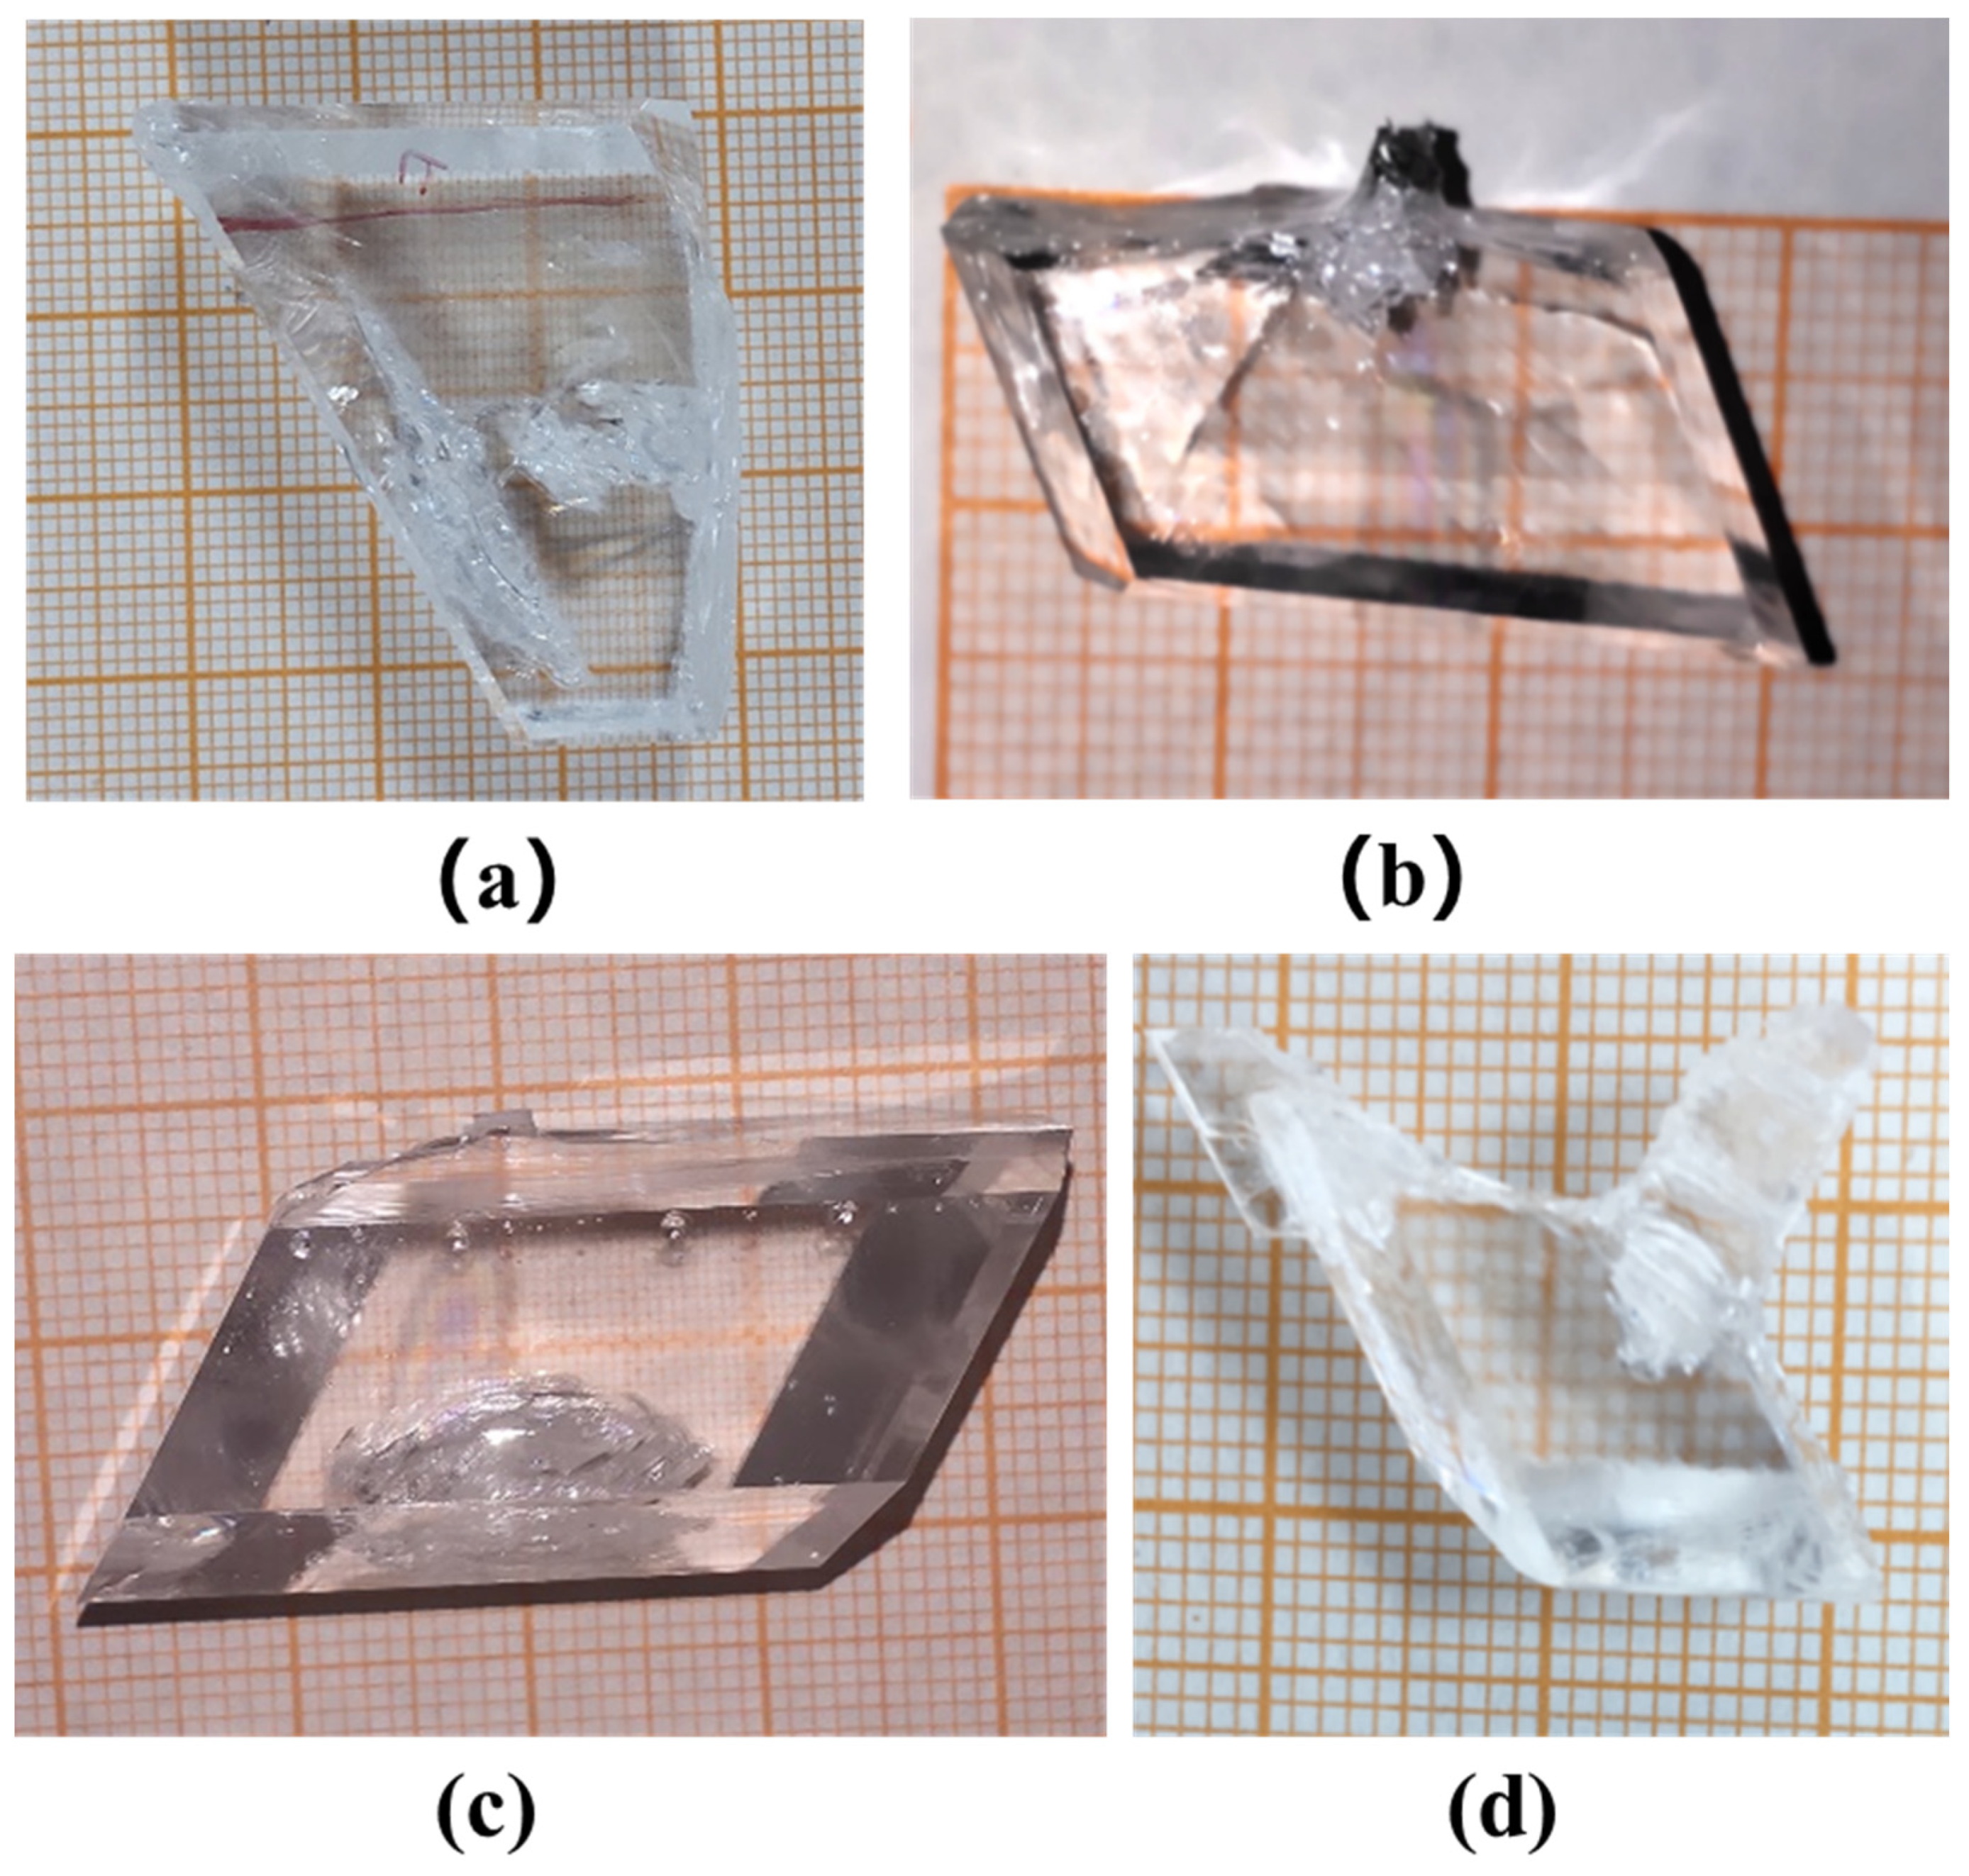
Besides the LCB crystals, Sr-doped LCB crystals with different nominal ratios were obtained with similar growth parameters. Figure 1 shows the as-grown pure crystal and Sr2+-doped LCB crystals with nominal ratios of 10%, 15% and 30%. All the Sr:LCB crystals grown were transparent with high crystal quality and few inclusions. Comparing the size of the different LCB and Sr:LCB crystals that were grown, it can be seen that the rotation mode of Sr:LCB crystals during the growth can strongly change the thickness along the [001] direction of the obtained crystals. After changing from a unidirectional rotation to a bidirectional rotation, the high temperature solution for growth can be stirred harder, which will be beneficial for solute transport during crystal growth. The improved solute transport increased the thickness along the [001] direction of the grown Sr:LCB crystals, as list in Table 1. The size of crystals with a nominal atomic ratio of 30% is much smaller than that of other crystals because the growth parameters still need to be optimized. More work is to be done.
The actual doping centration for these three Sr:LCB crystals with different nominal ratios was analyzed by ICP-MS, and the results are shown in Table 2. The segregation coefficients for the crystals with nominal ratios of 10%, 15% and 30% were 0.117, 0.140 and 0.156, respectively, which are smaller than those of rare-earth-ion doped LCB crystals [15,19,20], resulting in the low actual doping concentrations of the obtained Sr:LCB crystals. The low segregation coefficients are thought to be related to the flux ratio, growth process and the crystal structure. Meanwhile, the lattice parameters of four LCB and Sr:LCB crystals were checked, and the results are shown in Table 3. It can be seen that the lattice parameters were nearly the same despite an increasing Sr2+ doping ratio. Due to the small ion diameter difference between the Sr2+ and Ca2+, the substitution of Ca2+ with Sr2+ has almost no influence on the lattice structure of LCB. Therefore, it is possible to grow Sr:LCB crystals with a large ratio of Sr:Ca.
The as-grown crystal quality was checked by X-ray rocking curves. By cutting the grown crystals along the [010] direction, two Sr:LCB wafers without obvious inclusions and with dimensions of 10 × 8 × 1 mm3 and 10 × 7.6 × 1 mm3 were obtained. Following this, the wafers were double-side polished, as shown in Figure 2a,b. The peak of the Sr:LCB wafer with a 10% ratio is located at a 2θ value of 13.458° and the full width at half maximum (FWHM) is 32.4 arcsec, while the peak of the Sr:LCB wafer with a 30% ratio is located at a 2θ value of 13.319° and the FWHM is 48.6 arcsec. The smaller FWHM values demonstrate the high quality of both the Sr:LCB crystals, and the quality of Sr:LCB crystals with a 10% ratio is better.
The transmission spectra of the Sr:LCB crystal with a nominal ratio of 30% are shown in Figure 3. It can be seen that the Sr:LCB crystal has high transmittance without hetero-absorption peaks in the whole test range. The transmittance in the range of 200~2000 nm was more than 90%, which is slightly higher than that of LCB crystals [1]. The deep UV band shows a UV cutoff wavelength of 168 nm, which is 5 nm shorter than the reported values of LCB crystal (173 nm) [1], indicating that Sr2+ doping does not exert a negative effect on the UV transmittance and deep UV cut-off edge of LCB crystals. Due to the limitation and instability of the VS7550-VUV transmittance tester in a vacuum environment, the measured transmittance is usually lower than that from a Cary 5000 UV-VIS-NIS spectrophotometer in ambient conditions, leading to the lower transmittance in Figure 3a.
Furthermore, the thermal properties were measured on the Sr-doped LCB crystals by the flash-heat method. Thermal properties are very important for nonlinear optical crystals since the crystals will be heated by an incident laser during the frequency conversion process, which might damage the working crystals without heat transfer. During the measurements, the measured specimens were 6 × 6 × 1 mm3 and 4 × 4 × 1 mm3 wafers cut along the [010] direction, and the heating rate was 5 °C/min. The wafers were placed in the test tank, flattened and fixed between two ceramic pieces. Figure 4 shows the variation in thermal diffusion and thermal conduction of the crystals at a temperature from 30 to 500 degrees centigrade. The thermal conductivity and thermal diffusion of the Sr:LCB crystal with a nominal ratio of 30% was higher than that of the Sr:LCB crystal with a nominal ratio of 10%, both of which are better than those of pure LCB crystal [21]. The higher thermal conductivity and thermal diffusion indicate that the Sr:LCB crystals may have a higher laser-induced damage threshold than pure LCB crystals, which is very important for their application as frequency conversion devices.
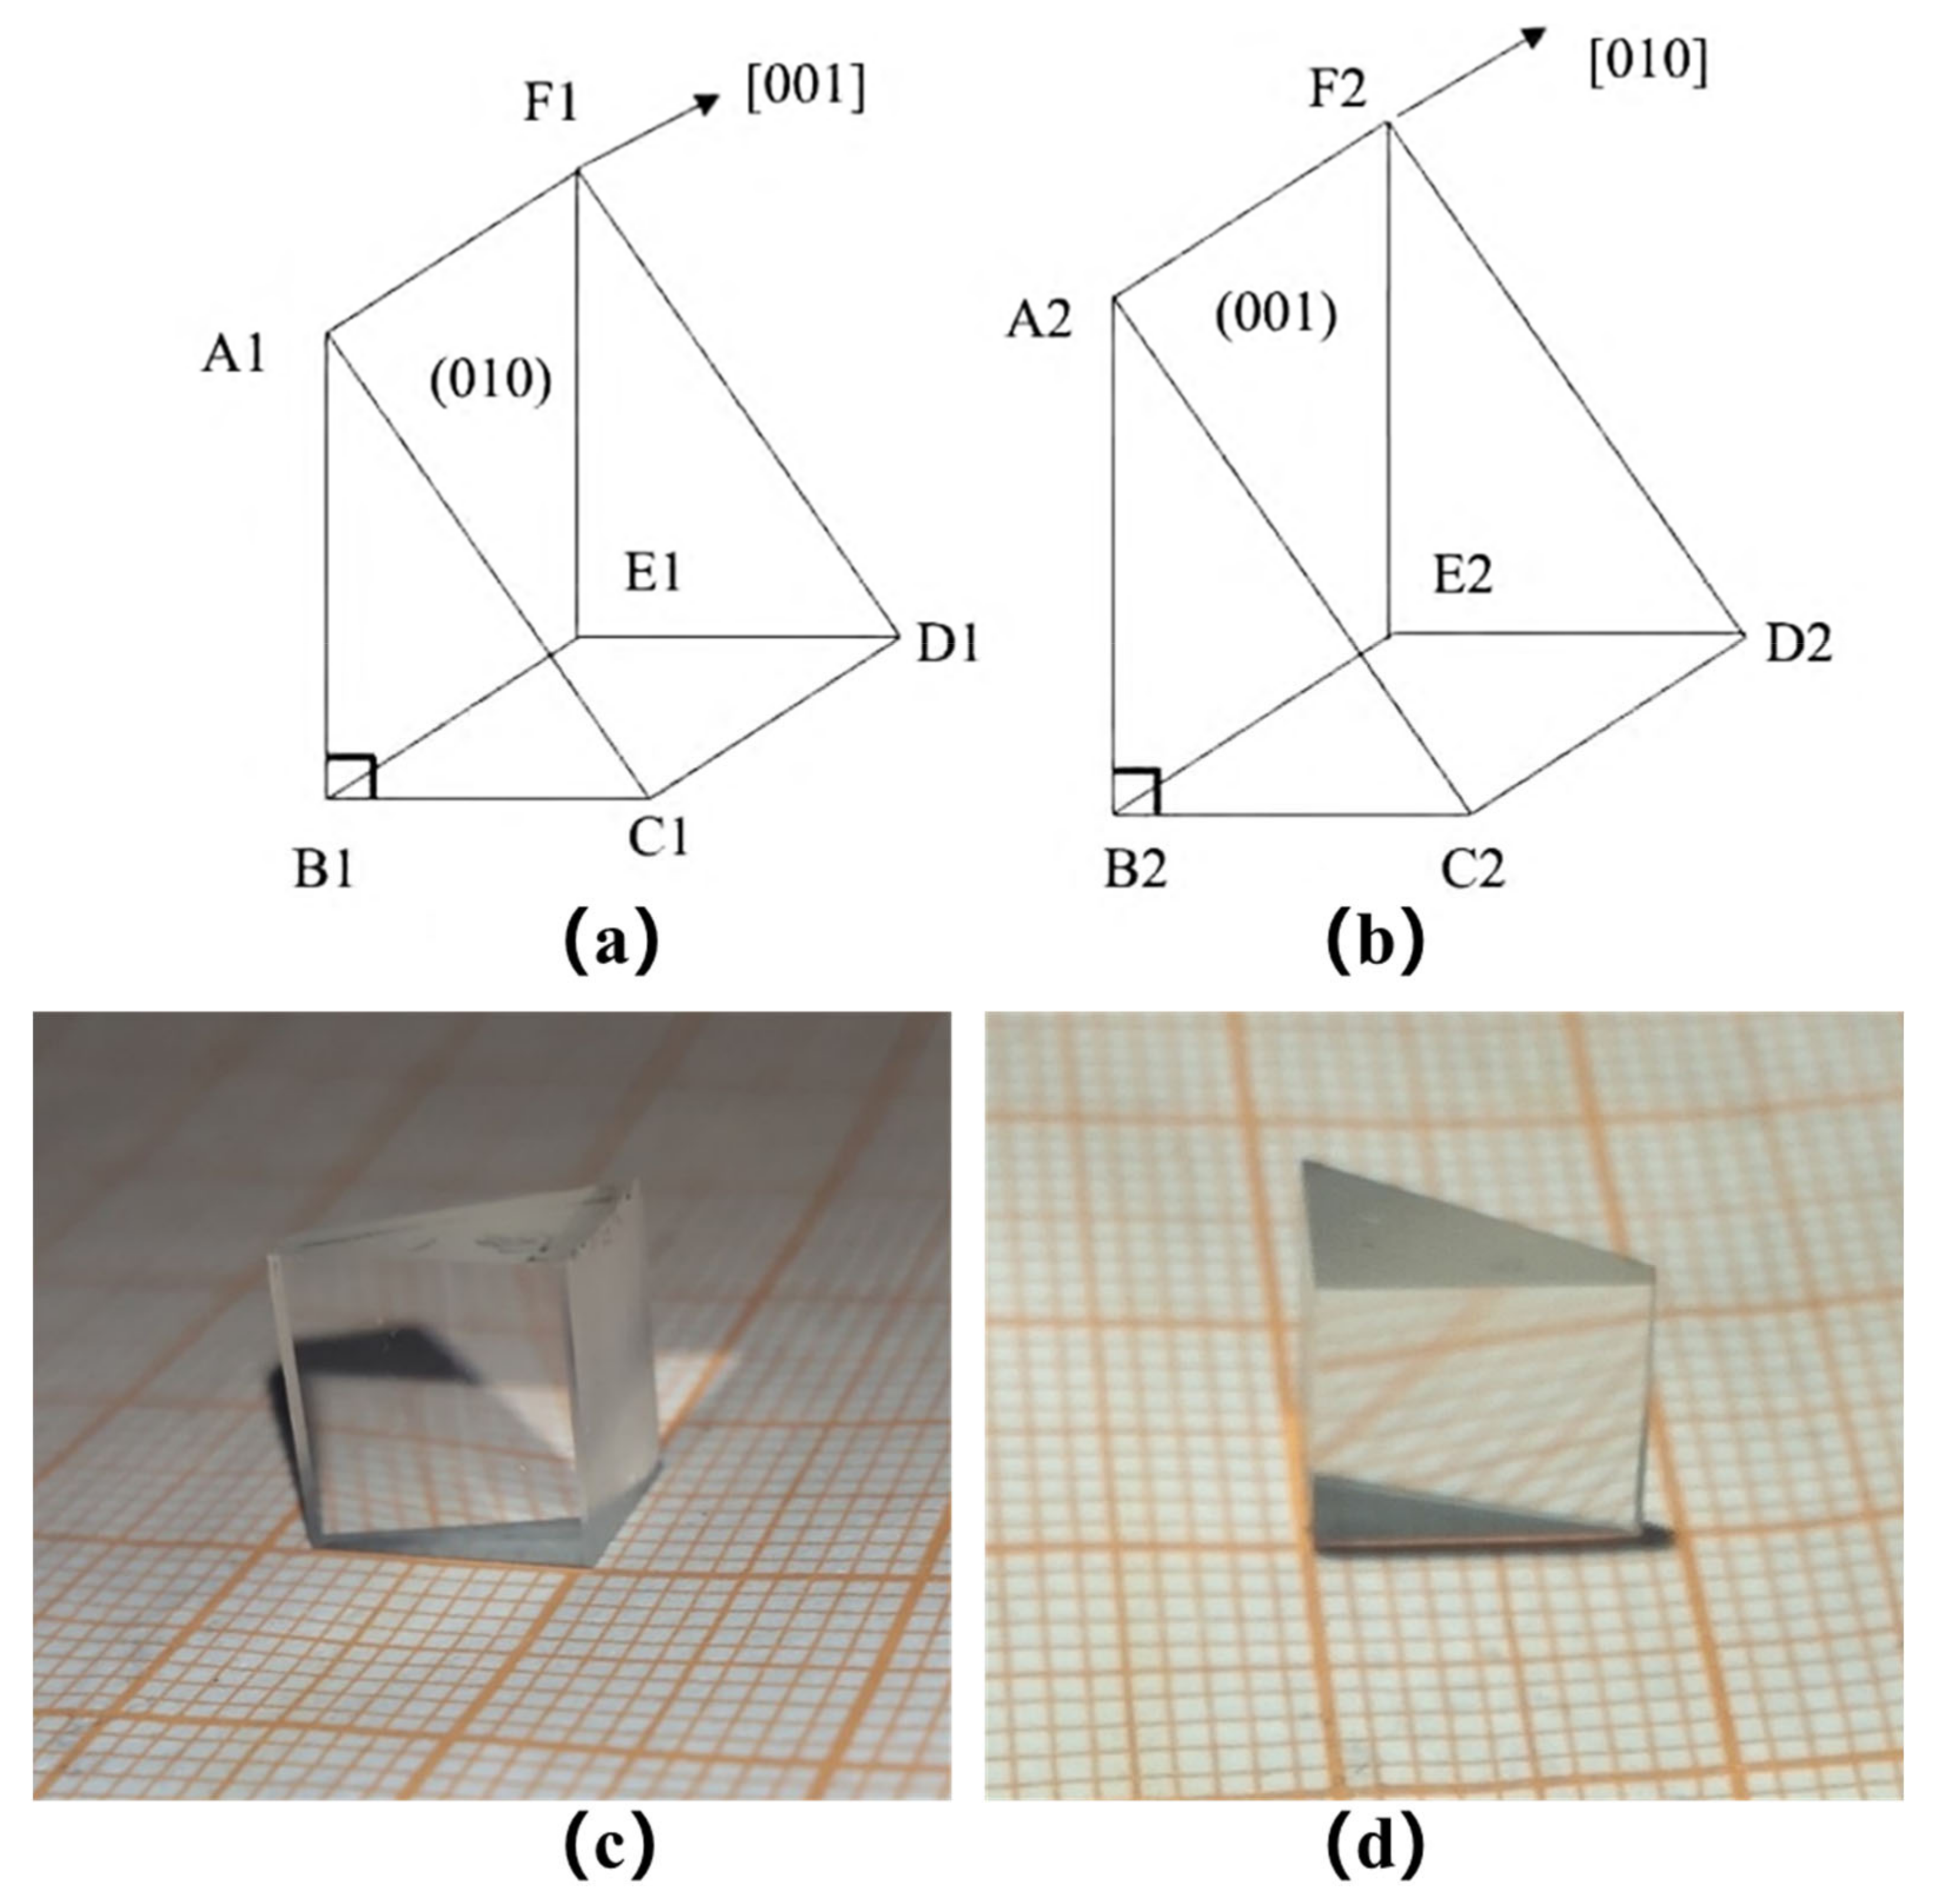
To investigate the phase matching for the frequency conversion application, the refractive index for Sr:LCB was measured. Since LCB is a biaxial crystal, two right-angle prisms with different light-pass surfaces are required in order to obtain the refractive indices of the three principal axes of Sr:LCB [6]. The orientations of the two prisms are schematically shown in Figure 5a,b. One of the prisms had one of its right-angle faces parallel to the (010) plane of the crystal, with a vertex angle of about 30°, as shown in Figure 5a. During the measurements, the incident light was normal to the (010) plane of the prism. Two principal refractive indices of nz and nx, which is perpendicular to the principal axis ny, can be obtained by the minimum deviation technique, listed in Table 4. The other prism has a right-angle facet parallel to the (001) plane, with a vertex angle of about 30°, as shown in Figure 5b. Similar to the first measurements, the incident light was normal to the (001) plane of the prism, and we can obtain the refractive index ny and another refractive index na on the elliptical interface of nx and nz. Because these two prisms needed to have a size of 10 × 10 mm2 without obvious inclusions for this measurement, only Sr:LCB crystals with a nominal doping concentration of 15% were processed. All the surfaces of these two prisms were polished before the measurement. The obtained results are fitted using the following Sellmeier equation (1), and the fitted results are listed in the chart in Figure 6a.
The curves in Figure 6 show that the refractive indices of the three principal axes have the same trends. With increases in the incident wavelength, the refractive index gradually decreases. The difference between the principal refractive indices nx and ny is small, indicating that its optical properties are close to those of a uniaxial crystal. However, the difference between the main refractive index nz and the other two values is large, and it can also be seen from the refractive index relationship that the Sr:LCB crystal belongs to the biaxial crystal class.
The birefringence values of the Sr:LCB crystal with a nominal ratio of 15% are calculated according to Equation (1), and the corresponding results are listed in Table 5. From Table 5, it can be seen that the birefringence values of Sr:LCB are larger than those of the reported LCB crystals [3]. The phase-matching angles in the three principal planes are calculated from the Sellmeier equation (1), shown in Figure 6. The calculated results demonstrate that after the doping of Sr2+ ions into the LCB crystal, the shortest SHG output wavelength for type I phase matching is 270.5 nm, which is 17.5 nm shorter than that of pure LCB crystal (288 nm) [6]. The calculated shorter SHG output wavelength demonstrates that Sr2+ doping is an effective strategy to realize SHG output in a deep UV range. Considering the relatively small doping concentration and the nearly identical lattice parameters after doping, growing Sr:LCB crystals with much higher doping concentration seems promising, increasing the birefringence values to realize the quadruple harmonic generation of a 1064 nm laser. Thus, the Sr:LCB crystals can be potential nonlinear optical crystals in the deep UV region.
4. Conclusions
High quality Sr:LCB crystals with a maximum size of 30 × 20 × 19 mm3 were grown by TSSG. The lattice parameters of Sr:LCB crystals collected from a single crystal diffractometer are nearly the same as those of LCB crystals. The segregation coefficients were 0.117, 0.140 and 0.156, respectively, according to ICP-MS. The half-peak widths of Sr:LCB crystals with 10% and 30% ratios were 32.4 arcsec and 48.6 arcsec, respectively, indicating that the Sr:LCB crystals have high crystal quality and good crystal integrity. The thermal properties of Sr:LCB crystals, such as their thermal diffusion coefficient and thermal conductivity, were better than those of LCB crystals. Refractive indices were carried out to obtain the dispersion equations of different principal axes. The birefringence values from the measured Sellmeier equations were larger than those of LCB crystals at the same wavelength. The calculated shortest SHG output wavelength for type I phase matching for the Sr:LCB crystal was 17.5 nm shorter than that of the LCB crystal. Thus, the Sr:LCB crystals could be employed as frequency conversion crystals in the deep UV range. Increasing the doping concentration seems a promising technique for achieving a 266 nm output by the quadruple harmonic generation of a 1064 nm laser.
Author Contributions
Methodology, X.Z. and F.J.; validation, X.Z. and Y.L.; investigation, X.Z. and F.J.; data curation, X.Z.; writing—original draft preparation, X.Z.; writing—review and editing, F.J.; project administration, Z.H. and Y.W. All authors have read and agreed to the published version of the manuscript.
Funding
This research was funded by the NSFC (4 Grants 92163207, 51872198, 51890865, and 51890860), the Natural Science Foundation of Tianjin(18JCYBJC42500).
Data Availability Statement
Not applicable.
Acknowledgments
The authors thank H. H. Fan for the technical support.
Conflicts of Interest
The authors declare that they have no conflict of interest.
References
- Zhang, J.; Wang, L.; Wu, Y.; Wang, G.; Fu, P.; Wu, Y. High-efficiency third harmonic generation at 355 nm based on La2CaB10O19. Opt. Express 2011, 19, 16722–16729. [Google Scholar] [CrossRef] [PubMed]
- Wu, Y.; Liu, J.; Fu, P.; Wang, J.; Zhou, H.; Wang, G.; Chen, C. A New Lanthanum and Calcium Borate La2CaB10O19. Chem. Mater. 2001, 13, 753–755. [Google Scholar] [CrossRef]
- Jing, F.; Fu, P.; Wu, Y.; Zu, Y.; Wang, X. Growth and assessment of physical properties of a new nonlinear optical crystal: Lanthanum calcium borate. Opt. Mater. 2008, 30, 1867–1872. [Google Scholar] [CrossRef]
- Wang, J.; Fu, P.; Wu, Y. Top-seeded growth and morphology of La2CaB10O19 crystals. J. Cryst. Growth 2002, 235, 5–7. [Google Scholar] [CrossRef]
- Jing, F.; Wu, Y.; Fu, P. Growth of La2CaB10O19 single crystals by top-seeded solution growth technique. J. Cryst. Growth 2006, 292, 454–457. [Google Scholar] [CrossRef]
- Wang, G.; Lu, J.; Cui, D.; Xu, Z.; Wu, Y.; Fu, P.; Guan, X.; Chen, C. Efficient second harmonic generation in a new nonlinear La2CaB10O19 crystal. Opt. Commun. 2002, 209, 481–484. [Google Scholar] [CrossRef]
- Li, Y.; Li, K.; Yu, H.; Shan, F.; Wang, Z.; Zhang, G.; Zhang, H.; Wu, Y.; Wang, J. The optimal phase-matching angles for third harmonic generation of low symmetry nonlinear optical crystal La2CaB10O19. Opt. Mater. 2016, 62, 366–371. [Google Scholar] [CrossRef]
- Aka, G.; Kahn-Harari, A.; Mougel, F.; Vivien, D.; Salin, F.; Coquelin, P.; Colin, P.; Pelenc, D.; Damelet, J.P. Linear- and nonlinear-optical properties of a new gadolinium calcium oxoborate crystal, Ca4GdO(BO3)3. J. Opt. Soc. Am. B Opt. Phys. 1997, 14, 2238–2247. [Google Scholar] [CrossRef]
- Furuya, H.; Yoshimura, M.; Kobayashi, T.; Murase, K.; Mori, Y.; Sasaki, T. Crystal growth and characterization of GdxY1−xCa4O(BO3)3 crystal. J. Cryst. Growth 1999, 198–199, 560–563. [Google Scholar] [CrossRef]
- Qi, H.; Wang, X.X.; Chai, Z.P.; Wang, F.; Chai, X.; Wang, Z.; Yu, F.; Liu, Y.; Zhao, X.; Xu, X. Growth and non-critical phase-matching frequency conversion properties of LaxY1−xCOB crystals. CrystEngComm 2016, 18, 6205–6212. [Google Scholar] [CrossRef]
- Yang, L.; Yue, Y.; Yang, Z.G.; Hu, Z.; Xu, Z. 266 nm ultraviolet light generation in Ga-doped BaAlBO3F2 crystals. Opt. Lett. 2016, 41, 1598. [Google Scholar] [CrossRef] [PubMed]
- Brenier, A.; Wu, Y.; Zhang, J.Y.; Wu, Y.C.; Fu, P.Z. Laser properties of the diode-pumped Nd3+-doped La2CaB10O19 crystal. J. Appl. Phys. 2010, 108, 093101. [Google Scholar] [CrossRef]
- Hong, H.; Yu, Y.N.; Liang, H.B.; Wang, S.B.; Su, Q.; Tao, Y. Study on spectra of La2CaB10O19: Eu3+ in VUV-VIS range. J. Rare Earths 2004, 22, 361–364. [Google Scholar]
- Guo, R.; Wu, Y.; Fu, P.; Jing, F. Growth and spectroscopic properties of ytterbium-doped lanthanum calcium borate (Yb3+: La2CaB10O19) crystal. Opt. Commun. 2005, 244, 321–325. [Google Scholar] [CrossRef]
- Shan, F.; Fu, Y.; Zhang, G.; Xu, T.; Zhang, X.; Wu, Y. Growth and spectroscopic properties of Tb3+ doped La2CaB10O19 crystal. Opt. Mater. 2015, 49, 27–31. [Google Scholar] [CrossRef]
- Wu, Y.; Zhang, J.; Zhang, G.; Fu, P.; Wu, Y. Optical properties of Nd3+-doped La2CaB10O19 crystals with different Nd3+ concentrations. J. Cryst. Growth 2011, 318, 632–635. [Google Scholar] [CrossRef]
- Fang, Q.; Yu, H.; Zhang, H.; Zhang, G.; Wang, J.; Wu, Y. Output power enhancement of a self-frequency-doubled laser by selective excitation of inequivalent active centers in La2CaB10O19 (Nd:LCB) crystal. Opt. Lett. 2017, 42, 4861–4864. [Google Scholar] [CrossRef]
- Jing, F.; Wu, Y.; Fu, P. Growth of La2CaB10O19 single crystals from CaO-Li2O-B2O3 flux. J. Cryst. Growth 2005, 285, 270–274. [Google Scholar] [CrossRef]
- Feng, J.C.; Tu, H.; Zhang, G.C. Growth and spectroscopic properties of Tm3+ -doped La2CaB10O19 crystal. J. Lumin. 2021, 239, 118337. [Google Scholar] [CrossRef]
- Zhang, X.; Wu, Y.; Shan, F.; Li, Y.; Zhang, J.; Wu, Y. Growth and spectroscopic properties of Sm3+-doped La2CaB10O19 crystal. J. Cryst. Growth 2014, 399, 39–42. [Google Scholar] [CrossRef]
- Jing, F.; Wu, Y.; Fu, P.; Guo, R. Thermal expansion of nonlinear optical crystal La2CaB10O19. Jpn. J. Appl. Phys. Part 1-Regul. Pap. Brief Commun. Rev. Pap. 2005, 44, 1812–1814. [Google Scholar] [CrossRef]
Figure 1.
The pure and Sr2+-doped LCB crystals. (a) An image of a pure LCB crystal. (b) An image of a crystal with a nominal ratio of 10%. (c) An image of a crystal with a nominal ratio of 15%. (d) An image of a crystal with a nominal ratio of 30%.
Figure 1.
The pure and Sr2+-doped LCB crystals. (a) An image of a pure LCB crystal. (b) An image of a crystal with a nominal ratio of 10%. (c) An image of a crystal with a nominal ratio of 15%. (d) An image of a crystal with a nominal ratio of 30%.

Figure 2.
(a,b) b-sheets of Sr:LCB with concentrations of 10% and 30%. (c,d) Rocking curves of Sr:LCB wafers with 10% and 30% ratios.
Figure 2.
(a,b) b-sheets of Sr:LCB with concentrations of 10% and 30%. (c,d) Rocking curves of Sr:LCB wafers with 10% and 30% ratios.

Figure 3.
UV transmission spectra of Sr:LCB crystal with a nominal ratio of 30%. Due to the wavelength limitation of the measurements, the transmission spectra were collected in a vacuum environment with VS7550-VUV transmittance tester (a) and in ambient conditions with a Cary 5000 UV-VIS-NIS spectrophotometer (b).

Figure 4.
Thermal conduction (a) and thermal diffusion (b) of the Sr:LCB crystals with nominal ratios of 10% and 30%.
Figure 4.
Thermal conduction (a) and thermal diffusion (b) of the Sr:LCB crystals with nominal ratios of 10% and 30%.

Figure 5.
(a,b) Schematics of Sr: LCB prism parallel to the (010) and (001) directions. (c,d) The cut prism of Sr:LCB crystals according to the schematics in (a,b) with a right-angle light-pass surface.
Figure 5.
(a,b) Schematics of Sr: LCB prism parallel to the (010) and (001) directions. (c,d) The cut prism of Sr:LCB crystals according to the schematics in (a,b) with a right-angle light-pass surface.

Figure 6.
(a) Fitted refractive index curves of Sr:LCB crystal with a nominal ratio of 15%. (b) The calculated phase-matching angles in the three principal planes based on the Sellmeier equations of the Sr:LCB crystal.
Figure 6.
(a) Fitted refractive index curves of Sr:LCB crystal with a nominal ratio of 15%. (b) The calculated phase-matching angles in the three principal planes based on the Sellmeier equations of the Sr:LCB crystal.


Table 1.
LCB crystals with different rotation methods.
| Crystals | Size (mm3) | Thickness (mm) | Rotation Method | Growth Method |
|---|---|---|---|---|
| LCB | 53 × 30 × 10 | 10 [5] | unidirectional | TSSG |
| LCB | 35 × 30 × 16 | 16 | bidirectional | TSSG |
| 10% Sr:LCB | 25 × 15 × 8 | 8 | unidirectional | TSSG |
| 15% Sr:LCB | 30 × 20 × 19 | 19 | bidirectional | TSSG |
| 30% Sr:LCB | 20 × 12 × 8 | 8 | bidirectional | TSSG |
Table 2.
Doping concentration of Sr:LCB crystals.
| Actual Doping | Segregation Coefficient (keff) | |
|---|---|---|
| 10% Sr:LCB | 1.17% | 0.117 |
| 15% Sr:LCB | 2.10% | 0.140 |
| 30% Sr:LCB | 4.68% | 0.156 |
| Tb:LCB | 0.82 [15] | |
| Tm:LCB | 0.37 [19] | |
| Sm:LCB | 0.45 [20] |
Table 3.
Lattice parameters of Sr:LCB crystals with different doping concentrations.
| a (Å) | b (Å) | c (Å) | α (°C) | β (°C) | γ (°C) | |
|---|---|---|---|---|---|---|
| LCB | 11.05 | 6.56 | 9.13 | 90 | 91.5 | 90 |
| 10% LCB | 11.06 | 6.57 | 9.13 | 90 | 91.5 | 90 |
| 15% LCB | 11.05 | 6.57 | 9.13 | 90 | 91.5 | 90 |
| 30% LCB | 11.05 | 6.57 | 9.13 | 90 | 91.4 | 90 |
Table 4.
Refractive indices of Sr:LCB crystal at different wavelengths.
| λ (nm) | nx | ny | nz | na |
|---|---|---|---|---|
| 365.015 | 1.7144263 | 1.710423 | 1.7774771 | 1.7487244 |
| 404.656 | 1.7060115 | 1.7022287 | 1.7681484 | 1.7385274 |
| 435.835 | 1.7010884 | 1.6973952 | 1.7626348 | 1.7339588 |
| 546.075 | 1.6898633 | 1.6865557 | 1.749754 | 1.7108892 |
| 587.562 | 1.6871293 | 1.6839451 | 1.7464651 | 1.7081337 |
| 643.847 | 1.6842135 | 1.6811556 | 1.7437704 | 1.7051843 |
| 706.519 | 1.6817091 | 1.6786448 | 1.7399511 | 1.7025079 |
| 852.110 | 1.6773507 | 1.6744712 | 1.7348703 | 1.6980187 |
Table 5.
Comparison of the birefringence values of LCB and Sr:LCB crystals. The birefringence values for the LCB crystal are calculated with the reported Sellmeier equation [3].
Table 5.
Comparison of the birefringence values of LCB and Sr:LCB crystals. The birefringence values for the LCB crystal are calculated with the reported Sellmeier equation [3].
| Sr:LCB | LCB | |||
|---|---|---|---|---|
| λ (nm) | nz − nx | nz − ny | nz − nx | nz − ny |
| 1064 | 0.056066 | 0.058884 | 0.053062 | 0.051884 |
| 800 | 0.057856 | 0.060776 | 0.054268 | 0.053388 |
| 700 | 0.058583 | 0.0616 | 0.054926 | 0.0542 |
| 532 | 0.060134 | 0.063467 | 0.056742 | 0.056352 |
| 400 | 0.062217 | 0.066043 | 0.059873 | 0.059636 |
| 355 | 0.062829 | 0.067398 | 0.061824 | 0.061346 |
Publisher’s Note: MDPI stays neutral with regard to jurisdictional claims in published maps and institutional affiliations. |
© 2022 by the authors. Licensee MDPI, Basel, Switzerland. This article is an open access article distributed under the terms and conditions of the Creative Commons Attribution (CC BY) license (https://creativecommons.org/licenses/by/4.0/).
Share and Cite
MDPI and ACS Style
Zhang, X.; Li, Y.; Jing, F.; Hu, Z.; Wu, Y. Studies on the Crystal Growth and Characterization of Large Size Sr:LCB Single Crystals. Crystals 2022, 12, 442. https://0-doi-org.brum.beds.ac.uk/10.3390/cryst12040442
AMA Style
Zhang X, Li Y, Jing F, Hu Z, Wu Y. Studies on the Crystal Growth and Characterization of Large Size Sr:LCB Single Crystals. Crystals. 2022; 12(4):442. https://0-doi-org.brum.beds.ac.uk/10.3390/cryst12040442
Chicago/Turabian StyleZhang, Xuliang, Yue Li, Fangli Jing, Zhanggui Hu, and Yicheng Wu. 2022. "Studies on the Crystal Growth and Characterization of Large Size Sr:LCB Single Crystals" Crystals 12, no. 4: 442. https://0-doi-org.brum.beds.ac.uk/10.3390/cryst12040442
Note that from the first issue of 2016, this journal uses article numbers instead of page numbers. See further details here.