
Macroscopic and Petrographic Analyses of the Mortars from the Roman villa of Noheda (Villar de Domingo García, Cuenca)

 ,
,
Abstract
:1. Introduction
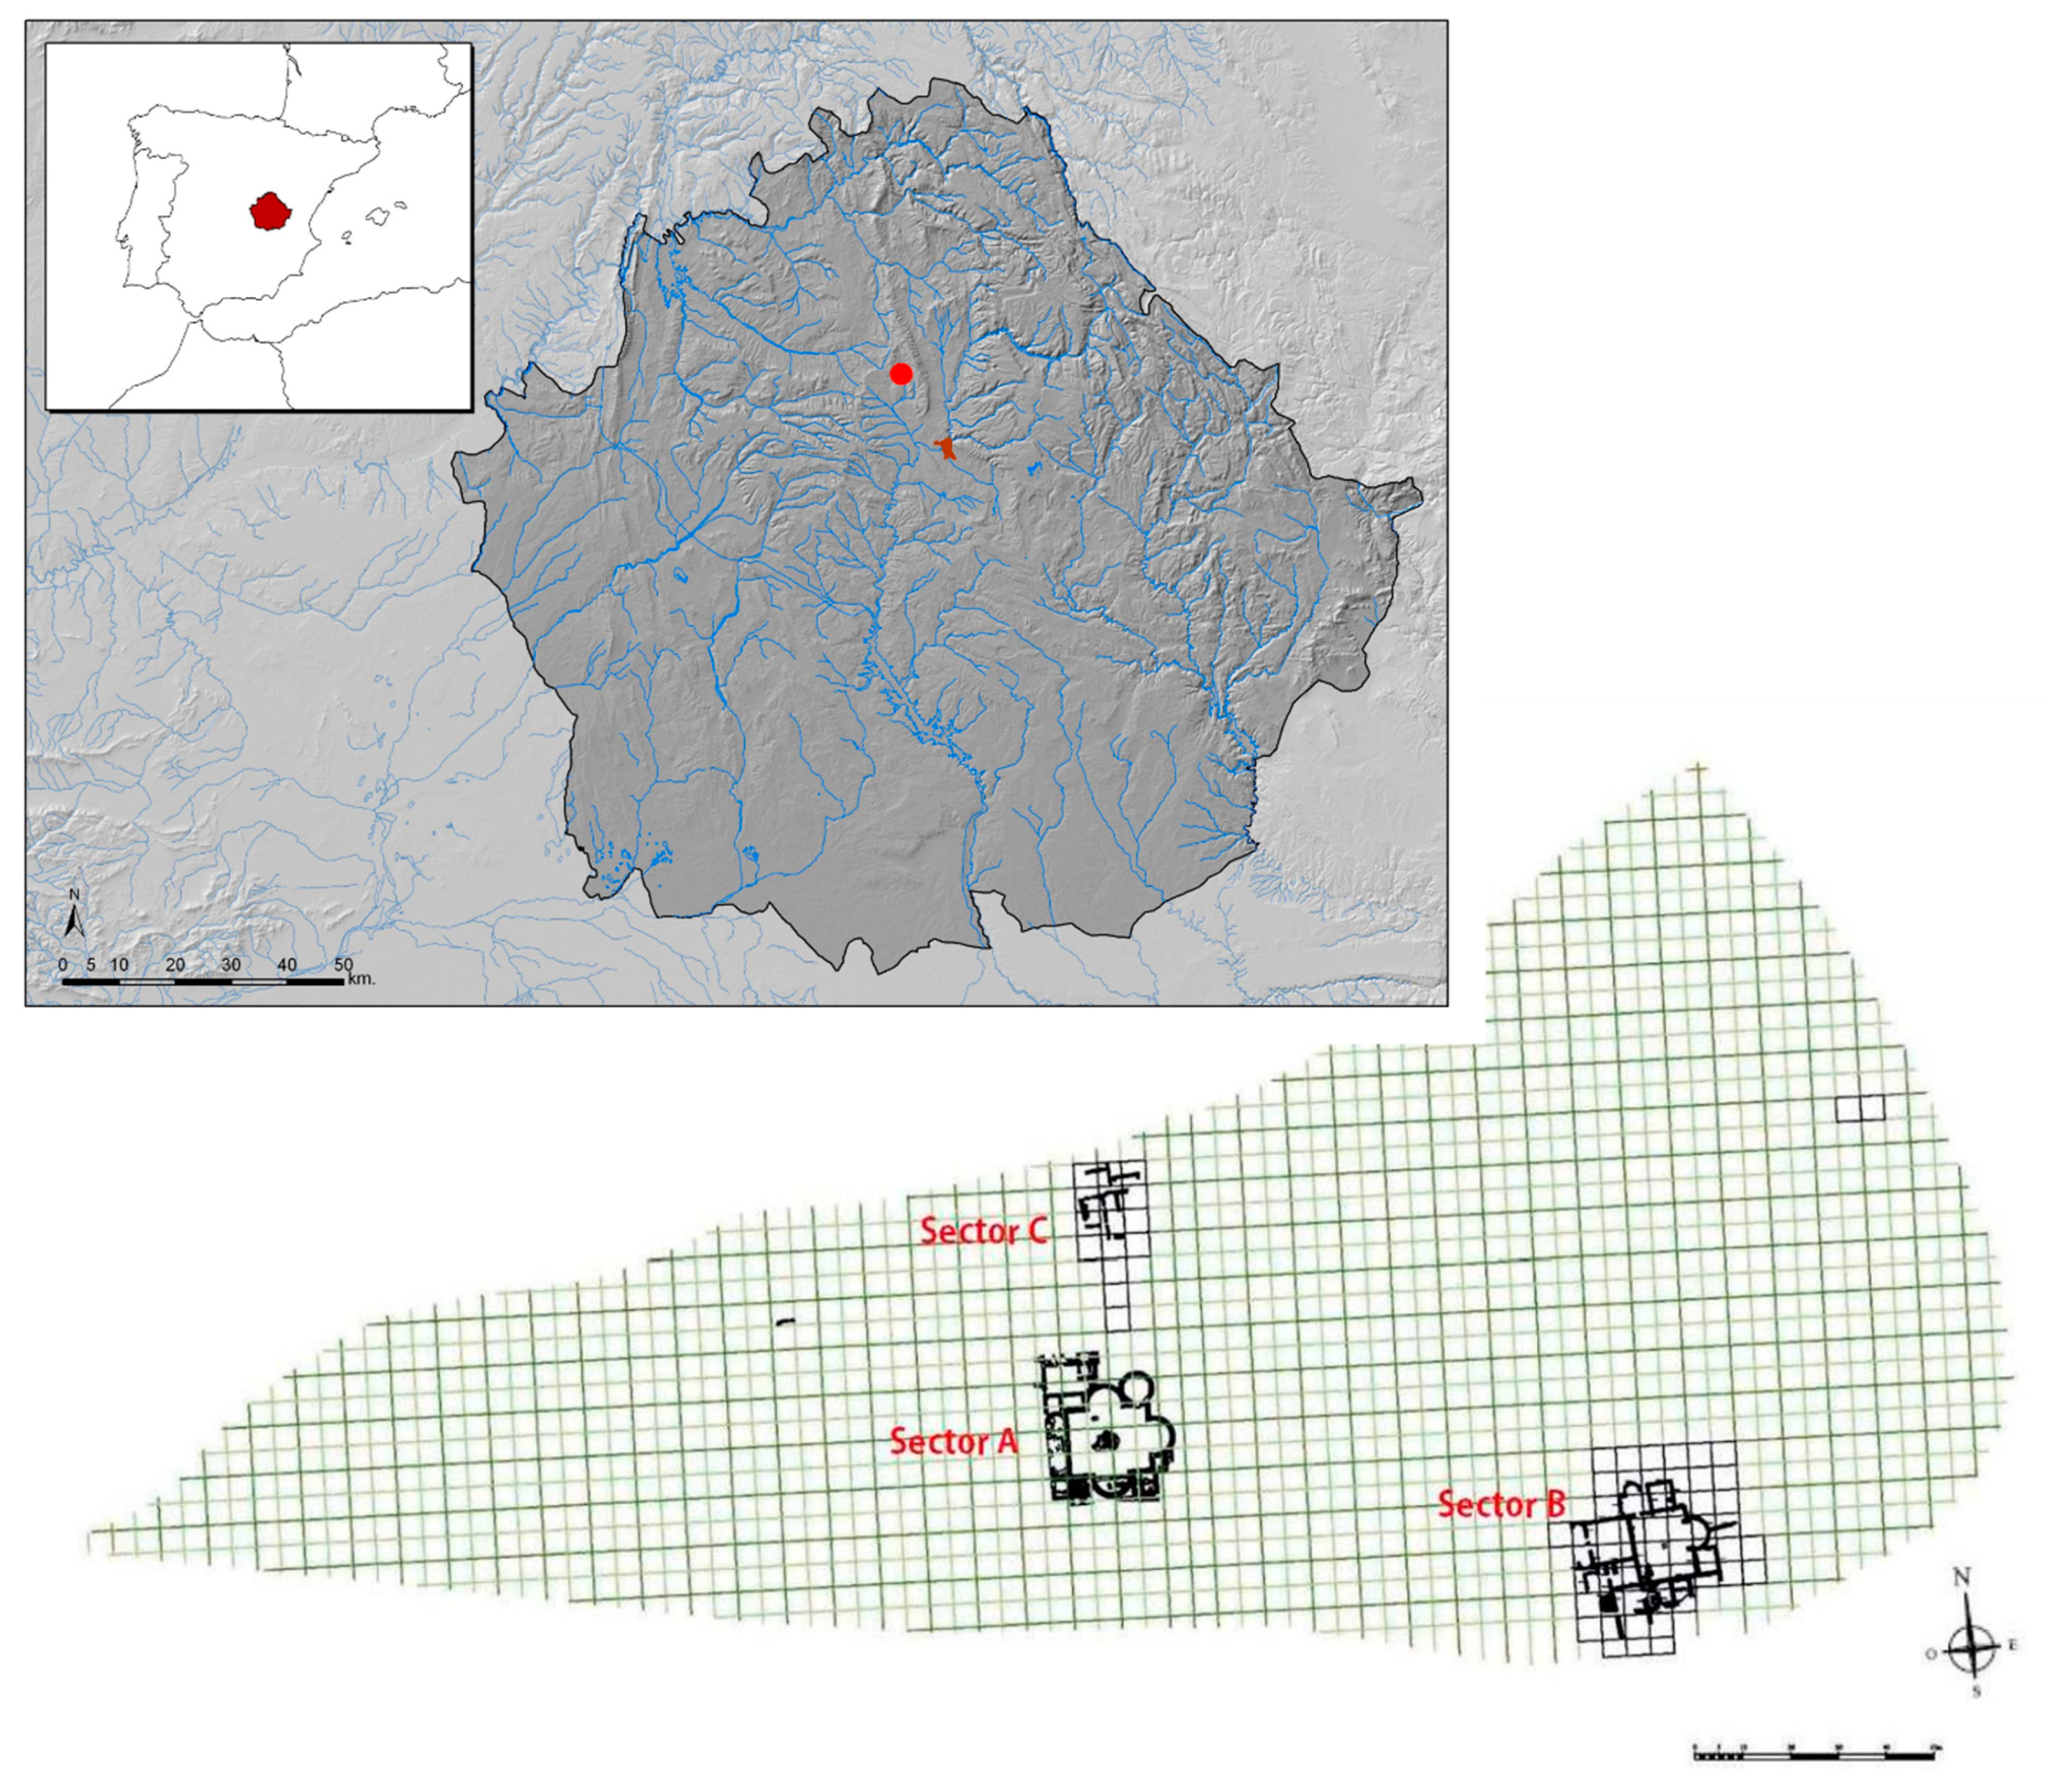
2. Samples and Sampling Points
3. Methodology
4. Results
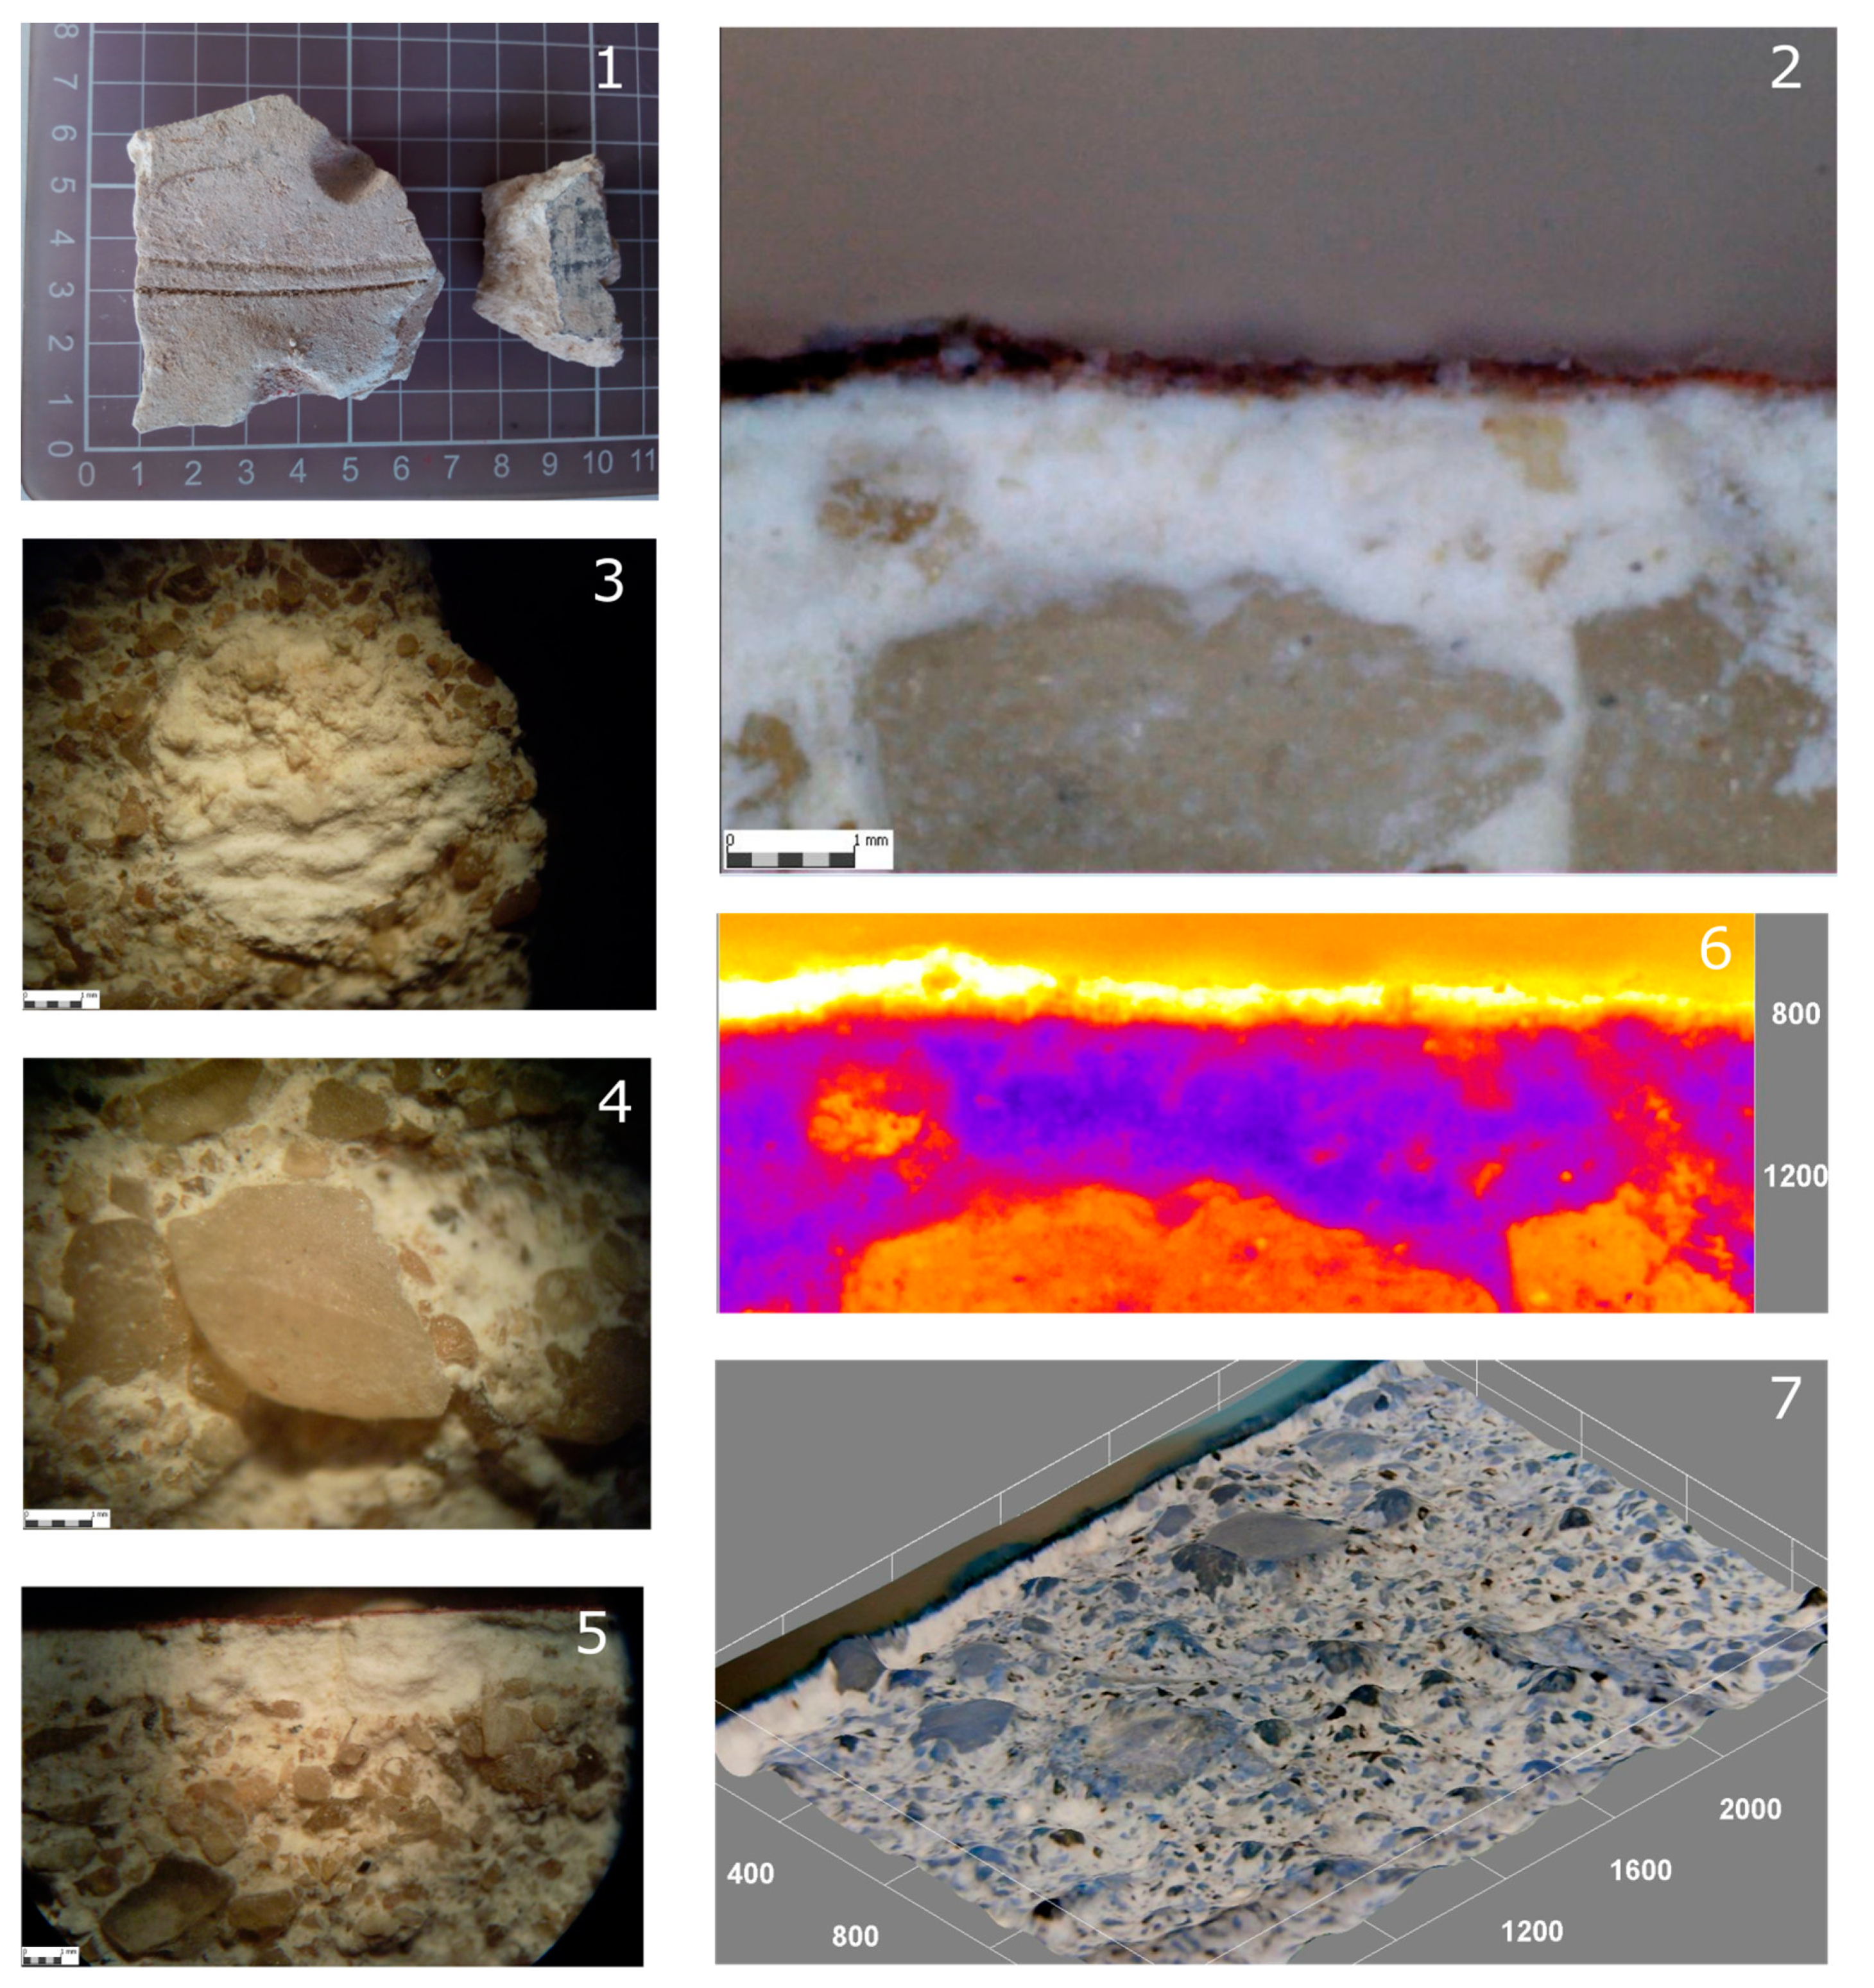
4.1. Macroscopy
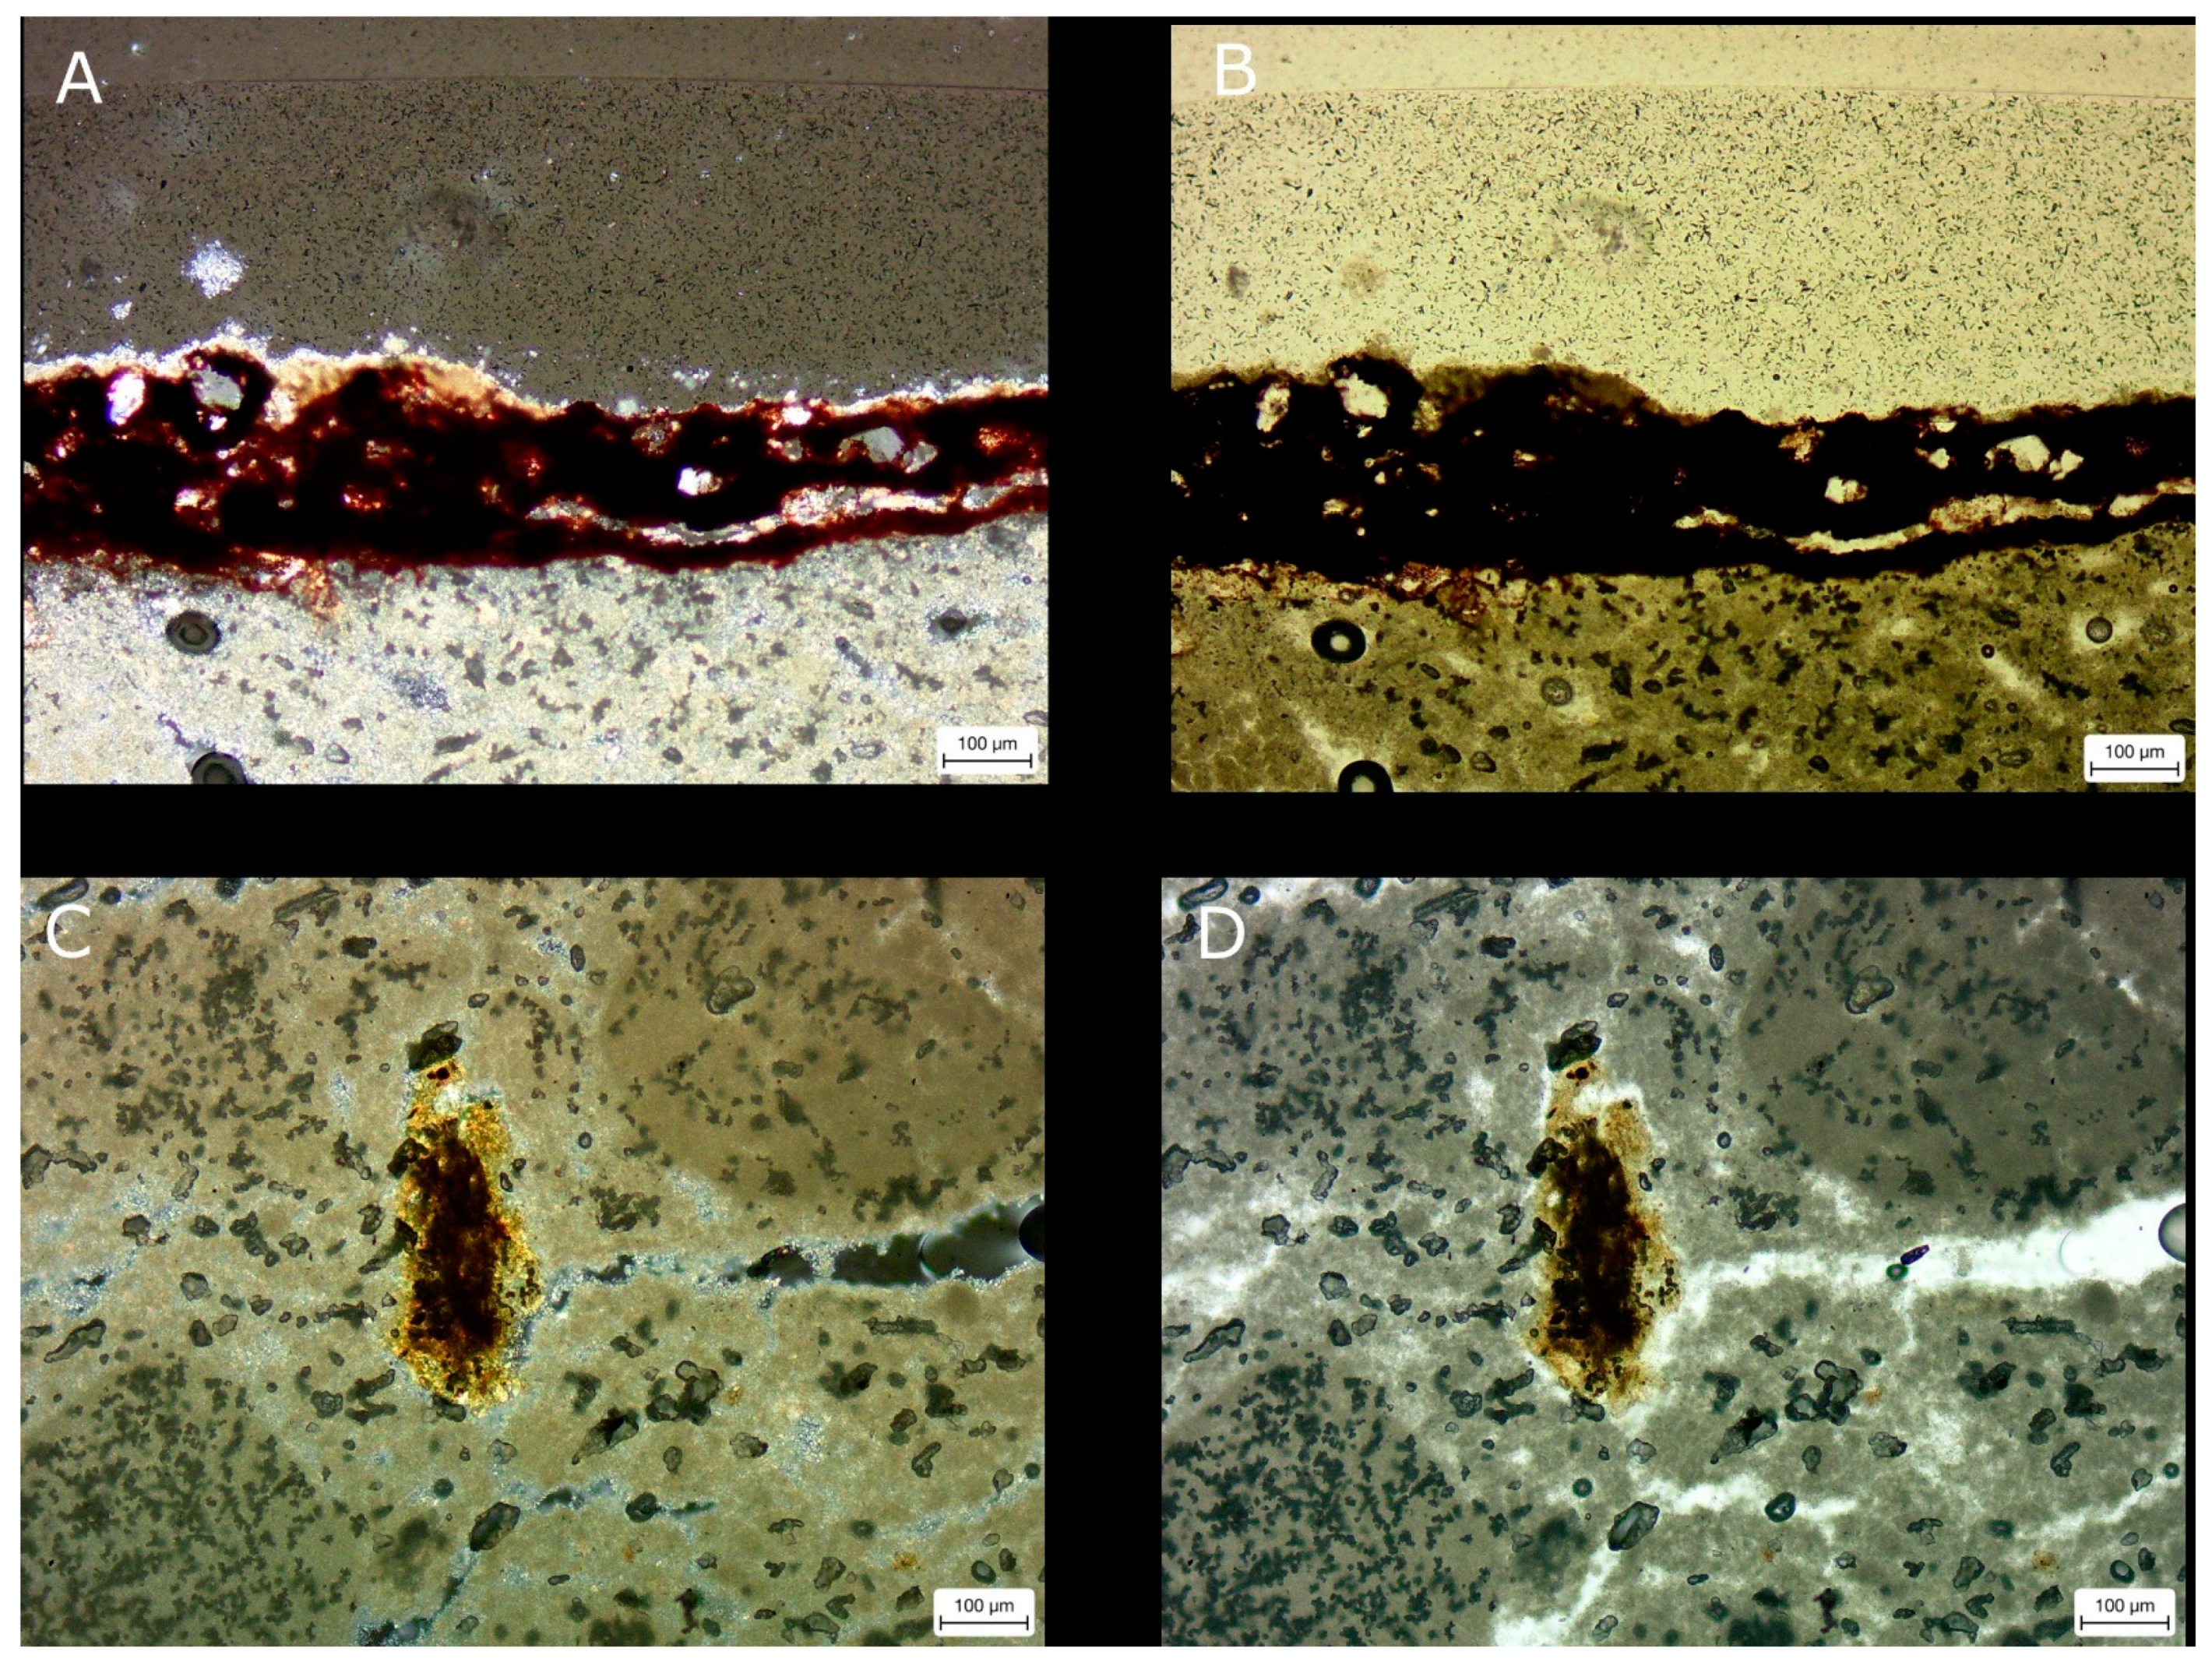
4.2. Optical Microscopy
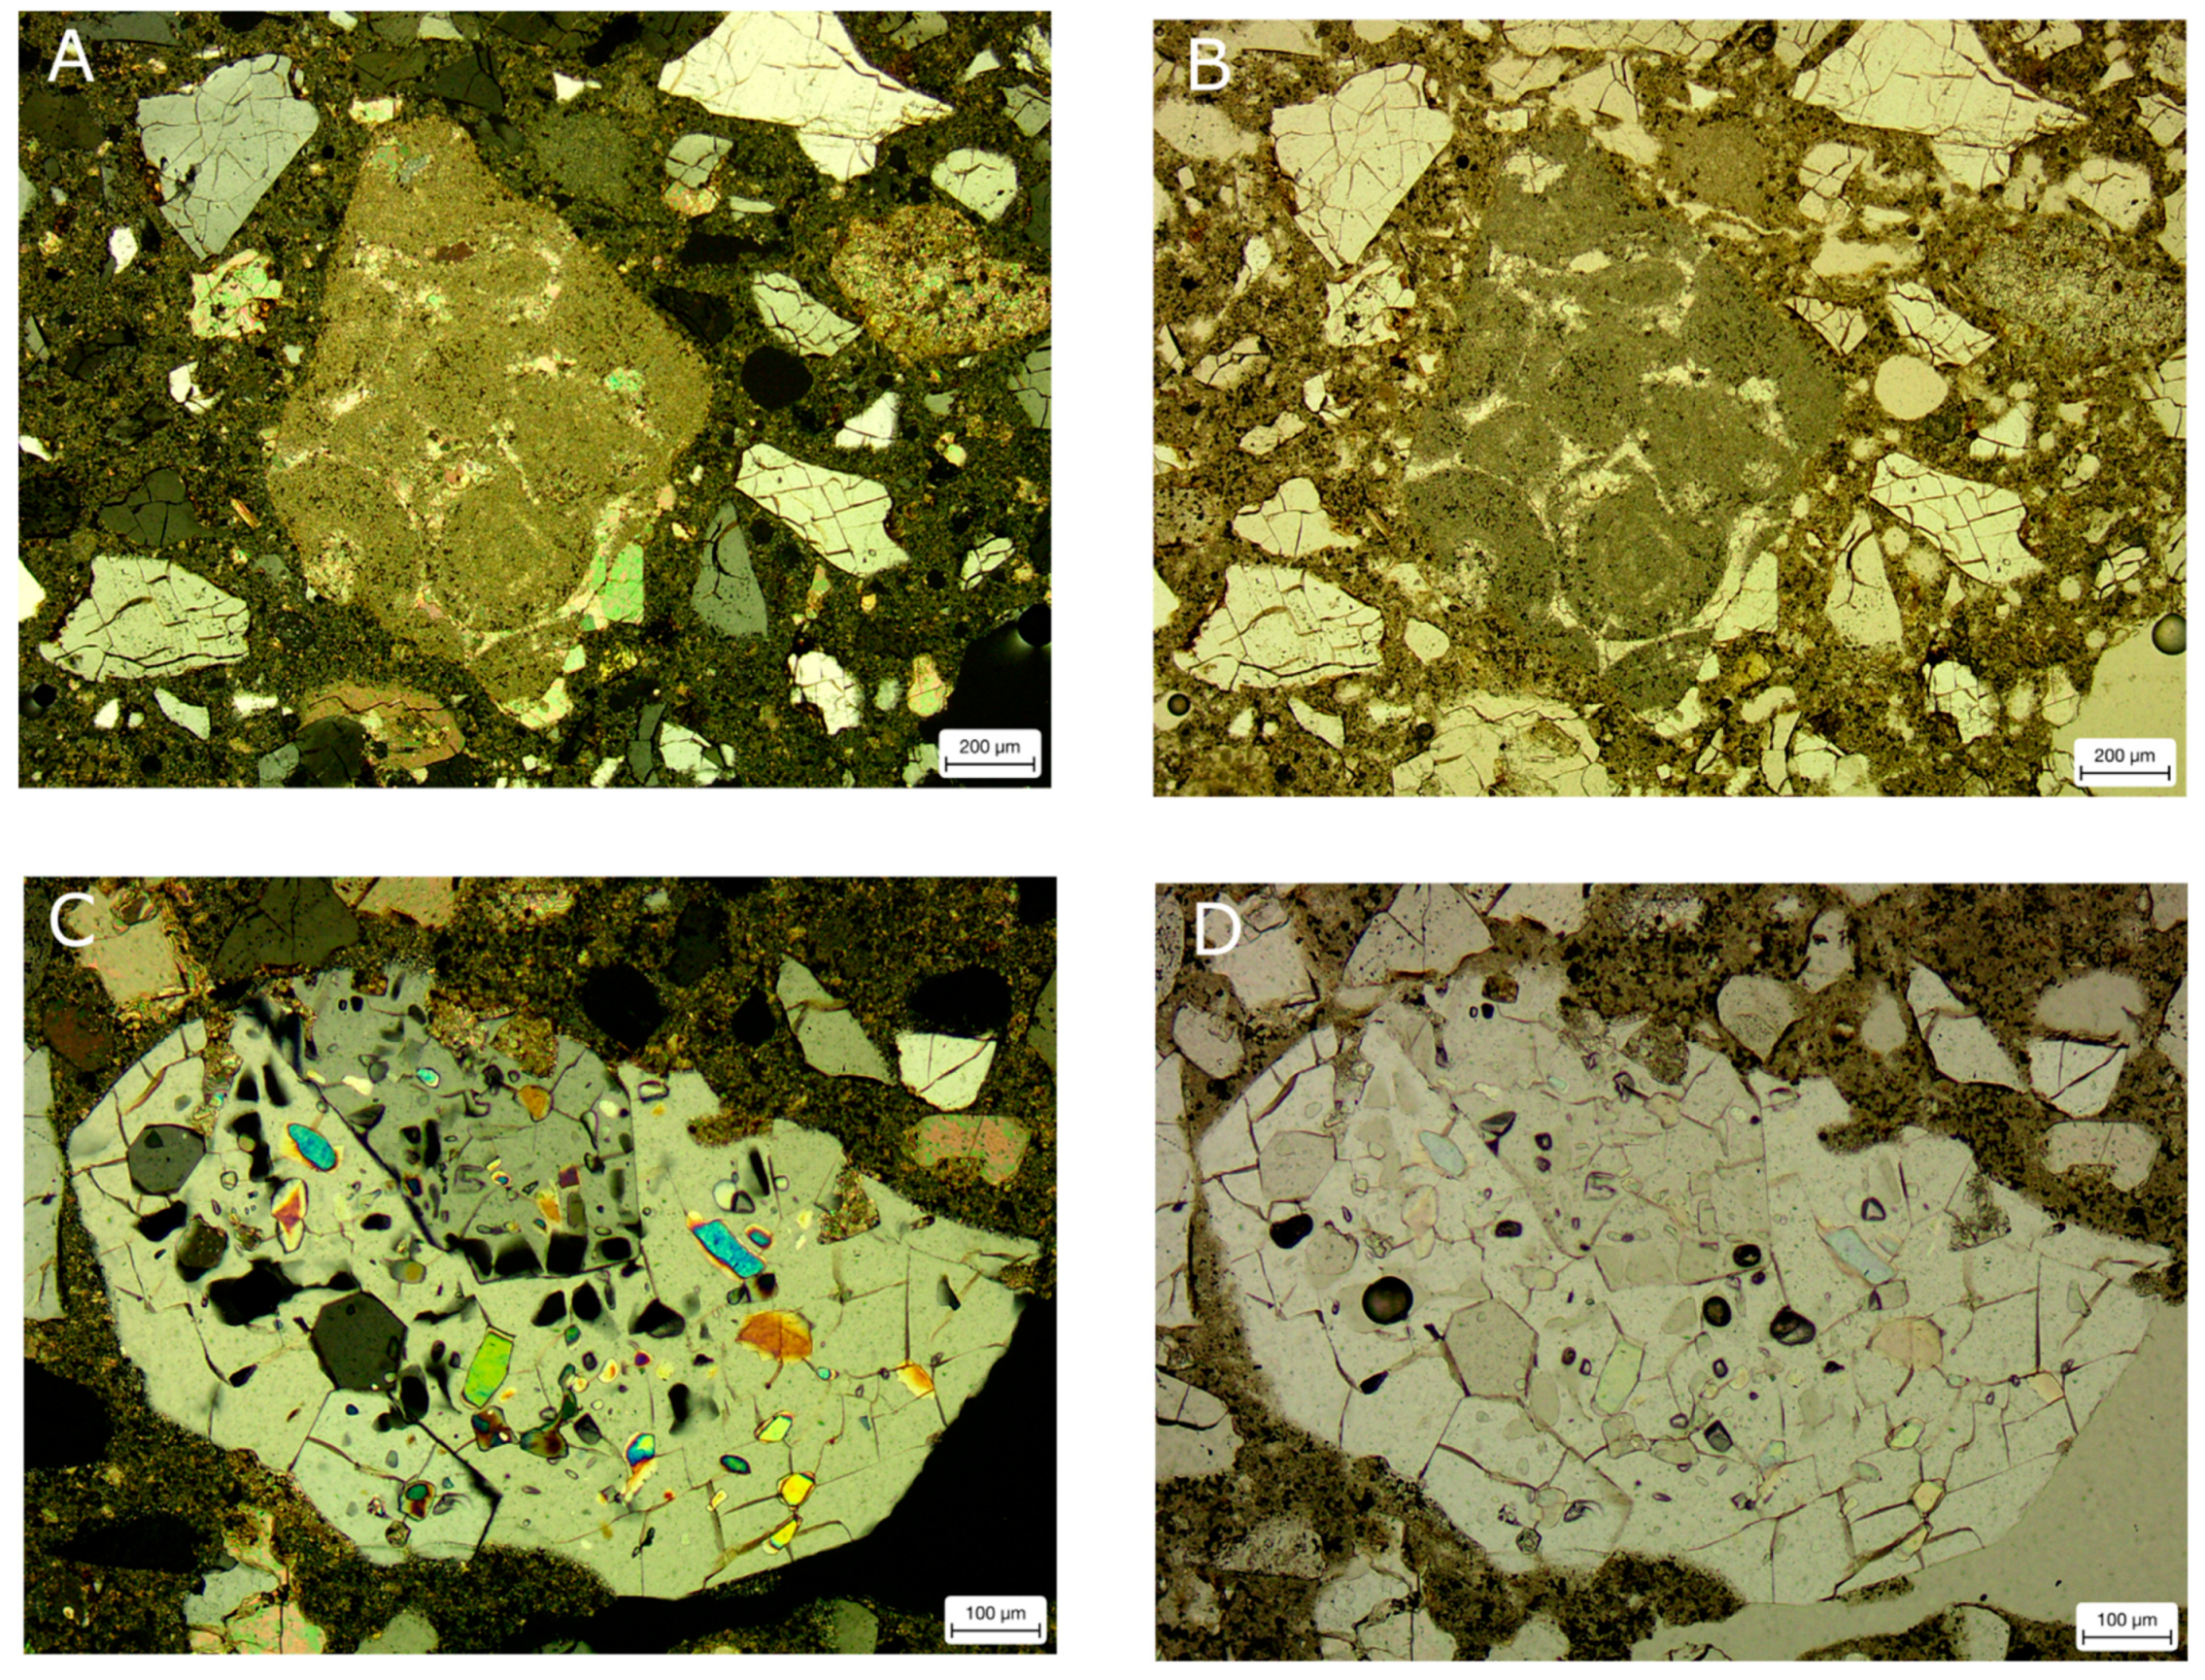
4.2.1. Sample NO1
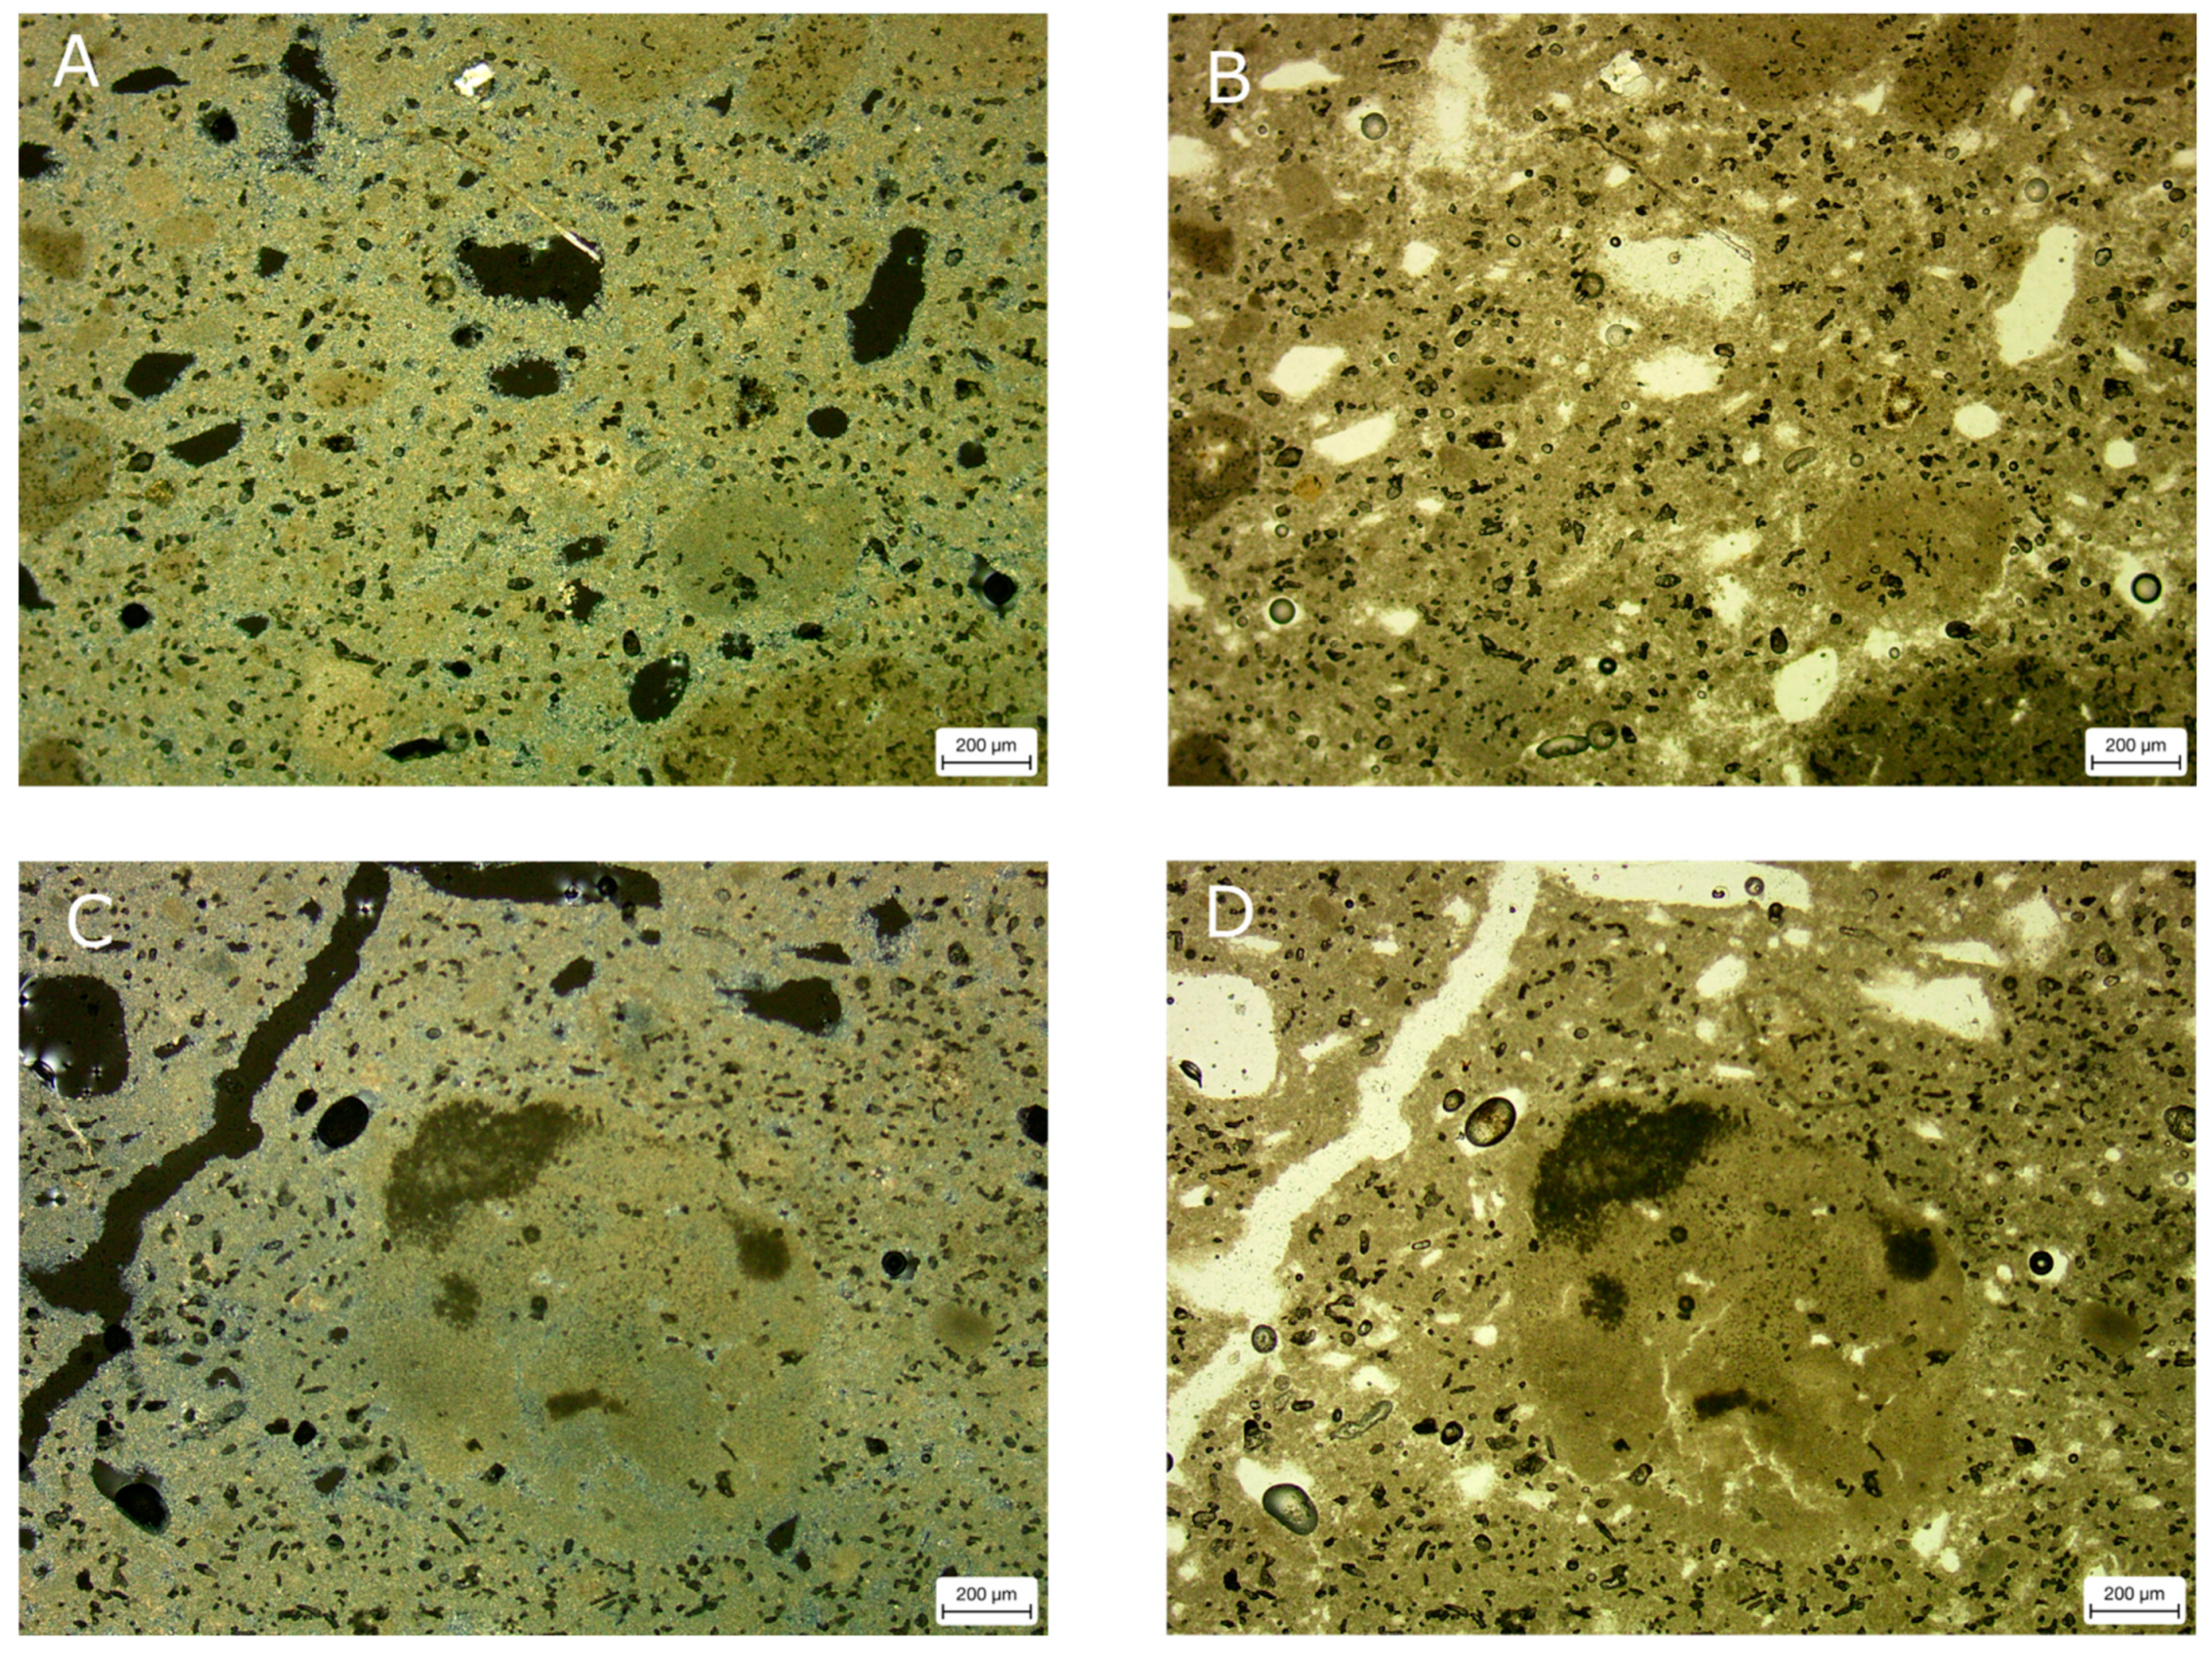
4.2.2. Sample NO2
5. Conclusions and Discussion
Author Contributions
Funding
Acknowledgments
Conflicts of Interest
References
- Coello, F. Caminos romanos de Cuenca. Boletín De La Real Acad. De La Hist. 1897, 31, 19–25. [Google Scholar]
- Santa María, J. Itinerarios romanos de la provincia de Cuenca. Boletín De La Real Acad. De La Hist. 1897, 31, 5–19. [Google Scholar]
- Larrañaga Mendia, J. Guía de Cuenca; Exma. Diputación: Cuenca, Ecuador, 1966. [Google Scholar]
- Abascal Palazón, J.M. Vías de Comunicación Romanas de la Provincia de Guadalajara; Marqués de Santillana: Guadalajara, Mexico, 1982. [Google Scholar]
- Palomero Plaza, S. Las vías romanas de la provincia de Cuenca; Diputación Provincial de Cuenca: Cuenca, Spain, 1987. [Google Scholar]
- Valero Tévar, M.A. The mosaics of the roman villa of Noheda (Villar de Domingo García, Spain). J. Roman Archaeol. 2013, 26, 307–330. [Google Scholar] [CrossRef]
- Valero Tévar, M.A. Los mosaicos de la villa romana de Noheda (Villar de Domingo García, Cuenca). In Proceedings of the XII Colloquio AIEMA, Venezia, Italy, 11–15 September 2012; pp. 439–444. [Google Scholar]
- Valero Tévar, M.A. Anthropic dynamics and vegetation landscape in the inland area of the Iberian Peninsula: New perspectives drawn from palynological studies at the villa of Noheda (Cuenca, Spain). Eur. J. Post-Class. Archaeol. 2018, 8, 219–238. [Google Scholar]
- Vera, D. Schiavitù rurale e colonato nell’Italia imperiale. Sci. Dell´Anchiquità Stor. Archaeol. Antropógica 1992, 6–7, 291–339. [Google Scholar]
- Volpe, G. Contadini, pastori e mercanti nell´Apulia tardoantica; Munera 6; Edipuglia: Bari, Italy, 1996. [Google Scholar]
- Sfameni, C. Ville residenziali nell´Italia Tardoantica; Edipuglia: Bari, Italy, 2006. [Google Scholar]
- Chavarría Arnau, A. Villas en Hispania durante la Antigüedad tardía. In Villas Tardoantiguas en el Mediterráneo Occidental; Chavarría, A., Arce, J., Brogiolo, G.P., Eds.; Consejo Superior de Investigaciones Científicas, CSIC: Madrid, Spain, 2006; pp. 17–35. [Google Scholar]
- Chavarría Arnau, A. El final de las uillae en Hispania (Siglos IV–VIII); BAT 7; Brepols Publishers: Turnhout, Belgium, 2007. [Google Scholar]
- Pensabene, P. La villa del Casale tra Tardo Antico e Medioevo alla luce dei nuovi date archaeologici: Funcioni, decorazioni e transformazioni. Rend. Della Pontif. Accad. Romana Di Archeol. 2011, 83, 141–226. [Google Scholar]
- Hidalgo Prieto, R. ¿Fue Cercadilla una villa? El problema de la función del complejo de Cercadilla en Corduba. Arch. Español De Arqueol. 2014, 87, 217–241. [Google Scholar] [CrossRef] [Green Version]
- Balmelle, C. Les Demeures Aristocratiques d´Aquitaine; Bordeaux/Paris, Suppl. à Aquitania, 10; Mémoires Ausonius, 5, 2001; HAL Open Science: Lyon, France, 2001. [Google Scholar]
- Mulvin, L. Late Roman Villas in the Danube-Balkan Region; BAR Int. Ser. 1064; British Archaeological Report; BAR Publishing: Oxford, UK, 2002. [Google Scholar]
- Chavarría, A. Villas in Hispania during the fourth and fifth Centuries. In Hispania in Late Antiquity. Current Perspectives; Bowes, K., Kulikowski, M., Eds.; Brill: Boston, MA, USA, 2005; pp. 518–555. [Google Scholar]
- Arce, J. Villae en el paisaje rural de Hispania romana durante la Antigüedad tardía. In Villas Tardoantiguas en el Mediterráneo Occidental; Chavarría, A., Arce, J., Brogiolo, G.P., Eds.; Consejo Superior de Investigaciones Científicas, CSIC: Madrid, Spain, 2006; pp. 9–15. [Google Scholar]
- Arce, J. El Último Siglo de la España Romana, 284–409; Alianza Editorial: Madrid, Spain, 2009. [Google Scholar]
- Arce, J. Campos, tierras y villae en Hispania. In Visigodos y Omeyas. El territorio; Caballero, L., Mateos, P., Cordero, T., Eds.; Instituto Arqueológico de Mérida: Mérida, Spain, 2012; pp. 21–30. [Google Scholar]
- García-Entero, V. Los Balnea Domésticos-Ámbito Rural y Urbano- en la Hispania Romana; Anejos de Archivo Español de Arqueología, XXXVII; Universidad Autónoma de Madrid: Madrid, Spain, 2005. [Google Scholar]
- Romizzi, L. Le ville tardo-antiche in Italia. In Villas Tardoantiguas en el Mediterráneo Occidental; Chavarría, A., Arce, J., y Brogiolo, G.P., Eds.; Anejos del Archivo Español de Arqueología; Universidad Autónoma de Madrid: Madrid, Spain, 2006; Volume 39, pp. 37–59. [Google Scholar]
- Hidalgo Prieto, R. El triclinium triconque del palatium de Córdoba. An. Arqueol. Cordobesa 1998, 9, 273–300. [Google Scholar] [CrossRef] [Green Version]
- Dunbabin, K.M.D. The Roman Banquet. Images of Conviviality; Cambridge University Press: Cambrige, UK, 2003. [Google Scholar]
- Mar, R.; y Verde, G. Las villas tardoantiguas: Cuestiones de tipología arquitectónica. In Las villae tardorromanas en el occidente del imperio: Arquitectura y Función; Fernández Ochoa, C., García Entero, V., y Gil Sendino, F., Eds.; Ed. Trea: Gijón, Spain, 2008; pp. 50–83. [Google Scholar]
- Arce, J. El complejo residencial tardorromano de Cercadilla, (Corduba). In Las áreas suburbanas en la ciudad histórica. Topografía, usos, función; Anales de Arqueología Cordobesa 18; Vaquerizo, D., Ed.; Universidad de Córdoba: Córdoba, Spain, 2010; pp. 397–412. [Google Scholar]
- Rossiter, J. Convivium and Villa in Late Antiquity. In Dining in a Classical Context; Slater, W.J., Ed.; University of Michigan: Ann Arbor, MI, USA, 1991; pp. 199–214. [Google Scholar]
- Volpe, G. Stibadium e convivium in una villa tardoantica (Faragola-Ascoli-Satriano). In Studi In Onore di Francesco Grelle; Silvestrini, M., Spagnuolo, T., Volpe, G., Eds.; Edipuglia: Bari, Italy, 2006; pp. 319–349. [Google Scholar]
- Valero Tévar, M.A. La iconografía del mito de Pélope e Hipodamía en la musivaria romana. Nuevas aportaciones a partir del mosaico de Noheda. An. Arqueol. Cordobesa 2016, 27, 125–160. [Google Scholar]
- Valero Tévar, M.A. La Persuasión de las Imágenes. Convivium y Escenografía del Poder en el Triclinium de la Villa Romana de Noheda; Real Academia Conquense de Artes y Letras: Cuenca, Spain, 2018. [Google Scholar]
- Hughes, J.J.; Callebaut, K. Practical sampling of historical mortars. In Proceedings of the RILEM International Workshop Historic Mortars: Characteristics and Tests; Bartos, P., Groot, C., Hughes, J.J., Eds.; RILEM: Paisley, UK, 2000; pp. 17–26. [Google Scholar]
- Guerra García, P.; Hervás Herrera, M.A. Análisis sobre los procesos de producción de materiales constructivos en la Edad del Hierro en Thuqeibah (al-Madam, Sharjah, EAU). In Nomina in Aqua Scripta, Homenaje a Joaquín María Córdoba Zoilo; Domínguez Monedero, A.J., del Cerro Linares, D., Villalba Ruiz de Toledo, F.J., Borrego Gallardo, F.L., Eds.; UAM Ediciones: Madrid, Spain, 2021; pp. 211–232. [Google Scholar]
- Adriano, P.; Santos Silva, A. Caracterização de Argamassas Antigas da Igreja de Santa Maria de Évora- Sé Catedral de Évora; Relatório LNEC, 59/06; NMM: Lisbon, Portugal, 2006; 86p. [Google Scholar]
- Antonelli, F.; Lazzarini, L.; Cancelliere, S.; Dessandier, D. Volubilis (Meknes, Morocco): Archaeometric Study of the White and Coloured Marbles Imported in the Roman Age. J. Cult. Herit. 2009, 10, 116–123. [Google Scholar] [CrossRef]
- Sitzia, F.; Beltrame, M.; Lisci, C.; Mirão, J. Micro Destructive Analysis for the Characterization of Ancient Mortars: A Case Study from the Little Roman Bath of Nora (Sardinia, Italy). Heritage 2021, 4, 2544–2562. [Google Scholar] [CrossRef]
- Grillo, V.; Rossi, F. STEM_CELL: A Software Tool for Electron Microscopy. Analysis of Crystalline Materials. Ultramicroscopy 2013, 125, 112–129. [Google Scholar] [CrossRef] [PubMed]
- Larrea, M.L.; Castro, S.M.; Bjerg, E.A. A Software Solution for Point Counting. Petrographic Thin Section Analysis as a Case Study. Arab. J. Geosci. 2014, 7, 2981–2989. [Google Scholar] [CrossRef]
- Prendes Rubiera, N. Tratamiento digital de imágenes como herramienta de evaluación y análisis en la restauración. ReCoPaR 2006, 1, 1886–2497. [Google Scholar]
- Ingham, J. Geomaterials Under the Microscope; CRC Press: Manson, IA, USA, 2010. [Google Scholar]
- Pecchioni, E.; Fratini, F.; Cantisani, E. Atlante delle Malte Antiche in Sezione Sottile al Microscopio Ottico; Nardini Editore: Florence, Italy, 2014. [Google Scholar]
- Solà-Morales, P.; Puche, J.M.; Macias, J.M.; Toldrà, J. Ensayos de nuevos análisis óptico-visuales para el análisis de estructuras arquitectónicas-patrimoniales. El uso de la reflectancia láser. In Modelos Constructivos y Urbanísticos de la Arquitectura de Hispania Definición, Evolución y Difusión del Periodo Romano a la Antigüedad Tardía; Roldan, L., Macias, J.M., Pizzo, A., Rodriguez, O., Eds.; Institut Català d’Arqueologia Clàssica: Tarragona, Spain, 2017; pp. 77–89. [Google Scholar]
- Guerra García, P. The Study of the Late Antique Structures of Egitania by Means of its Mortars. In De Ciuitas Igaeditanorum a Laŷdāniyya. Paisajes Urbanos de Idanha-a-Velha (Portugal) en Épocas Tardoantigua y Medieval; Morín de Pablos, J., Sánchez Ramos, I., Eds.; BAR Publishing: Oxford, UK, 2019; pp. 135–150. [Google Scholar]
- Angelici, E.; Grassini, S.; Fulginiti, D.; Parvis, M.; Segimiro, A. Compatibilità and Efficency of Restoration Products for Artefacts in Neapolitan Yellow Tuff, Scienza e Beni Culturali; Università degli Studi di Napoli: Bressanone, Italy, 2013. [Google Scholar]
- Borsoi, G.; Veiga, R.; Santos Silva, A. Effect of nanostructured lime-based and silica-based products on the consolidation of historical renders. In Proceedings of the 3rd Historic Mortars Conference, Glasgow, UK, 11–14 September 2013; UWS University: Glasgow, UK, 2013. [Google Scholar]
- Licchelli, M.; Weththimuni, M.; Zanchi, C. Nanoparticles for the Consolidation of Lecce Stone. In Proceedings of the Atti del XXIV Congresso Nazionale della Società Chimica Italiana, Lecce, Italy, 11–16 September 2011; Università di Parma: Parma, Italy, 2013. [Google Scholar]
- BS En 12620; Aggregates for Concretes. British Standards Institution: London, UK, 2002.


| Num. | Location | Place | Type |
|---|---|---|---|
| NO1 | North Exedra | - | Mortar slab with painting of frescoes |
| NO2 | Pit 1 | UE 3 | Subsample 1: Plastered mortar board with decorative incisions |
| Subsample 2: Mortar board with painting of frescoes | |||
| NO3 | Pit 9 | UE 21 | Mortar slab with simple coating |
| NO4 | Pit 13 | UE 9 | Mortar slab coating with decorative incisions |
| NO5 | Pit 21 | UE 2 | Mosaic slab with tessellate and bedding mortar |
| NO6 | Room C West Side of South Exedra | Skirting | Mortar slab with plain coating |
| NO7 | Room I West Side of North Exedra | Wall painting | Mortar slab with painted coating |
| Sample | Binder | Aggregate | Granulometry (Type) | Distribution | Raymond-Class |
|---|---|---|---|---|---|
| NO1 | Lime | Siliceous and Calcareous | Medium Mortar | Regular Pseudo-isodome | Sub-rounded Sub-angular |
| NO2 (I) | Lime | Siliceous | Very fine Mortar | Regular Isodome | Sub-rounded Rounded |
| NO2 (II) | Lime | Siliceous and Calcareous | Medium Mortar | Irregular Pseudo-isodome | Sub-rounded Rounded |
| NO3 | Lime | Siliceous and Calcareous | Fine-medium Mortar | Irregular Pseudo-isodome | Sub-angular Angular |
| NO4 | Lime | Siliceous and Calcareous | Medium Mortar | Regular Pseudo-isodome | Sub-angular Sub-rounded |
| NO5 | Lime | Siliceous and Calcareous | Fine Mortar | Regular Isodome | Sub-rounded Rounded |
| NO6 | Lime | Siliceous and Calcareous | Medium Concrete | Regular Pseudo-isodome | Sub-angular Sub-rounded |
| NO7 | Lime | Siliceous and Calcareous | Fine-medium Mortar | Irregular Pseudo-isodome | Sub-angular Angular |
| Sample | NO1 | NO2 | NO3 | NO4 | NO5 | NO6 | NO7 |
|---|---|---|---|---|---|---|---|
| Arriccio (first layer) | 3–10 | 2–8 | 2–4 | 3–5 | - | 4–6 | 3–6 |
| Intonaco (second layer) | 0.5–1 | 0.5–1.5 | 0.5–1 | 2–4 | - | 2–4 | 1–2 |
| Pictorial | <0.5 | <0.5 | - | - | - | - | <0.5 |
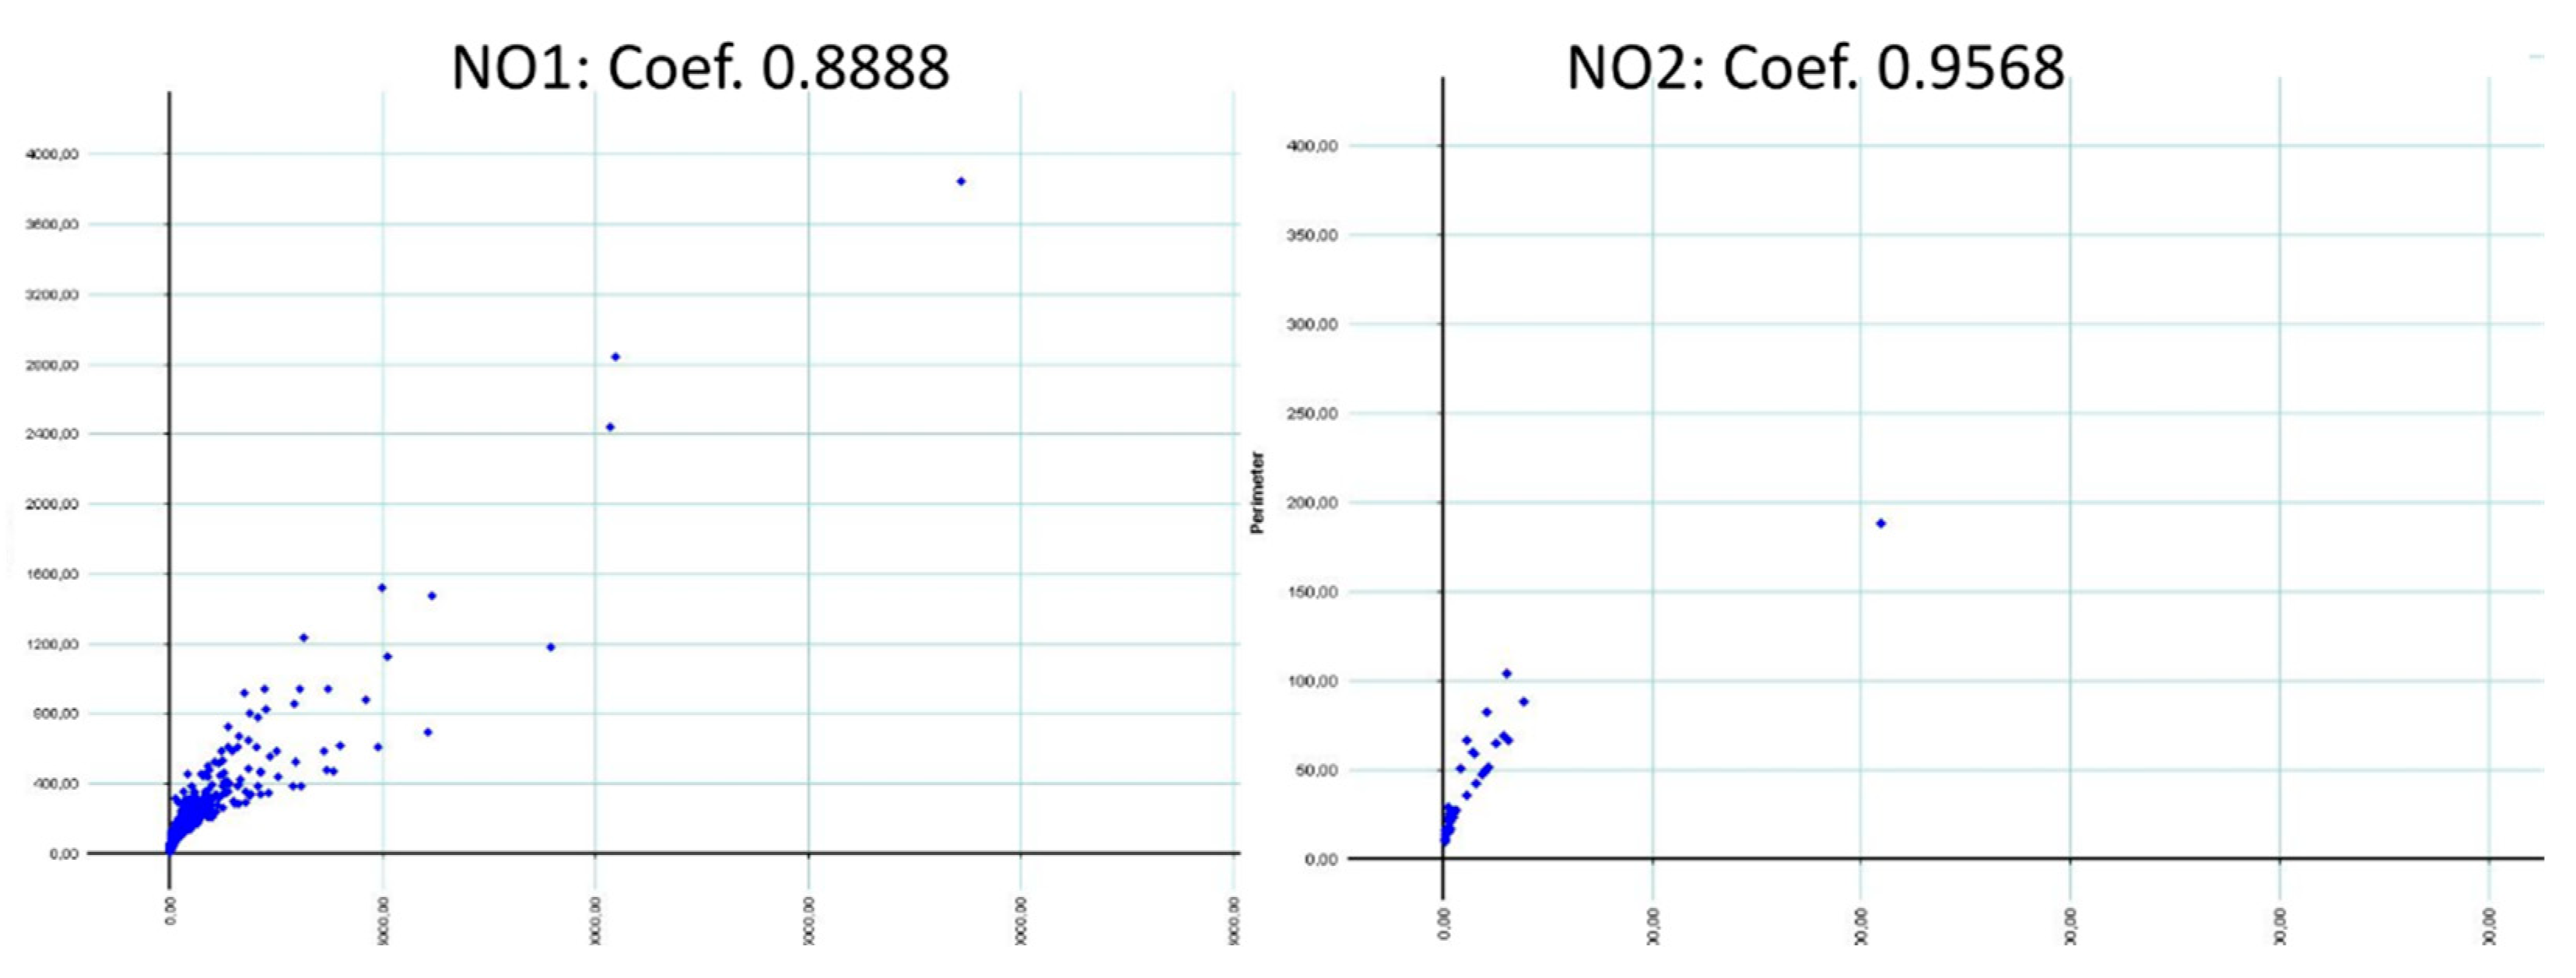
| Sample | NO1 | NO2 | NO3 | NO4 | NO5 | NO6 | NO7 |
|---|---|---|---|---|---|---|---|
| Coeff. | 0.8888 | 0.9568 | 0.8947 | 0.9236 | 0.9626 | 0.9786 | 0.9159 |
Publisher’s Note: MDPI stays neutral with regard to jurisdictional claims in published maps and institutional affiliations. |
© 2022 by the authors. Licensee MDPI, Basel, Switzerland. This article is an open access article distributed under the terms and conditions of the Creative Commons Attribution (CC BY) license (https://creativecommons.org/licenses/by/4.0/).
Share and Cite
Valero Tévar, M.Á.; Moreno Paredes, X.; Guerra García, P.; Arroyo Rey, X.; Valverde Gascueña, N. Macroscopic and Petrographic Analyses of the Mortars from the Roman villa of Noheda (Villar de Domingo García, Cuenca). Crystals 2022, 12, 606. https://0-doi-org.brum.beds.ac.uk/10.3390/cryst12050606
Valero Tévar MÁ, Moreno Paredes X, Guerra García P, Arroyo Rey X, Valverde Gascueña N. Macroscopic and Petrographic Analyses of the Mortars from the Roman villa of Noheda (Villar de Domingo García, Cuenca). Crystals. 2022; 12(5):606. https://0-doi-org.brum.beds.ac.uk/10.3390/cryst12050606
Chicago/Turabian StyleValero Tévar, Miguel Ángel, Xoan Moreno Paredes, Pablo Guerra García, Xabier Arroyo Rey, and Nelia Valverde Gascueña. 2022. "Macroscopic and Petrographic Analyses of the Mortars from the Roman villa of Noheda (Villar de Domingo García, Cuenca)" Crystals 12, no. 5: 606. https://0-doi-org.brum.beds.ac.uk/10.3390/cryst12050606