
Microstructural, Mechanical and Wear Properties of Al–1.3%Si Alloy as Compared to Hypo/Hyper–Eutectic Compositions in Al–Si Alloy System


Abstract
:1. Introduction
2. Experimental Procedure
3. Results and Discussion
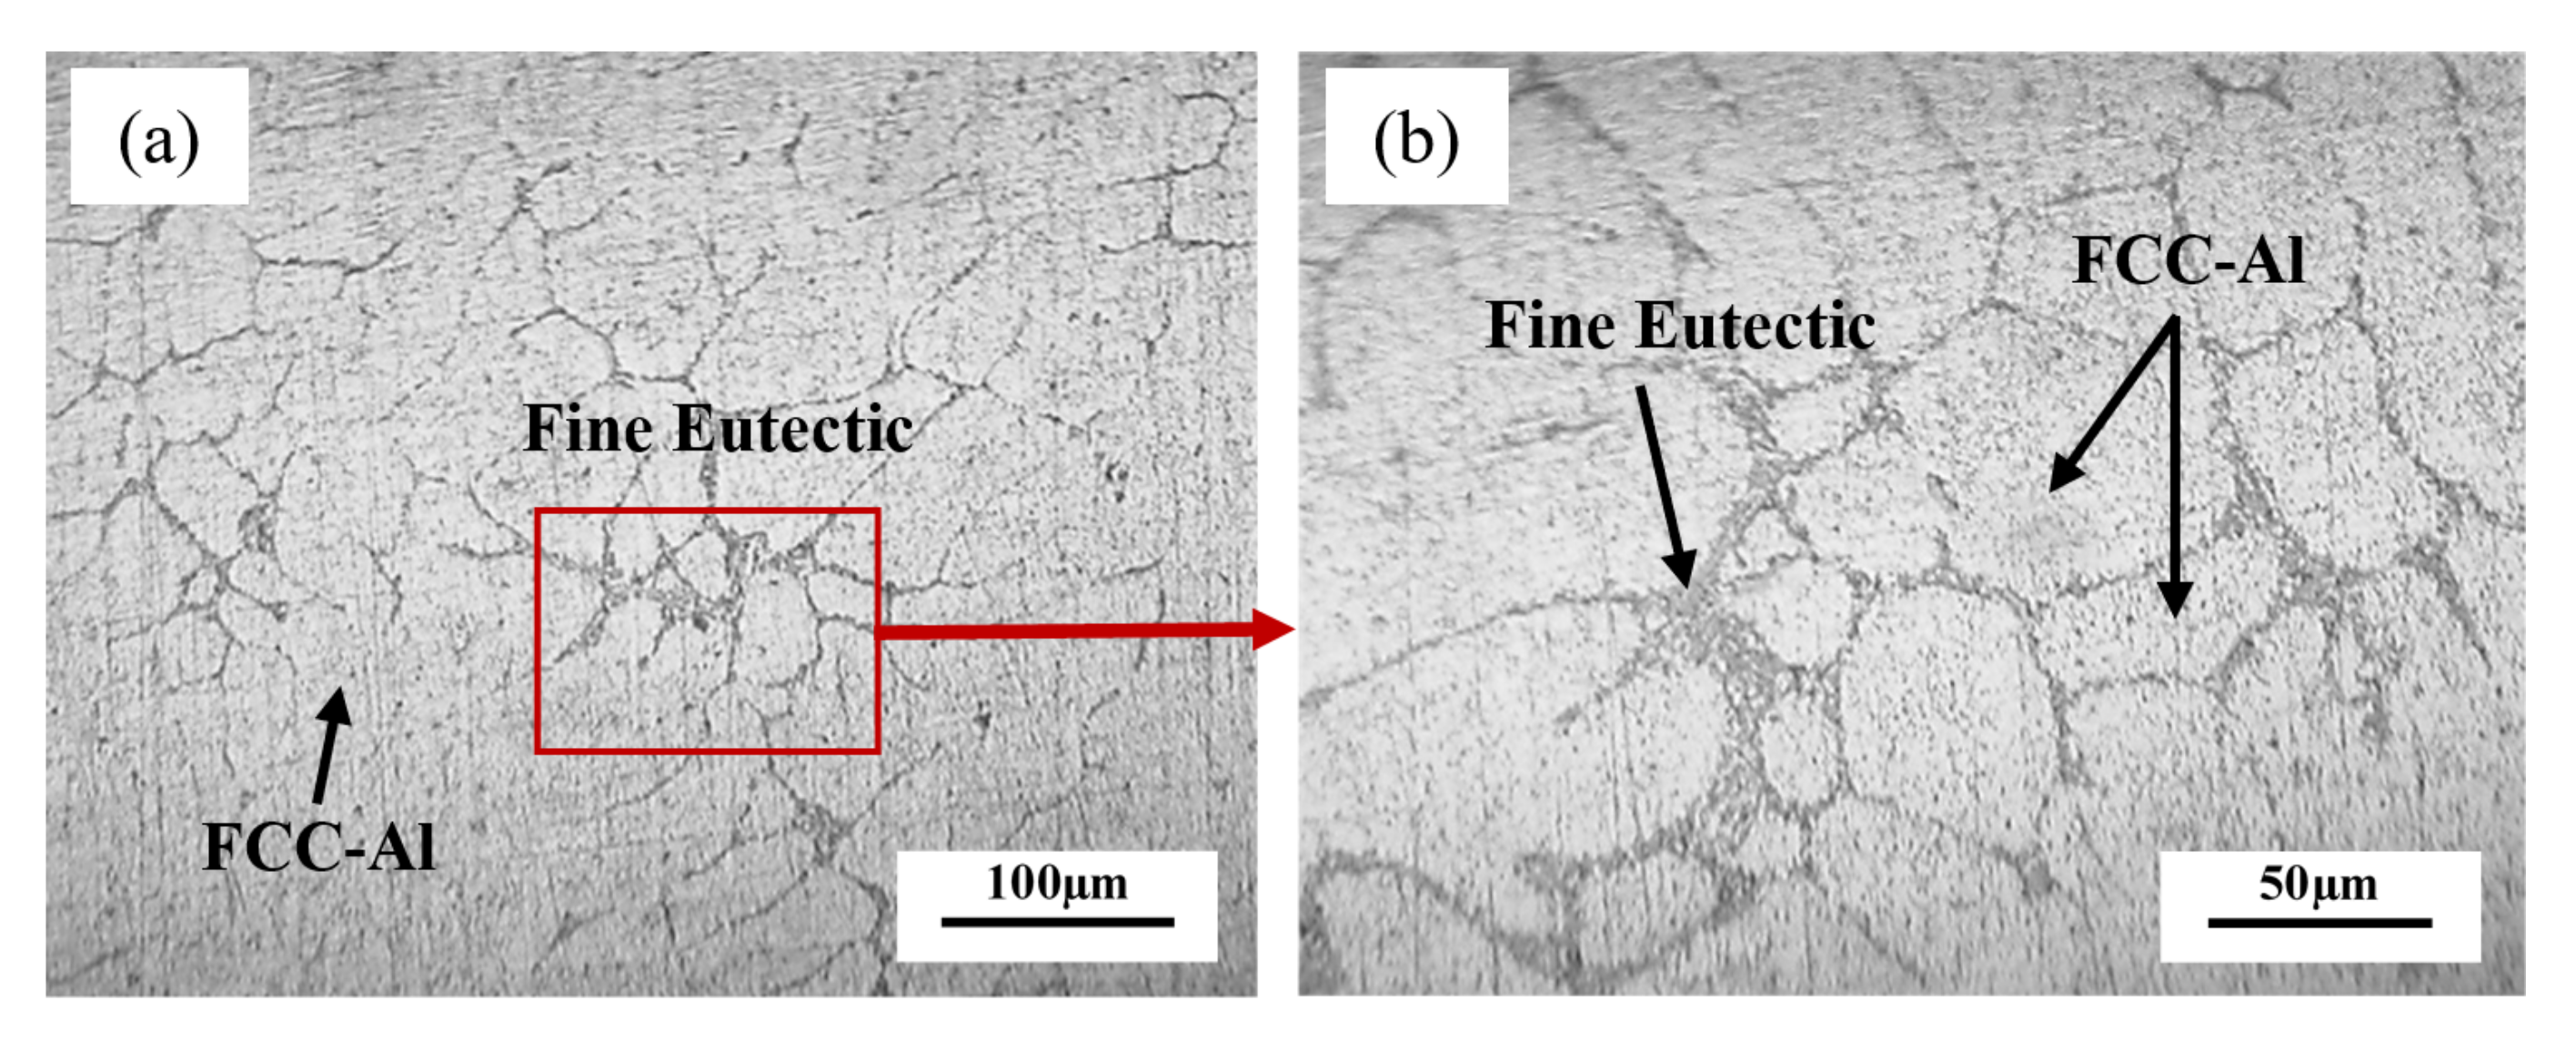
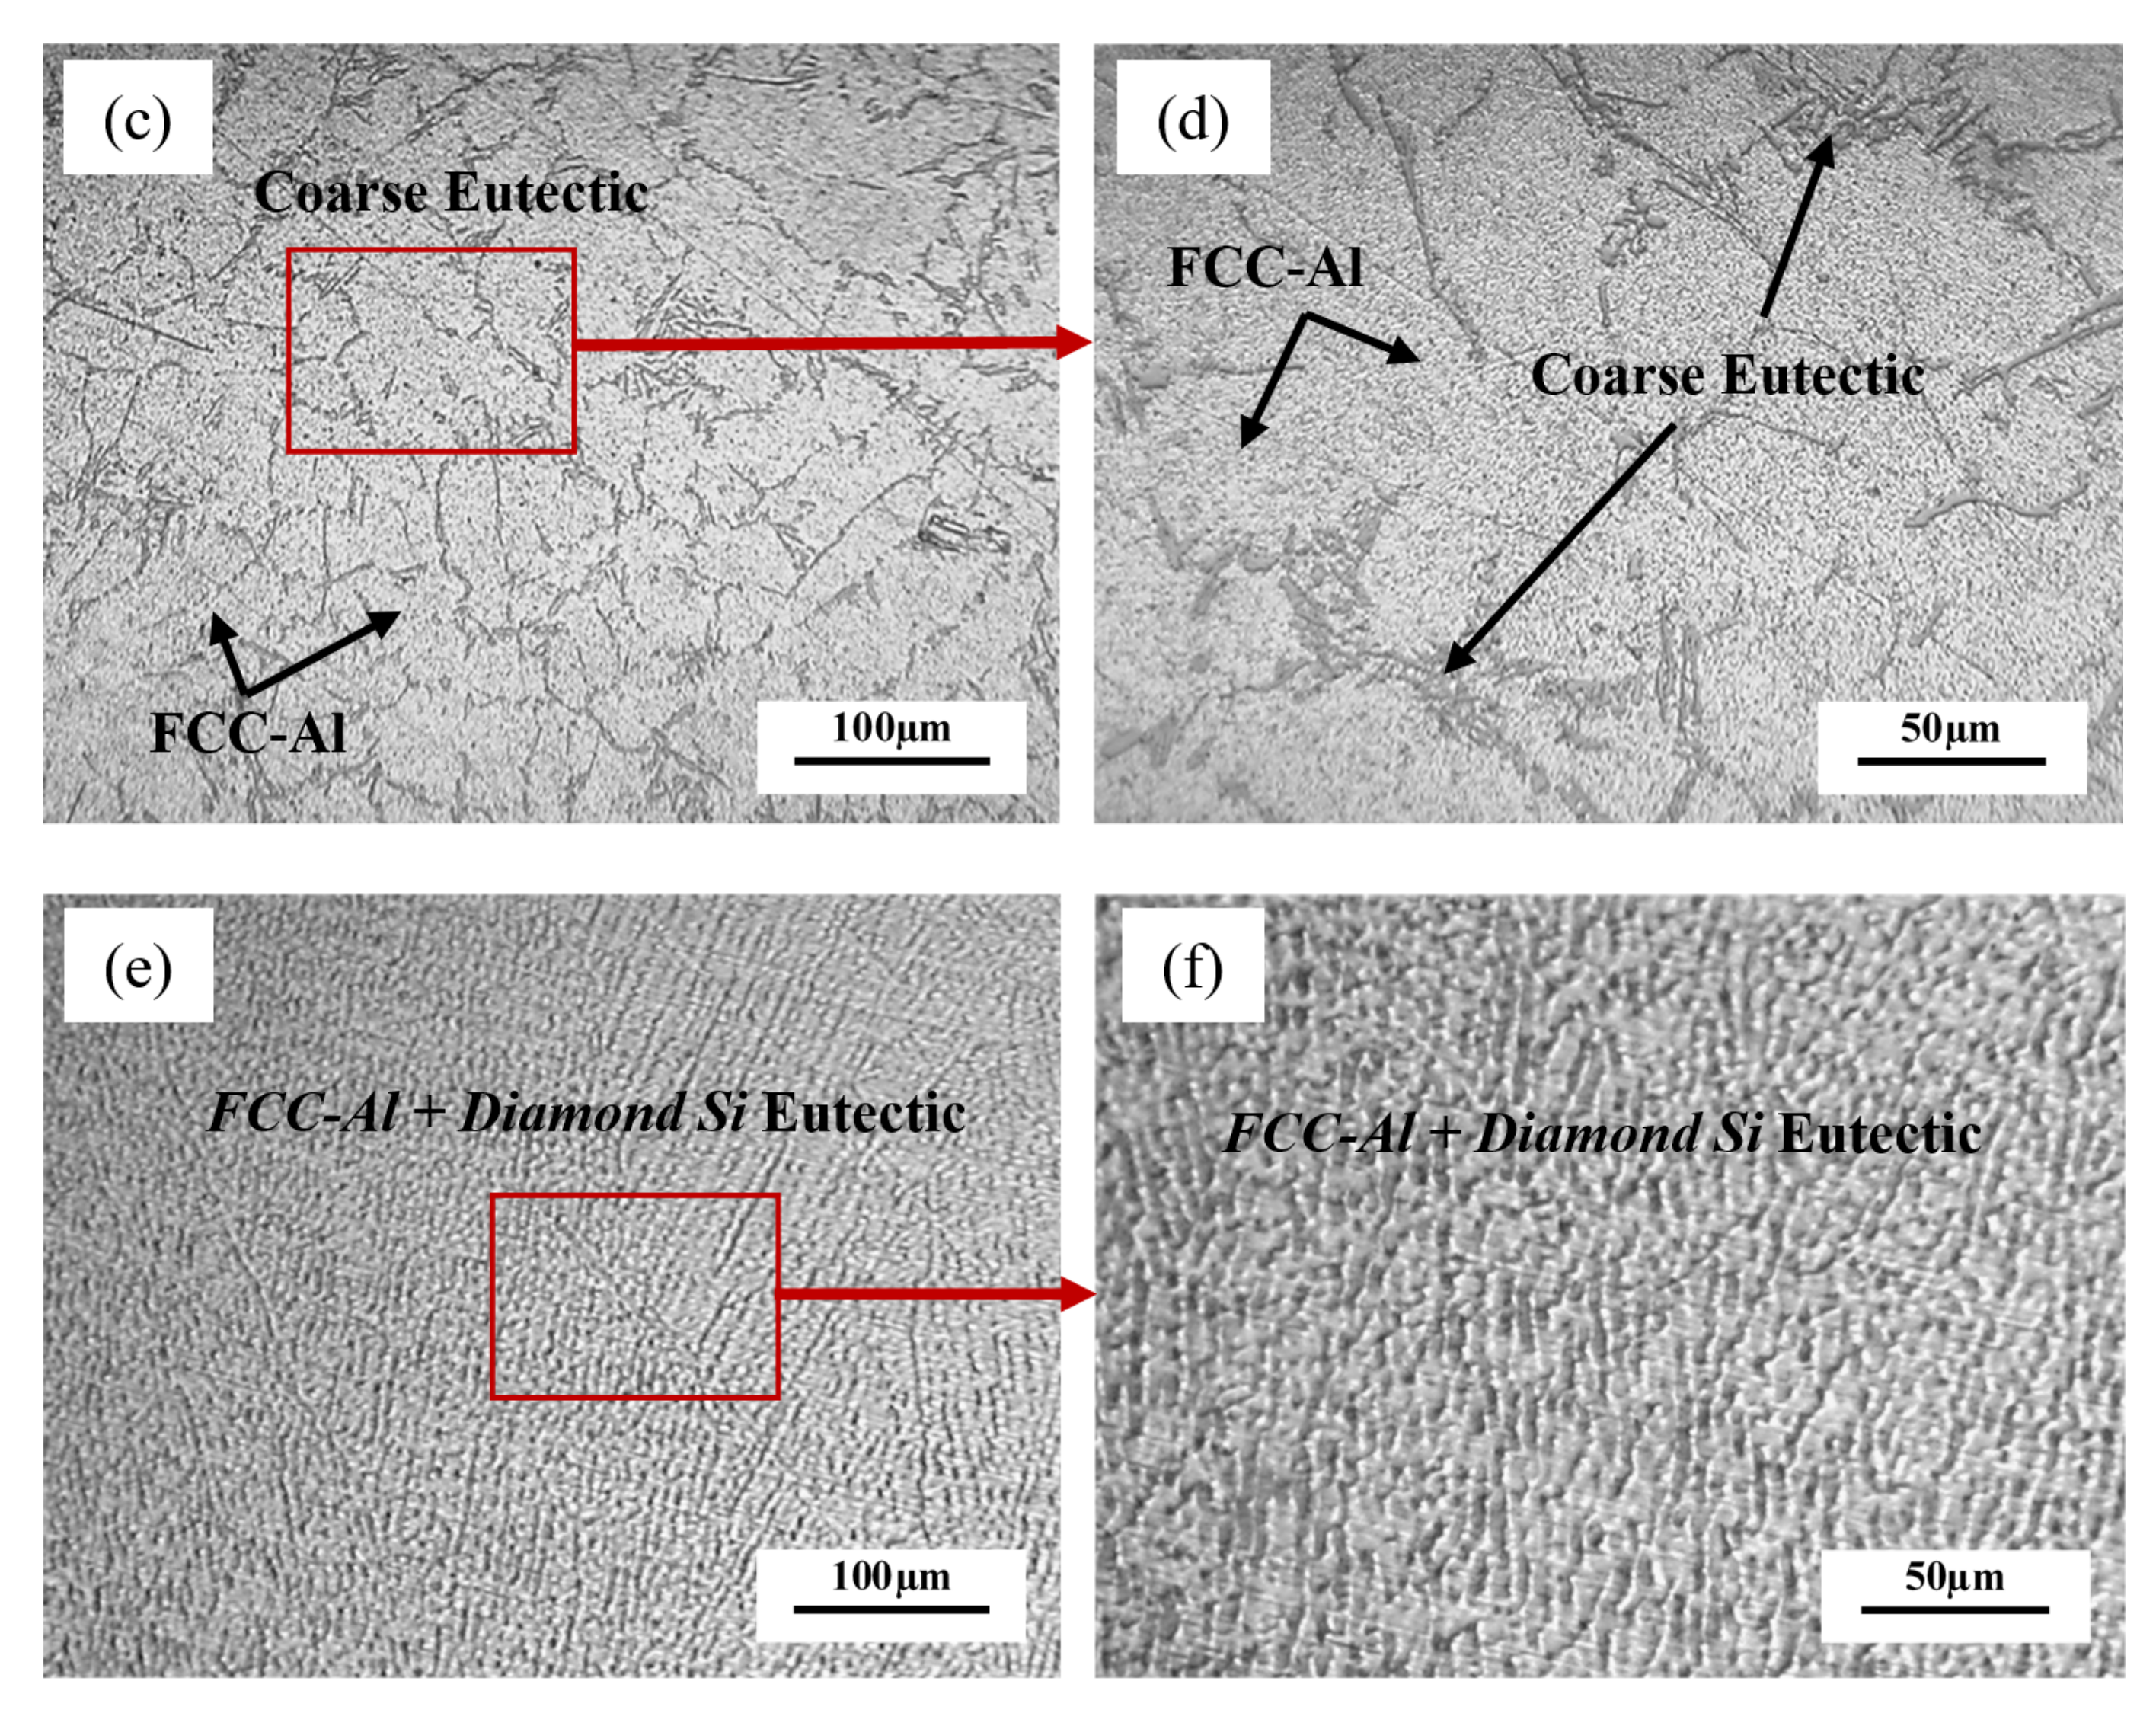
3.1. Microstructure Analysis
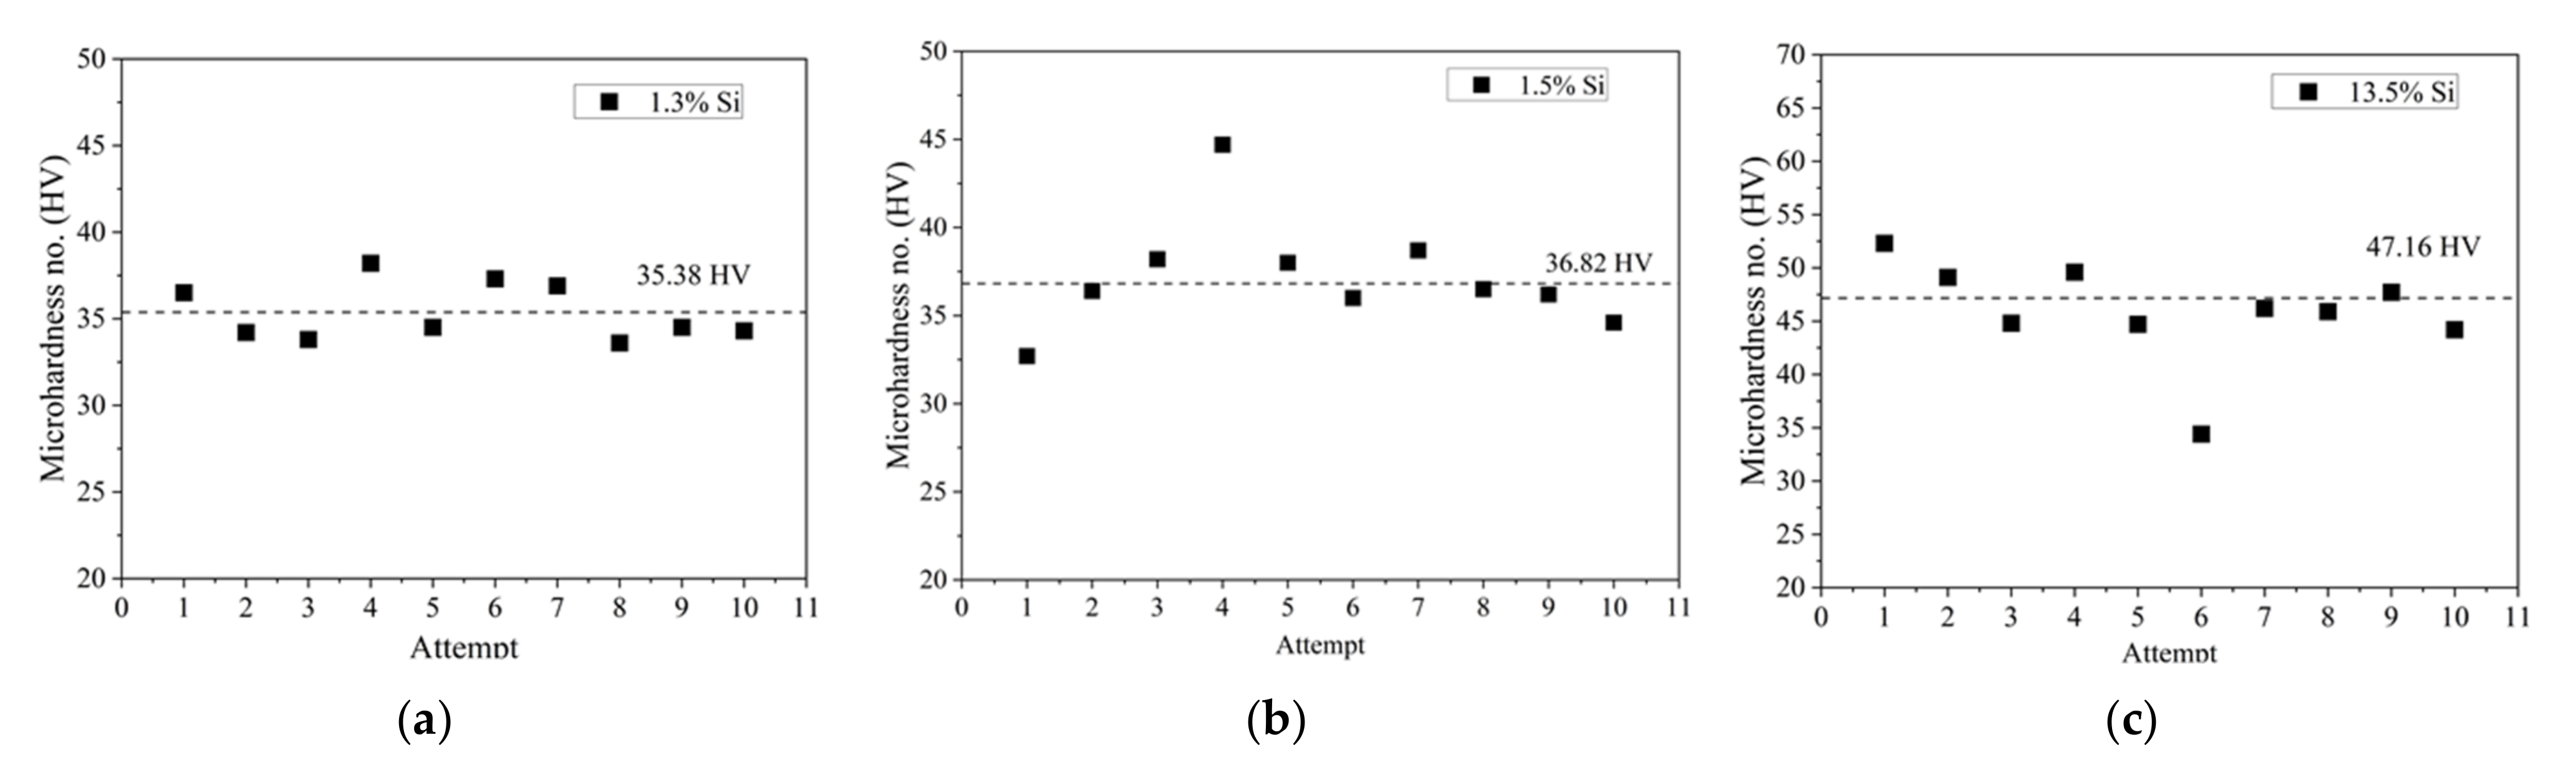
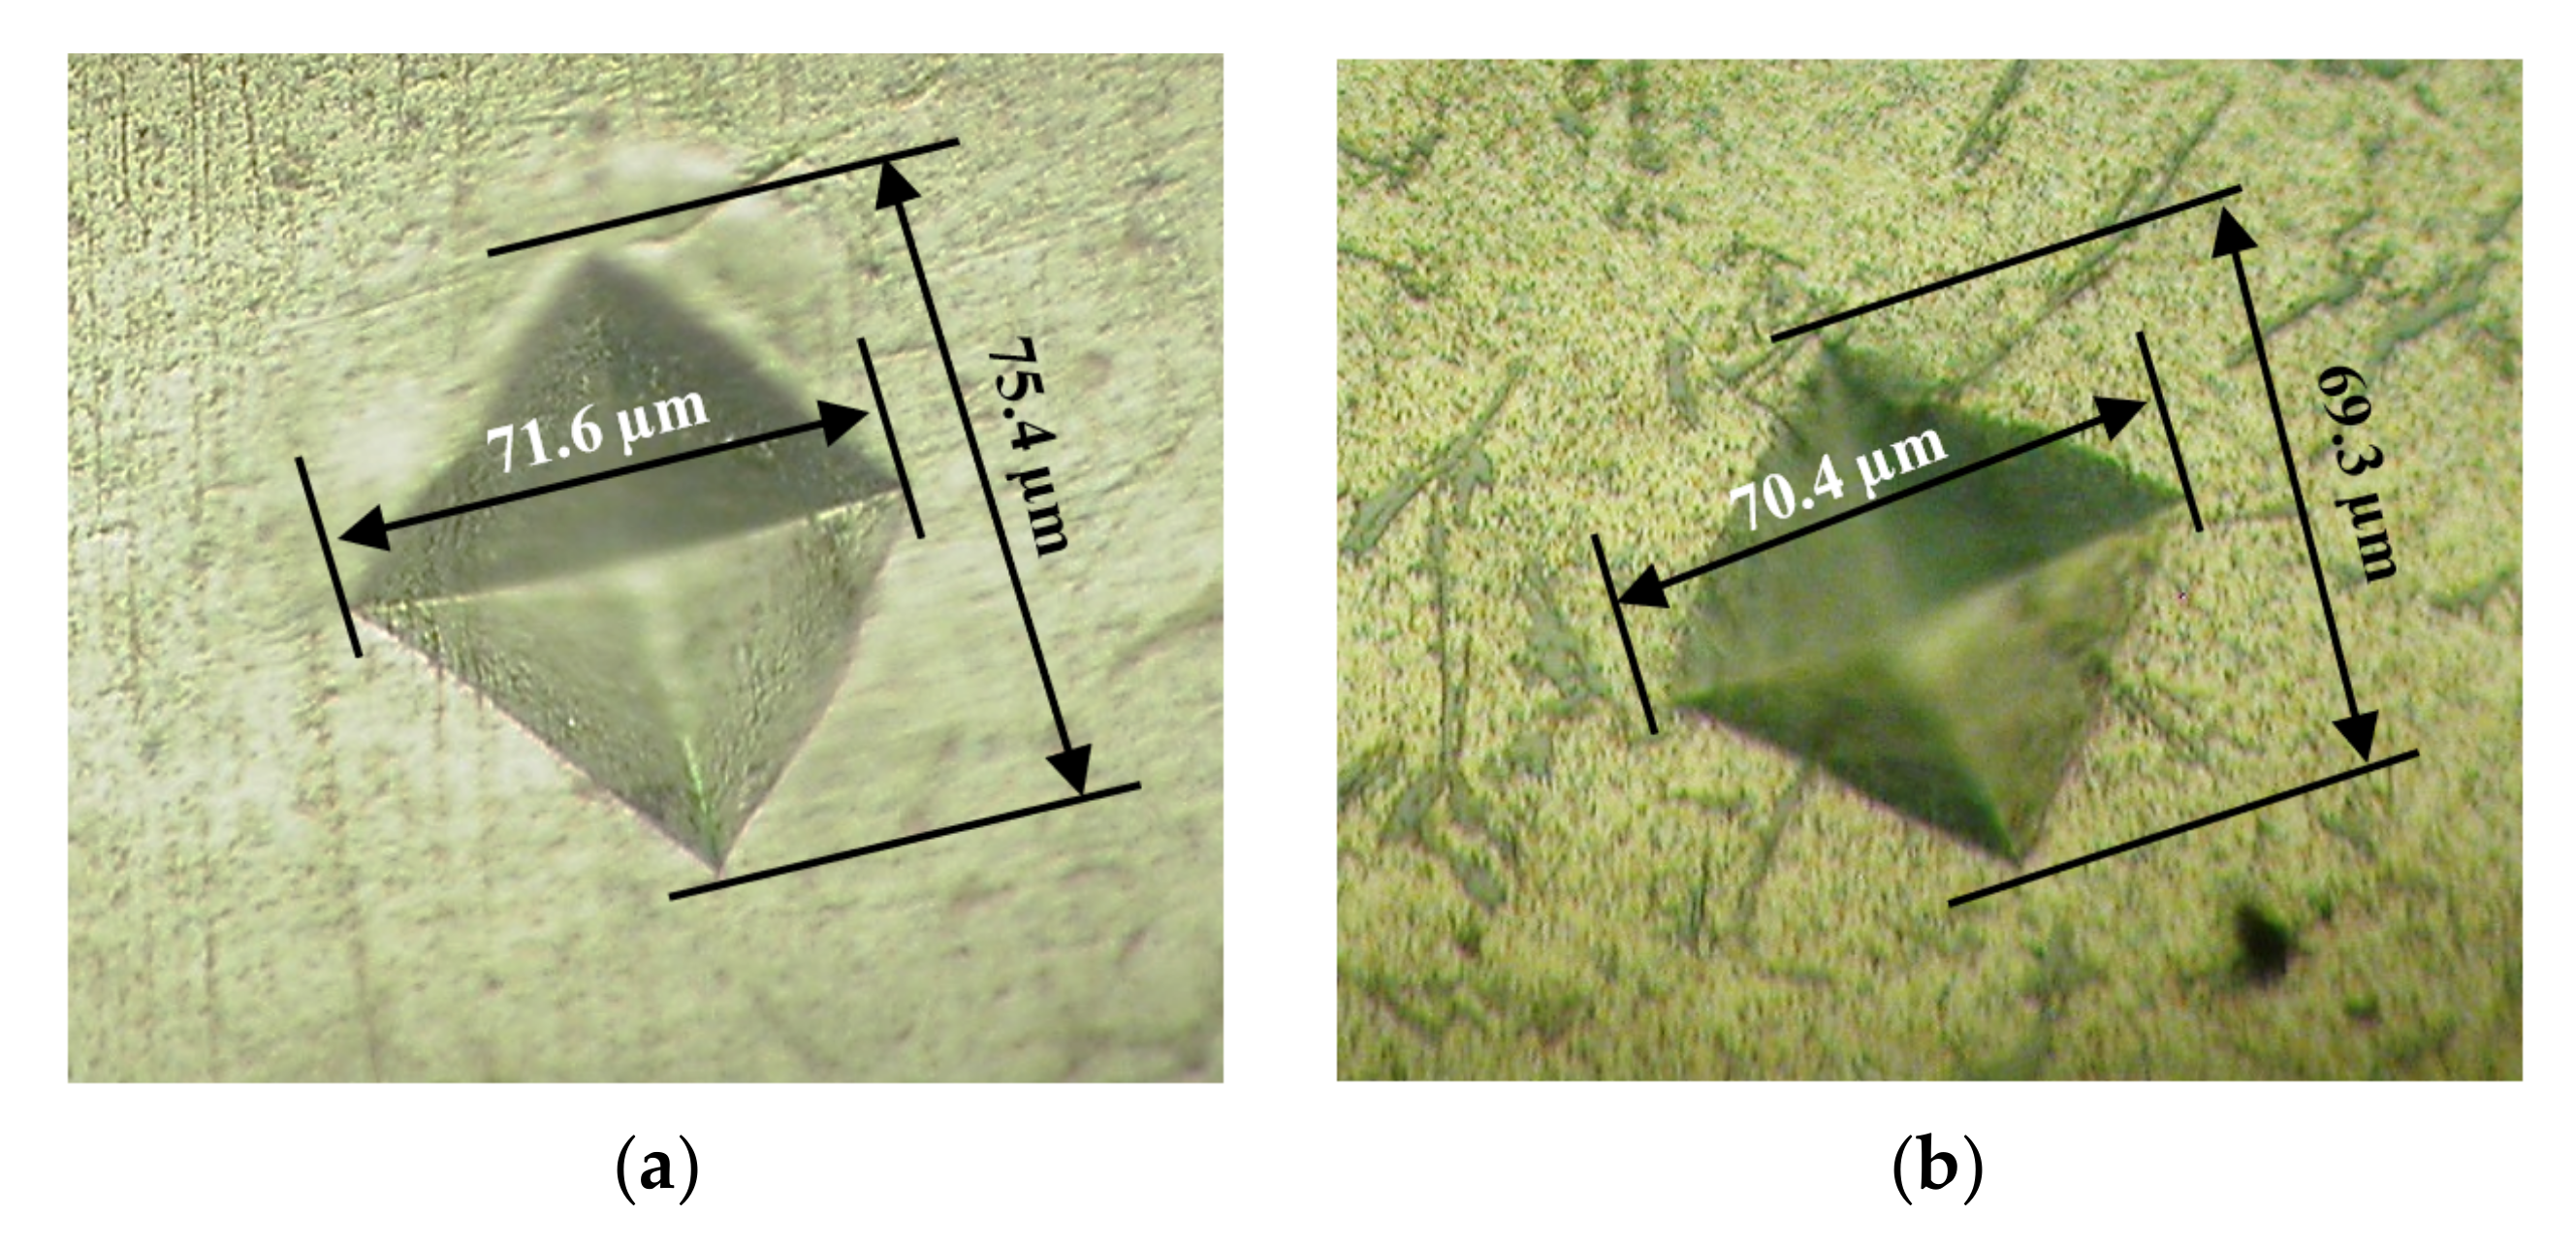
3.2. Microhardness Analysis
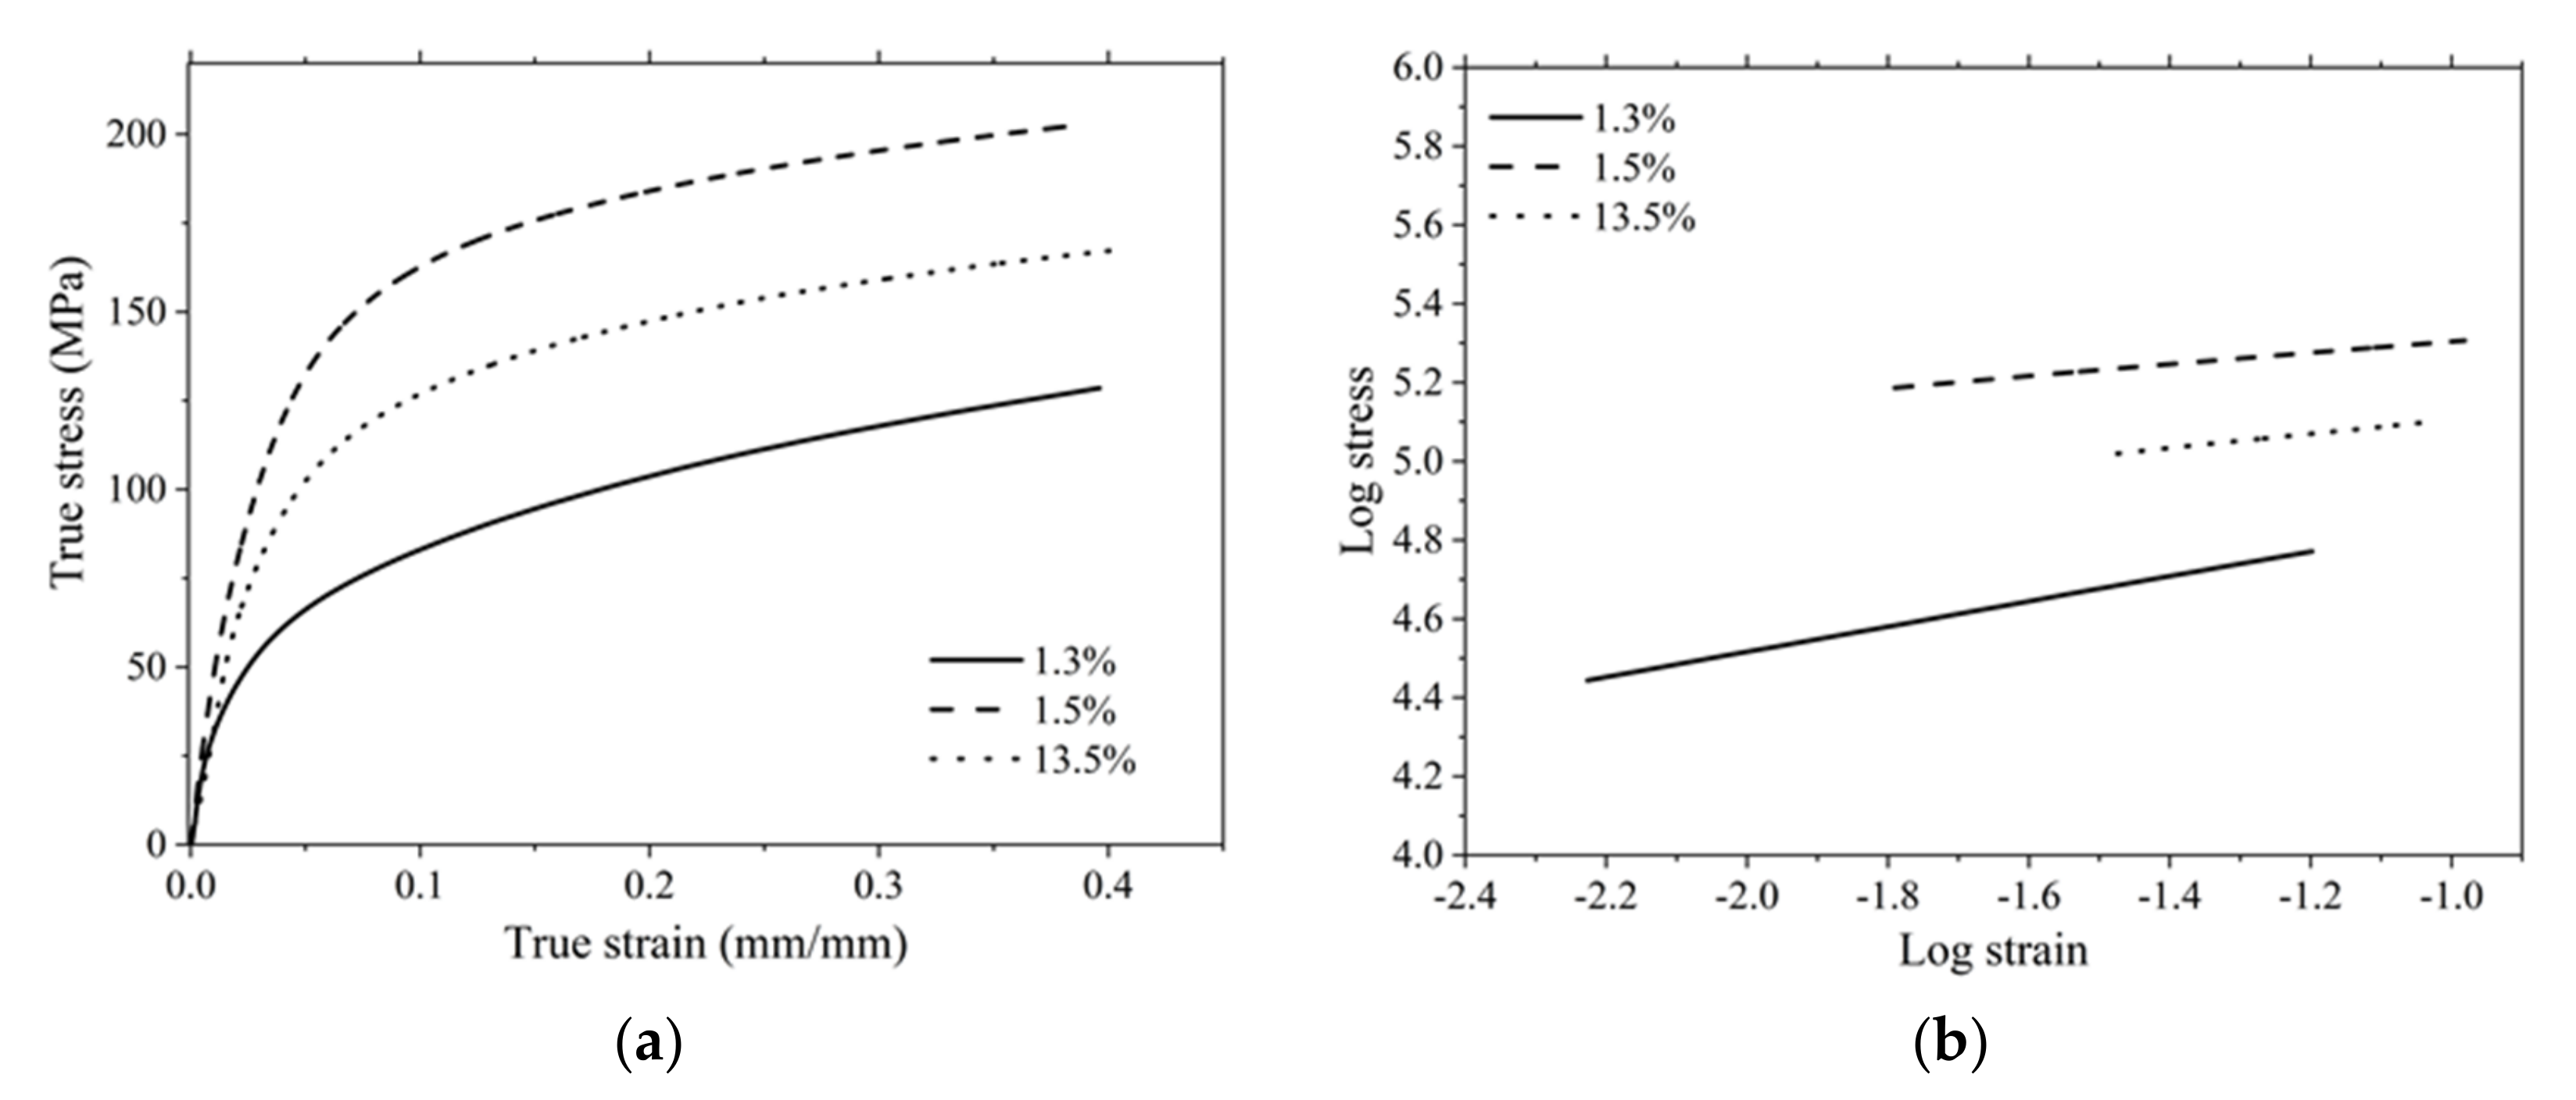
3.3. Compression Test Analysis
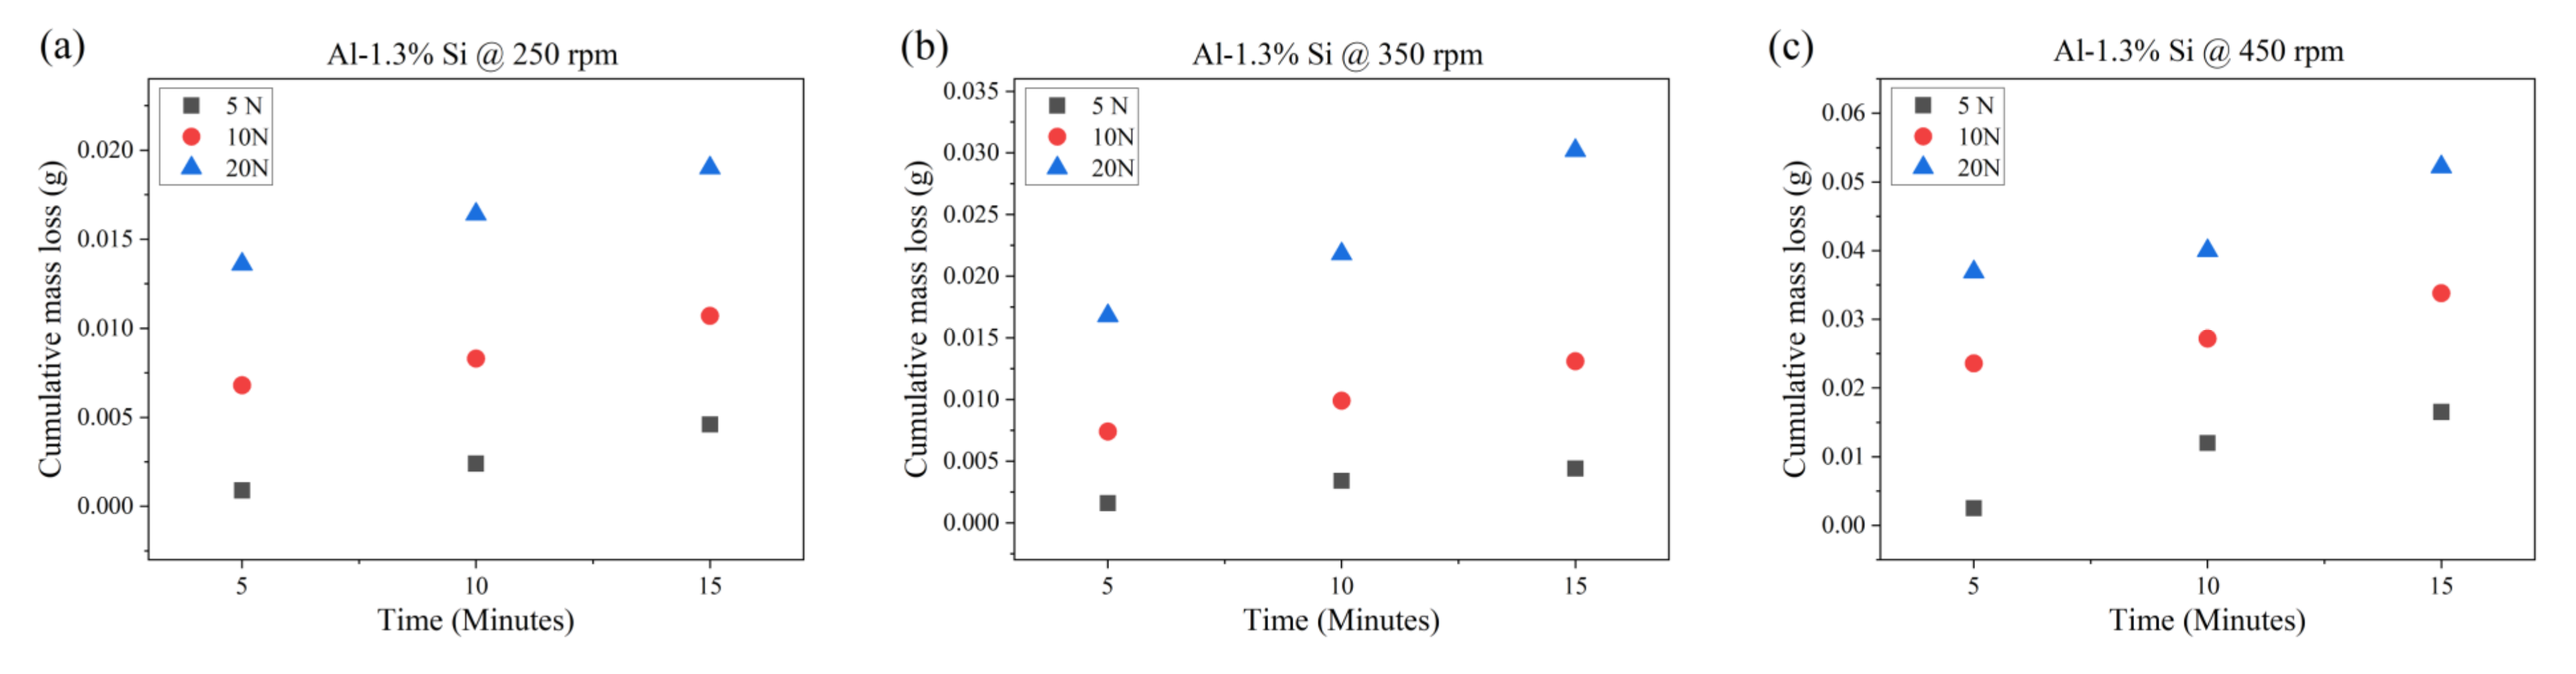
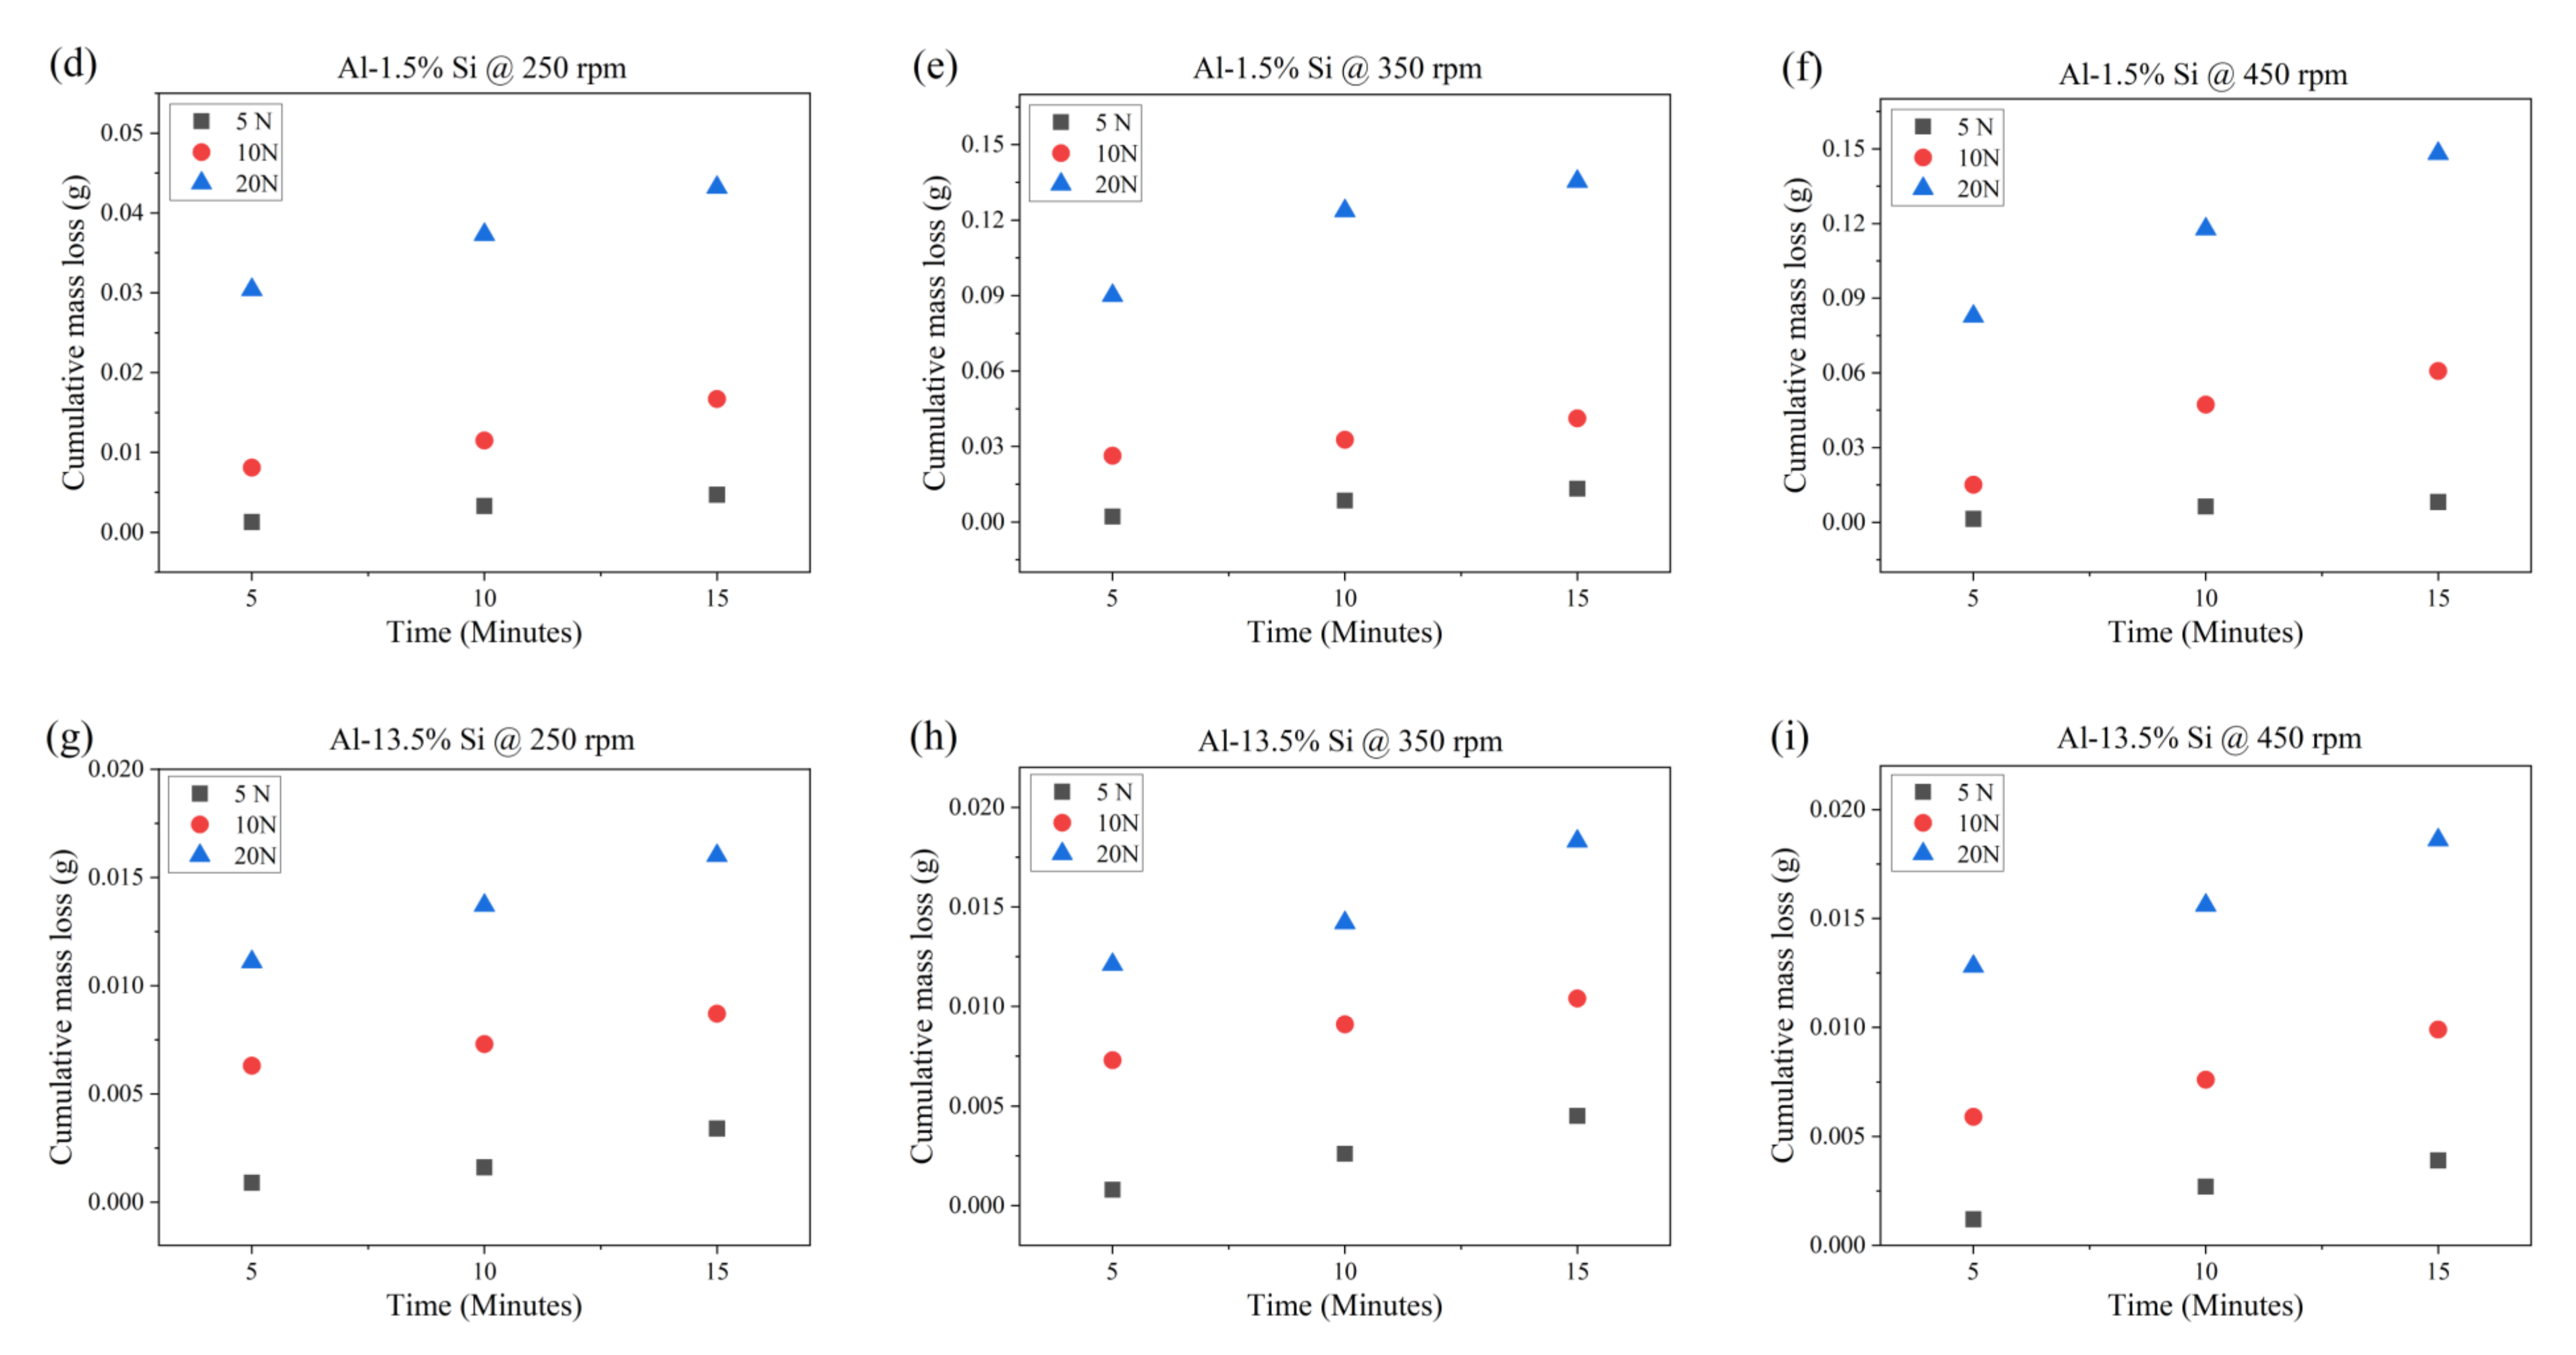
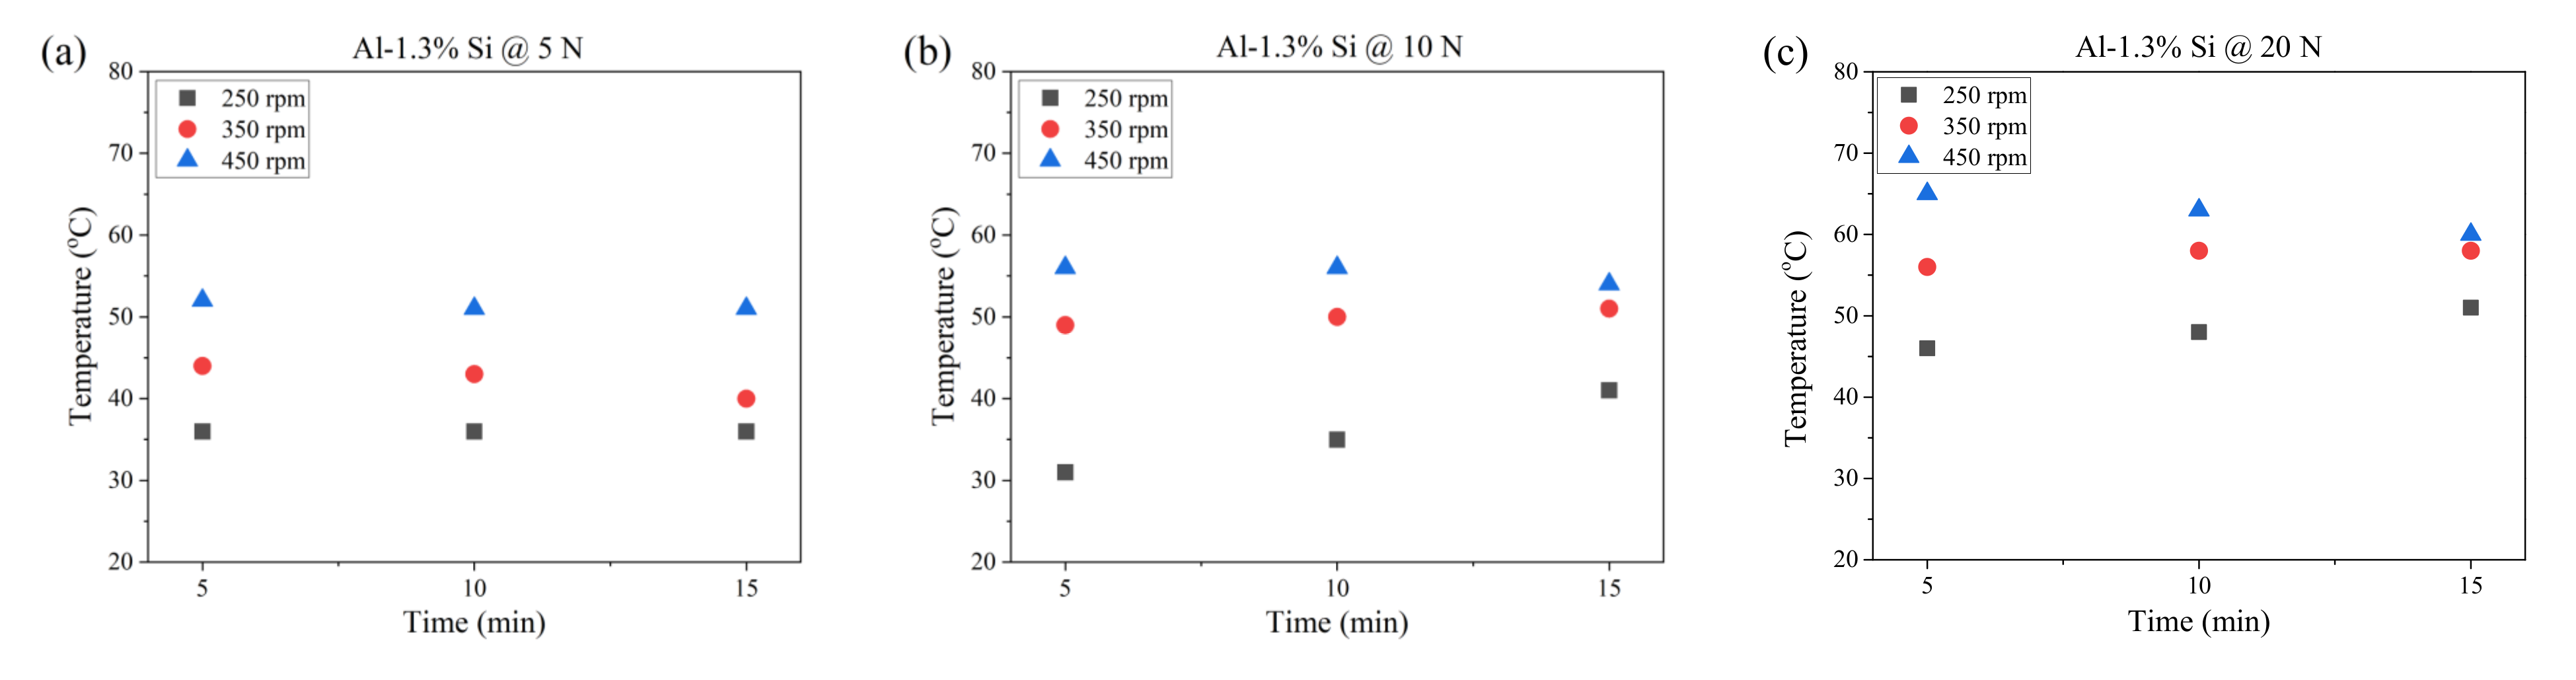
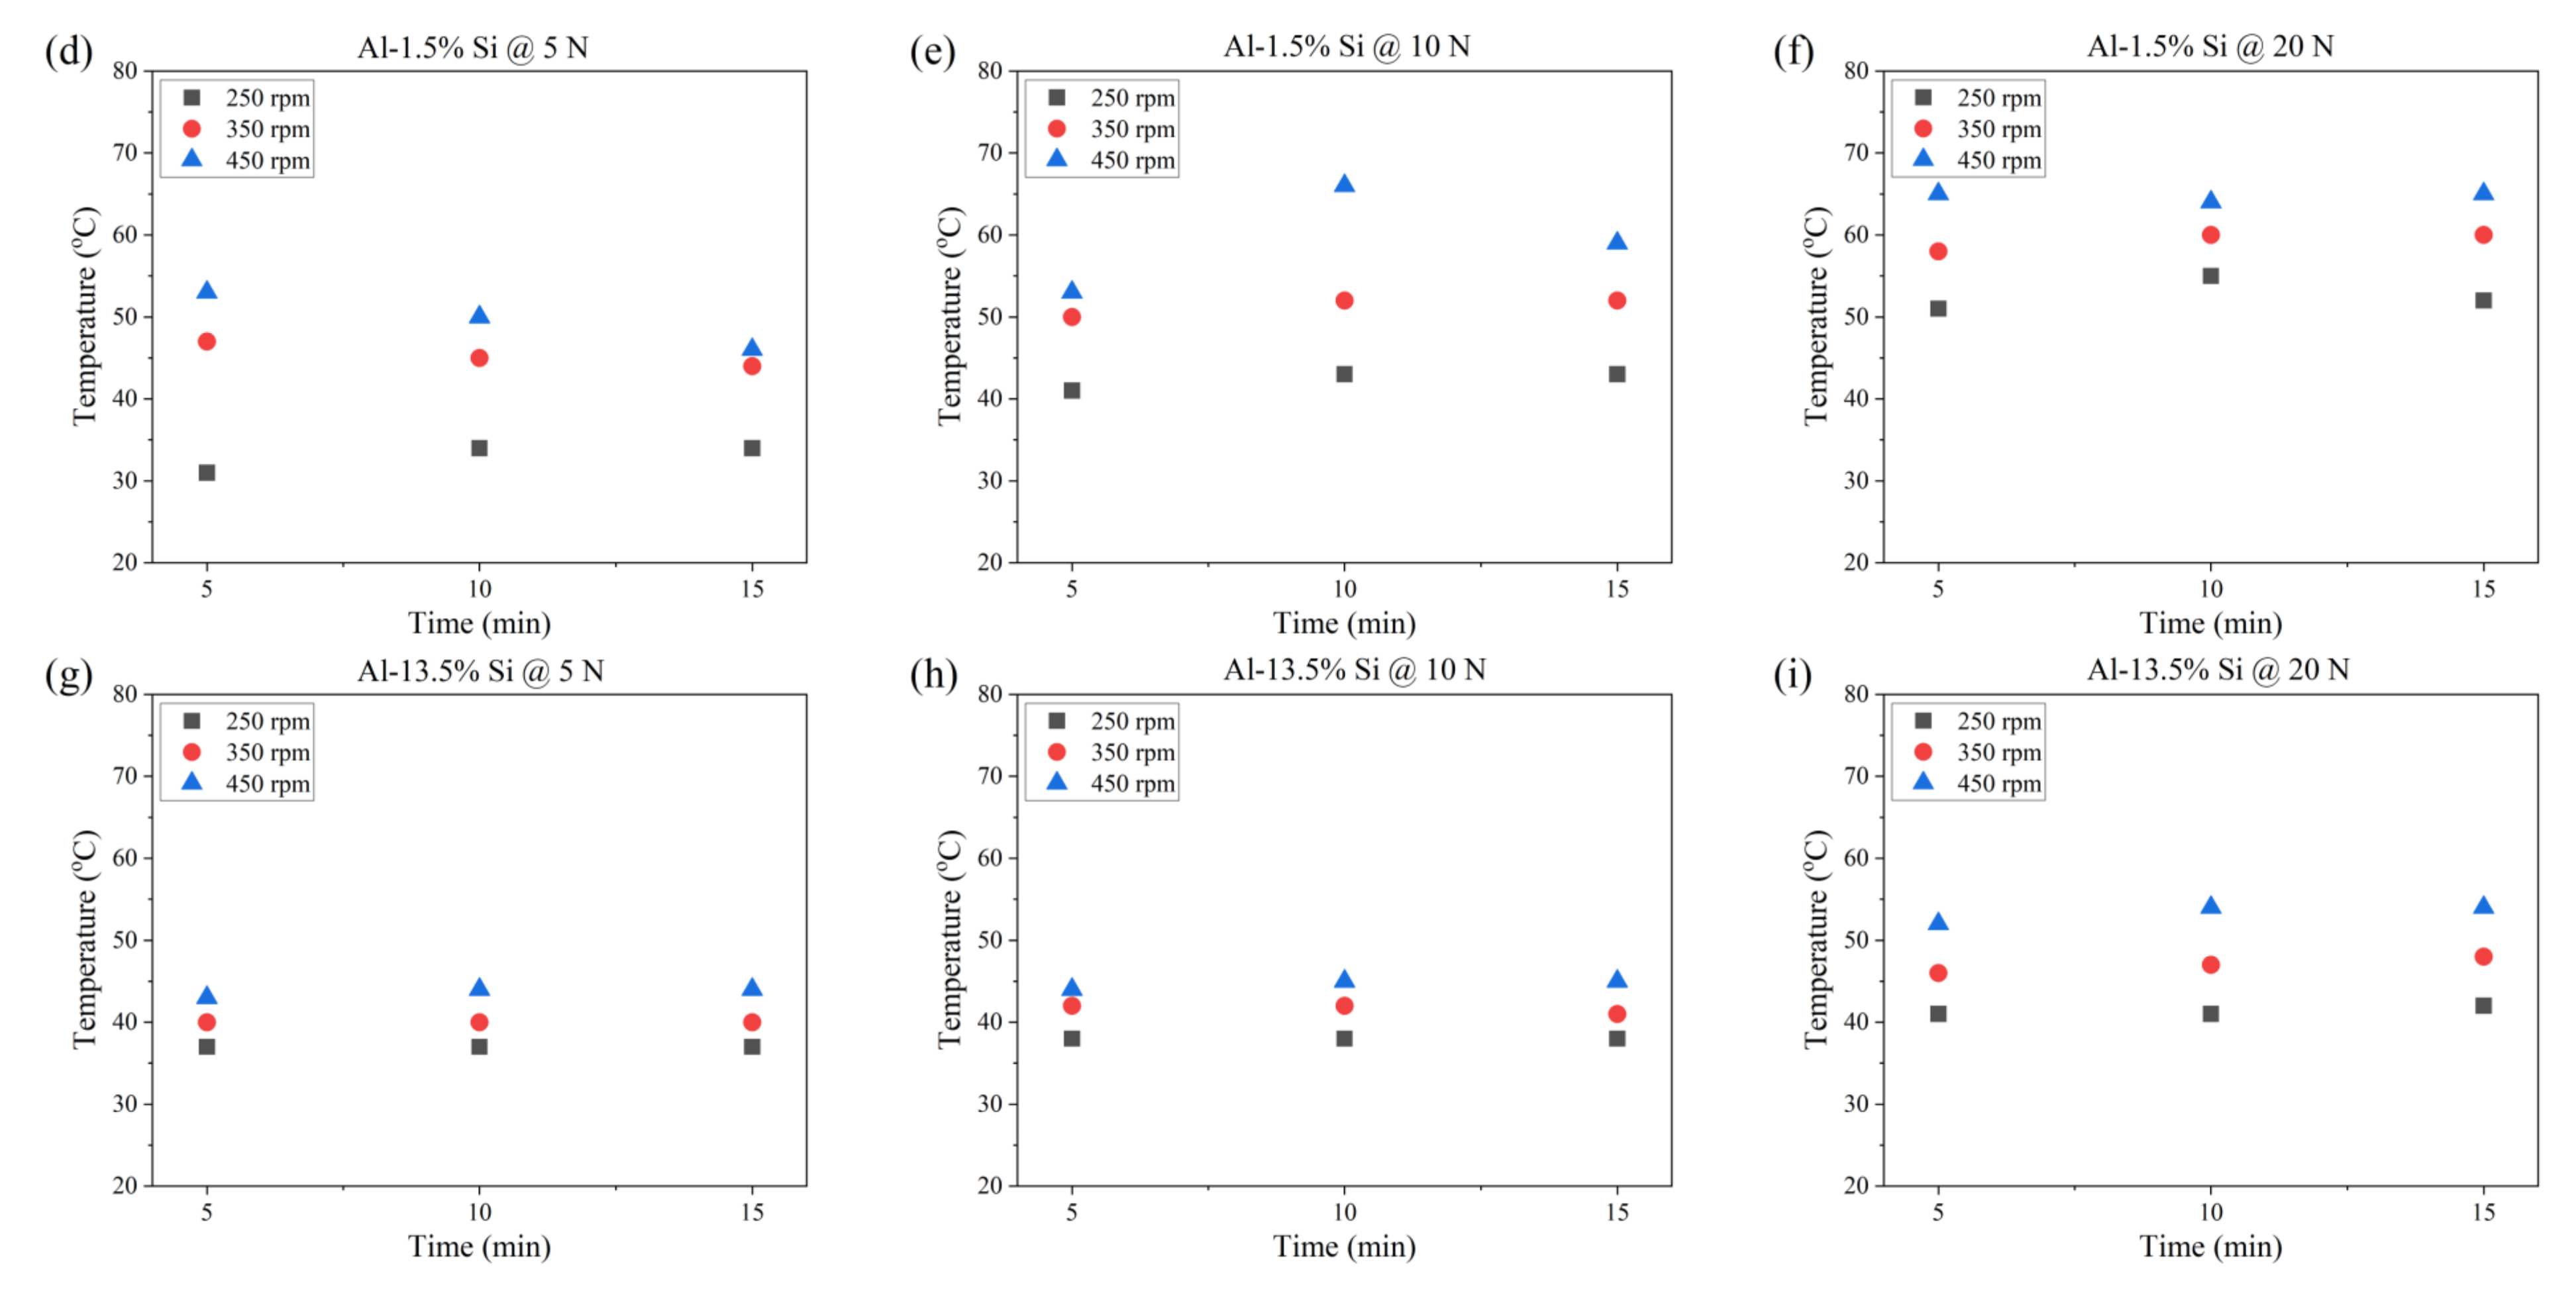
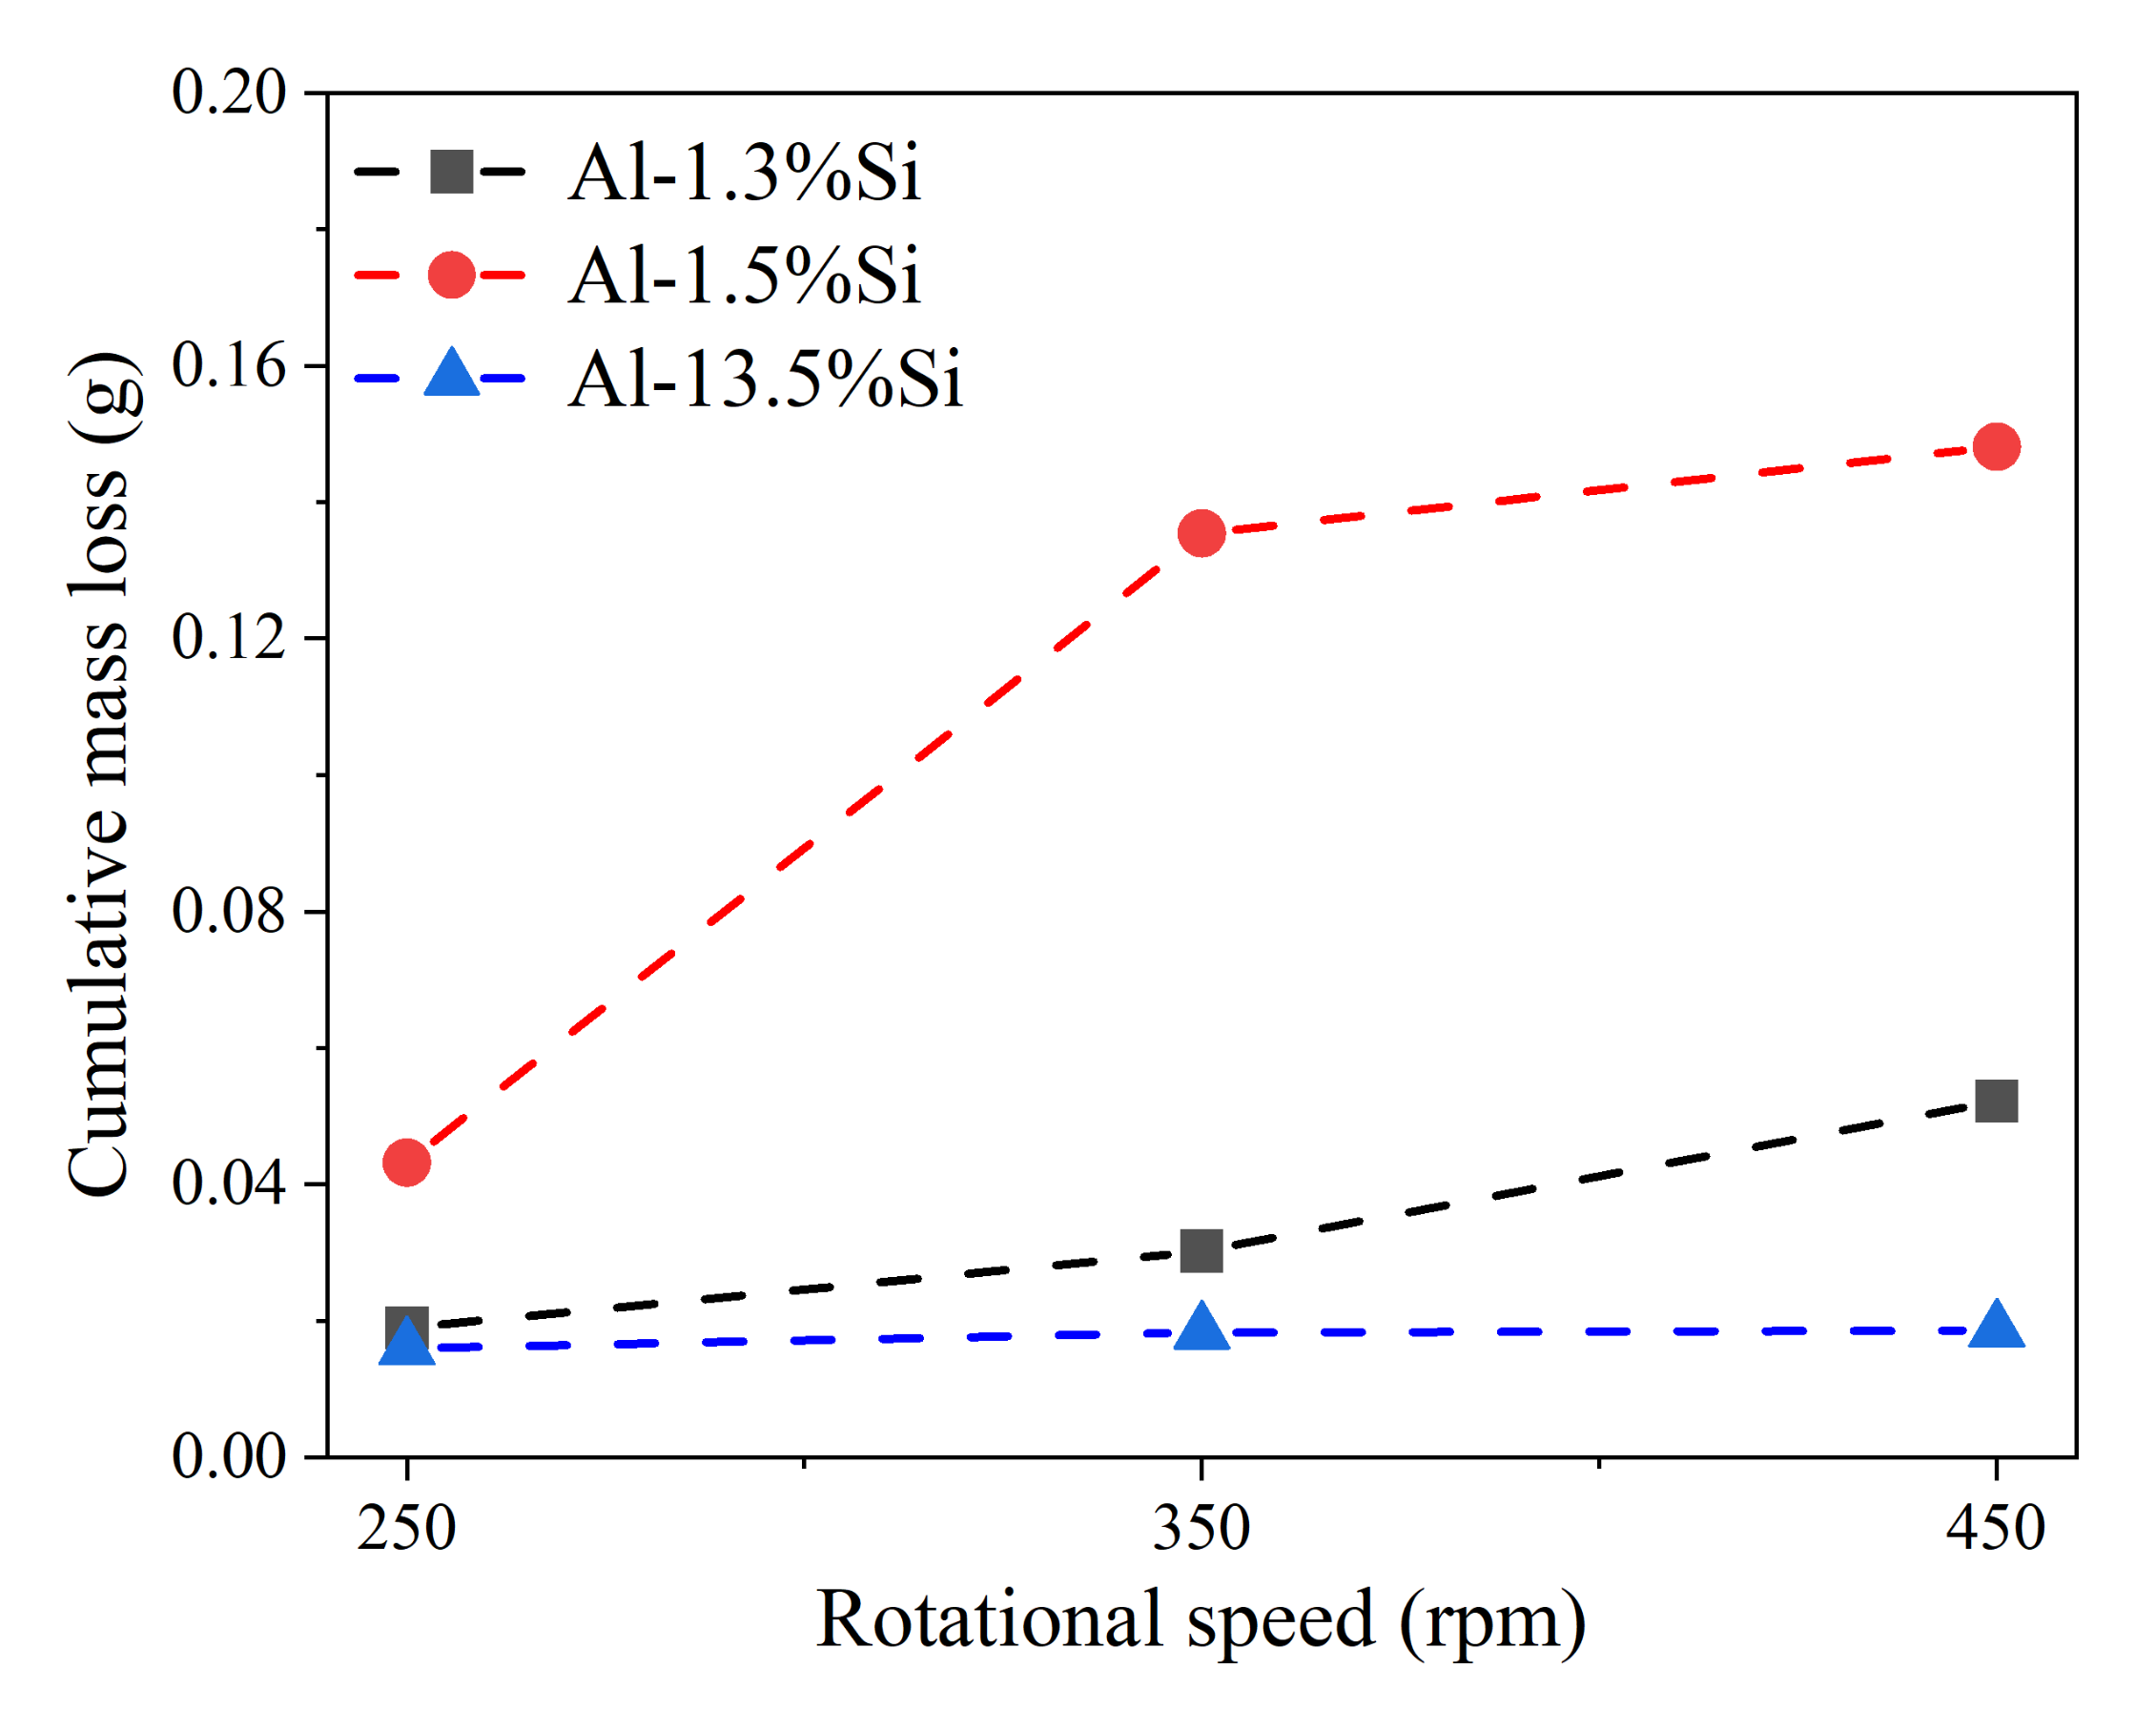
3.4. Wear Behavior
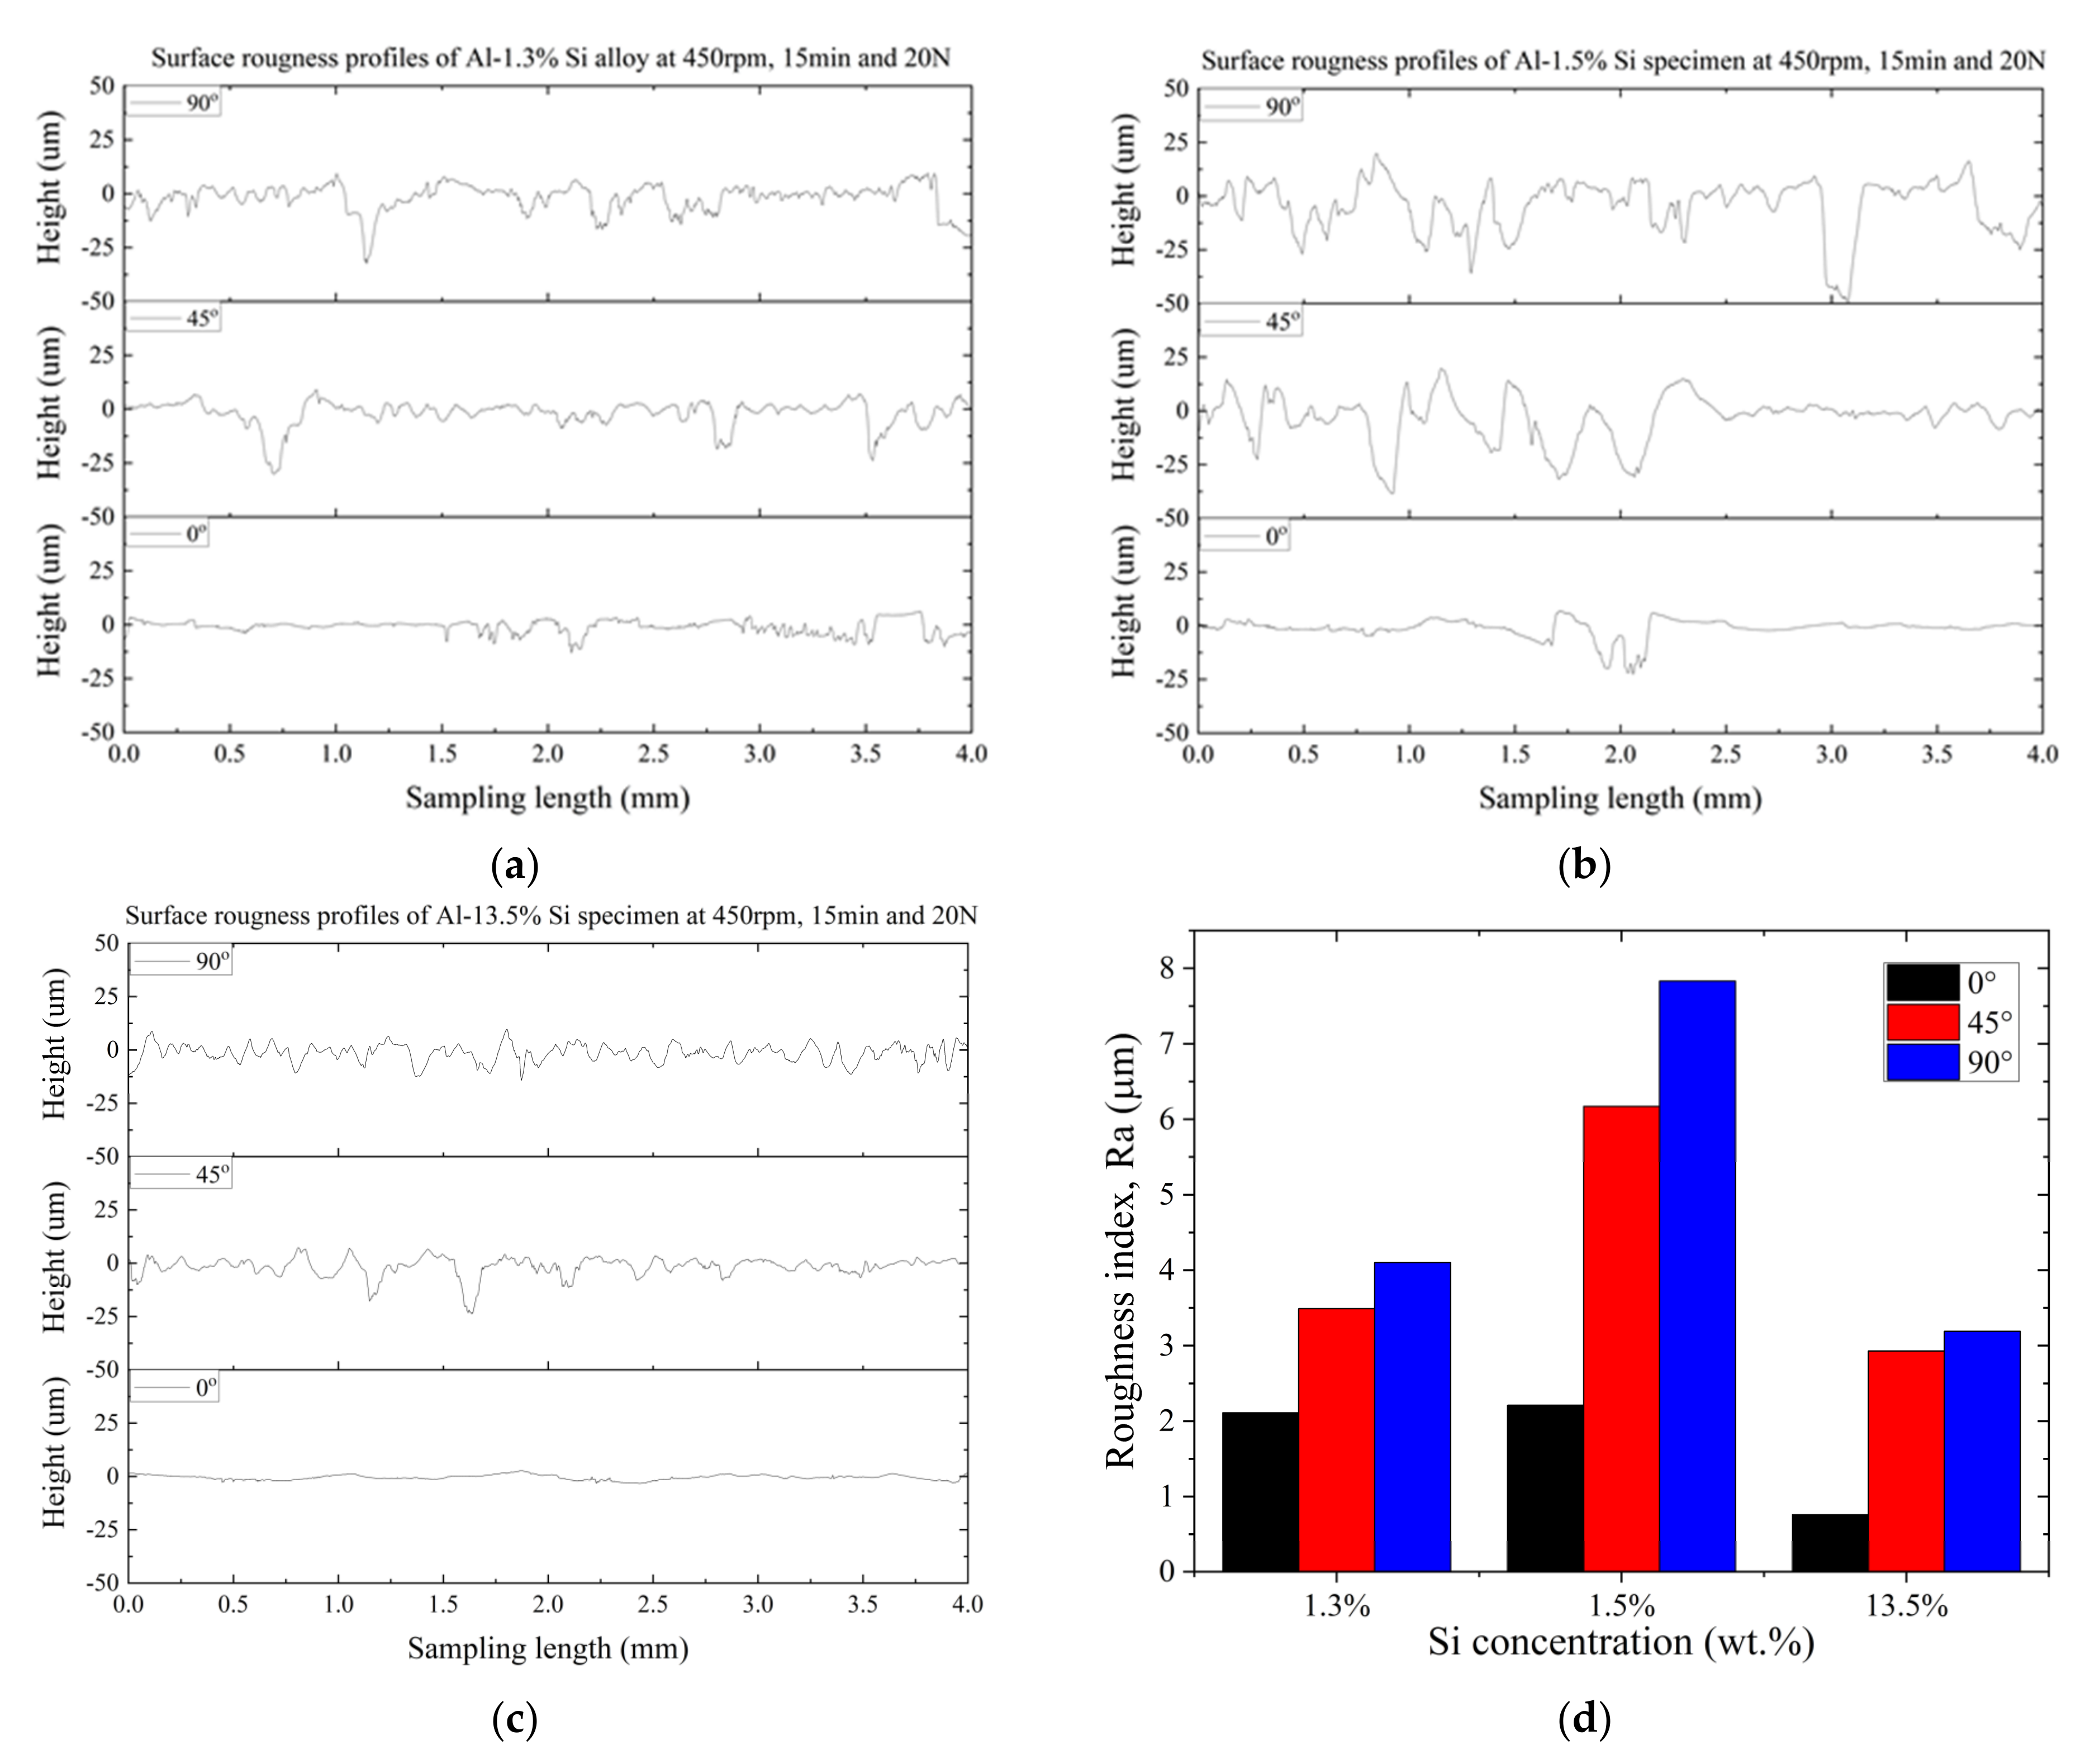
3.5. Surface Roughness
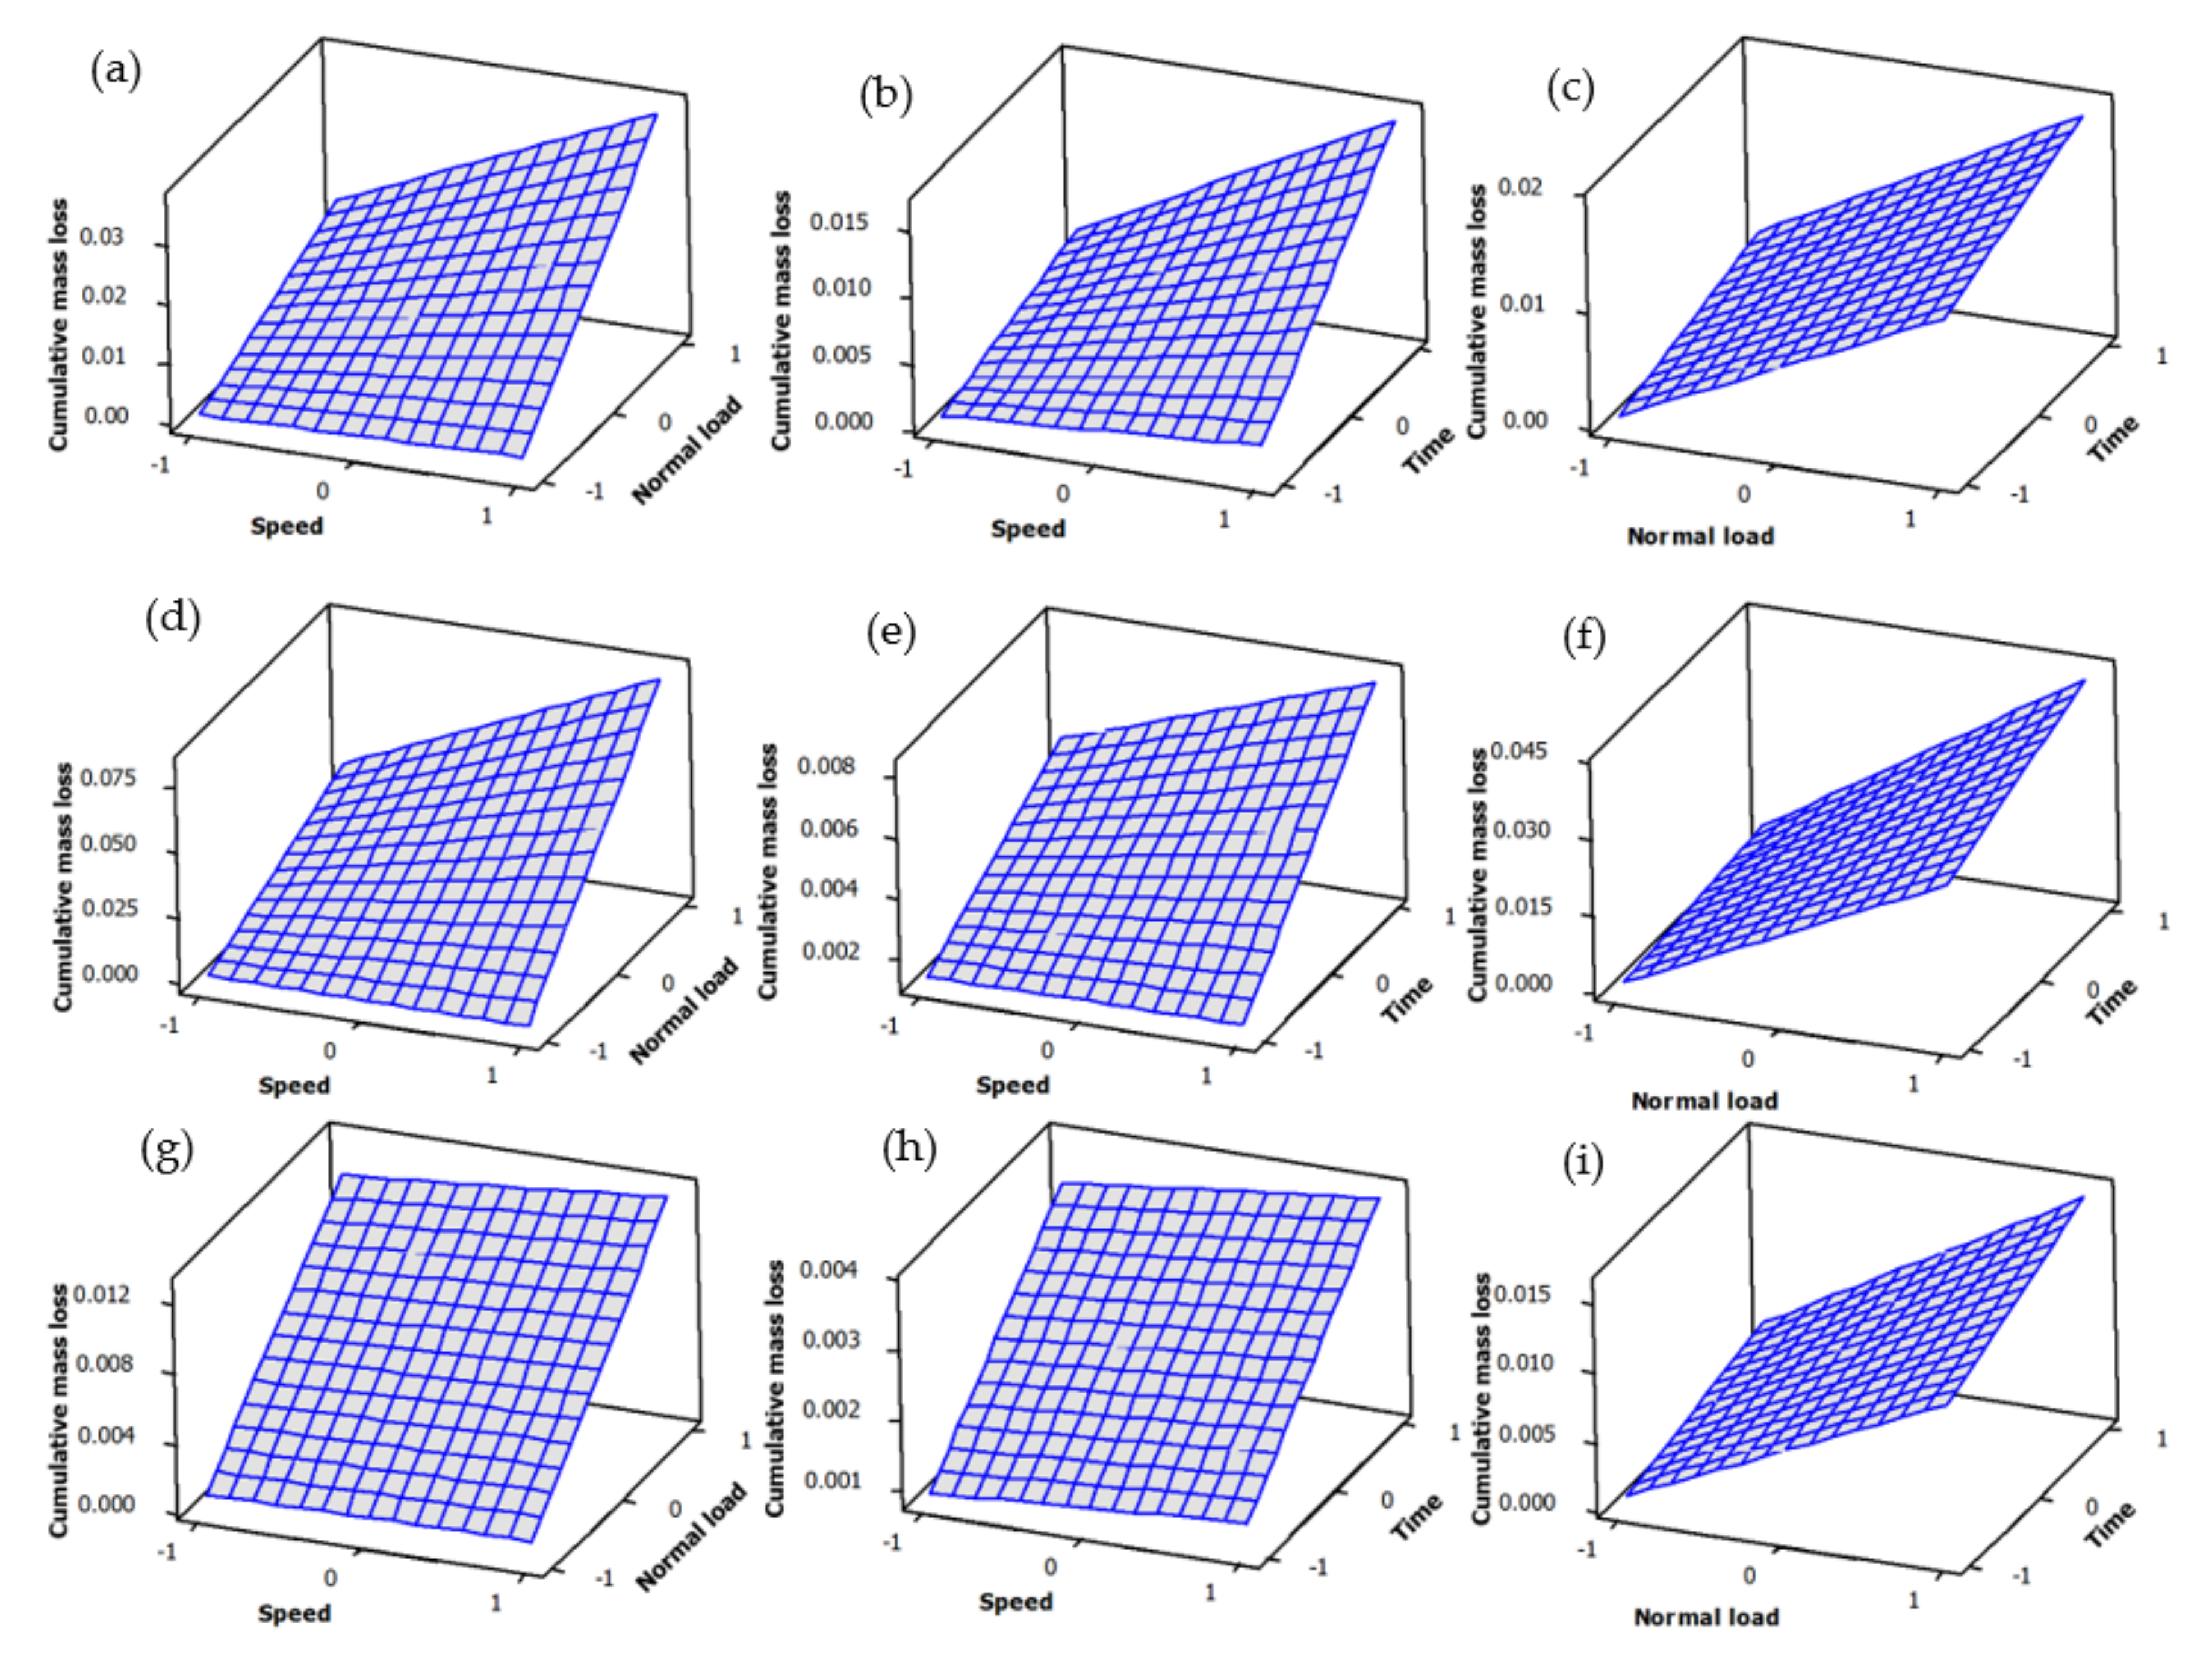
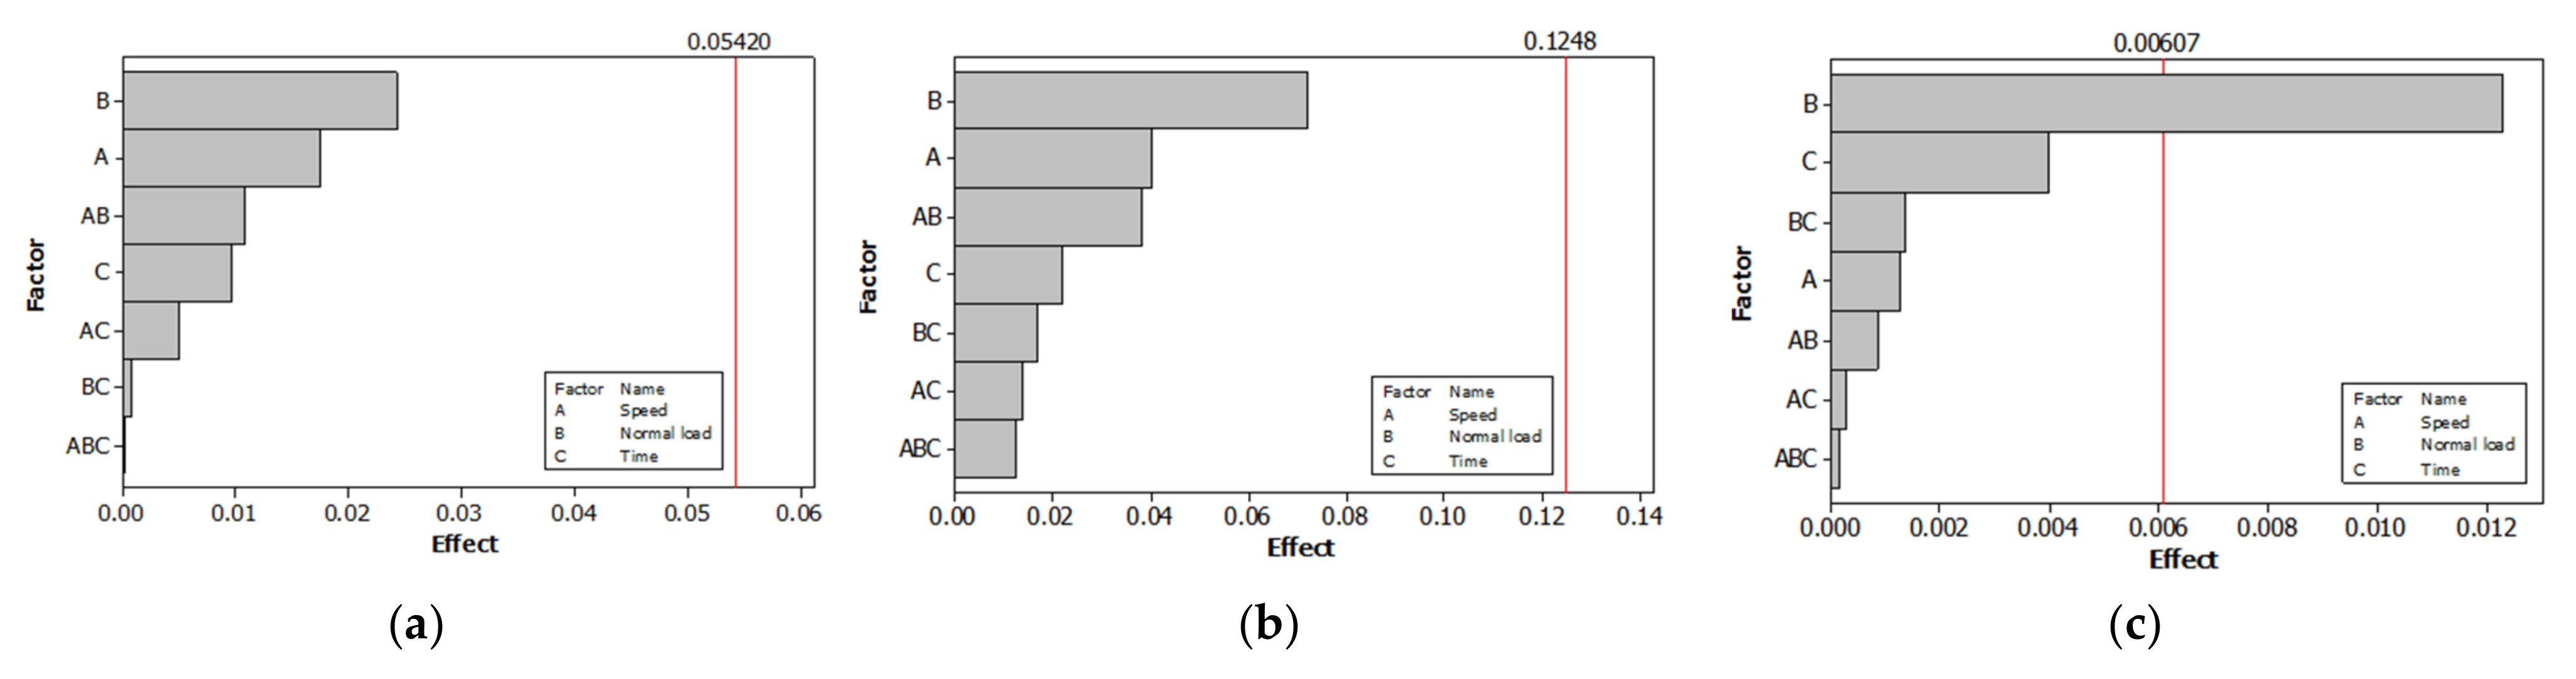
3.6. Design of Experiments and Response Surfaces
4. Conclusions
Author Contributions
Funding
Institutional Review Board Statement
Informed Consent Statement
Data Availability Statement
Acknowledgments
Conflicts of Interest
References
- Ceschini, L.; Toschi, S. Friction and Wear of Aluminum Alloys and Composites. In Friction, Lubrication, and Wear Technology; ASM International: Materials Park, OH, USA, 2017; pp. 509–532. [Google Scholar]
- Anand, S.; Srivatsan, T.S.; Wu, Y.; Lavernia, E.J. Processing, Microstructure and Fracture Behaviour of a Spray Atomized and Deposited Aluminium–Silicon Alloy. J. Mater. Sci. 1997, 32, 2835–2848. [Google Scholar] [CrossRef]
- Goñi, J.V.; Rodriguez-Ibabe, J.M.; Urcola, J.J. Strength and Toughness of Semi-Solid Processed Hypereutectic AlSi Alloys. Scr. Mater. 1996, 34, 483–489. [Google Scholar] [CrossRef]
- Prasada Rao, A.K.; Das, K.; Murty, B.S.; Chakraborty, M. Effect of Grain Refinement on Wear Properties of Al and Al–7Si Alloy. Wear 2004, 257, 148–153. [Google Scholar] [CrossRef]
- Raju, K.; Harsha, A.P.; Ojha, S.N. Microstructural Features, Wear, and Corrosion Behaviour of Spray Cast Al–Si Alloys. Proc. Inst. Mech. Eng. Part J J. Eng. Tribol. 2011, 225, 151–160. [Google Scholar] [CrossRef]
- Meena, P.C.; Sharma, A.; Singh, S. Effect of Grain Refinement on Microstructure and Wear Behavior of Cast Al–7Si Alloys. Metall. Ital. 2015, 107, 25–34. [Google Scholar]
- Barrirero, J. Eutectic Modification of Al–Si Casting Alloys; Linköping Studies in Science and Technology Dissertations No. 2014; Linköping University Electronic Press: Linköping, Sweden, 2019; Volume 2014, ISBN 9789175190075. [Google Scholar]
- Kaufman, J.G.; Rooy, E.L. Aluminum Alloy Castings: Properties, Processes, and Applications; Benedyk, J.C., Ed.; ASM International: Materials Park, OH, USA, 2004; ISBN 978-0-87170-803-8. [Google Scholar]
- Panemangalore, D.B.; Shabadi, R. Microstructural Aspects of Metal-Matrix Composites. In Encyclopedia of Materials: Composites; Elsevier: Amsterdam, The Netherlands, 2021; pp. 274–297. [Google Scholar]
- Karl-Heinz, Z.G. (Ed.) Microstructure and Wear of Materials. In Tribology Series; Elsevier: Amsterdam, The Netherlands, 1987; pp. 351–495. ISBN 9780444427540. [Google Scholar]
- Yasmin, T.; Khalid, A.A.; Haque, M.M. Tribological (Wear) Properties of Aluminum–Silicon Eutectic Base Alloy under Dry Sliding Condition. J. Mater. Process. Technol. 2004, 153–154, 833–838. [Google Scholar] [CrossRef]
- Dwivedi, D.K. Wear Behaviour of Cast Hypereutectic Aluminium Silicon Alloys. Mater. Des. 2006, 27, 610–616. [Google Scholar] [CrossRef]
- Kori, S.A.; Chandrashekharaiah, T.M. Studies on the Dry Sliding Wear Behaviour of Hypoeutectic and Eutectic Al–Si Alloys. Wear 2007, 263, 745–755. [Google Scholar] [CrossRef]
- Alshmri, F.; Atkinson, H.V.; Hainsworth, S.V.; Haidon, C.; Lawes, S.D.A. Dry Sliding Wear of Aluminium-High Silicon Hypereutectic Alloys. Wear 2014, 313, 106–116. [Google Scholar] [CrossRef]
- Mostafa, A.; Medraj, M. Binary Phase Diagrams and Thermodynamic Properties of Silicon and Essential Doping Elements (Al, As, B, Bi, Ga, In, N, P, Sb and Tl). Materials 2017, 10, 676. [Google Scholar] [CrossRef] [Green Version]
- SGTE Substance Database; Royal Institute of Technology: Stockholm, Sweden, 1994.
- Bale, C.W.; Bélisle, E.; Chartrand, P.; Decterov, S.A.; Eriksson, G.; Gheribi, A.E.; Hack, K.; Jung, I.-H.; Kang, Y.-B.; Melançon, J.; et al. FactSage Thermochemical Software and Databases, 2010–2016. Calphad 2016, 54, 35–53. [Google Scholar] [CrossRef] [Green Version]
- ASTM G99 Standard; Test Method for Wear Testing with a Pin-on-Disk Apparatus. ASTM International: West Conshohocken, PA, USA, 2016.
- Zaid, A.I.O.; Mostafa, A.O. Effect of Hafnium Addition on Wear Resistance of Zinc–Aluminum 5 Alloy: A Three-Dimensional Presentation. Adv. Mater. Lett. 2017, 8, 910–915. [Google Scholar] [CrossRef]
- Ghassemi, M.H.; Abouei, V.; Moshtaghi, M.; Noghani, M.T. The Effect of Removing Worn Particles by Ultrasonic Cleaning on the Wear Characterization of LM13 Alloy. Surf. Eng. Appl. Electrochem. 2015, 51, 382–388. [Google Scholar] [CrossRef]
- Gupta, M.; Ling, S. Microstructure and Mechanical Properties of Hypo/Hyper-Eutectic Al–Si Alloys Synthesized Using a near-Net Shape Forming Technique. J. Alloys Compd. 1999, 287, 284–294. [Google Scholar] [CrossRef]
- Uguz, A.; Bayram, A. Effect of Si Content and Microstructure on the Wear Behaviour of Al-Si Alloys. Metall 2001, 55, 516–519. [Google Scholar]
- Mostafa, A.O. Mechanical Properties and Wear Behavior of Aluminum Grain Refined by Ti and Ti + B. Int. J. Surf. Eng. Interdiscip. Mater. Sci. 2019, 7, 1–19. [Google Scholar] [CrossRef] [Green Version]
- Barrirero, J.; Pauly, C.; Engstler, M.; Ghanbaja, J.; Ghafoor, N.; Li, J.; Schumacher, P.; Odén, M.; Mücklich, F. Eutectic Modification by Ternary Compound Cluster Formation in Al–Si Alloys. Sci. Rep. 2019, 9, 5506. [Google Scholar] [CrossRef]
- Samuel, A.M.; Elgallad, E.M.; Doty, H.W.; Valtierra, S.; Samuel, F.H. Effect of Metallurgical Parameters on the Microstructure, Hardness Impact Properties, and Fractography of Al–(6.5–11.5) wt% Si Based Alloys. Mater. Des. 2016, 107, 426–439. [Google Scholar] [CrossRef]
- Matusevich, A.E.; Massa, J.C.; Mancini, R.A. Computation of Tensile Strain-Hardening Exponents through the Power-Law Relationship. J. Test. Eval. 2012, 40, 104226. [Google Scholar] [CrossRef]
- Silva, R.; Pinto, A.; Kuznetsov, A.; Bott, I. Precipitation and Grain Size Effects on the Tensile Strain-Hardening Exponents of an API X80 Steel Pipe after High-Frequency Hot-Induction Bending. Metals 2018, 8, 168. [Google Scholar] [CrossRef] [Green Version]
- Odabas, D. Effects of Load and Speed on Wear Rate of Abrasive Wear for 2014 Al Alloy. IOP Conf. Ser. Mater. Sci. Eng. 2018, 295, 012008. [Google Scholar] [CrossRef]
- Ozioko, F.U. Synthesis and Study on Effect of Parameters on Dry Sliding Wear Characteristics of Al–SI Alloys. In Leonardo Electronic Journal of Practices and Technologies; Technical University of Cluj-Napoca: Cluj-Napoca, Romania, 2012; pp. 39–48. [Google Scholar]
- Arnell, D. Mechanisms and Laws of Friction and Wear. In Tribology and Dynamics of Engine and Powertrain; Elsevier: Amsterdam, The Netherlands, 2010; pp. 41–72. [Google Scholar]
- Baby, A.K.; Priyaranjan, M.; Deepak Lawrence, K.; Rajendrakumar, P. Tribological Behaviour of Hypereutectic Al–Si Automotive Cylinder Liner Material under Dry Sliding Wear Condition in Severe Wear Regime. Proc. Inst. Mech. Eng. Part J J. Eng. Tribol. 2021, 235, 1450–1462. [Google Scholar] [CrossRef]
- Maawad, E.; Brokmeier, H.-G.; Wagner, L.; Sano, Y.; Genzel, C. Investigation on the Surface and Near-Surface Characteristics of Ti–2.5Cu after Various Mechanical Surface Treatments. Surf. Coat. Technol. 2011, 205, 3644–3650. [Google Scholar] [CrossRef]


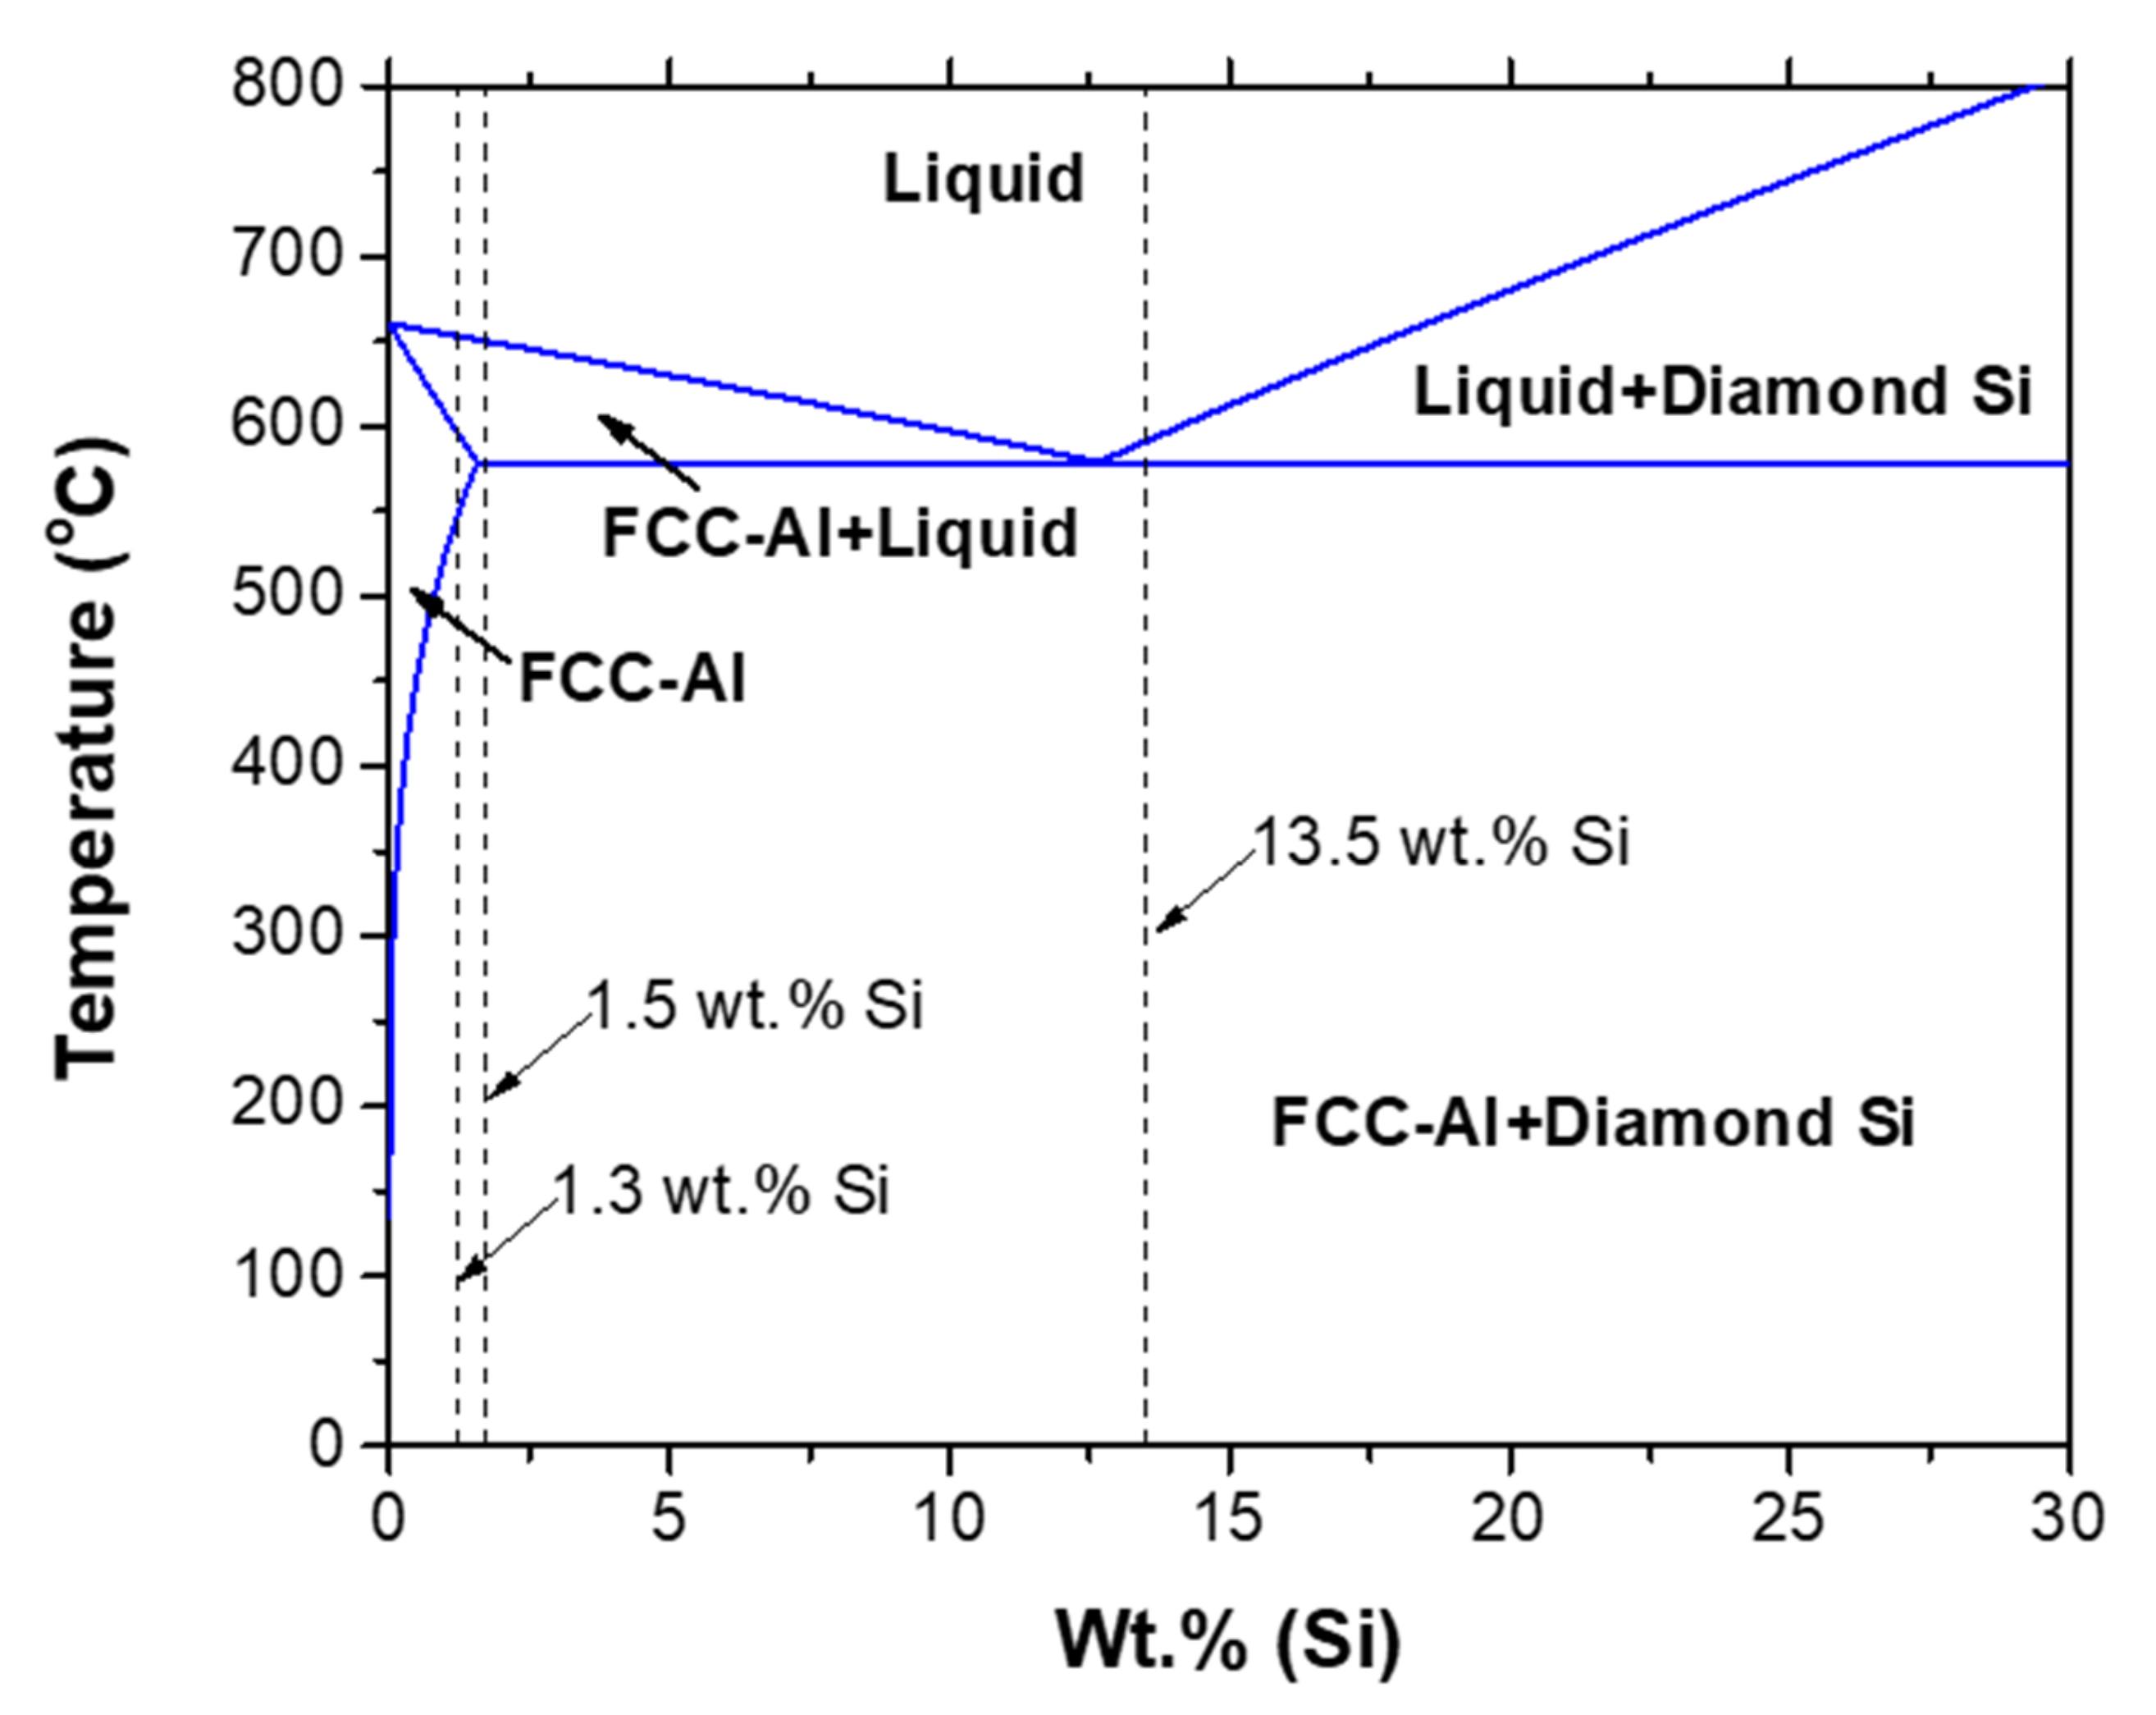
| Specimen | Al (wt.%) | Si (wt.%) |
|---|---|---|
| FCC-Al solid solution | 98.7 | 1.3 |
| Hypoeutectic | 98.5 | 1.5 |
| Hypereutectic | 86.5 | 13.5 |
| Factors | Values | ||
|---|---|---|---|
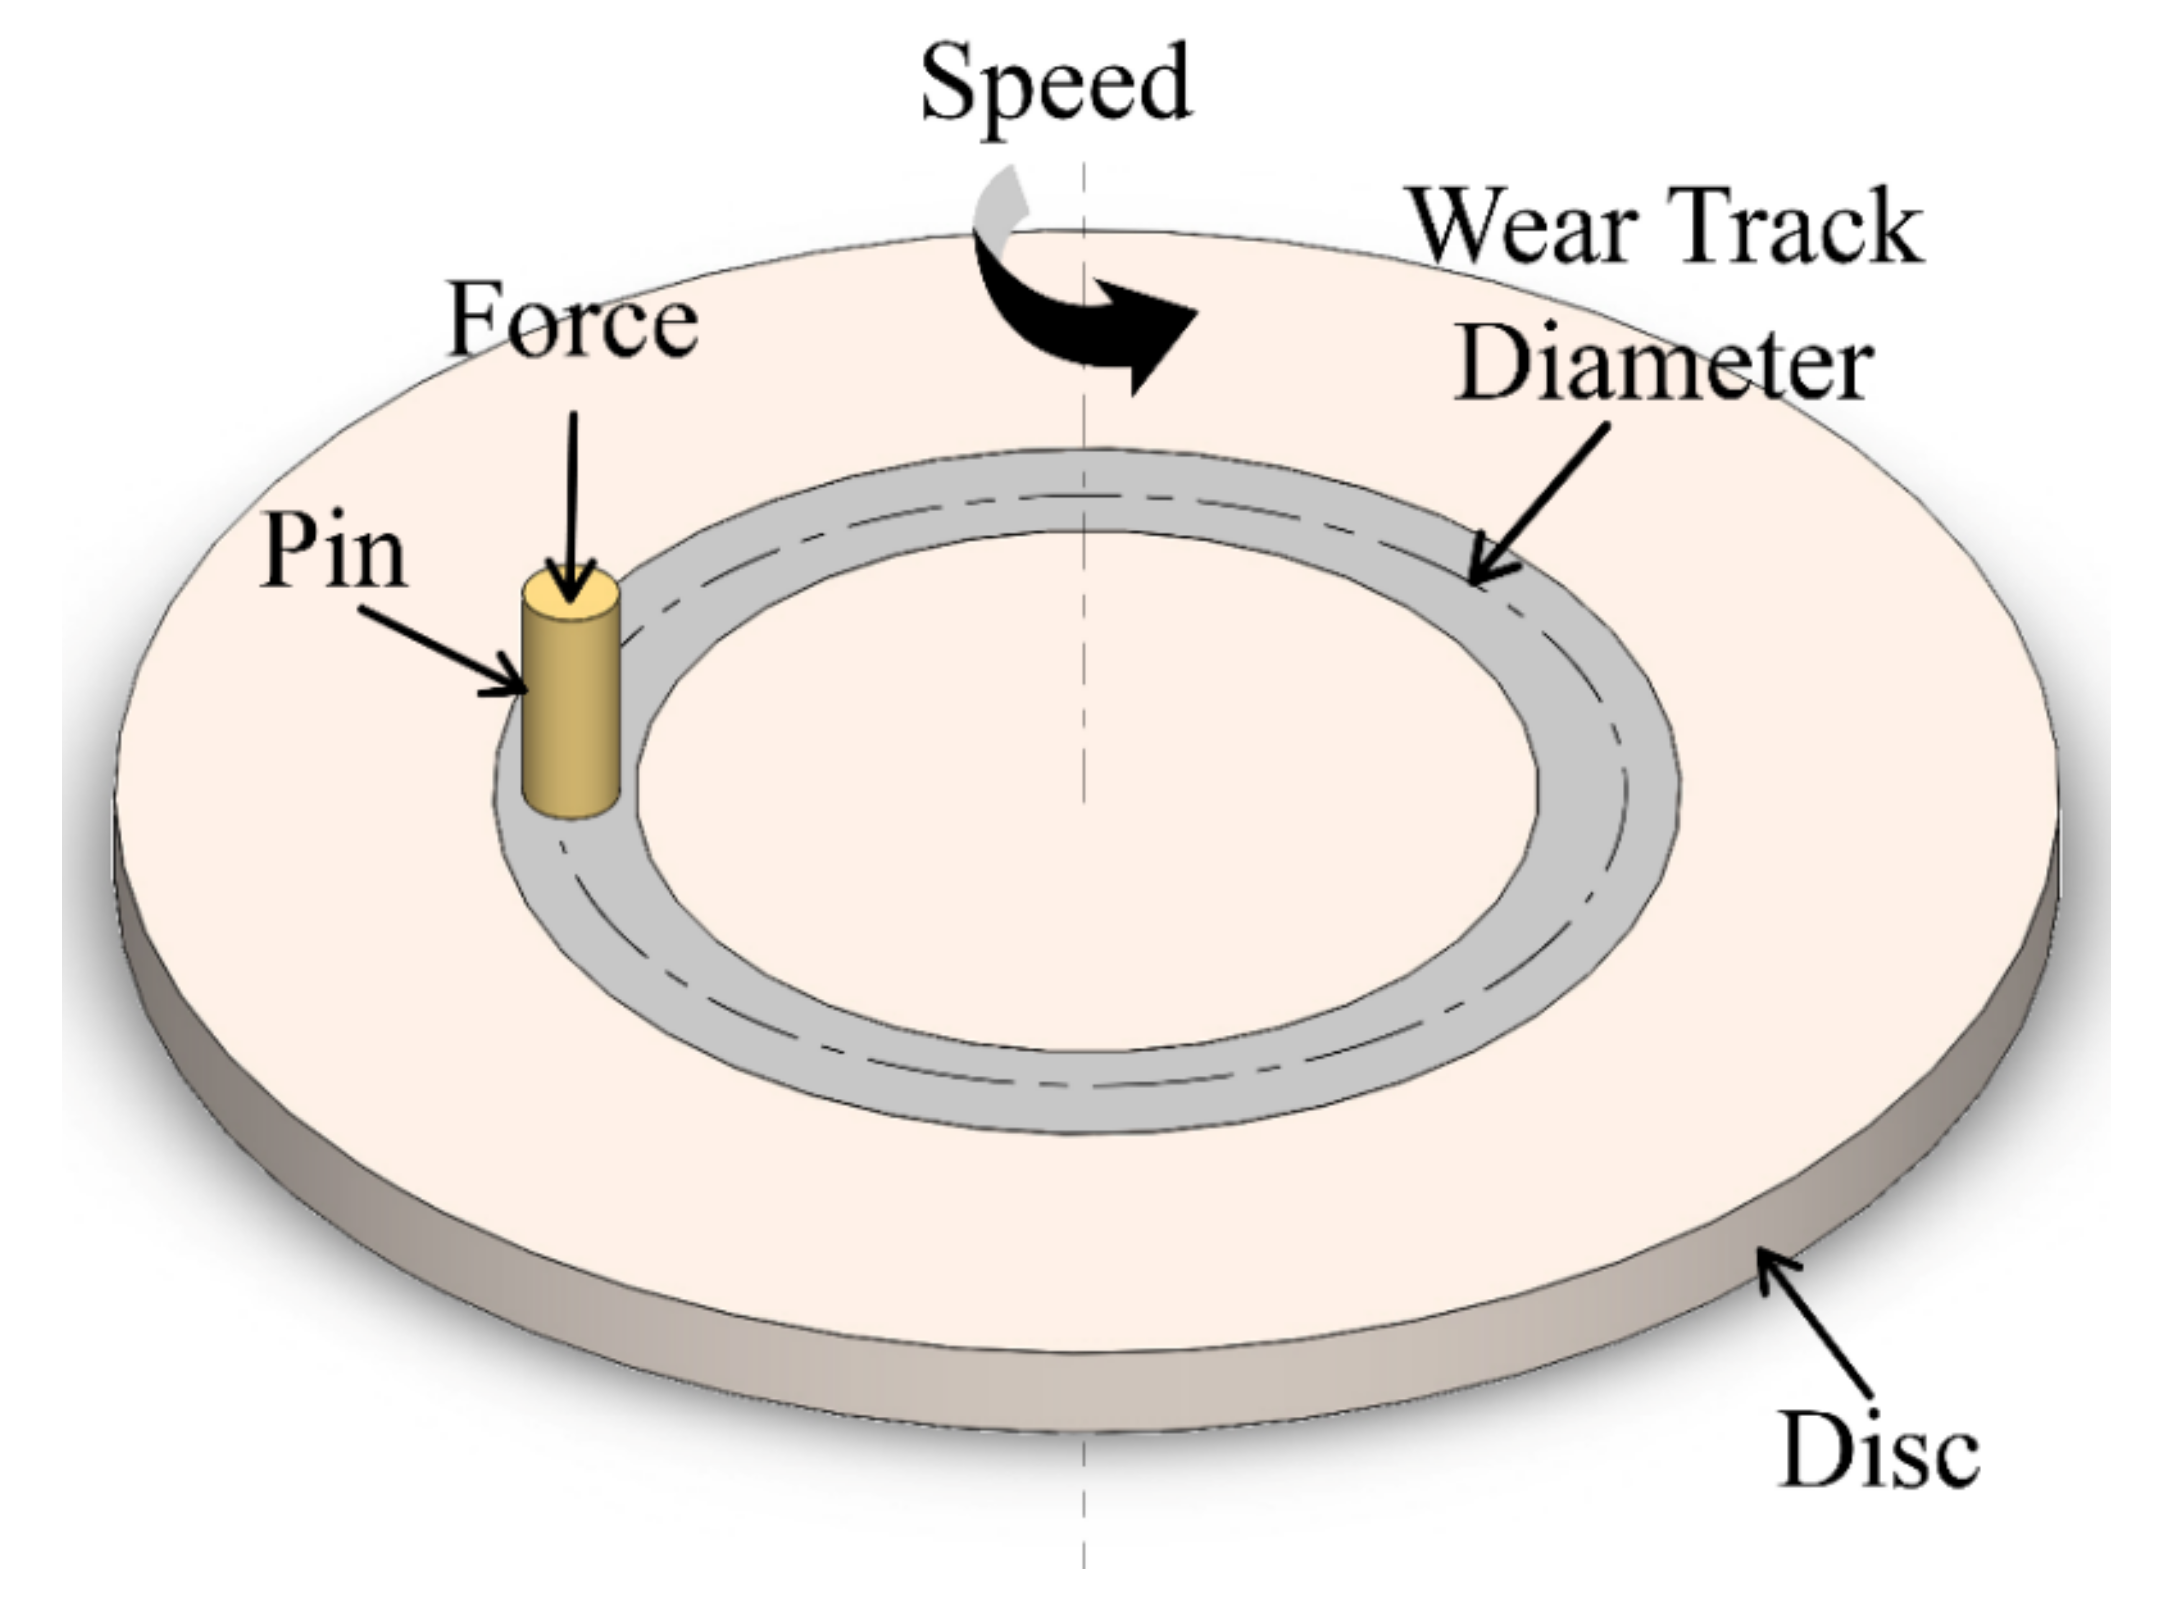
| Sliding diameter (mm) | 100 | ||
| Rotational speed (rpm) | 250 | 350 | 450 |
| Sliding speed (m/s) | 1.31 | 1.83 | 2.36 |
| Load (N) | 5 | 10 | 20 |
| Time (min) | 5 | 10 | 15 |
| Alloy | 0.2% Proof Stress (MPa) | Strength Coefficient (MPa) | Strain Hardening Exponent |
|---|---|---|---|
| Al–1.3%Si | 47.66 | 173.3 | 0.3193 |
| Al–1.5%Si | 131.99 | 233.3 | 0.1475 |
| Al–13.5%Si | 109.02 | 197.3 | 0.1792 |
| Phase | Prototype | Lattice Parameter a (nm) | Space Group Number | Space Group |
|---|---|---|---|---|
| FCC-Al | Cu | 0.4047 | 225 | Fm-3m |
| Diamond Si | C (Diamond) | 0.5430 | 227 | Fd-3m |
| Iteration | Level of Each Factor | Cumulative Mass Loss Responses | ||||
|---|---|---|---|---|---|---|
| Speed | Normal Load | Time | Al–1.5% Si | Al–1.3% Si | Al–13.5% Si | |
| 1 | −1 | 1 | −1 | 0.0136 | 0.0304 | 0.0111 |
| 2 | 1 | −1 | 1 | 0.0165 | 0.0082 | 0.0039 |
| 3 | −1 | −1 | 1 | 0.0046 | 0.0047 | 0.0034 |
| 4 | 1 | −1 | −1 | 0.0025 | 0.0014 | 0.0012 |
| 5 | 1 | 1 | 1 | 0.0522 | 0.1481 | 0.0186 |
| 6 | −1 | 1 | 1 | 0.0190 | 0.0432 | 0.0160 |
| 7 | 1 | 1 | −1 | 0.0369 | 0.0827 | 0.0128 |
| 8 | −1 | −1 | −1 | 0.0009 | 0.0013 | 0.0009 |
Publisher’s Note: MDPI stays neutral with regard to jurisdictional claims in published maps and institutional affiliations. |
© 2022 by the authors. Licensee MDPI, Basel, Switzerland. This article is an open access article distributed under the terms and conditions of the Creative Commons Attribution (CC BY) license (https://creativecommons.org/licenses/by/4.0/).
Share and Cite
Mostafa, A.; Alshabatat, N. Microstructural, Mechanical and Wear Properties of Al–1.3%Si Alloy as Compared to Hypo/Hyper–Eutectic Compositions in Al–Si Alloy System. Crystals 2022, 12, 719. https://0-doi-org.brum.beds.ac.uk/10.3390/cryst12050719
Mostafa A, Alshabatat N. Microstructural, Mechanical and Wear Properties of Al–1.3%Si Alloy as Compared to Hypo/Hyper–Eutectic Compositions in Al–Si Alloy System. Crystals. 2022; 12(5):719. https://0-doi-org.brum.beds.ac.uk/10.3390/cryst12050719
Chicago/Turabian StyleMostafa, Ahmad, and Nabeel Alshabatat. 2022. "Microstructural, Mechanical and Wear Properties of Al–1.3%Si Alloy as Compared to Hypo/Hyper–Eutectic Compositions in Al–Si Alloy System" Crystals 12, no. 5: 719. https://0-doi-org.brum.beds.ac.uk/10.3390/cryst12050719