Article

Structural, Interfacial, and Electrochemical Stability of La0.3Ca0.7Fe0.7Cr0.3O3-δ Electrode Material for Application as the Oxygen Electrode in Reversible Solid Oxide Cells

by
Haris Masood Ansari
1,
David Avila-Brande
2,
Steve Kelly
3,
Paul Kwesi Addo
1 and
Beatriz Molero-Sánchez
1,*
1
SeeO2 Energy, 3655 36 ST NW, Calgary, AB T2L 1Y8, Canada
2
Departamento de Química Inorgánica, Facultad de Ciencias Químicas, Universidad Complutense de Madrid, 28040 Madrid, Spain
3
ZEISS, Carl Zeiss X-ray Microscopy, 4385 Hopyard Rd #100, Pleasanton, CA 94588, USA
*
Author to whom correspondence should be addressed.
Submission received: 27 April 2022 / Revised: 7 June 2022 / Accepted: 11 June 2022 / Published: 15 June 2022
(This article belongs to the Special Issue Solid State Chemistry: Memorial Issue for Professor Emilio Morán)

Abstract

:
A detailed study aimed at understanding the structural, interfacial, and electrochemical performance stability of La0.3Ca0.7Fe0.7Cr0.3O3-δ (LCFCr) electrode material for application as the oxygen electrode in reversible solid oxide cells (RSOCs) is presented. Specifically, emphasis is placed on the stability of the LCFCr oxygen electrode during oxygen evolution (electrolysis mode), whereby many known electrode materials are known to fail due to delamination. The porous microstructure of the electrode was characterized by nanoscale X-ray microscopy (XRM) to reveal the percentage porosity, pore connectivity, average pore size, and electrochemical surface area, etc. Under polarization in a two-electrode symmetrical-cell configuration, while the working electrode was under anodic polarization, a very stable performance was observed at a cell potential of 0.2 V, although increasing the cell potential to 0.65 V caused significant performance degradation. This degradation was reversible when the cell was run at open circuit for 10 h. High-resolution transmission electron microscopy and wavelength dispersive spectroscopy revealed that the working electrode (LCFCr)/electrolyte (GDC) interface was structurally and chemically stable after hundreds of hours under polarization with no interdiffusion of the various species observed across the interface, hence rendering LCFCr a viable alternative for the oxygen electrode in RSOCs.

1. Introduction

The concerns about CO2 emissions and global warming and the subsequent shift toward renewable sources to generate power has led to extensive research activity in the area of solid oxide cells (SOCs) in recent years. Renewable energy from sources such as solar and wind suffers from intermittency issues [1], thereby fueling the search for technologies that can store it when the demand is low and utilize it when the demand is high. Reversible SOCs (RSOCs) are devices that run at high temperatures, typically 600–900 °C, and can potentially function as a battery, hence storing renewable electricity when the demand is low and producing power when the demand is high [2]. The device consists of an electrolyte (that can conduct O2− at elevated temperature) sandwiched between two porous electrodes, namely the fuel electrode and air electrode, respectively. In the storage mode (electrolysis), feedstock such as CO2, steam, or CO2 + steam, is fed to the fuel electrode to electrochemically convert it into CO, H2, or syngas (CO + H2), and hence electrical energy can be stored as the chemical energy of fuels [2]. At the same time, a pure O2 stream is generated at the air electrode. In the generation mode, the products of the aforementioned electrolysis process can be fed to the same cell working in reverse (fuel cell mode) to generate power on demand. The major advantages of utilizing RSOCs over low temperature fuel cells/electrolyzers are fuel flexibility, product selectivity and low power consumption owing to favorable thermodynamics at elevated temperatures leading to high electrical efficiency [3].
Although RSOCs offer a promising solution to not only efficiently store renewable electricity but also utilize CO2 from industrial emissions to convert it into useful fuels and chemicals, there are still a host of practical challenges that have limited the widespread commercialization/adoption of this technology. The primary challenge comes from the reversible nature of RSOCs, which will switch from the SOEC mode to the SOFC mode as required [4]. Since the state-of-the-art electrolyte materials already show high performance and stability, this places an onus on the electrode materials so that the cell performance is not limited by them. In a typical RSOC, the electrodes would be cycled through different gas environments (oxidizing and reducing) as well as experiencing polarization reversal, hence many of the practical challenges associated with RSOC electrodes are related to their interaction with the gas environments and their stability (and that of the electrode/electrolyte interfaces) as a result of varying gas environment and polarization under both modes of operation. Among these, the delamination of the air electrode in the electrolysis mode (oxygen evolution) during long-term cell operation is a major challenge that needs to be addressed to make these devices commercially viable. The state-of-the-art air electrodes consist of strontium-doped lanthanum manganite (LSM) that suffer from delamination issues during oxygen evolution [3]. The common causes of delamination are high oxygen partial pressure buildup during operation [5], oxygen vacancy concentration-induced thermal expansion coefficient (TEC) mismatch at the electrode/electrolyte interface [6], secondary phase formation [7], and phase and morphological changes [8], to name a few. Mixed ionic electronic conductors (MIECs), such as lanthanum strontium cobalt ferrite (LSCF), have been extensively researched to mitigate this issue [9], which does not completely eliminate the delamination issue despite lowering it to a large extent [10]. Some other promising perovskite oxide based oxygen electrode materials explored include Ba0.5Sr0.5Co0.8Fe0.2O3−δ (BSCF) [11], SrTi1−xFexO3−δ (STF) [12], PrBa0.8Ca0.2Co2O5+δ (PBCC) [13] and La2NiO4+δ (LNO) [14], among others. Although many of the aforementioned electrode materials exhibit excellent performance at temperatures as low as 600 °C [11], there are unresolved degradation issues that need to be addressed before their use in commercial SOCs. For example, BSCF oxygen electrodes have been shown to rapidly degrade in performance by Ba surface segregation or CO2 absorption [12], while LNO decomposes to other higher order Ruddlesden–Popper (RP) phases during electrolysis [15].
Our efforts on the development of electrode materials for SOCs have led to the discovery of calcium and strontium-doped lanthanum chromium ferrites (La0.3M0.7Fe0.7Cr0.3O3-δ, LMFCr, M = Sr, Ca) MIEC perovskite materials that not only compatible with the state-of-the-art electrolytes, but also chemically, structurally, and electrochemically stable all the way from air to the pO2 of feedstock (0.21 atm–10−20 atm) [2,16,17,18,19,20,21,22,23]. Furthermore, these materials exhibit remarkable electrochemical activity in both air and fuel environments [2,18,22,23,24], hence can be employed as both the fuel and the air electrode (symmetrical RSOCs), thus simplifying cell requirements and lowering manufacturing cost.
In this work, we employed nanoscale X-ray microscopy (XRM), high-resolution transmission electron microscopy (HRTEM), electrochemical impedance spectroscopy (EIS), and cyclic voltammetry (CV) to characterize the chemical, microstructural and electrochemical stability of the Ca analogue of LMFCr, namely La0.3Ca0.7Fe0.7Cr0.3O3-δ (LCFCr), as an air electrode under anodic polarization (oxygen evolution). Owing to the smaller ionic radius of Ca2+ as compared to that of Sr2+, the TEC of LCFCr is significantly lowered as compared to LSFCr, thus enhancing its compatibility with state-of-the-art electrolytes, and hence our interest in Ca-doping [16,25]. The results presented herein show that LCFCr is a viable alternative for the oxygen electrode in RSOCs with high chemical and structural stability and highly stable electrode/electrolyte interfaces under polarization with no evidence of delamination or formation of secondary phases observed.

2. Materials and Methods

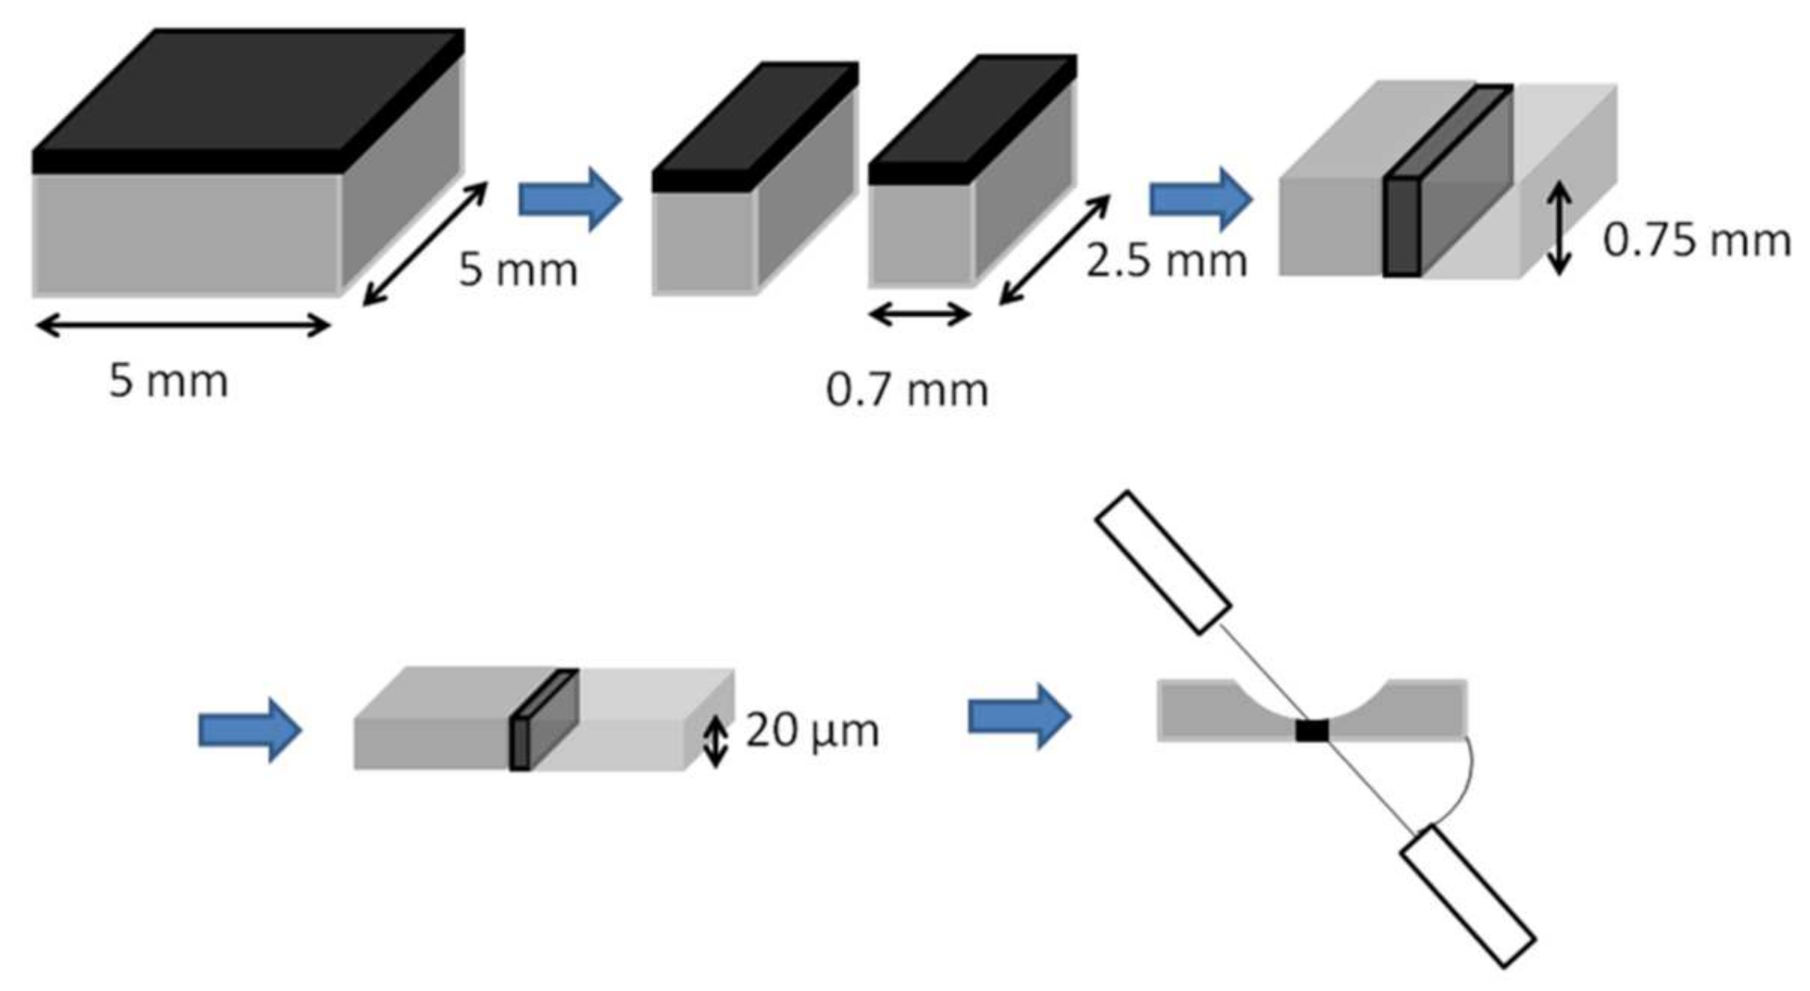
2.1. Cell Fabrication and Testing

LCFCr powders obtained by glycine nitrate combustion method described elsewhere [2,22] were milled (high-energy planetary ball mill, Pulverisette 5, Fritsch, Germany) in an isopropanol medium at a rotation speed of 300 rpm for 2 h using zirconia balls.
An organic slurry consisting of ethyl cellulose, butyl benzyl phthalate, n-butanol, and terpineol was mixed with LCFCr powder in a 1:1 ratio by weight and then symmetrically screen-printed (over an area of 0.5 cm2) onto both sides of a commercial 250 µm gadolinium doped ceria (GDC) disc electrolyte (Fuel Cell Materials), forming ca. 25 µm thick LCFCr electrode layers, followed by firing at 1100 °C in air for 2 h. Au paste (C 5729, Heraeus Inc., Germany) was painted on both of the electrode layers to serve as the current collectors. The cell was mounted on the FCSH-V3 cell testing setup (Material Mates, Italy) in which the cell was sandwiched between 2 Au gauzes that are attached to spring loaded porous ceramic inserts for easy gas access to the electrodes. Each Au gauze is connected to 2 Au wires for 4-probe, 2-electrode measurements.
In all of this work, the electrochemical measurements to evaluate the cell performance were performed using the 2-electrode technique in air. Using a 2-electrode configuration, either of the LCFCr/GDC interfaces could be made to experience a similar electrochemical perturbation so that either interface could be examined, which made the sample preparation simpler. Impedance spectra were collected under open circuit conditions at 800 °C, using an amplitude of 50 mV in the frequency range of 0.01–65 kHz using a Solatron 1287/1255 potentiostat/galvanostat/impedance analyzer. Other experiments involved the application of a cell potential of 0.2 V and 0.65 V. Zview software was used to fit and analyze the impedance data.

2.2. Cell Characterization

All samples investigated by scanning electron microscopy (SEM) were first sputter-coated with Au in an EMITECH K550 apparatus. Field-emission SEM (FE-SEM) was performed using a JEM 6335 F electron microscope operating at 10 kV. The FE-SEM was also equipped with a LINK ISIS 300 detector for the energy-dispersive spectroscopy (EDS). SEM imaging of the cells and attached electrode layers was carried out using a Zeiss Σigma VP field emission SEM. A JEOL JXA-8200 electron microprobe analyzer (EMPA) was used to detect cation interdiffusion and electrode delamination at the interfaces between the electrodes and the electrolyte
Nano-scale 3D X-ray microscopy (XRM) was performed on a ZEISS Xradia 810 Ultra microscope using Cr Kα (5.4 keV) characteristic X-rays. Details about the theory, configuration, and use of the system can be found elsewhere [26,27]. In short, the microscope uses a reflective capillary condenser lens and a Fresnel zone plate objective lens to produce radiographs of the sample with a resolution down to 50 nm. Three-dimensional data were acquired by rotating the sample in the X-ray beam and reconstructing the individual radiographs into a three dimensional image of the sample. The sample was prepared for XRM by isolating a square cross-sectional pillar using a DISCO DAD3240 dicing saw. The isolated pillar was left attached to a ~2 mm × 2 mm piece of the original sample and glued to a small diameter SEM stub for imaging in the XRM. Nanoscale XRM imaging was performed using the absorption contrast operating mode of the microscope at both the large field of view (LFOV) and high-resolution (HRES) magnifications. In the absorption contrast mode, the intensity values in the resulting data correspond to the X-ray absorption in different areas of the sample. Scan times ranged from 16.5 h in LFOV to 17.5 h in HRES. Following data acquisition, the individual radiographs were reconstructed into a 3D volume using a filtered back projection algorithm to yield data with voxel sizes of 64 nm (LFOV) or 32 nm (HRES). The reconstructed volumetric data were analyzed and visualized using the Dragonfly Pro software package (Object Research Systems).

2.3. HRTEM Analysis

For the HRTEM analysis, the post mortem cells were first cut into 5 × 5 mm-sized samples, the samples were then cut using a low-speed diamond saw into 0.7 × 2.5 mm pieces, which were then cleaned in an ultrasonic bath (Figure 1). The samples were then glued together with an epoxy and the glued “sandwich” was left in a press at high temperature (150 °C) to cure the resin.
The sample was then thinned down to 15 µm using a mechanical polishing procedure. First, one side of the sandwich was polished (Figure 1). The thickness of the specimen was then measured to obtain a reference thickness value. This step was repeated to polish the second side until the sample was thinned to approximately 15 µm. The 15 µm specimen was glued to a 3 mm Cu ring, which served as the support (Figure 1). The final thinning of the specimen to electron transparency was performed with a low-angle and low-voltage ion milling process. The ion mill was equipped with two Ar ion beams that work at 4 or 5 kV and then serve to mill the sample until a small hole was made. The edges of this hole were thin enough for TEM observation (Figure 1).
The analysis of the LCFCr powders was performed using a JEOL 3000F TEM, yielding a resolution limit of 1.1 Å. Images were recorded with an objective aperture of 70 µm. Fast Fourier transforms (FFTs) of the HRTEM images were carried out using the Digital Micrograph package. High-angle annular dark field (HAADF) scanning TEM (STEM) investigation was performed on an ARM200cF microscope, fitted with a condenser lens aberration corrector (point resolution in STEM mode of 0.08 nm). HAADF images were acquired with an inner acceptance angle of 90 mrad. EELS mapping was performed in the same ARM200cF microscope with a collection semi-angle β ~ 30 mrad, 0.5 eV per channel dispersion and collection time for each spectrum of 0.09 s. La-M4,5, Fe-L2,3, and Ca-L2,3 edge signals were chosen for mapping.

3. Results

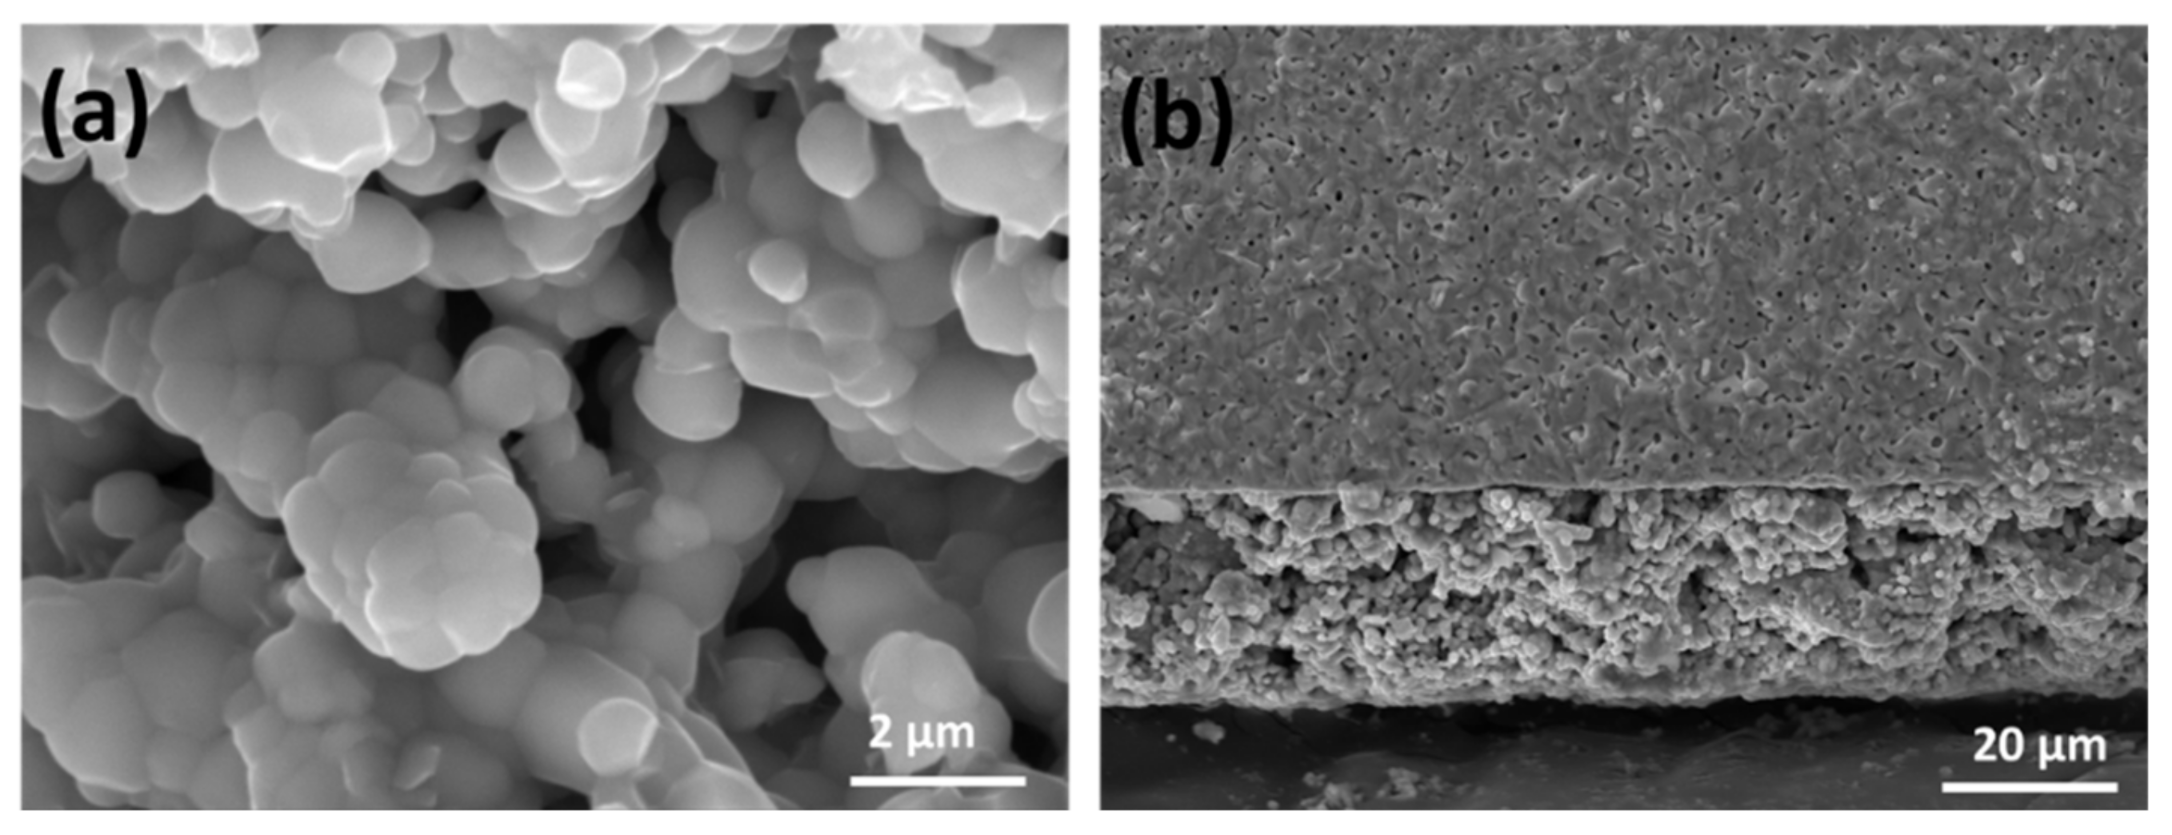
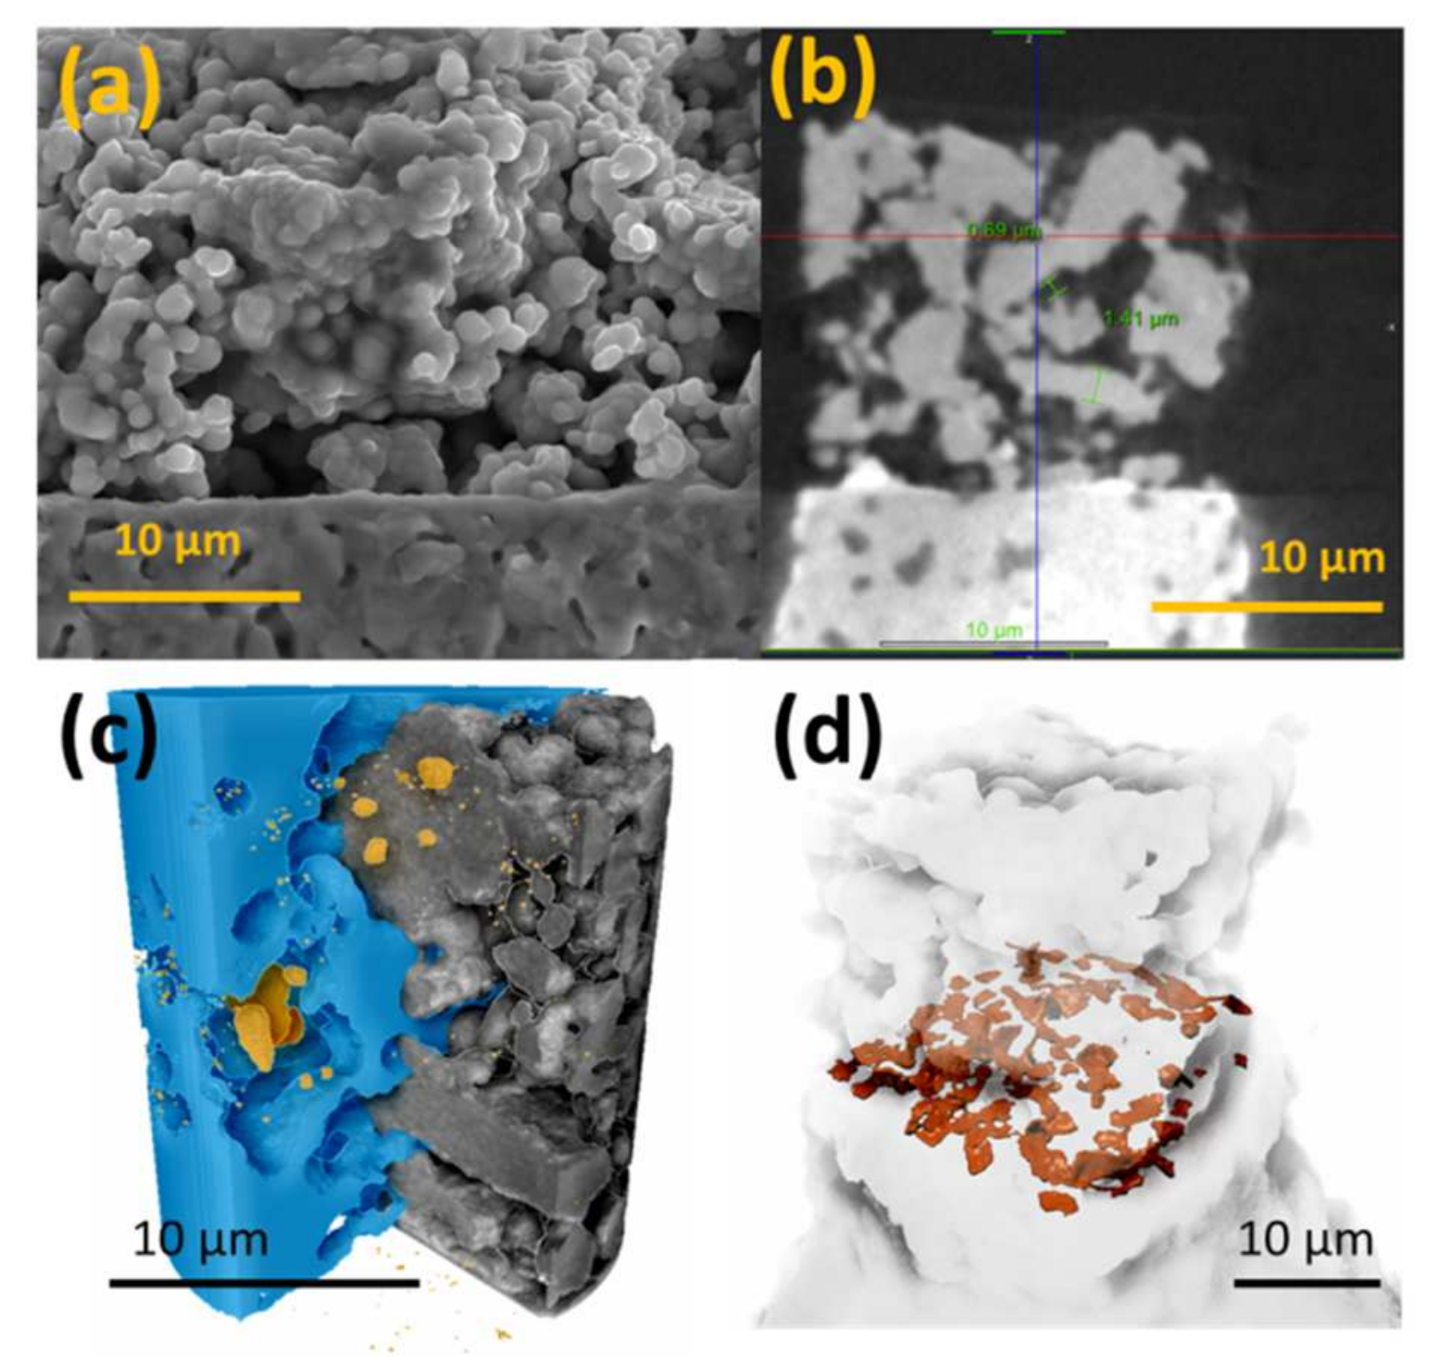
3.1. SEM and 3D X-ray Microscopy (XRM) of As-Prepared Cells

The microstructure of the as-prepared electrode layers was analyzed using back-scattered scanning electron microscopy (BS-SEM) and 3D X-ray microscopy (XRM) to examine the porosity of the LCFCr layer and quality of the electrode/electrolyte interface. Figure 2a shows high-magnification BS-SEM images of the as-prepared electrode layer. The layer is highly porous with mostly interconnected porosity that is highly desirable for an SOC electrode. The LCFCr/GDC interface (Figure 2b) is continuous with good contact between the LCFCr electrodes and the GDC electrolyte. For the electrode layer for an SOC electrode to work efficiently, the microstructure should be such that it allows easy access of the gas phase to the double phase/triple phase boundaries (DPB/TPB) for facile electrochemical reaction. At the same time, the electrode should be mechanically stable, which sets a limit on the percentage of porosity that can be tolerated [28]. Another important aspect related to porosity is the internal surface area of the interconnected porosity. The activity of an SOC electrode is conventionally reported per geometric surface area, although the more important parameter is the total internal surface area, i.e., the electrochemical surface area. This is because the gas species have to adsorb on these surfaces for the electrochemical reaction to take place. As can be seen from Figure 2a, it is very challenging to estimate the 3D interconnected porosity and internal surface area from a 2D image, hence a tomographic technique is required for a reasonable estimate.
In this work, we tried to address this issue by employing nanoscale X-ray microscopy (XRM) to shed light on the 3D microstructure of the electrode layer to characterize the percentage and type of porosity (isolated, connected), internal surface area of the pores, average pore size, and interfacial contact area of the electrode layer. Figure 3 highlights the nanoscale XRM findings. As can be seen in Figure 3a,b, the nanoscale XRM images accurately represent the overall microstructure while giving a view inside the solid material. Figure 3b shows a virtual slice through the three-dimensional image of the prepared sample. The nanoscale XRM images were further analyzed by segmenting the individual voxels into distinct phases—LCFCr, GDC, or pore space. The pore space was further separated into isolated and connected pore space. Figure 3c shows the LCFCr and connected/isolated pore space together. Figure 3d shows the calculated interfacial contact area between the LCFCr and GDC phases. This analysis enables the calculation of the relevant microstructural parameters through further measurement and comparison between these collections of voxels. For example, the total porosity is calculated by comparing the volume of voxels assigned to the pore space with the total volume of voxels in the imaged sample. The pore diameters are measured by calculating the largest diameter of an inscribed sphere that touches each surface element of the pore space.
Table 1 shows the microstructural parameters of the as-prepared LCFCr electrode before electrochemical testing. The electrode layer consists of a near 50–50 composite of LCFCr and interconnected porosity, with an average diameter of ca. 0.65 µm, while a small amount of isolated porosity was also observed, as expected. As will be shown later, the electrode layer has sufficient porosity to maintain high activity for the oxygen evolution reaction (OER) and at the same time, the requisite mechanical strength to withstand the OER under anodic polarization without discernible degradation or delamination. Another important aspect that was determined by XRM was the internal surface area of the interconnected porosity. The ratio of the internal surface area of the interconnected porosity and the geometric surface area of the LCFCr pillar (ca. 400 µm2) is ~ 10, which means that the electrode with the listed microstructural parameters (Table 1) is at least 10 times more active than a dense electrode. On the other hand, the interfacial contact area of the LCFCr with the GDC electrolyte is ~½ the geometric area, which ensures a high TPB length for efficient OER.

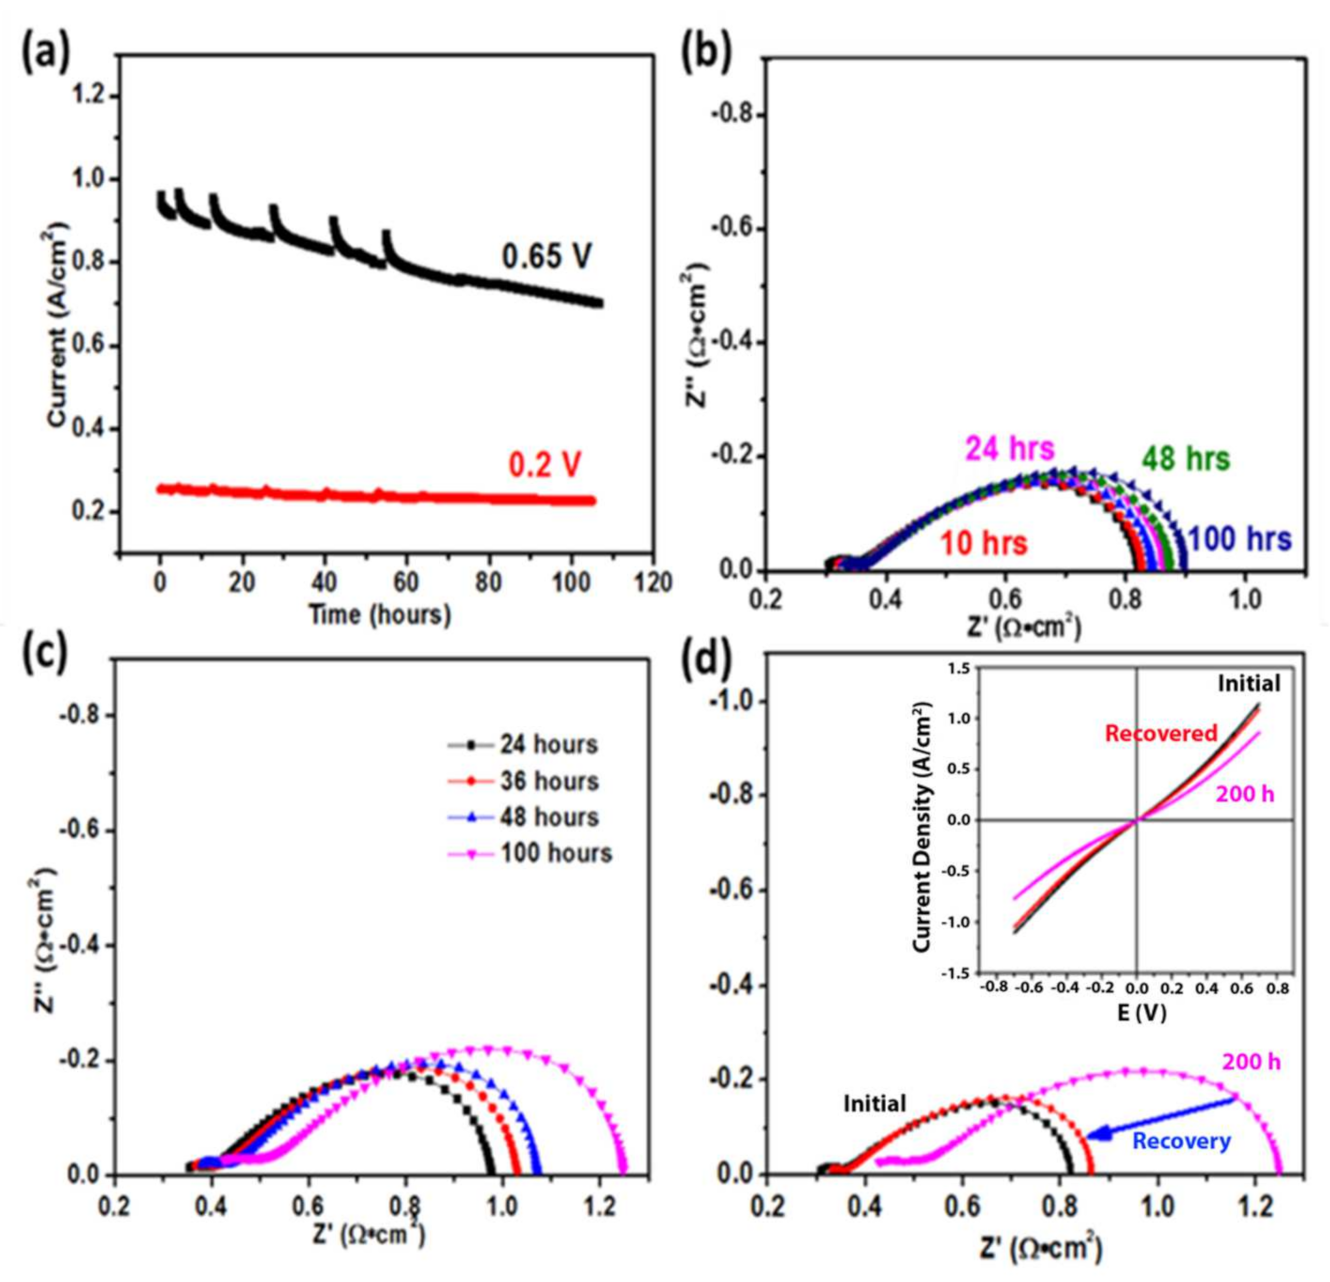
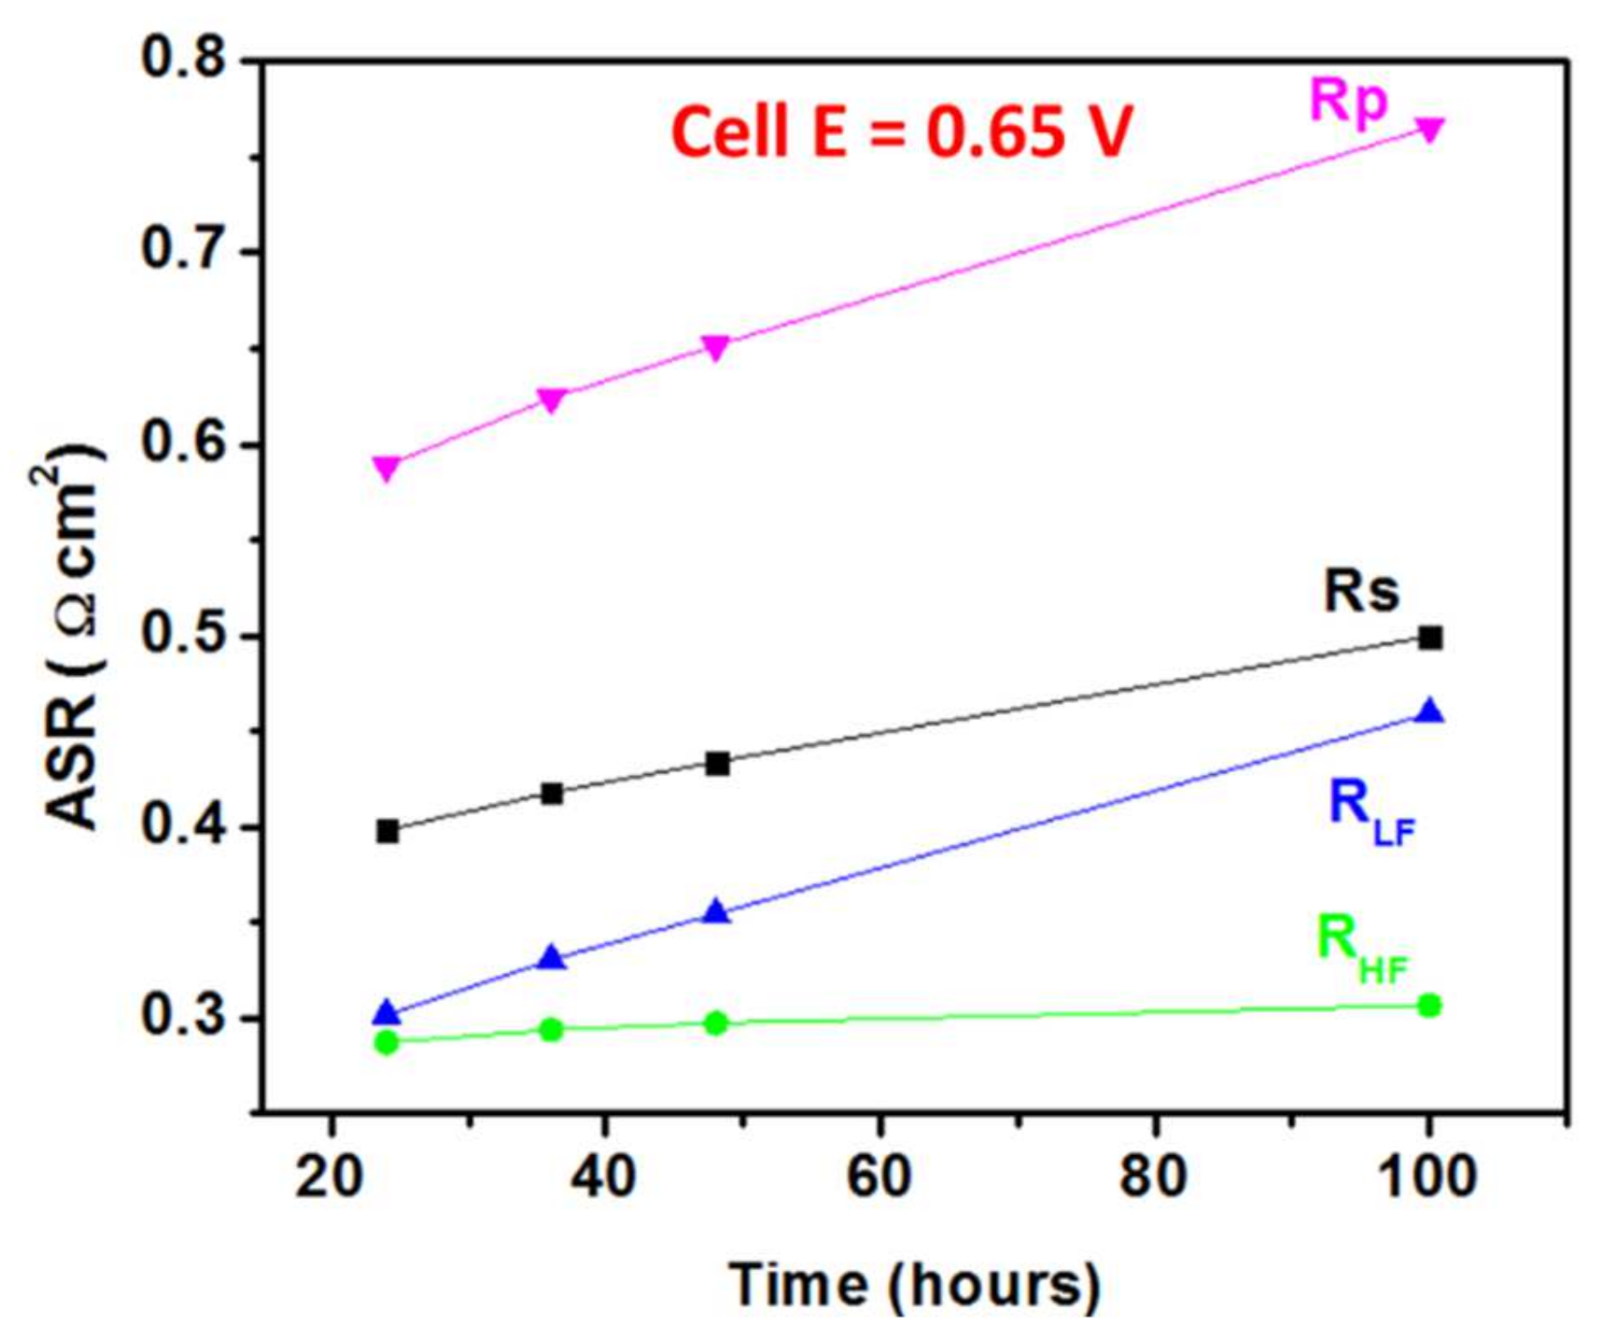
3.2. Electrochemical Testing

As discussed in our previous work [16,29], the delamination of the oxygen electrode from the electrolyte was reported to be a major degradation issue for RSOFCs, especially in the electrolysis mode (OER) [5,6,7,30,31]. To determine whether this problem would be encountered at the LCFCr/GDC interface, a medium-term potentiostatic study was carried out, applying several different cell potentials. Initially, a moderate cell potential of 0.2 V was applied, increasing this to 0.65 V, both for 100 h. The i/t measurements were interrupted at 3, 10, 24, 36, 48 and 100 h to collect both impedance and cyclic voltammetry (CV) data.
Figure 4a shows the i/t data at a 0.2 V cell potential, with the cell seen to be very stable. However, at 0.65 V cell potential, a more obvious loss in performance is observed. Figure 4b,c show the OCP EIS data collected after 3, 10, 24, 36, 48, and 100 h of polarization at these two cell potentials, respectively. To fully understand Figure 4, it is important to note that all of these experiments were performed using the same cell, starting at a cell potential of 0.2 V and then at 0.65 V. Finally, the cell was left at open-circuit potential (OCP) for 10 h before the next set of CVs and EIS were collected (Figure 4d).
The increase in cell polarization resistance (Rp) with time at a 0.65 V cell potential (Figure 4c) is more pronounced than the increase at 0.2 V (Figure 4b), as can be expected. Figure 4b shows an increase in Rp from 0.47 Ω cm2 (3 h) to 0.55 Ω cm2 (100 h, ca. 14%), while Figure 4c shows a larger increase in Rp at 0.65 V, from 0.59 Ω cm2 (3 h) to 0.76 Ω cm2 (100 h, ca. 28%).
Figure 4d shows the EIS and CV (inset) data for the fresh cell, the cell after 200 h of polarization, and the cell after 10 h at the OCP. It is noteworthy that almost complete performance recovery is observed, with the ohmic resistance (Rs) returning to the initial values of the fresh cell (Figure 4b) and Rp dropping to 0.50 Ω cm2 (vs. the 0.47 Ω cm2 initial value). This suggests that surface segregation under polarization could be the more likely cause for degradation, and since it can be reversed by running the cell at the OCP for 10 h at 800 °C, there is no permanent damage to the cell (e.g., electrode delamination) after these medium-term polarization experiments. Another factor responsible for the higher degradation rate observed at the higher cell potential of 0.65 V could be the degradation of the counter electrode (that is under cathodic polarization in a 2-electrode symmetrical-cell configuration) or its interface with the electrolyte. In an earlier three-electrode work [16], we showed that LCFCr electrodes exhibit slightly lower degradation under anodic polarization than under cathodic polarization, hence the contribution of the degradation of the counter electrode or its interface with the electrolyte to the overall cell degradation cannot be ruled out.
Two time constants are clearly observed over the full frequency range (Figure 4), thus the impedance responses were fitted to the same two-time constant equivalent circuit used in our previous work [17,19,21,32]. As also already discussed in our previous work [17,21,29,32], the capacitance (CHF) and resistance (RHF) associated with the process appearing at higher frequencies is related to the electrode/electrolyte interface, while the low frequency process is related to the electrochemical reaction at the electrode/gas interface (RLF) and the chemical capacitance (CLF) arising from LCFCr redox chemistry [17].
Figure 5 shows the total (Rp), ohmic (Rs), high (RHF) and low (RLF) resistance trends, again showing that the largest contribution to the total polarization resistance comes from the low frequency process (RLF). Figure 5 also shows that RHF remains very stable with time, increasing only from 0.29 to 0.31 Ω cm2 (by ca. 7%). The observed stability of the high frequency resistance is consistent with the high quality of the electrode/electrolyte interface, even after 100 h under polarization. The LCFCr/GDC interfacial properties will be discussed further in the following post mortem analysis section.
However, RLF significantly increases with time from 0.30 to 0.45 Ω cm2 (ca. 50%). Its associated capacitance (CLF) was also very stable, with a value typical of the chemical capacitance obtained when using MIEC electrodes [24,33] and related to their redox chemistry. Lastly, as seen in Figure 5, Rs increases with time from 0.40 to 0.50 Ω cm2 (ca. 25%), which again may indicate that the degradation observed in Figure 4 arises at least partly from the current collectors.

3.3. Post Mortem Cell Microstructure Studies

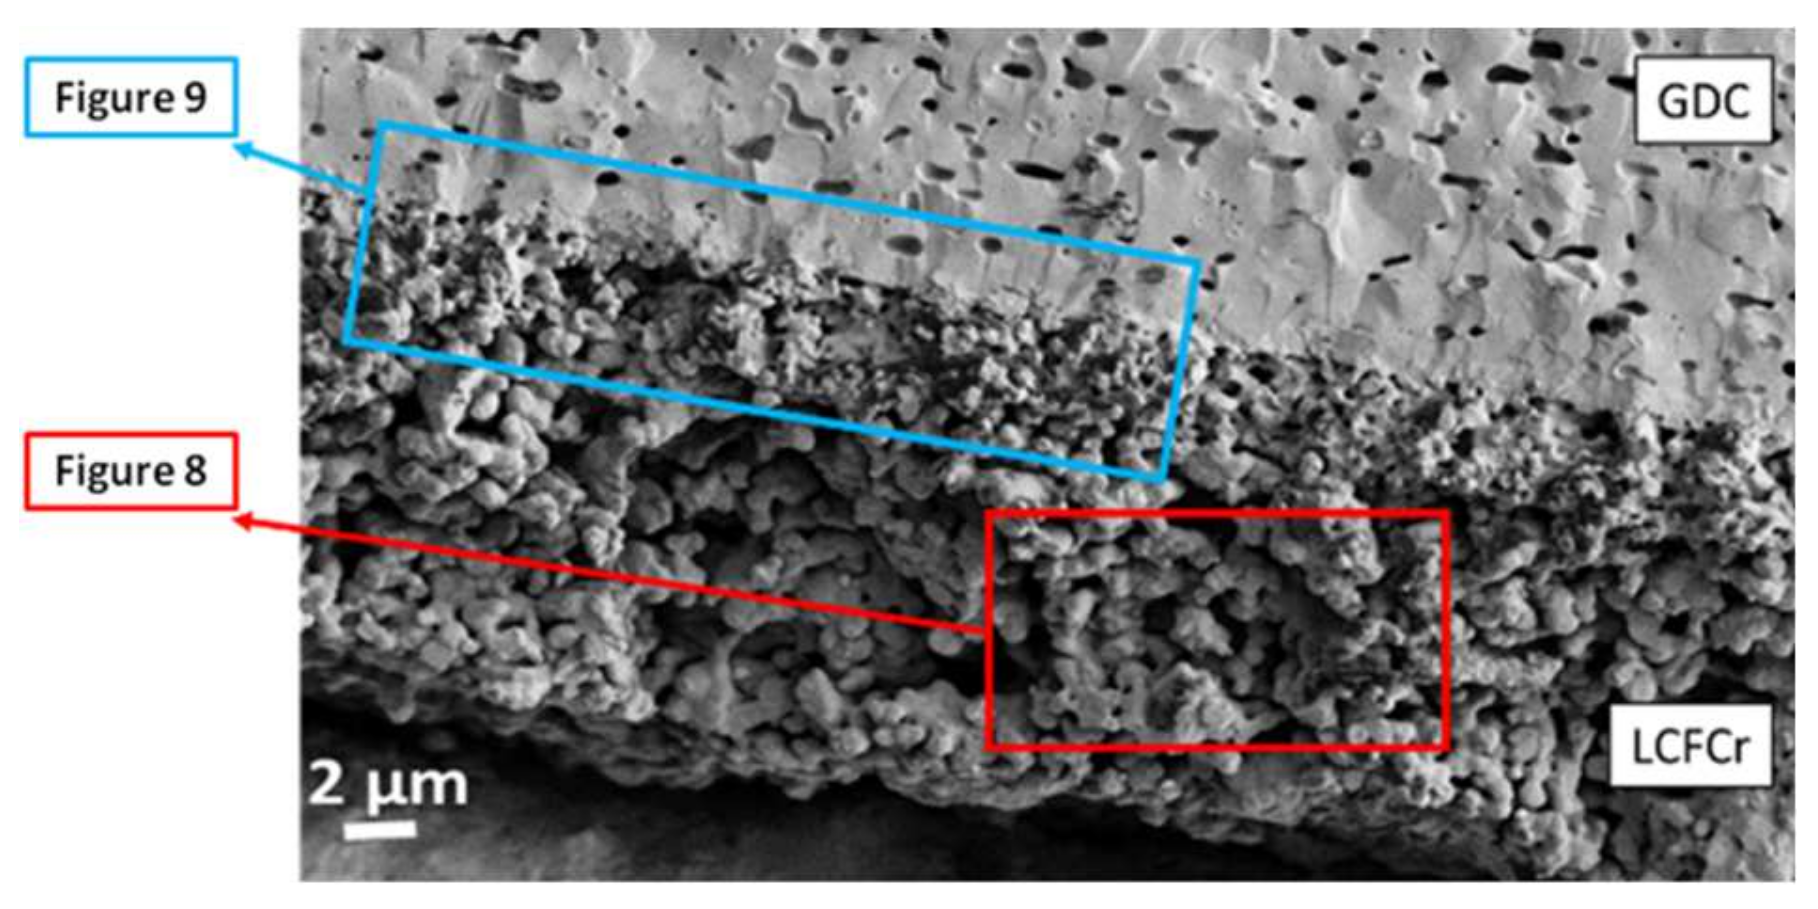
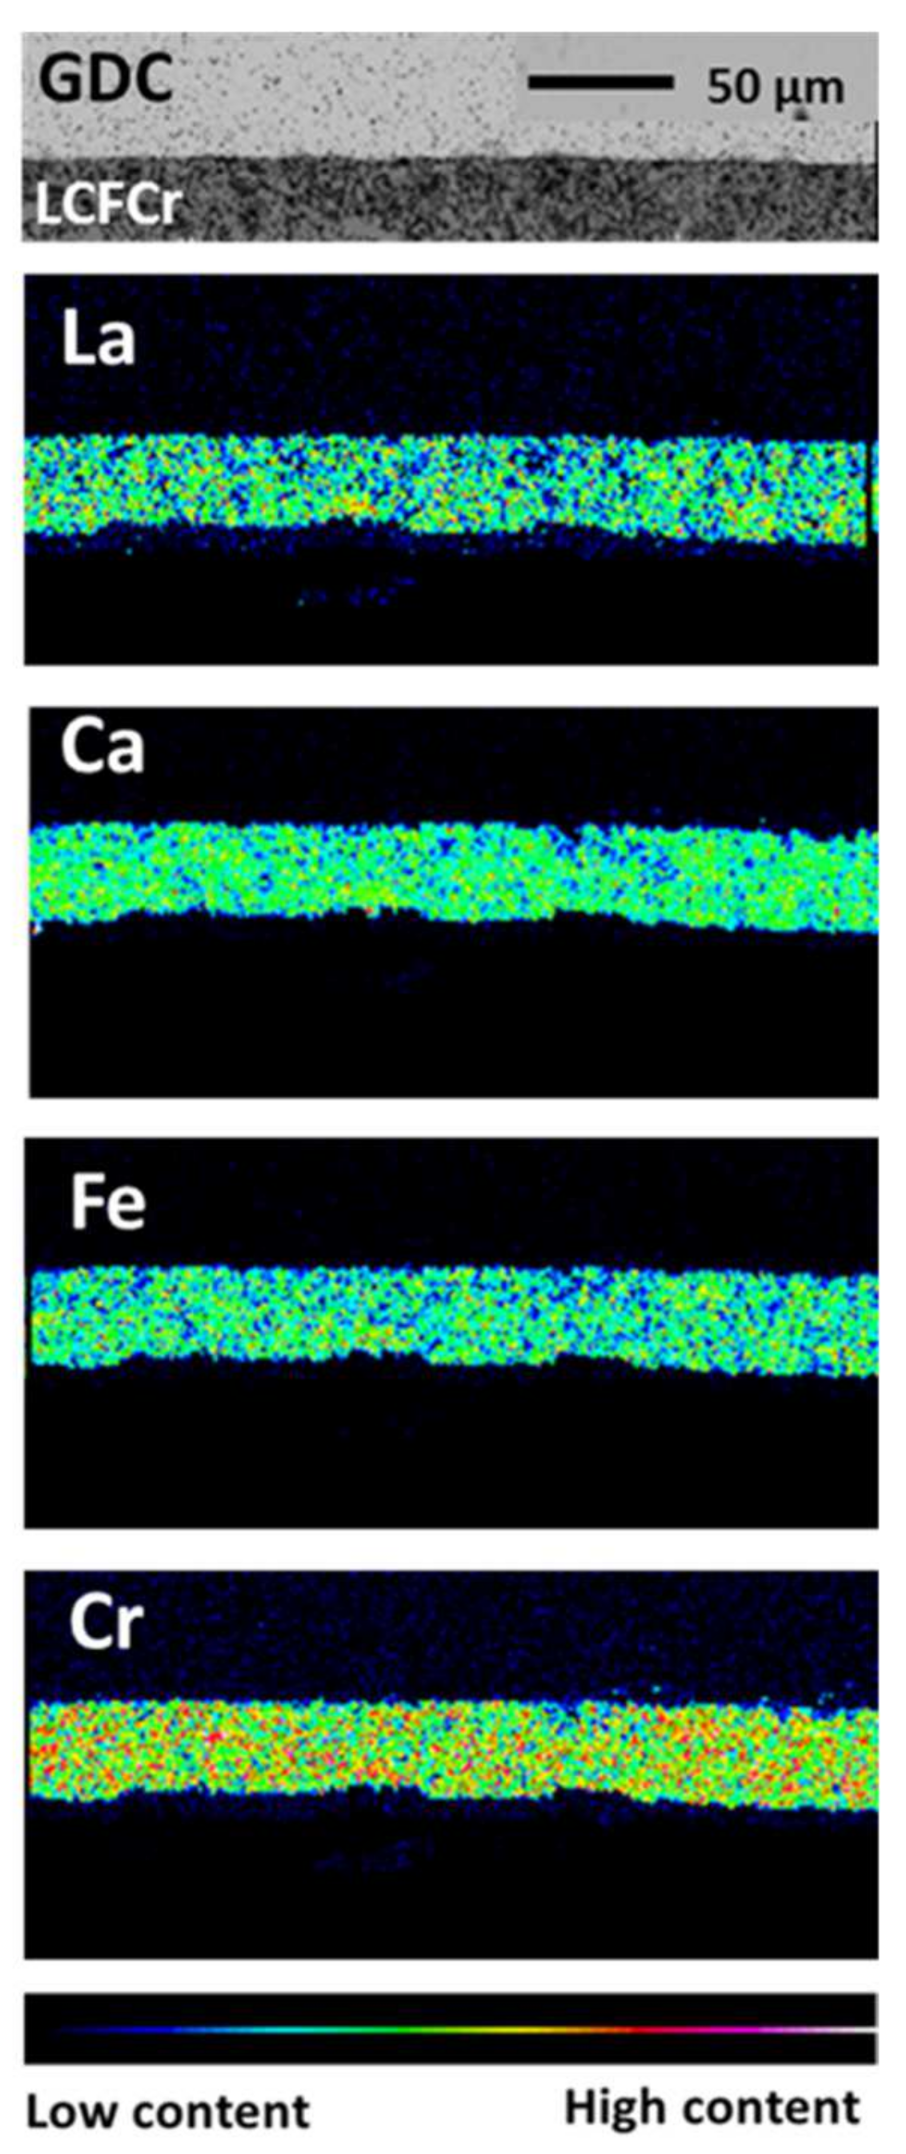
3.3.1. SEM Analysis of La0.3Ca0.7Fe0.7Cr0.3O3-δ (LCFCr)-Based Cells

The cells studied electrochemically were examined after long-term testing to determine whether any degradation could be seen, especially at the LCFCr/GDC interface of the working electrode that had been subjected to anodic polarization (oxygen evolution) while the counter electrode was under cathodic polarization. The cell microstructure was analyzed using back-scattered scanning electron microscopy (BS-SEM) to examine the quality of the electrode/electrolyte interface and seek evidence of electrode delamination. Figure 6 shows a cross-sectional BS-SEM image of the cell. The LCFCr/GDC interface, after a total of 200 h of testing at cell potentials first of 0.2 V and then at 0.65 V, retained continuous good contact with no delamination or cracking detected. Additionally, the LCFCr electrode is seen to still have very good porosity, very similar to what is commonly seen in freshly prepared electrode layers.
In order to determine whether any inter-diffusion of elements could be detected, the elemental distribution within the layers of the cell was studied by back-scattered electron (BSE) imaging and individual wavelength-dispersive X-ray spectroscopy (WDX) element maps after electrochemical testing. Figure 7 (top) illustrates the electron microprobe image and elemental maps of the polished cross-section. These individual WDX element maps show no evidence for cation inter-diffusion between the electrode and electrolyte, at least at this relatively low level of resolution, which is another very promising result.

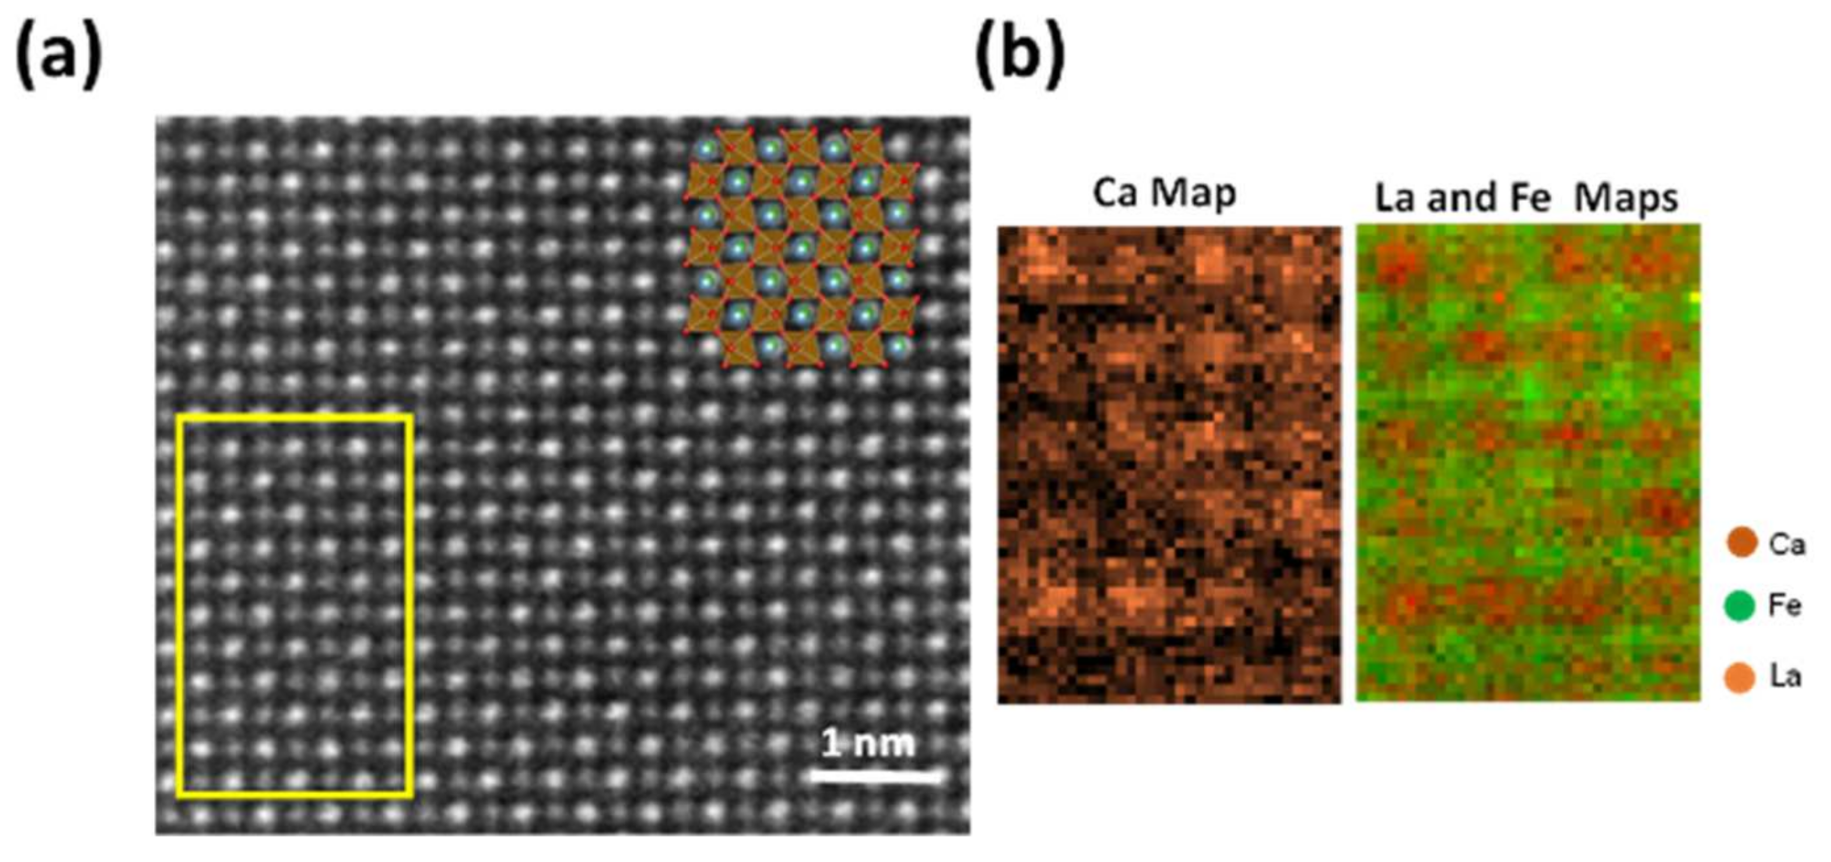
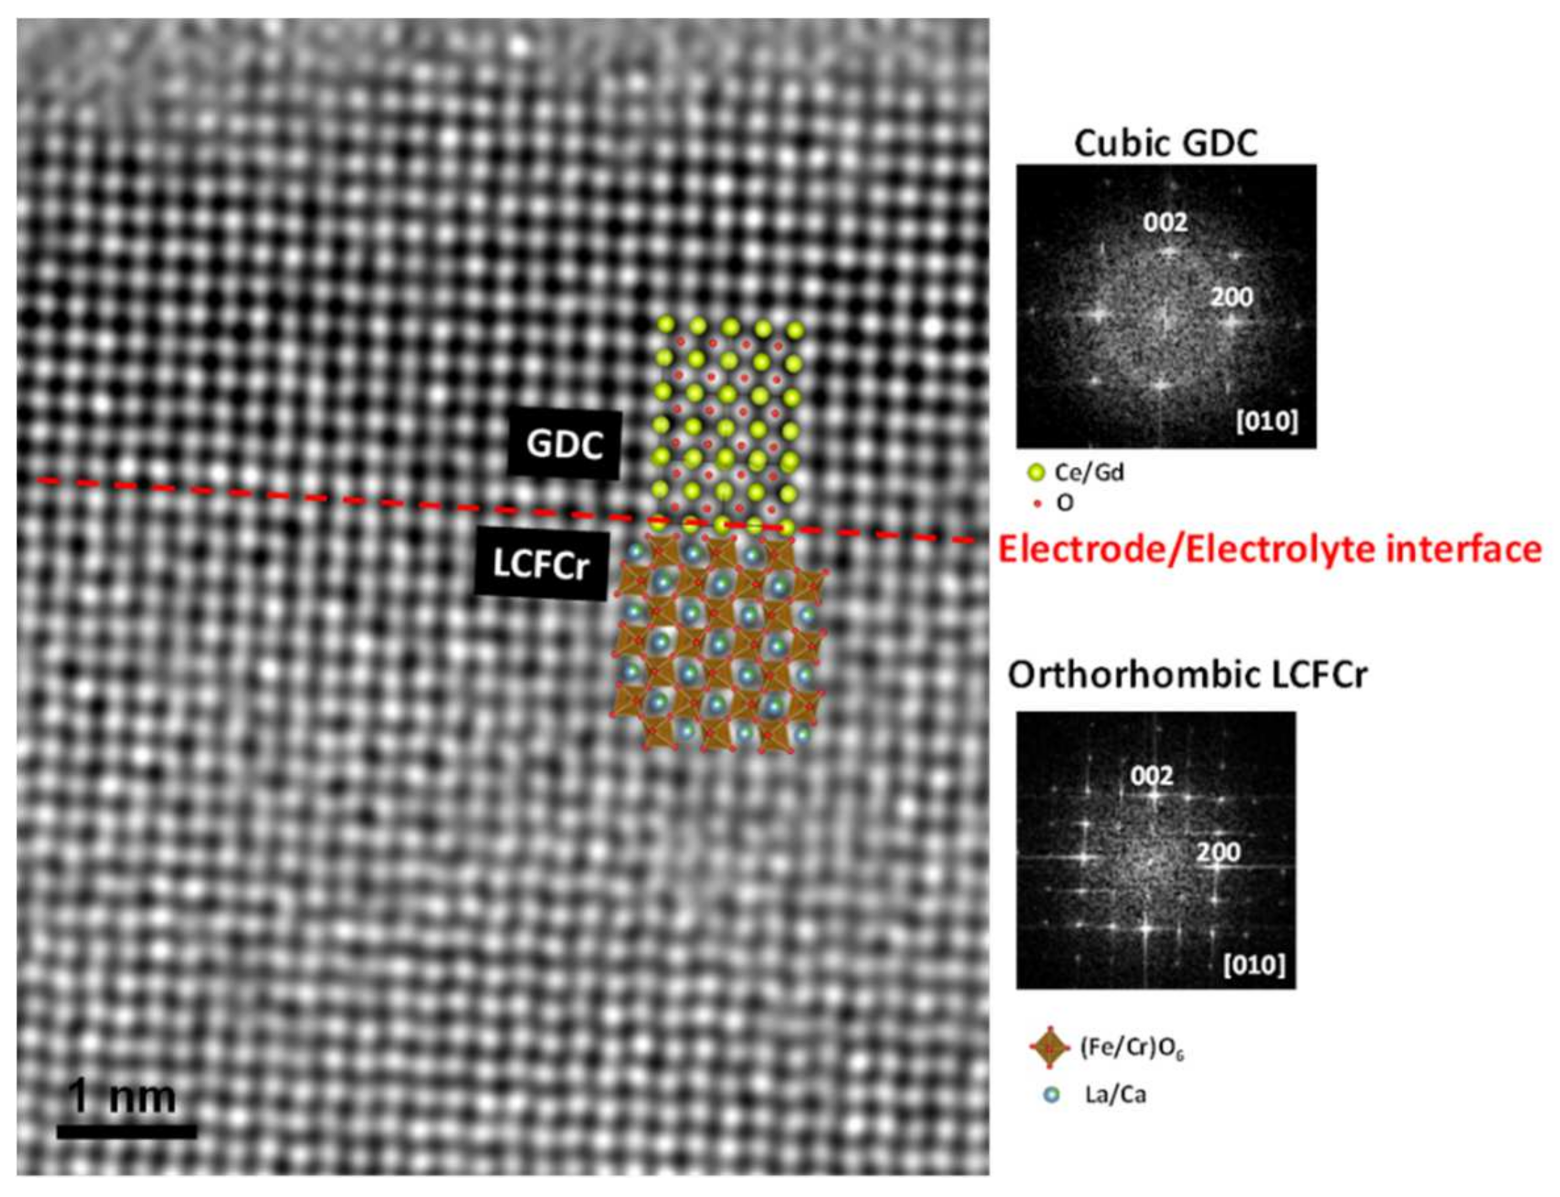
3.3.2. Transmission Electron Microscopy Examination of LCFCr/GDC Interfaces

In order to determine whether any problems developed at the LCFCr electrode/GDC electrolyte interface that could not be resolved by SEM and to help explain the loss in performance seen in Figure 4, samples were acquired from post mortem cells from locations marked by the red and blue boxes in Figure 6, and then examined by transmission electron microscopy (TEM). The LCFCr structure itself was studied first to ensure that the LCFCr crystal structure was maintained after long-term electrochemical experiments. Figure 8a shows a high-resolution high-angle annular dark-field imaging (HAADF)-scanning transmission electron microscopy (STEM) micrograph recorded along the LCFCr [010] zone axis, showing the cation framework. Since the intensity in these images is roughly proportional to the atomic number, the brightest dots correspond to the atomic columns of disordered Ca/La and the grey ones to the (Fe/Cr)O6 octahedra, showing a good match with the projected structural model superimposed on the image. This indicates that the high purity of the as-synthesized powder, seen in our earlier work [16,23,29], is maintained in the LCFCr material after 200 h of cell testing in electrolysis mode at 800 °C in air.
Electron energy loss spectroscopy (EELS) mapping was also performed for Ca, La, and Fe in the area inside the yellow square. The EELS mapping (Figure 8b) confirms that the brightest spots correspond to Ca and La and the grey ones to the (Fe,Cr)O6, also showing the disorder between Ca and La along the same atomic column. The Cr EELS map was difficult to obtain, as the signals overlapped with La. Overall, these results confirm that the structure of LCFCr is retained after electrochemical testing.
The high-resolution TEM analysis of the LCFCr/GDC interface along the common [010] zone axis between the electrode (LCFCr) and the electrolyte (GDC) is shown in Figure 9. Only a few TEM studies of SOFC/SOEC materials and cell components have been reported in the literature, mostly on Ni/YSZ [34], LSM/YSZ [35], and LSCF/GDC interfaces [36,37]. However, there is a paucity of published high-resolution TEM studies of electrode/electrolyte interfaces after long times of oxygen evolution. Importantly, an excellent quality interface is observed at the atomic level in Figure 9, with epitaxial growth through the (002) observed for both LCFCr and GDC. These images are also consistent with the fact that the high frequency resistance (LCFCr/GDC interface) was quite small and very stable (Figure 5) and that it was the low frequency resistance (LCFCr/air interface) that degraded with time. It can also be concluded from Figure 9 that there are no secondary phases forming at the electrode/electrolyte interface, also known to be a problem in SOEC degradation, as they are usually insulating in nature [38,39,40].
Overall, these imaging results (Figure 6, Figure 7, Figure 8 and Figure 9) have shown that the working electrode which was under anodic polarization consistently showed no electrode delamination after long operation time while undergoing OER. This is owing to its TEC (12 × 10−6 K−1) that is a close match to that of GDC (12 × 10−6 K−1). Thus, the observed cell degradation is more likely due to the reversible surface segregation effects consistent with the increase in the low frequency resistance that is related to the LCFCr/gas interface, or to a slow change in LCFCr surface area. As discussed in our earlier work [21,29], cation segregation to the surface could affect the ORR activity and the stability of RSOFCs. The two main reasons for the A-site cation (in this case Ca) to segregate and enrich at the catalyst/gas surface include elastic effects (cation size mismatch) and electrostatic effects (oxygen vacancies) [41]. In a parallel work, experiments are ongoing to further investigate the possibility of Ca segregation being a contribution to cell performance loss over time, specifically related to the low frequency process.

4. Conclusions

A detailed study aimed at understanding the structural, interfacial, and electrochemical performance stability of La0.3Ca0.7Fe0.7Cr0.3O3-δ (LCFCr) electrode material for application as an oxygen electrode in reversible solid oxide cells (RSOCs) was carried out. The porous microstructure of the electrode was characterized by nanoscale X-ray microscopy (XRM) to reveal the percentage porosity, pore connectivity, average pore size, and electrochemical surface area, etc. The medium-term electrochemical stability of the LCFCr oxygen electrode towards the OER was investigated in a two-electrode configuration at 800 °C for 200 h. It was shown that the largest contribution to the degradation of the cell performance was the low frequency resistance potentially due to LCFCr surface area changes or some surface segregation effects. However, this degradation was shown to reverse by running the cell at OCP for 10 h, which suggests that surface segregation under polarization could be the main cause for degradation. The TEM imaging of the LCFCr/GDC interface showed no delamination or other forms of physical degradation of the electrodes and the microprobe analysis showed no obvious inter-diffusion of elements at the LCFCr/GDC interface, also consistent with the electrochemical results.

Author Contributions

Conceptualization, H.M.A., B.M.-S. and P.K.A.; methodology, H.M.A., B.M.-S. and P.K.A.; validation, H.M.A., B.M.-S., D.A.-B. and S.K.; formal analysis, H.M.A., B.M.-S., D.A.-B. and S.K.; investigation, H.M.A., B.M.-S., D.A.-B. and S.K.; resources, B.M.-S., P.K.A., D.A.-B. and S.K., data curation, H.M.A., B.M.-S., D.A.-B. and S.K.; writing—original draft preparation, H.M.A., B.M.-S.; writing— H.M.A., B.M.-S., D.A.-B. and S.K.; project administration, B.M.-S. and P.K.A.; funding acquisition, B.M.-S. and P.K.A. All authors have read and agreed to the published version of the manuscript.

Funding

SeeO2 Energy would like to acknowledge the support from Mitacs for the concession of project IT19787 to support this work. D.A.G. would like to thank the Spanish Ministry of Science and Innovation for granting the project PID2020-112848RB-C21 by MCIN/AEI/10.13039/501100011033.

Institutional Review Board Statement

Not applicable.

Informed Consent Statement

Not applicable.

Data Availability Statement

Not applicable.

Conflicts of Interest

The authors declare that this research is sponsored by SeeO2 Energy and may lead to the development of products. We have in place an approved plan for managing any potential conflicts arising from this arrangement.

References

  1. Hauch, A.; Kungas, R.; Blennow, P.; Hansen, A.B.; Hansen, J.B.; Mathiesen, B.V.; Mogensen, M.B. Recent Advances in Solid Oxide Cell Technology for Electrolysis. Science 2020, 370, eaba6118. [Google Scholar] [CrossRef] [PubMed]
  2. Ansari, H.M.; Addo, P.K.; Mulmi, S.; Yuan, H.; Botton, G.A.; Thangadurai, V.; Birss, V.I. Deciphering the Interaction of Single-Phase La0.3Sr0.7Fe0.7Cr0.3O3-δ with CO2/CO Environments for Application in Reversible Solid Oxide Cells. ACS Appl. Mater. Interfaces 2022, 14, 13388–13399. [Google Scholar] [CrossRef] [PubMed]
  3. Pan, Z.; Liu, Q.; Yan, Z.; Jiao, Z.; Bi, L.; Chan, S.H.; Zhong, Z. On the Delamination of Air Electrodes of Solid Oxide Electrolysis Cells: A Mini-Review. Electrochem. Commun. 2022, 137, 107267. [Google Scholar] [CrossRef]
  4. Shen, M.; Ai, F.; Ma, H.; Xu, H.; Zhang, Y. Progress and Prospects of Reversible Solid Oxide Fuel Cell Materials. iScience 2021, 24, 103464. [Google Scholar] [CrossRef] [PubMed]
  5. Virkar, A.V. Mechanism of Oxygen Electrode Delamination in Solid Oxide Electrolyzer Cells. Int. J. Hydrogen Energy 2010, 35, 9527–9543. [Google Scholar] [CrossRef]
  6. Jin, X.; Cook, K.; Huang, K. Interrelationship between Extended Transport Pathways of Mixed Conducting Electrode and Delamination in Solid Oxide Electrolyzer Cells. ECS Meet. Abstr. 2021, MA2021-01, 1143. [Google Scholar] [CrossRef]
  7. Keane, M.; Mahapatra, M.K.; Verma, A.; Singh, P. LSM-YSZ Interactions and Anode Delamination in Solid Oxide Electrolysis Cells. Int. J. Hydrogen Energy 2012, 37, 16776–16785. [Google Scholar] [CrossRef]
  8. Chen, K.; Jiang, S.P. Failure Mechanism of (La,Sr)MnO3 Oxygen Electrodes of Solid Oxide Electrolysis Cells. Int. J. Hydrogen Energy 2011, 36, 10541–10549. [Google Scholar] [CrossRef]
  9. Mocooteguy, P.; Brisse, A. A Review and Comprehensive Analysis of Degradation Mechanisms of Solid Oxide Electrolysis Cells. Int. J. Hydrogen Energy 2013, 38, 15887–15902. [Google Scholar] [CrossRef]
  10. Pan, Z.; Liu, Q.; Ni, M.; Lyu, R.; Li, P.; Chan, S.H. Activation and Failure Mechanism of La0.6Sr0.4Co0.2Fe0.8O3-δ Air Electrode in Solid Oxide Electrolyzer Cells under High-Current Electrolysis. Int. J. Hydrogen Energy 2018, 43, 5437–5450. [Google Scholar] [CrossRef]
  11. Shao, Z.; Haile, S.M. A High-Performance Cathode for the Next Generation of Solid-Oxide Fuel Cells. Nature 2004, 431, 170–173. [Google Scholar] [CrossRef] [PubMed]
  12. Zhang, S.-L.; Wang, H.; Lu, M.Y.; Zhang, A.-P.; Mogni, L.V.; Liu, Q.; Li, C.-X.; Li, C.-J.; Barnett, S.A. Cobalt-Substituted SrTi0.3Fe0.7O3-δ: A Stable High-Performance Oxygen Electrode Material for Intermediate-Temperature Solid Oxide Electrochemical Cells. Energy Environ. Sci. 2018, 11, 1870–1879. [Google Scholar] [CrossRef]
  13. Chen, Y.; Yoo, S.; Choi, Y.; Kim, J.H.; Ding, Y.; Pei, K.; Murphy, R.; Zhang, Y.; Zhao, B.; Zhang, W.; et al. A Highly Active, CO2-Tolerant Electrode for the Oxygen Reduction Reaction. Energy Environ. Sci. 2018, 11, 2458–2466. [Google Scholar] [CrossRef]
  14. Wu, J.; Pramana, S.S.; Skinner, S.J.; Kilner, J.A.; Horsfield, A.P. Why Ni Is Absent from the Surface of La2NiO4+δ? J. Mater. Chem. A 2015, 3, 23760–23767. [Google Scholar] [CrossRef] [Green Version]
  15. Tong, X.; Zhou, F.; Yang, S.; Zhong, S.; Wei, M.; Liu, Y. Performance and Stability of Ruddlesden-Popper La2NiO4+δ Oxygen Electrodes under Solid Oxide Electrolysis Cell Operation Conditions. Ceram. Int. 2017, 43, 10927–10933. [Google Scholar] [CrossRef]
  16. Molero-Sanchez, B.; Prado-Gonjal, J.; Avila-Brande, D.; Chen, M.; Moran, E.; Birss, V. High Performance La0.3Ca0.7Cr0.3Fe0.7O3-δ Air Electrode for Reversible Solid Oxide Fuel Cell Applications. Int. J. Hydrogen Energy 2015, 40, 1902–1910. [Google Scholar] [CrossRef]
  17. Molero-Sanchez, B.; Addo, P.; Buyukaksoy, A.; Paulson, S.; Birss, V. Electrochemistry of La0.3Sr0.7Fe0.7Cr0.3O3-δ as an Oxygen and Fuel Electrode for RSOFCs. Faraday Discuss. 2015, 182, 159–175. [Google Scholar] [CrossRef]
  18. Chen, M.; Paulson, S.; Kan, W.H.; Thangadurai, V.; Birss, V. Surface and Bulk Study of Strontium-Rich Chromium Ferrite Oxide as a Robust Solid Oxide Fuel Cell Cathode. J. Mater. Chem. A 2015, 3, 22614–22626. [Google Scholar] [CrossRef]
  19. Addo, P.K.; Molero-Sanchez, B.; Chen, M.; Paulson, S.; Birss, V. Co/Co2 Study of High Performance La0.3Sr0.7Fe0.7Cr0.3O3-δ Reversible SOFC Electrodes. Fuel Cells 2015, 15, 689–696. [Google Scholar] [CrossRef]
  20. Addo, P.K.; Molero-Sanchez, B.; Buyukaksoy, A.; Paulson, S.; Birss, V. Sulfur Tolerance of La0.3M0.7Fe0.7Cr0.3O3-δ (M = Sr, Ca) Solid Oxide Fuel Cell Anodes. ECS Trans. 2015, 66, 219–228. [Google Scholar] [CrossRef]
  21. Molero-Sanchez, B.; Addo, P.; Buyukaksoy, A.; Birss, V. Performance Enhancement of La0.3Ca0.7Fe0.7Cr0.3O3-δ Air Electrodes by Infiltration Methods. J. Electrochem. Soc. 2017, 164, F3123–F3130. [Google Scholar] [CrossRef]
  22. Ansari, H.M.; Bass, A.S.; Ahmad, N.; Birss, V.I. Unraveling the Evolution of Exsolved Fe-Ni Alloy Nanoparticles in Ni-Doped La0.3Ca0.7Fe0.7Cr0.3O3-δ and Their Role in Enhancing CO2-CO Electrocatalysis. J. Mater. Chem. A 2022, 10, 2280–2294. [Google Scholar] [CrossRef]
  23. Molero-Sanchez, B.; Prado-Gonjal, J.; Avila-Brande, D.; Birss, V.; Moran, E. Microwave-Assisted Synthesis and Characterization of New Cathodic Material for Solid Oxide Fuel Cells: La0.3Ca0.7Fe0.7Cr0.3O3-δ. Ceram. Int. 2015, 41, 8411–8416. [Google Scholar] [CrossRef]
  24. Chen, M.; Paulson, S.; Thangadurai, V.; Birss, V. Sr-Rich Chromium Ferrites as Symmetrical Solid Oxide Fuel Cell Electrodes. J. Power Sources 2013, 236, 68–79. [Google Scholar] [CrossRef]
  25. Xiao, J.; Xu, Q.; Huang, D.-P.; Chen, M.; Zhao, K.; Kim, B.-H. Evaluation of La0.3Ca0.7Fe1-yCryO3-δ (y = 0.1 − 0.3) Cathodes for Intermediate Temperature Solid Oxide Fuel Cells. Mater. Res. Bull. 2017, 90, 104–110. [Google Scholar] [CrossRef]
  26. Tkachuk, A.; Duewer, F.; Cui, H.; Feser, M.; Wang, S.; Yun, W. X-Ray Computed Tomography in Zernike Phase Contrast Mode at 8 keV with 50-nm Resolution Using Cu Rotating Anode X-Ray Source. Z. Fur Krist.-Cryst. Mater. 2007, 222, 650–655. [Google Scholar] [CrossRef]
  27. Merkle, A.P.; Gelb, J.D. The Ascent of 3D X-Ray Microscopy in the Laboratory. Microsc. Today 2013, 21, 10–15. [Google Scholar] [CrossRef] [Green Version]
  28. Fang, X.; Zhu, J.; Lin, Z. Effects of Electrode Composition and Thickness on the Mechanical Performance of a Solid Oxide Fuel Cell. Energies 2018, 11, 1735. [Google Scholar] [CrossRef] [Green Version]
  29. Molero-Sanchez, B. Development of Oxygen Electrodes for Reversible Solid Oxide Fuel Cells. Ph.D. Thesis, University of Calgary, Calgary, AB, Canada, 2017. [Google Scholar]
  30. Sharma, V.I.; Yildiz, B. Degradation Mechanism in La0.8Sr0.2CoO3 as Contact Layer on the Solid Oxide Electrolysis Cell Anode. J. Electrochem. Soc. 2010, 157, B441. [Google Scholar] [CrossRef]
  31. Mawdsley, J.R.; David Carter, J.; Jeremy Kropf, A.; Yildiz, B.; Maroni, V.A. Post-Test Evaluation of Oxygen Electrodes from Solid Oxide Electrolysis Stacks. Int. J. Hydrogen Energy 2009, 34, 4198–4207. [Google Scholar] [CrossRef]
  32. Addo, P.K. Development of Fuel Electrodes for Reversible Solid Oxide Fuel Cell Applications. Ph.D. Thesis, University of Calgary, Calgary, AB, Canada, 2017. [Google Scholar]
  33. Hjalmarsson, P.; Sogaard, M.; Mogensen, M. Electrochemical Behaviour of (La1-xSrx)Co1-yNiyO3 as Porous SOFC Cathodes. Solid State Ion. 2009, 180, 1395–1405. [Google Scholar] [CrossRef]
  34. Liu, S.-S.; Jiao, Z.; Shikazono, N.; Matsumura, S.; Koyama, M. Observation of the Ni/YSZ Interface in a Conventional SOFC. J. Electrochem. Soc. 2015, 162, F750–F754. [Google Scholar] [CrossRef]
  35. Baque, L.C.; Jorgensen, P.S.; Zhang, W.; Hansen, K.V.; Sogaard, M. Effect of Aging on the Electrochemical Performance of LSM-YSZ Cathodes. J. Electrochem. Soc. 2015, 162, F971–F981. [Google Scholar] [CrossRef] [Green Version]
  36. Soldati, A.L.; Baque, L.; Troiani, H.; Cotaro, C.; Schreiber, A.; Caneiro, A.; Serquis, A. High Resolution FIB-TEM and FIB-SEM Characterization of Electrode/Electrolyte Interfaces in Solid Oxide Fuel Cells Materials. Int. J. Hydrogen Energy 2011, 36, 9180–9188. [Google Scholar] [CrossRef]
  37. Baque, L.; Padmasree, K.P.; Ceniceros Reyes, M.A.; Troiani, H.; Serquis, A.; Soldati, A. Improved Sr0.6La0.4Co0.8Fe0.2O3-δ/Ce0.8Y0.2O2-δ Interface for IT-SOFC Applications. Int. J. Hydrogen Energy 2016, 41, 1958–1965. [Google Scholar] [CrossRef]
  38. Kindermann, L.; Das, D.; Nickel, H.; Hilpert, K. Chemical Compatibility of the Lafeo3 Base Perovskites (La0.6Sr0.4)zFe0.8M0.2O3-δ (z = 1, 0.9; M = Cr, Mn, Co, Ni) with Yttria Stabilized Zirconia. Solid State Ion. 1996, 89, 215–220. [Google Scholar] [CrossRef]
  39. Kindermann, L.; Das, D.; Bahadur, D.; Wei, R.; Nickel, H.; Hilpert, K. Chemical Interactions between La-Sr-Mn-Fe-O-Based Perovskites and Yttria-Stabilized Zirconia. J. Amer. Ceram. Soc. 1997, 80, 909–914. [Google Scholar] [CrossRef]
  40. Kinderann, L.; Das, D.; Nickel, H.; Hilpert, K.; Appel, C.C.; Poulson, F.W. Chemical Compatibility of (La0.6Ca0.4)x Fe0.8Mn0.2O3 with Yttria-Stabilized Zirconia. J. Electrochem. Soc. 1997, 144, 717–720. [Google Scholar] [CrossRef]
  41. Lee, W.; Han, J.W.; Chen, Y.; Cai, Z.; Yildiz, B. Cation Size Mismatch and Charge Interactions Drive Dopant Segregation at the Surfaces of Manganite Perovskites. J. Amer. Chem. Soc. 2013, 135, 7909–7925. [Google Scholar] [CrossRef]
Figure 1. Sample preparation method used to examine the electrode/electrolyte interface by HRTEM.
Crystals 12 00847 g001
Figure 2. Back-scattered electron (BSE) images of (a) LCFCr electrode layer and (b) the cross-section of a LCFCr/GDC interface of an as-prepared cell.
Crystals 12 00847 g002
Figure 3. (a) Back-scattered electron (BSE) and (b) Ultra 3D X-ray microscopy (XRM) images of the cross-section of a LCFCr/GDC interface of an as-prepared cell. (c) Porosity visualization of the 32 nm/voxel Ultra 3D XRM image where the LCFCr phase is shown in grey, the connected porosity in blue, and the unconnected porosity in orange. (d) Visualization of the interfacial contact area (orange) between the LCFCr and GDC phases as determined by the Ultra 3D XRM image.
Crystals 12 00847 g003
Figure 4. (a) Current passed through symmetrical LCFCr/GDC/LCFCr cell at 800 °C in air at a cell voltage of 0.65 V for 100 h in comparison with 100 h at a cell voltage of 0.2 V in a 2-electrode symmetrical-cell configuration. OCP Nyquist plots after 3, 10, 24, 36, 48, and 100 h of polarization at cell voltages of (b) 0.2 V and (c) 0.65 V, and (d) Nyquist and CV (inset) plots after 10 h at the OCP, showing almost complete cell recovery.
Crystals 12 00847 g004
Figure 5. Total polarization (Rp), ohmic (Rs), high frequency (RHF), and low frequency (RLF) resistance trends of a symmetrical LCFCr/GDC/LCFCr cell as a function of time in air at 800 °C.
Crystals 12 00847 g005
Figure 6. Back-scattered electron (BSE) image of the cross-section of the (LCFCr)/GDC interface subjected to anodic polarization after 200 h of cell testing at the open circuit potential, and then at cell potentials of 0.2 and 0.65 V all at 800 °C in air. The red and the blue boxes are used to mark the locations on the cell cross-section where the samples for TEM analysis were acquired.
Crystals 12 00847 g006
Figure 7. BSE images and element maps for Ce, La, Ca, Cr and Fe at the LCFCr/GDC interface after the electrochemical testing of an LCFCr WE at an overpotential of 0.2 and 0.65 V for 100 h each in air at 800 °C.
Crystals 12 00847 g007
Figure 8. (a) Experimental HAADF-STEM image of a crystal of LCFCr along the [010] zone axis and (b) the EELS maps of the yellow area of Ca atoms indicated in brown, La atoms in orange, and Fe atoms in green.
Crystals 12 00847 g008
Figure 9. HRTEM image of the electrode (LCFCr)/electrolyte (GDC) interface in a 2-electrode LCFCr-based cell after long-term electrochemical testing for 200 h. On the right side, the optical diffraction patterns, obtained from both sides of the interface, are identified as cubic GDC and orthorhombic LCFCr.
Crystals 12 00847 g009
Table 1. Microstructural parameters of the as-prepared LCFCr electrode before electrochemical testing.
LCFCr
(%)
Connected Porosity (%)Isolated Porosity (%)Interfacial Contact Area (µm2)Surface Area
(µm2)
Average Pore Size (µm)
51.2148.660.131703809.930.65
Publisher’s Note: MDPI stays neutral with regard to jurisdictional claims in published maps and institutional affiliations.

